1
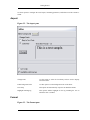
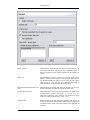
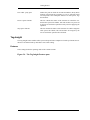
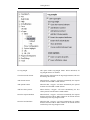
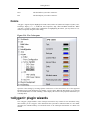
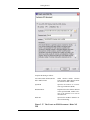
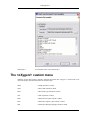
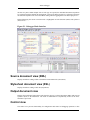
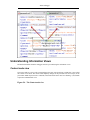
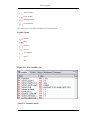
Chapter 5. XSLT Debugger
Overview
The <oXygen/> plugin adds two perspectives into Eclipse. The first is the standard editing perspective
that provides general features and functions for the development of XML documents and other programming languages. The second is the Debugger perspective. The Debugger perspective is started by clicking the <oXygen/> XSLT Debugger button located on the perspective toolbar or selecting the
<oXygen/> XSLT Debugger from Window->Open Perspective->Other. To switch back to Editor perspective simply click the <oXygen/> XML button that is adjacent to the <oXygen/> XSLT Debugger
button on the perspective toolbar or select <oXygen/> XML from Window->Open Perspective->Other.
Users can toggle between Debugger and Editor modes as required by clicking either buttons.
This chapter explains the Debugger mode functionality, which provides a rich set of features for development, testing and solving of XSL problems, including:
•
Support for Saxon and Xalan XSLT engines.
•
Stepping capabilities: step in, step over, step out, run, run to cursor, run to end, pause, stop.
•
Back mapping between every piece of output and style element /source context who generate it .
•
Breakpoints on both source and style documents.
•
Call stack view on both source and style documents.
•
Trace history on both source and style documents.
•
Support for XPath expression evaluation during debugging.
•
Step into imported/included stylesheets as well as included source entities.
•
Available templates and hits count.
•
Variables view.
•
Dynamic output generation.
Layout
An example of what the Debugger interface might look like is shown below. This interface is comprised
of four panes as follows:
1.
Source document view (XML)
2.
Stylesheet document view (XSL)
3.
Output View
4.
Control view
XML documents and XSL stylesheets that are opened in Editor perspective are automatically sorted into
46