1
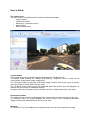
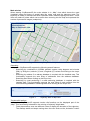
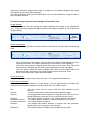
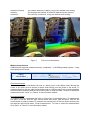
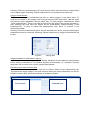
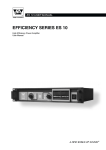
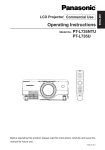
InfoCity3D
User’s Manual
Copyright Konasoft Project Tanácsadó Kft.
November, 2011
All contents in this document are copyrighted by Konasoft. All rights reserved.
The information contained herein may not be used, accessed, copied, stored,
displayed, sold, modified, published, or distributed, or otherwise reproduced
without express written consent for Konasoft.
LEGAL NOTICES
About Konasoft’s InfoCity3D
Thank you for purchasing Konasoft’s InfoCity3D solution which is an easy to use software
application to display and analyse mobile mapping datasets. Konasoft’s InfoCity3D enables
users to navigate in the trajectory area, display panoramic images, coordinate point cloud
and other layers of spatial data. It supports different kind of measurements and adding
attributes to objects with a possibility to export datasets.
Terms and Conditions
This manual has been prepared to assist you with the use of this product, its use is subject to
these Terms and Conditions and those more fully set forth in the User’s Manual.
Usage and Safety
The InfoCity3D solution is designed for use by non-professionals, always use safety
precautions when operating this; moreover the user should have a certain level of knowledge
of the safe use of the Product and implement the types of safety procedures recommended
by the local government protection agency for both private use and commercial job sites.
Improper use of the Software can lead to malfunction of the product.
Copyrights
All information contained in this Manual is the intellectual property of, and copyrighted
material of Konasoft. All rights are reserved. You may not use, access, copy, store, display,
create, derivative works of, sell, modify, publish, distribute, or allow any third party access to,
any graphics, content information or data in this Manual without Konasoft’s express written
consent and may only use such information for the care and operation of your Product. The
information and data in this Manual are a valuable asset of Konasoft and are developed by
the expenditure of considerable work, time and money, and are the result of original
selection, coordination and arrangement by Konasoft.
Trademarks
InfoCity3D, CityBrowser3D and Konasoft are registered trademarks of Konasoft Project
Tanácadó Kft.
Other product and company names mentioned herein may be trademarks of their respective
owners.
Disclaimer and Warranty
EXPECT FOR SUCH WARRANTIES AND LICENSES PROVIDED WITH THE PRODUCT, THIS MANUAL
AND THE PRODUCT ARE PROVIDED “AS-IS”. KONASOFT SHALL NOT BE LIABLE FOR TECHNICAL
OR EDITORIAL ERRORS OR OMISSIONS CONTAINED HEREIN; NON FOR INCIDENTAL OR
CONSEQUENTIAL DAMAGES RESULTING FROM THE FURNISHING, PERFORMANCE OR USE OF
THIS MATERIAL OR THE PRODUCT.
Please see the User’s Manual for detailed information on warranties and the license
agreement which may apply to the product.
No statement contained at the Konasoft website (or any other website) or in any other
advertisements or Konasoft literature or made by an employee or independent contractor or
Konasoft modifies these Terms and Conditions (including the Software license, warranty and
limitation of liability).
License Agreement
Use of any computer programs or software supplied by Konasoft or downloaded from
Konasoft’s website In connection with the product implies acceptance of Terms and
Conditions here and in the User’s Manual. The user is granted a personal, non-exclusive,
non-transferable license to use such Software under the terms stated herein and in any case
only with a single computer. You may not assign or transfer the Software or this license
without the express written consent of Konasoft. This license is effectively until terminated.
You may terminate the license at any time by destroying the Software and Manual. Konasoft
may terminate the license if you fail to comply with any of the Terms or Conditions. You
agree to destroy the Software and Manual upon terminated of your use of the Software. All
ownership, copyright and other intellectual property rights in and to the Software belong to
Konasoft. If these license terms are not acceptable, return any unused Software and manual.
Confidentiality
This Manual, its contents and the Software (collectively, the “Confidential Information”) are
the confidential proprietary information of Konasoft. You agree to treat Konasoft’s
Confidential Information with a degree of care no less stringent than the degree of care you
would use in safeguarding your own most valuable trade secrets. Nothing in this paragraph
shall restrict you from disclosing Confidential Information to your employees as may be
necessary or appropriate to operate or care for the Software. Such employees must also
keep the Confidential Information confidential. In the event you become legally compelled to
disclose any of the Confidential Information, you shall give Konasoft immediate notice so that
is may seek a protective order or other appropriate remedy.
Miscellaneous
The above Terms and Conditions may be amended, modified, or canceled, at any time by
Konasoft. The above Terms and Conditions will be governed by, and construed in
accordance with, the laws of Hungary, without reference to conflict of laws.
DATA COLLECTING WITH MOBILE MAPPING TECHNOLOGY
Mobile mapping is a complex solution which applies widely used surveying technologies. It
combines real time localization, 3D laser scanning and the digital imaging of the trajectory.
This automated surveying method is the most productive solution which can work with a
speed of a car while digitally documenting the surrounding of the trajectory area in a 40
meter radius distance. The 3D digital documentation collects georeferenced panoramic
images and coordinate point cloud made by laser scanners.
During mobile mapping the system is localizing its position according to GNSS satellites
(GPS and GLONASS as well). The localization is corrected with the data from the inertial and
heading measurement devices, and during post processing with the data of a land based
reference station. Combining the millimeter accuracy localization data and the 3D point cloud
- collected by the laser scanners - each point of the point cloud becomes a single and
precise geodetic coordinate of the surrounding area from the trajectory.
The mass data collection is followed by a unique automated post processing which supports
land based reference station data correction, automated data cleaning and accuracy
improvement using geodetic control points. Data cleaning and control point registration both
improves the data consistency and accuracy (in horizontal and in vertical meaning as well).
The data collection is timestamp supported thus the produced panoramic images and the
coordinate point cloudh have very high data parity. They are layers of a 3D map, which
precisely displays the trajectory area in 3D. Any object (i.e.: points, lines, polygons) in the
panoramic images can be measured (using the point cloud) with high accuracy and in
accordance with this their position, coordinates, length, area, perimeter can be easily
appointed.
The absolute accuracy of mobile mapping technology is centimeter precise which is certified
by several tests using geodetic control points. Absolute accuracy may vary due to the berth
and visibility of GNSS satellites, in highly built urban areas this can result +/- 50 centimeter
accuracy.
Mobile mapping provides a very high level of relative accuracy which can be even used for
road diagnostics or highway side pitch measurement (which results geodetic accuracy with
the data collecting speed of 80 km/h).
The high level of relative accuracy is a strong ground to improve the absolute accuracy using
the control point registration in the trajectory area. This method recalculates the location of
certain points which redefines the projection of the whole dataset and eventually improves
the absolute accuracy.
The data collection runs in World Geodetic System (WGS84) and the transformation to any
national projection system can be done when the transformation method is known.
Mobile mapping is the most productive data collecting technology of road side spatial data.
The technology provides high density, high accuracy spatial data at a very reasonable price
with the best price-value ratio.
The Infocity3D solution
The amount of mobile mapped data is huge and unstructured therefore it makes impossible
to display and analyse captured datasets with traditional GIS applications.
The Infocity3D solution is designed and developed by Konasoft with a goal to create an easy
to use, cost effective software application to display and analyse mobile mapped data.
Konasoft’s InfoCity3D enables users to navigate in the trajectory area, display panoramic
images, coordinate point cloud and other layers of spatial data. It supports different kind of
measurements and adding attributes to objects with a possibility to export datasets or create
data exchange with another software applications.
InfoCity3D is an ideal solution for mobile mapped data which can be deployed as standalone
application or even as an integrated part of one complex enterprise GIS platform.
General data management
The InfoCity3D project is a complete solution which is ideal for enterprise class data
management. InfoCity3D is based on server-client architecture which is unique in the area of
mobile mapping data handling. Panoramic images, coordinate point cloud and meta data are
stored on a centralized server infrastructure which serves the requested data for the clients.
The centralized data storing of InfoCity3D supports Active Directory based client
authorization, full control over the client applications and logging of client activities. User
activities and measurements are logged and saved on the centralized server infrastructure
therefore exports and reports can be managed centrally.
Spatial data and layers
InfoCity3D supports the display and use of spatial data layers like raster maps, vector maps
and address databases. Different kind of raster maps (i.e.: OpenStreetMap, etc.) are stored
and displayed locally in the CityBrowser3D client (CityBrowser3D is the client solution of the
InfoCity3D project).
Road sectioning and address databases can be also coupled with the solution which
supports auto fill searching in addresses. InfoCity3D supports searching by coordinates in
WGS84 geodetic system or in any local projection when the transformation is known and
implemented.
The customer’s system administrator controls the usage of raster maps and is able to
centrally define the usage of map configurations.
User interface
CityBrowser3D provides a user friendly, easy to use graphical user interface with a ribbon
based menu and toolbar (introduced by Microsoft Office 2007) which consolidates different
functionalities in logical groups with graphical representation of commands. This functionality
brings a better overview of functionalities, easier usage of the application for the users and
eventually better productivity for the enterprise.
The user interface includes tool windows (i.e.: 2D map, panoramic image, information
window, measurements, minimap, etc.) which can be minimized and maximized or put on an
external monitor - connected to the pc or laptop.
Features
InfoCity3D supports the complete display and analisys of mobile mapping datasets.
CityBrowser3D displays the trajectory and panoramic image center points on the 2D map
window.
Based on the captured altitudinal data CityBrowser3D displays the relief model of the
trajectory area on the 2D map.
Panoramic images can be displayed, navigation and zooming is supported within the images.
When navigating in a panoramic image the orientation map is showing the view of the user.
In the panoramic view high parity (scanned) coordinate point cloud can be loaded which can
be colorised (by distance, height, etc.) and visualization can be presented by the intensity of
reflection in order to help the proper orientation of users.
Thanks to the high parity of panoramic images and coordinate point cloud the measurements
of points, lines and polygons can be carried out on screen without any GIS knowledge of the
users.
Beside the basic measurement coordinates CityBrowser3D displays the total, the horizontal
and the vertical distance of points when measuring a line.
Beside the basic measurement coordinates CityBrowser3D displays the top and bottom
coordinates align with the area and perimeter when measuring a polygon.
CityBrowser3D supports the adding of attributes to measurement objects. Complexity of
attributes may vary and can be very complex due to their types and hierarchy (i.e.: checkbox,
text box, drop-down list or combo box). Hierarchy of attributes can be also supported with
images, icons.
Attribute hierarchy can be configured locally by the system administrator as CityBrowser3D
supports the update of labels (with almost any hierarchy) by using common configuration
files.
Data exchange
The InfoCity3D solution supports the export of user data and the creation of standard data
exchange with another software application.
The centralized server infrastructure stores the user’s data therefore exports and reports can
be flexibly generated manually or scheduled automatically.
Reports can be generated by filtering the time, the users and type of user activities.
Based on the Microsoft .NET development framework standard data exchange services can
be set up with different enterprise software applications (i.e.: using web services).
Thanks to the multi layered application design of InfoCity3D solution (i.e.: communication,
display, business logic layer) selected functionalities can be integrated into other GIS
systems as well.
User’s Guide
The main screen
The main screen of CityBrowser3D contains the following toolbars:
- Layers toolbar,
- Information toolbar,
- Minimap (in „Panoramic view”),
- Main window,
- Ribbon based menu.
Figure 1.
CitiyBrowser3D
Layers toolbar
Layers toolbar groups the spatial data layers displayed in CityBrowser3D.
The „Maps” folder contians the „Raster map” and the „Trajectory” which is made off the
center points of panoramic image (roadpoints).
The „3D layers” folder contains the „Panoramic image” and the „Point cloud” layer (in bracket
with the number of points loaded into the view).
The „Custome layers” folder groups the measured object like points, lines and polygons (in
bracket with the number of measured objects).
Using the check box the layers can be turned on and off - independently from each other.
Information toolbar
The toolbar shows the name of displayed raster map and the current zoom level of the map.
In „Panoramic view” the system displays the center position of the displayed panoramic
image and the North-based azimuth of the current view.
Minimap
In „Panoramic view” this displays the orientation and zoom leve of the panoramic image.
Main window
When starting CityBrowser3D the main window is in „Map” view which shows the used
(installed) maps and layers of spatial data like raster map and the trajectory area. The
trajectory is made of colored lines which represent where mobile mapping was done. These
lines are made off points which can be seen when zooming into the map and represent the
centers of panoramic images (roadpoints).
View selector of
Map or Panoramic view
Figure 2.
Trajectory area in Map view
Searching
In Map view CityBrowser3D supports the following search features.
- Searching by coordinates in WGS84 geodetic system using degrees and minutes
(DM), by filling the „Latitude (Y)” and „Longitude (X)” values and clicking on the loupe
icon.
- Searching by address if an adress database is coupled with the installed map. This
functionality supports the auto filling of addresses from the address database.
Searching stars when clicking on the loupe icon.
- Searching by road sectioning if a road sectioning database is coupled with the
installed map. This functionality supports the auto filling of road sections from the
road sectioning database. Searching stars when clicking on the loupe icon.
Figure 3.
Trajectory area in Map view
Terrain relief analisys
In Map view CityBrowser3D supports terrain relief analisys on the displayed part of the
„Map”. This functionality is based on the coloring of trajectory height data.
- Flood plan analisys uses two different colors to display the elevation of the trajectory.
The analisys starts and stops running when the user clicks on the „Animation” button
-
-
at right of the color scale. The animation runs on the main map where it changes the
trajectory’s color. In the meantime a dynamic color scale is also shonw on the main
map which shows the elevation of the flood during the animation.
Colors can be changed by the user clicking on the color squares (at both sides) of the
height scale. The color changing functionality uses a current „Color dialog” tool
window.
Disater analisys with „Multicolor with interval” uses the whole color spectrum to
display the elevation of the trajectory. The analisys starts and stops running when the
user clicks on the „Animation” button at right of the color scale. The animation runs on
the main map where it changes the trajectory’s color. In the meantime a dynamic
color scale is also shonw on the main map which shows the elevation of the flood
during the animation.
Disater analisys with „2 color with interval” uses two colors to display the elevation of
the trajectory. The analisys starts and stops running when the user clicks on the
„Animation” button at right of the color scale. The animation runs on the main map
where it changes the trajectory’s color. In the meantime a dynamic color scale is also
shonw on the main map which shows the elevation of the flood during the animation.
Colors can be changed by the user clicking on the color squares (at both sides) of the
height scale. The color changing functionality uses a current „Color dialog” tool
window.
Panoramic view
By double clicking on a roadpint CityBrowser3D opens the panoramic image.
View selector of
Map or Panoramic view
Map view zooming
and roadpoint
Figure 4.
Trajectory area in Map view
The user can revolve, zoom in and zoom out in the image with the mouse or revolve using
the „Up”, „Down”, „Left”, „Right” keys of the keyboard. Using page up and page down buttons
(„PgUp” or „PgDn”) CityBrowser3D moves the next or the previous panoramic image of the
sequence. (Panoramic images were made in a sequence, the distance between the images
was defined at the time of data capturing.)
The change between Map view and Panoramic view can be swithced by using the tabs on
top of the Main window.
Panoramic image and point cloud settings in Panoramic view
Image settings
In „Panoramic view” user can change the image brightness by clicking on the „Brightness”
icon. This functionaliy changes the darker parts of the image to brighter (it is also known as
fill light editing).
Image
brightness
Figure 5.
Ribbon menu (image brightness)
Point cloud settings
CitiBrowser3D can download the relevant 3D point cloud set by using the point cloud settings
tools.
Figure 6.
-
Ribbon menu (point cloud settings)
Using „Road track mode request” user can define the width of downloaded point clout
on the provide scale. The width is according to the centerline of the trajectory.
„Auto point cloud request” loads the point cloud only in the cursor’s area. The cursor
movements are followed with the point cloud loading (like moving a spotlight)
„Show all points” loads the whole available point cloud of the viewed area of the
panoramic image. Revolving in the image loads the point cloud of all views.
Using „Clear point cloud” clears all points loaded.
Point cloud sizing
The points’ size in the point cloud can be set from 1 to 5 using the provided sizer.
Point cloud visualization
In order to help the visualization of point cloud it can be represented by several color
methods which can be selected from the drop down list of the Ribbon menu.
Flat:
Uses the same color for every point that was collected by the
sensors.
Normal:
The point cloud data is colorized from the collected images.
Surface:
This displays the surface irregularity, using the color scale for ±10 cm
height differences (from blue to red, outside the scale is grey).
Elevation
The relative heights of objects, using system defined color scaling.
Elevation (manual)
The relative heights of objects, using user defined color scaling.
Elevation (manual 2) The relative heights of objects.
Distance
This displays the relative distance of objects from the panoramic
image center point, using the color spectrum.
Distance 2
The relative distance of objects with doubled density scale.
Distance (manual)
Intensity
Intensity 2
The relative distance of objects, using user defined color scaling.
This displays the intensity of reflection detected by the sensors.
The intensity of reflection, using user defined color scaling.
„Auto point cloud request” flat colorized
Figure 7.
”Show all points” colorized by distance
Point cloud visualisation
Measurement features
CitiBrowser3D supports measurements by coordinates - in WGS84 geodetic system - using
the displayed point cloud.
Object
measurement
Figure 8.
Ribbon menu (object measurement)
Point measurement
To measure a point’s coordinate first click on „Add a point” in the ribbon menu. Moving the
cursor in the point cloud a square is shown and moving over the points of the cloud. To
measure the point click the right mouse button and an „Add this point” pop up dialog appears
which should be selected with the left mouse button to keep the data. To save or cancel the
measurement click „Save” or „Cancel” in the information toolbar.
Line measurement
To measure a line’s coordinates first click on „Add a line” in the ribbon menu. To measure the
first point of the line click the right mouse button and select „Add this point” with the left
mouse button to keep the data. To measure the second point of the line select another point
and with the right mouse select „Finish measurement”. To save or cancel the measurement
click „Save” or „Cancel” in the information toolbar.
Selecting ”Remove measurement point” the first point will be removed and line measurement
can be startet again. Selecting ”Cancel measurement” line measurement will be quit.
Polygon measurement
To measure a polygons’s coordinates first click on „Add a polygon” in the ribbon menu. To
measure the points of the polygon click the right mouse button and select „Add this point”
and continue point registration with the same way. To finish polygon measurement select
„Finish measurement”. There is no need to return to the first point of the poygon because i.e.:
after selecting the third point the square will be automatically closed selecting „Finish
measurement”). To save or cancel the measurement click „Save” or „Cancel” in the
information toolbar.
Selecting ”Remove measurement point” the last selected point will be removed and polygon
measurement can be continued. Selecting ”Cancel measurement” polygon measurement will
be quit.
Figure 9.
Saving data
Adding attributes to measurement objects
Attributes can be added to any measured objects. Attributes must be added to measurement
before saving measurement. The attribute structure and hierarchy (i.e.: checkbox, text box,
drop-down list or combo box) is set by system administrator.
Exporting saved measurement data
To export saved measurement data click ont he „Export” button of the measurement tab.
This opens the export toolbar in the main window where the export parameters can be set,
based on users’s data, time frame and type of measured objects.
List of users
Selected user
Time frame selector
Type of
measured
object
Export button
Figure 10.
Export window