1
SPARC
SH Series Simulator/Debugger
User’s Manual
When using this document, keep the following in mind:
1. This document may, wholly or partially, be subject to change without notice.
2. All rights are reserved: No one is permitted to reproduce or duplicate, in any form, the whole or part of this document
without Hitachi’s permission.
3. Hitachi will not be held responsible for any damage to the user that may result from accidents or any other reasons
during operation of the user’s unit according to this document.
4. Circuitry and other examples described herein are meant merely to indicate the characteristics and performance of
Hitachi’s semiconductor prodocuts. Hitachi assumes no responsibility for any intellectual property claims or other
problems that may result from applications based on the examples described herein.
5. No license is granted by implication or otherwise under any patents or other rights of any third party or Hitachi, Ltd.
6. MEDICAL APPLICATIONS: Hitachi’s products are not authorized for use in MEDICAL APPLICATIONS without the
written consent of the appropriate officer of Hitachi’s sales company. Such use includes, but is not limited to, use in life
support systems. Buyers of Hitachi’s products are requested to notify the relevant Hitachi sales offices when planning
to use the products in MEDICAL APPLICATIONS.
Preface
The SPARCstation*1 SH Series Simulator/Debugger (referred to in this manual as the
simulator/debugger) is a software tool that simulates execution of programs for the SH series of
single-chip 32-bit microcomputers on the SunOS*2 to support program development and
debugging.
This manual gives a general description of the functions and usage of the simulator/debugger.
Related information concerning the SH-series microcomputers and their C compiler, assembler,
linkage editor, and librarian can be found in the following manuals.
•
SH7032, SH7034 Hardware Manual
•
SH Series C Compiler User’s Manual
•
SH Series Cross Assembler User’s Manual
•
SH Series Linkage Editor User’s Manual
•
SH Series Librarian User’s Manual
Notes: 1. SPARCstation is a registered trademark of SPARC International Inc. It is developed by
the Sun Microsystems Corp.
2. SunOS is a trademark of Sun Microsystems Corp.
Notation
The following notational conventions are used in this manual.
1.
{A|B} means that either A or B must be selected, but not both.
2.
[A] means that A may be omitted.
3.
Information to be keyed in by the user is underlined.
4.
<CTRL> + <\> means to press the back slash (\) key while pressing the control key.
5.
<CTRL> + <C> means to press the C key while pressing the control key.
6.
(RET) indicates the return key.
7.
(LF) indicates the line-feed key.
8.
A triangle (∆) indicates one or more spaces or tabs.
9.
Hexadecimal values are preceded by H'. (Example: H'F81A)
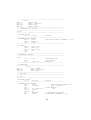
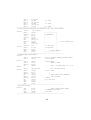
Contents
Part I Simulator/Debugger
Section 1
1.1
1.2
1.3
Features...........................................................................................................................
Debugging Object Programs...........................................................................................
Simulation Range............................................................................................................
Section 2
2.1
2.2
2.3
2.4
2.5
2.6
2.7
2.8
2.9
2.10
2.11
2.12
2.13
2.14
2.15
2.16
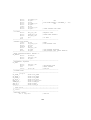
Simulator/Debugger Functions ......................................................
Environment Specification..............................................................................................
Simulator/Debugger Memory Management ...................................................................
Loading Debugging Object Programs ............................................................................
Setting Register Initial Values, Displaying and Changing Register Values....................
Displaying the Memory Map, and Allocating, Displaying,
Changing, and Releasing Memory .................................................................................
Execution and Trace .......................................................................................................
Exception Processing......................................................................................................
Standard I/O and File I/O Processing .............................................................................
Saving and Restoring the Simulation Status...................................................................
C Source Level Debugging.............................................................................................
Break Conditions ............................................................................................................
Memory Manipulation ....................................................................................................
Macro (Command Combination)....................................................................................
Command Chains and Saving Execution Results to a File.............................................
Saving Input Commands to a File ..................................................................................
Test Functions .................................................................................................................
2.16.1 Stub Function......................................................................................................
2.16.2 Coverage Measurement ......................................................................................
Section 3
3.1
3.2
3.3
Overview........................................................................................
3
3
4
5
7
7
7
9
11
12
14
15
17
17
18
20
24
24
25
26
26
26
26
Using the Simulator/Debugger ...................................................... 29
Sample Program Description..........................................................................................
Procedure for Creating the Debugging Object Program.................................................
Simulator/Debugger Usage Example..............................................................................
3.3.1 Creating the CPU Information File.....................................................................
3.3.2 Loading the Program ..........................................................................................
3.3.3 Memory Map Display and Memory Allocation .................................................
3.3.4 Displaying Section Load Address and Allocating Memory Areas.....................
3.3.5 Disassembly Display ..........................................................................................
3.3.6 Checking Memory Contents ...............................................................................
3.3.7 System Call Start Address ..................................................................................
29
30
31
31
32
33
34
35
35
36
3.3.8
3.3.9
3.3.10
3.3.11
3.3.12
3.3.13
3.3.14
3.3.15
3.3.16
3.3.17
3.3.18
3.3.19
Section 4
4.1
4.2
4.3
4.4
5.3
5.4
5.5
5.6
5.7
5.8
36
37
37
37
39
40
41
41
42
42
43
44
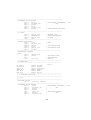
Simulator/Debugger Invocation and Command Input ................... 47
Invoking the Simulator/Debugger...................................................................................
Exiting the Simulator/Debugger .....................................................................................
Simulator/Debugger Commands.....................................................................................
Specifying Command Parameters...................................................................................
4.4.1 Expressions .........................................................................................................
4.4.2 Locations.............................................................................................................
4.4.3 Data.....................................................................................................................
4.4.4 Floating Point Data .............................................................................................
4.4.5 Character Strings ................................................................................................
4.4.6 File Names ..........................................................................................................
4.4.7 Comment Lines...................................................................................................
4.4.8 Limitations on C Expressions.............................................................................
Section 5
5.1
5.2
Setting and Checking Breakpoints......................................................................
Starting a Trace...................................................................................................
Program Execution .............................................................................................
Single Step Execution.........................................................................................
Single Subroutine Execution ..............................................................................
Trace Buffer Display...........................................................................................
Symbol Display ..................................................................................................
Automatic Command Execution during Simulation...........................................
Coverage Range Display ....................................................................................
Starting Coverage Data Acquisition ...................................................................
Setting and Executing Sequential Breakpoints...................................................
Coverage Information Display............................................................................
47
47
48
50
50
56
56
57
57
58
58
58
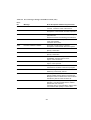
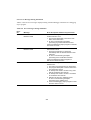
Simulator/Debugger Commands.................................................... 59
ASSEMBLE .......................... Assembles line by line ................................................
BREAK ................................ Sets, displays, and cancels breakpoints based on
instruction execution address......................................
BREAK_ACCESS ................ Sets, displays, and cancels break conditions based
on access to a range of memory..................................
BREAK_DATA ..................... Sets, displays, and cancels breakpoints based
on the value of memory data.......................................
BREAK_REGISTER ............ Sets, displays, and cancels break conditions based
on the value of data in a register .................................
BREAK_SEQUENCE .......... Sets, displays, and cancels breakpoints based
on a specified execution sequence ..............................
CALL .................................... Calls a function ...........................................................
COMMAND_CHAIN ........... Executes commands from a file..................................
61
63
66
69
73
77
79
83
5.9
5.10
5.11
5.12
5.13
5.14
5.15
5.16
5.17
5.18
5.19
5.20
5.21
5.22
5.23
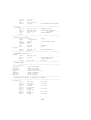
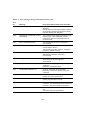
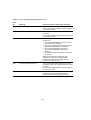
COMPARE ............................
CONVERT ............................
COVERAGE .........................
DATA_SEARCH ...................
DEBUG_LEVEL ..................
DISASSEMBLE ...................
DISPLAY_CHARACTERS ..
DISPLAY_COVERAGE .......
DUMP ...................................
EXEC_MODE ......................
FILL ....................................
GO
....................................
HELP ....................................
LOAD ....................................
LOAD_STATUS ...................
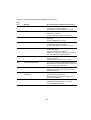
5.24
MACRO ................................
5.25
MAP ....................................
5.26
5.27
5.28
5.29
5.30
5.31
5.32
5.33
5.34
MEMORY..............................
MOVE ...................................
PRINT ....................................
QUIT ....................................
RADIX ..................................
REGISTER ...........................
RESET ..................................
SAVE ....................................
SAVE_STATUS ....................
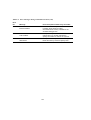
5.35
SCOPE ..................................
5.36
5.37
5.38
5.39
5.40
5.41
5.42
5.43
SET_COVERAGE ................
SHOW_CALLS ....................
STEP ....................................
STEP_INTO ..........................
STUB ....................................
SYMBOL...............................
TRACE...................................
TRACE_CONDITION ..........
Compares memory contents ....................................... 85
Calculates expression.................................................. 86
Starts and stops coverage measurement...................... 87
Searches for data......................................................... 90
Specifies debug level ................................................. 92
Disassembles and displays memory contents ............. 95
Displays character string ............................................ 97
Displays coverage data ............................................... 98
Displays memory contents.......................................... 102
Switches execution mode............................................ 104
Initializes memory area............................................... 106
Executes instructions continuously............................. 107
Displays command name and input format ............... 110
Loads file ................................................................... 112
Restores simulator/debugger memory and register
state ............................................................................. 115
Defines, displays, executes, and deletes
simulator/debugger command macros ........................ 116
Defines, displays, modifies, and deletes
memory areas.............................................................. 128
Modifies memory contents ......................................... 133
Copies memory block ................................................. 136
Creates execution history file...................................... 137
Exits the simulator/debugger ...................................... 140
Sets the radix............................................................... 141
Displays register contents ........................................... 142
Resets the simulator/debugger .................................... 143
Saves memory data to a file ........................................ 144
Saves the current simulator/debugger status
in a file ........................................................................ 145
Displays the function that includes the current
execution address........................................................ 147
Sets coverage range .................................................... 148
Displays function call ................................................. 150
Performs step execution in subroutine units ............... 152
Performs step execution.............................................. 154
Executes command during simulation........................ 156
Displays symbol information...................................... 159
Displays trace buffer ................................................... 163
Sets trace condition, and starts or stops trace ............. 167
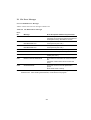
5.44
5.45
5.46
5.47
5.48
TRAP_ADDRESS .................
Sets, displays, and clears the system call start
address ........................................................................ 170
TYPE .................................... Displays variable value ............................................... 193
VECTOR................................ Executes from an interrupt vector address.................. 195
.<register> .............................. Modifies register content ............................................ 197
!
.................................... Invokes sub-process .................................................... 199
Part II CPU Information Analysis Program
Section 1
1.1
1.2
1.3
1.4
1.5
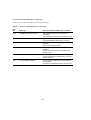
Creating the CPU Information ....................................................... 203
CIA Functions................................................................................................................. 203
Invoking the CIA Program.............................................................................................. 203
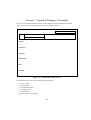
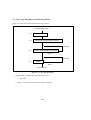
CIA Usage Procedures and Selection Menus ................................................................. 204
CIA Sample Sessions...................................................................................................... 206
CIA Limitations .............................................................................................................. 211
Part III Appendix
Appendix A Differences between Line Assemble Command and
SH-Series Cross Assembler Syntax............................................ 215
Appendix B SH-Series Assembler Mnemonics .............................................. 216
Appendix C SH-Series Memory Maps ........................................................... 217
Appendix D Sample Programs........................................................................ 219
Appendix E
Limitations on Debugging Object Programs .............................. 233
Appendix F
Messages..................................................................................... 235
F.1
F.2
F.3
Information Messages..................................................................................................... 235
F.1.1 Information Messages at Instruction Execution Interruption ............................. 235
F.1.2 Information Messages during Command Analysis............................................. 236
Error Messages ............................................................................................................... 237
F.2.1 Error Messages during Startup or Load Command Execution ........................... 237
F.2.2 Error Messages during Command Execution ..................................................... 239
F.2.3 Error Messages during Simulation ..................................................................... 245
CIA Error Messages ....................................................................................................... 247
F.3.1 I/O Related Error Messages................................................................................ 247
F.3.2 Keyboard Input Related Error Messages ............................................................ 248
Appendix G ASCII Code Table ...................................................................... 249
Appendix H Installation .................................................................................. 250
H.1
H.2
H.3
H.4
Contents of the Cartridge Tape ....................................................................................... 250
How to Install the Simulator/Debugger in the Host System........................................... 250
Equipment....................................................................................................................... 251
Special Keys ................................................................................................................... 251
Figures
Part I Simulator/Debugger
1-1
2-1
2-2
3-1
3-2
5-1
5-2
5-3
5-4
5-5
Methods for Creating Debugging Object Programs ....................................................... 4
Relocatable Section Load Map....................................................................................... 10
Initial Register Values..................................................................................................... 11
Input File Example (input.obj) ....................................................................................... 29
SH7000 Memory Map (Mode 2) .................................................................................... 31
Command Description Format ....................................................................................... 59
Macro Internal Variable ¥SIMSTAT............................................................................... 120
Display Range Specified by the Start Instruction Index................................................. 164
Display Range Specified by the Start Instruction Index and the Instruction Count ....... 165
Trace Buffer Contents..................................................................................................... 168
Part II CPU Information Analysis Program
1-1
CIA Usage procedure ..................................................................................................... 204
Tables
Part I Simulator/Debugger
2-1
2-2
2-3
2-4
2-5
2-6
2-7
2-8
4-1
4-2
4-3
5-1
Memory Types ................................................................................................................ 7
Example Memory Map ................................................................................................... 9
Stack Addresses Used to Save PC and SR ..................................................................... 16
Limitations of C Debugging ........................................................................................... 19
Processing When Satisfying a Break Condition............................................................. 21
Execution Time Increase Due to Break Condition Specifications.................................. 21
List of Simulation Errors ................................................................................................ 22
Register States at Simulation Error Stop ........................................................................ 23
Simulator/Debugger Commands..................................................................................... 48
Operators and Operator Priorities................................................................................... 55
C Expression Limitations and Workarounds .................................................................. 58
System Call Functions .................................................................................................... 172
Part II CPU Information Analysis Program
1-1
CIA Limitations .............................................................................................................. 211
Part III Appendix
A-1
B-1
C-1
F-1
F-2
F-3
F-4
F-5
F-6
F-7
G-1
Differences between Line Assemble Command and SH-Series Cross
Assembler Syntax ........................................................................................................... 215
Assembler Mnemonics Recognized by the Line Assemble Command.......................... 216
SH7000 Memory Map .................................................................................................... 218
Information Messages at Instruction Execution Interruption ......................................... 235
Information Messages during Command Analysis......................................................... 236
Error Messages during Startup for Load Command Execution...................................... 237
Error Messages during Command Execution ................................................................. 239
Error Messages during Simulation ................................................................................. 245
I/O Related Error Messages............................................................................................ 247
Keyboard Input Related Error Messages ........................................................................ 248
ASCII Code Table........................................................................................................... 249
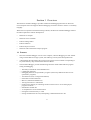
Section 1 Overview
The SH-series simulator/debugger provides simulation and debugging functions for SH-series
microcomputer CPUs and supports efficient debugging of software written in either C or assembly
language.
When used in conjunction with the following software, the SH-series simulator/debugger reduces
the effort required for software development.
•
SH Series C compiler
•
SH Series cross assembler
•
H Series linkage editor
•
H Series librarian
•
H Series object converter
•
SH Series CPU information analysis program
1.1 Features
•
Since the simulator/debugger runs on a host computer, software debugging can start without
using an actual SH-series target system, thus reducing overall system development time.
•
A designated CPU information file can be used to specify an environment corresponding to
any of the memory maps used with the SH-series MCUs.
•
The simulator/debugger provides the following functions which enable efficient program
testing and debugging.
— The ability to handle all of the SH7000 CPUs
— C debugging functions
— Debugging functions for optimized C programs (which may differ from those of nonoptimized C programs)
— Test functions (stub, coverage measurement)
— Subroutine execution functions
— Macros (command combinations)
— Tracing instructions or subroutines
— Functions for stopping or continuing execution when an error occurs during object
program execution
— Standard I/O and file I/O
— A comprehensive set of break functions
— Saving the execution history to a file
— Saving command lines to a file, and inputting command lines from a file
3
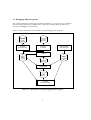
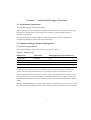
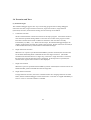
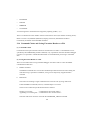
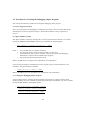
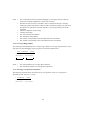
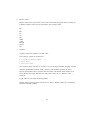
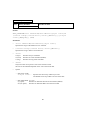
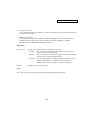
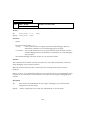
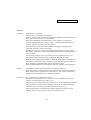
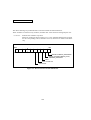
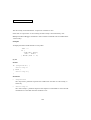
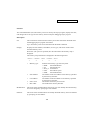
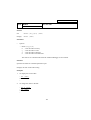
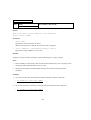
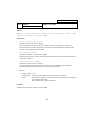
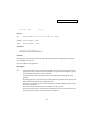
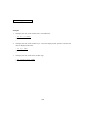
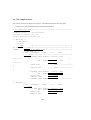
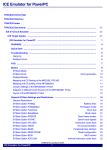
1.2 Debugging Object Programs
The simulator/debugger can debug object modules generated by a C compiler or cross assembler,
and load modules generated by a linkage editor. These object modules and load modules are
referred to as debugging object programs.
Figure 1-1 shows the software associated with creating debugging object programs.
Assembler
source
program
C source
program
SH-series
cross assembler
SH-series
C compiler
CPU information
analysis program
Librarian
CPU
information
file
Object
module
Library file
Linkage editor
Load
module
SH-series
simulator/debugger
Figure 1-1 Methods for Creating Debugging Object Programs
4
1.3 Simulation Range
1.
The simulator/debugger supports the following SH-series MCU functions.
•
All executable CPU instructions (including delayed branch instructions)
•
Exception processing
•
General registers, control registers, and system registers
•
All address areas
Refer to the SH Series Programming Manual for details regarding the delay branch
instructions.
2.
The simulator/debugger does not support the following SH-series MCU functions. Programs
which use these functions must be debugged using the SH-series emulator.
•
Direct memory access controller (DMAC)
•
Watchdog timer (WDT)
•
Integrated timer pulse unit (ITU)
•
Serial communications interface (SCI)
•
A/D converter
•
I/O port
•
Timing pattern controller (TPC)
•
Interrupt controller (INTC)
•
User break controller (UBC)
5
6
Section 2 Simulator/Debugger Functions
2.1 Environment Specification
The simulator/debugger handles SH7000 CPUs.
When creating a CPU information file, use the CPU information analysis program (CIA) to select
the CPU type. Details of the CIA program are given in part II, CPU Information Analysis
Program, of this manual.
The instructions that can be used differ according to the CPU type. Refer to the SH Series
Programming Manual for details of the CPU specifications.
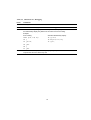
2.2 Simulator/Debugger Memory Management
(1) Memory Map Specification
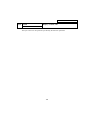
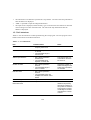
The simulator/debugger supports the memory types shown in table 2-1.
Table 2-1 Memory Types
Memory Type
Access Type
Debugging Object Program Execution
Internal ROM
Read only
Yes
Internal RAM
Read/write
Yes
External bus area
Read/write
Yes
Internal I/O area
Read/write
No
The SH-series CPU memory map is a combination of the above memory types. The user must
create a CPU information file which correctly specifies the memory map for the CPU used.
The CPU information analysis program is used to create a CPU information file. This file can be
used to specify the CPU (its type and address bus width) and the memory (its types, the start and
end addresses of the memory areas, the number of memory access states, and the memory data bus
width).
When the simulator/debugger is started, a memory map corresponding to the user system is created
from the specified CPU information file. (When no file is specified, external bus area is assumed.)
7
(2) Memory Allocation
When the simulator/debugger is started or when a LOAD command is entered, the simulator/
debugger allocates memory on the host computer for both the SH-series debugging object program
load area and the vector area. Areas other than these are allocated with the MAP command.
a.
Vector area
When a vector area is allocated by the debugging object program, it must be specified as an
absolute address section starting at location H'0. The simulator/debugger allocates addresses
H'0 to H'3FF as the vector area when no absolute address section has been allocated in this
area.
b.
Stack area
Although the stack pointer is set to the address following the end address of the internal RAM,
no stack area is allocated.
When there is no stack area allocated within the debugging object program, allocate a stack
area using the simulator/debugger MAP command.
When there is no internal RAM space, the stack pointer will be cleared to 0.
When there is a stack area allocated within the debugging object program, set the stack pointer
either by an instruction included in the program or by a .<register> command.
c.
Undefined symbol area
When the U option is specified with the LOAD command, a 4-byte area is allocated for each
undefined symbol and taken as the symbol’s address. Undefined symbol areas are allocated to
an empty area in either the external bus area or the internal RAM.
(3) Memory Access Types
The memory access type is determined from the memory type corresponding to the load address of
the debugging object program. The memory access type can be either read-only or read/write.
Since it is an error for the debugging object program to write to read-only memory, it is possible to
detect memory access errors. The memory access type for each memory area can be changed with
the MAP command.
8
2.3 Loading Debugging Object Programs
The simulator/debugger loads debugging object programs in the order that sections appear in the
source program. The loading method differs depending on whether the section is relocatable or
not, as described below.
(1) Relocatable Sections
Individual sections are loaded consecutively starting at address H'400 so that they do not cross
boundaries between the internal ROM space, the internal RAM, and the internal I/O area.
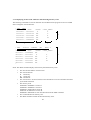
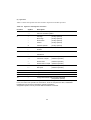
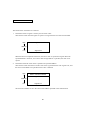
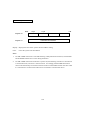
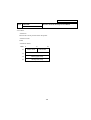
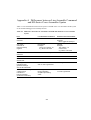
Example: If a program consists of three relocatable sections, use a memory map based on the
SH7000 memory map (mode 0) with an external bus area set up as shown in table 2-2.
Table 2-2 Example Memory Map
Memory Type
Address
Number of States
Data Bus Width
External bus area 1
H'0000000 to H'0FFFFFF
3
8
External bus area 2
H'1000000 to H'4FFFFFF
2
8
Internal I/O area
H'5000000 to H'5FFFFFF
3
8
External bus area 3
H'6000000 to H'7FFFFFF
3
8
Internal RAM
H'F000000 to H'FFFFFFF
1
32
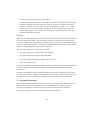
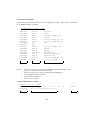
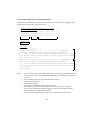
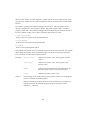
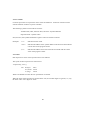
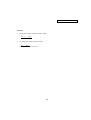
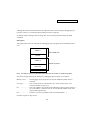
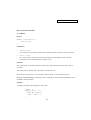
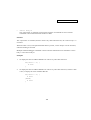
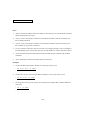
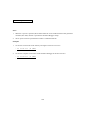
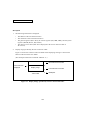
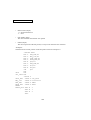
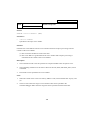
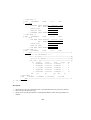
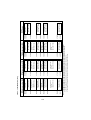
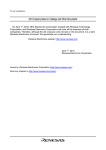
Figure 2-1 shows the sizes and load addresses of the three relocatable sections.
9
Address
H'0000000
H'0000400
Vector area*2
Section A
External bus area 1
H'0500400
H'1000000
Section B
*1
External bus area 2
H'4500000
H'5000000
Internal I/O area
H'6000000
H'6700000
Section C
*1
External bus area 3
H'8000000
H'F000000
Internal RAM area
H'FFFFFFF
Section
Load Address
Size
A
H'400
H'500000
B
H'1000000*1
H'3500000
C
H'6000000*1
H'700000
Notes: 1. Since section B would cross the boundary between external bus areas 1 and 2 if it
was loaded following section A, it is loaded from the start address of external bus
area 2, i.e.,address H'1000000. Similarly, section C is loaded from the start
address of external bus area 3, i.e., address H'6000000 so that it does not cross
the boundary between external bus areas 2 and 3. Relocatable sections cannot
be loaded to the internal I/O area.
2. Regions allocated when the simulator/debugger is started up.
Figure 2-1 Relocatable Section Load Map
(2) Absolute Address Sections
Absolute address sections are loaded at the specified address. A load error is generated if the
absolute address section crosses any of the boundaries between the internal ROM area, the external
bus area, the internal RAM area, and the internal I/O area. This makes it possible to verify that
absolute address sections are correctly loaded into the appropriate memory area.
An error occurs if the load address of either a relocatable section or an absolute section exceeds the
10
CPU addressing range. A load error also occurs if an attempt is made to load a program into an
invalid memory area (an area which does not correspond to the actual memory) which the user
specified.
Relocatable sections cannot be loaded to the internal I/O area.
2.4 Setting Register Initial Values, Displaying and Changing Register Values
The simulator/debugger supports the following SH-series registers.
•
•
•
General registers (R0 to R15, SP(R15))
Control registers (SR, GBR, VBR)
System registers (MACH, MACL, PR, PC)
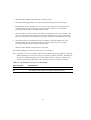
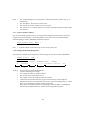
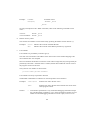
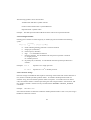
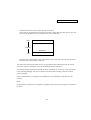
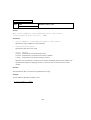
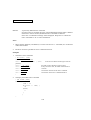
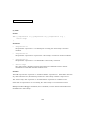
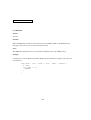
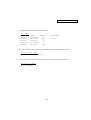
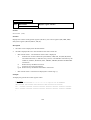
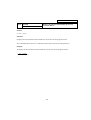
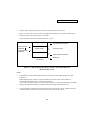
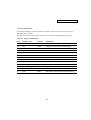
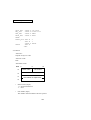
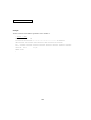
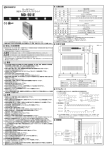
(1) Initial Register Values
Figure 2-2 shows the initial values when the simulator/debugger is started up.
Register name
32 bits
Initial value
R0
R0
H'00000000
R14
R14
H'00000000
R15 (SP)
SP
Internal RAM last address + 1*1
SR
SR
H'00000000
GBR
GBR
H'00000000
VBR
VBR
H'00000000
MACH
H'00000000
MACL
H'00000000
PR
PR
H'00000000
PC
PC
Entry point address*2
MACH/L
Notes: 1. The address following the last address of internal RAM is loaded into R15. When
there is no internal RAM , R15 is set to H'00000000.
2 The entry point address is the address within the section specified either by the
assembler .END directive or the ENTRY option of the linkage editor. The start
address of the first section of code is used if no entry point is specified. If there is
no code section, this resister is set to 0.
Figure 2-2 Initial Register Values
11
(2) Displaying and Changing Register Values
The REGISTER command is used to display and confirm the contents of the global, control, and
system registers.
The .<register> command is used to change the values of these registers.
2.5
Displaying the Memory Map, and Allocating, Displaying, Changing,
and Releasing Memory
(1) Displaying Section Addresses and the Memory Map
The addresses where the debugging object program is loaded can be confirmed by using the MAP
command to display the section addresses.
In addition, the MAP command M option can be used to display the memory map from the CPU
information file specified at simulator/debugger start-up.
(2) Memory Area Allocation
The MAP command is used to allocate vector areas and stack areas, and to allocate memory areas
which have not yet been allocated by the debugging object program.
The following conditions must be satisfied when allocating an area, otherwise an error will occur.
•
The allocated area must not overlap a previously allocated section.
•
The allocated area must not cross over the boundary between two different memory types.
•
The allocated area must not include any part of an invalid area.
The MAP command can allocate a maximum of 20 memory areas.
12
(3) Displaying Memory Contents
The memory contents can be displayed by using the DUMP or DISASSEMBLE command.
•
DUMP:
The memory contents of the specified address range are displayed as
hexadecimal and ASCII data, or in floating point format.
•
DISASSEMBLE: The memory contents of the specified address range are displayed as
instruction mnemonics and operands.
An error is generated if an unallocated area is specified as the memory area.
(4) Changing the Contents of Memory
The contents of memory can be changed by using the MEMORY or ASSEMBLE command.
•
MEMORY:
The input values are converted to hexadecimal and stored in the specified
address.
•
ASSEMBLE: The instruction mnemonics and operands are converted to instruction codes
and stored in the specified address.
The MEMORY and ASSEMBLE commands continue converting and storing contents to memory
(updating the storage address each time) until a termination symbol is read.
(5) Releasing a Memory Area
Memory areas allocated with the MAP command can be released. The simulator/debugger
commands operate as follows when a memory area is released.
•
If a break has been set with a break-related command, it will be cancelled.
•
The LOAD_STATUS command retains the released state.
•
The SET_COVERAGE command treats released sections as errors at
DISPLAY_COVERAGE execution.
•
The TRACE command displays an error during assembly and display.
13
2.6 Execution and Trace
(1) Execution Types
The simulator/debugger supports five ways of executing programs that are being debugged:
continuous execution, single instruction execution, single line execution, single function
(subroutine) execution, and execution starting from an interrupt vector address.
a.
Continuous execution
The GO command starts continuous execution of the object program. Continuous execution
starts from the specified starting address or from the current value of the program counter.
Execution continues until a break condition is satisfied or until execution is forcibly
terminated by a (CTRL) + (C). When execution stops, the simulator/debugger displays the
number of instructions executed, the contents of the registers, the last instruction executed (as
a disassembled instruction), and termination information messages.
b.
Single instruction execution
When the N or I option is specified with the DEBUG_LEVEL command, the execution unit
for the STEP and STEP_INTO commands becomes the single instruction. (The STEP
command executes subroutines as a single step.) Each time a single instruction is executed,
the mnemonic of the executed instruction is displayed. If the R option was specified, the
contents of the registers after execution is also displayed.
c.
Single line execution
When the S option is specified with the DEBUG_LEVEL command, the execution unit for the
STEP and STEP_INTO commands becomes the single line.
d.
Single function execution
In single function execution, the CALL command creates the C language function call stack
frame, and the simulator/debugger executes the function. Execution is stopped immediately if
an error occurs or if a break condition is satisfied.
14
e.
Execution starting from an interrupt vector address
The simulator/debugger generates a vector address from the vector number specified with the
VECTOR command and initiates interrupt processing. Execution continues until a break
condition is satisfied or until execution is forcibly terminated by a <CTRL> + <C>. When
execution stops, the simulator/debugger displays the number of instructions executed, the
contents of the registers, the last instruction executed (as a disassembled instruction), and
termination information messages.
(2) Trace
When trace is enabled during instruction execution, the results of the execution of each instruction
are written into the trace buffer. The trace buffer can hold the results for up to 1023 instruction
executions. (When the 1023th instruction is a delayed branch instruction, the trace buffer can store
up to 1024 instruction executions.) The TRACE_CONDITION command enables tracing, and the
TRACE command displays the acquired trace information.
The following information is stored in the trace buffer.
•
The values of the general registers (R0 to R15, SP(R15))
•
The values of the control registers (SR, GBR, VBR)
•
The values of the system registers (MACH, MACL, PR, PC)
•
The accessed memory data
Note that the TRACE_CONDITION command is used to specify the types of acquired instructions
traced, the tracing start and end points, and the processing performed when the trace buffer
becomes full.
In addition, the SHOW_CALLS command can display the functions called before arriving at the
current execution address. SHOW_CALLS displays the line numbers called in reverse order. The
file name, function name, line number, and arguments of the called functions are displayed.
2.7 Exception Processing
The simulator/debugger generates exception processing corresponding to the TRAPA instruction,
general illegal instructions, slot illegal instructions, and address errors. (Other exception
processing is supported as simulates exception processing by the VECTOR command.)
Exception processing simulation is performed in the following sequence.
15
•
When the EXEC-MODE command select continuous mode:
1
The simulator/debugger detects the exception generated during instruction execution.
2
PC and SR are saved in the stack area. If an error occurs during the saving operation, the
simulator/debugger stops exception processing, indicates occurrence of an exception
processing error, and enters command input wait state.
3.
The start address is read out of the vector address corresponding to the vector number. If an
error occurs during this read operation, the simulator/debugger stops exception processing,
indicates occurrence of an exception processing error, and enters command input wait state.
4.
Instruction execution is simulated from the start address. If the start address was 0, the
simulator/debugger stops exception processing, indicates occurrence of an exception
processing error, and enters command input wait state.
•
When the EXEC-MODE command selects stop mode:
The simulator/debugger executes the above steps 1 to 3, and stops.
Note: In the SH-series, the stack address which saves the PC and SR during exception processing
differs depending on the access size, the type of memory, and the bus width. The addresses
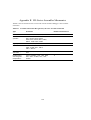
used by the simulator/debugger to save PC and SR are shown in table 2-3. These can be
used to easily determine the values of PC and SR at the time of exception processing.
Table 2-3 Stack Addresses Used to Save PC and SR
Type of Register
Stack Address
PC
The address of SP-8 when the exception processing occurs
SR
The address of SP-4 when the exception processing occurs
16
2.8 Standard I/O and File I/O Processing
The simulator/debugger supports standard I/O and file I/O processing so that the object program
can perform I/O from standard I/O (usually the console and keyboard) or from disk files.
The following 13 I/O processing types are supported.
•
•
•
•
•
•
•
•
•
•
•
•
•
Single character input from standard input
Single character output to standard output
Single line input from standard input
Single line output to standard output
Single byte input from a file
Single byte output to a file
Single line input from a file
Single line output to a file
File open
File close
File pointer reference
File pointer move
EOF (end of file) check
The TRAP_ADDRESS command is used to implement these functions. The user writes a
subroutine branch instruction (BSR or JSR) to a special location for I/O in the object program.
The program is then executed by the simulator/debugger with that special location specified by the
TRAP_ADDRESS command after starting the simulator/debugger. The simulator/debugger
performs I/O processing with the contents of R0 and R1 as parameters when a subroutine call
(BSR or JSR) to the specified location is detected during debugging object program execution.
The simulator/debugger restarts simulation at the instruction following the subroutine call
instruction after completion of the I/O processing
2.9 Saving and Restoring the Simulation Status
(1) Saving Simulation Status
The current simulation state can be saved using the SAVE_STATUS command. After executing
this command, the LOAD_STATUS command can be used to return to the simulator/debugger
status at the time the SAVE_STATUS command was executed. Command options can be used to
specify the type of saved information. The following types of information can be saved.
•
Option M: Saves only the current contents of memory and registers.
•
Option A: Saves the complete, current status of the simulator/debugger.
17
(2) Restoring Simulation Status
The LOAD_STATUS command restores the contents of memory and registers saved when the
SAVE_STATUS command was executed.
Restoring the status saved when the A option was specified is not performed with the
LOAD_STATUS command, but by a specification at simulator/debugger startup.
However, if the current memory map differs from the memory map in use, at the time the
SAVE_STATUS command was executed, an error occurs and the state is not restored.
2.10 C Source Level Debugging
The simulator/debugger also provides functions for debugging programs written in C. The most
important of these functions are described below.
(1) C Source Line Display
The C source line is displayed at the time of disassembly display, trace display, coverage display,
and step execution.
However, the format will differ depending on options specified by the DEBUG_LEVEL command.
(2) Single Function and Single Source Line Stepping Function
The debugging object program can be executed in units of C source functions (subroutines) or
lines.
Single function execution is performed using the CALL command, and single source line
execution is performed using the DEBUG_LEVEL, STEP, or STEP-INTO command.
(3) Symbol Reference
There are three classes of symbol scope in C: global symbols, which are valid over the entire
program, static symbols, which are valid in a single file, and local symbols, which are valid within
a function.
When only the name of the symbol is specified, symbols will be considered valid in the current file
or function indicated by the program counter. The valid file and function names can be examined
using the SCOPE command. Symbols in other files or functions can be examined by stating the
name of the file and function explicitly. Symbol related information can also be examined using
the SYMBOL command.
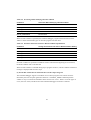
Table 2-4 shows debugging limitation, when a C program is compiled with optimization.
18
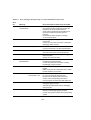
Table 2-4 Limitations of C Debugging
Items
Limitations
1
Local symbols of the current function cannot be referenced.
2
Source lines deleted by optimization cannot be debugged.
3
Because lines may change places due to optimization, the program execution order or
the disassembly display may differ from the order of the source listing.
Example:
Source listing
12 for (i = 0; i < 6; i++)
Simulator disassembly display
14 i_2 = i+1;
13 {
12 for (i = 0; i < 6; i++)
14 i_2 = i+1;
17 i_2++;
15 i_2++
16 }
17 i_2++
4
In “for” and “while” loops, disassembly display may be performed twice: once at the
loop entrance and once at the loop exit.
19
2.11 Break Conditions
The simulator/debugger provides the following conditions for breaking (interrupting) the
simulation of an object program during execution started by a CALL, GO, STEP, STEP_INTO, or
VECTOR command.
•
Break due to satisfaction of a condition set by a break command
•
Break due to detection of a run-time error in the object program
•
Break due to overflow of the trace buffer
•
Break due to execution of a SLEEP instruction
•
Break due to input of (CTRL) + (C)
(1) Break Due to the Satisfaction of a Condition Set by a Break Command
There are 5 break commands as follows:
•
BREAK:
Break based on the location of the instruction executed
•
BREAK_ACCESS:
Break based on access to a range of memory
•
BREAK_DATA:
Break based on the value of data written to memory
•
BREAK_REGISTER:
Break based on the value of data written to a register
•
BREAK_SEQUENCE: Break based on a specified execution sequence
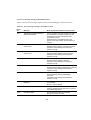
When a break condition is satisfied while executing an object program, the instruction at the break
point may or may not have been executed depending on the type of the break, as listed in table 2-5.
20
Table 2-5 Processing When Satisfying a Break Condition
Command
Instruction When Satisfying a Break Condition
BREAK
Not executed
BREAK_ACCESS
Executed
BREAK_DATA
Executed
BREAK_REGISTER
Executed
BREAK_SEQUENCE
Not executed
When a break condition is specified, the simulator/debugger program execution time increases.
Table 2-6 shows which break types can increase program execution time.
Table 2-6 Execution Time Increase Due to Break Condition Specifications
Command
Change in Execution Time Due to Break Condition Setting
BREAK
Not increased
BREAK_ACCESS
Increased
BREAK_DATA
Increased
BREAK_REGISTER
Increased
BREAK_SEQUENCE
Not increased
If a break condition is specified at an address location other than the beginning of an instruction,
the break condition will not be detected.
When a break condition is satisfied during object program execution, a break condition satisfaction
message is displayed and execution stops.
(2) Break Due to Detection of a Run-time Error in the Object Program
The simulator/debugger supports a simulation error to detect program errors which cannot be
detected by the CPU exception generation functions. The EXEC_MODE command specifies
whether to stop or continue the simulation when such an error occurs. Table 2-7 lists the types of
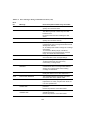
errors, the error causes, and the action of the simulator/debugger if execution continues.
21
Table 2-7 List of Simulation Errors
Processing in
Continuation Mode
Error Type
Error Cause
Memory access error
1. Access to a memory area that has not
been allocated
2. Write to a memory area having the
write protect attribute
On memory write,
nothing is written;
on memory read, all
bits are read as 1.
3. Read from a memory area having
the read disable attribute
4. Access to a memory area where
memory does not exist
Invalid SP instruction
The simulation
1. Execution of an instruction that places
R15 (SP) outside the four-byte boundary continues identically
to the operation of
MOV.B reg, @–R15
the device.
MOV.B @R15+, REG
MOV.W reg, @–R15
MOV.W @R15+, REG
Illegal operation
1. Zero division is executed by the DIV1
instruction.
The simulation
continues identically
to the operation of
the device.
If the simulator/debugger is in stop mode when a simulation error occurs, the simulator/debugger
returns to command wait mode after stopping instruction execution and displaying the error
message. Table 2-8 lists the states of the PC and SP at simulation-error stop.
22
Table 2-8 Register States at Simulation Error Stop
Error Type
Value of the PC
Value of the SP
Memory access error
Error on instruction read:
The address of the instruction that caused
the error
Unchanged
Error during instruction execution:
The address following the instruction that caused
the error
Invalid SP instruction
The address of the instruction that caused
the error
Illegal operation
The address following the instruction that caused
the illegal operation
Use the following procedure when debugging programs which include instructions that generate
simulation errors.
a.
First execute the program in stop mode and confirm that there are no errors except those in the
intended locations.
b.
After confirming the above, execute the program in continuation mode.
Note: If an error occurs in stop mode and simulation is continued after changing the simulator
mode to continuation mode, the simulation may not be performed correctly. When
restarting a simulation, always restore the register contents (general, control, and system
registers) and memory contents to the state prior to the occurrence of the error.
The SAVE_STATUS and LOAD_STATUS commands can be used to save and restore the
simulation state during debugging.
(3) Break Due to Overflow of the Trace Buffer
When the B option has been specified with the TRACE_CONDITION command, the simulator/
debugger stops execution when the trace buffer becomes full. The following message is displayed
when execution is stopped.
TRACE BUFFER FULL
If execution is resumed with a GO, STEP, STEP_INTO, or VECTOR command the trace buffer is
overwritten starting from the beginning of the buffer.
23
(4) Break Due to Execution of a SLEEP Instruction
When a SLEEP instruction is executed during simulation, the simulator/debugger stops execution.
The following message is displayed when execution is stopped.
SLEEP
Execution can be resumed with a GO, STEP, STEP_INTO, or VECTOR command.
(5) Break Due to Input of (CTRL) + (C)
Execution can be forcibly terminated by the user during simulation using the above keys. The
following message is displayed when execution is terminated.
MANUAL BREAK
Execution can be resumed with a GO, STEP, STEP_INTO, or VECTOR command.
2.12 Memory Manipulation
The simulator/debugger provides the COMPARE, FILL, and MOVE commands as functions to
increase debugging ability.
1.
The COMPARE command compares memory contents. It is used, for example, to compare
the results of executions. The COMPARE command displays unmatched data.
2.
The FILL command fills a memory area with initial data. It is used to initialize memory prior
to program execution.
3.
The MOVE command copies the contents of a specified memory area to a specified
destination area.
2.13 Macro (Command Combination)
A macro function is a function that produces new commands by combining multiple commands.
Macros can be created in the simulator/debugger by using the MACRO command.
Macros can use macro internal variables and macro internal commands. Macro internal commands
are control commands which define macro internal conditions, or which can be executed.
The following macro internal commands are provided.
•
WHILE
•
FOR
24
•
DO/WHILE
•
IF/ELSE
•
MBREAK
•
CONTINUE
An executing macro command can be stopped by inputting (CTRL) + (C).
There is no limitation on the number of macro calls within a macro (the number of nesting levels).
Refer to section 5.24, MACRO (Definition, Display, Execution, and Deletion of Macro
Commands), for details on the MACRO command.
2.14 Command Chains and Saving Execution Results to a File
(1) Command Chains
Commands can be input from files which are created with a text editor. Command files can be
specified by the COMMAND_CHAIN command, or by a parameter when the simulator/debugger
is started. It is possible to include data that makes use of standard I/O processing in command
files.
(2) Saving Execution Results to a File
There are two methods for saving simulator/debugger execution results to a file: the PRINT
command and redirection.
a.
PRINT command
The PRINT command saves to a file all command input and all execution results during the
time that saving is specified. In addition, saving can be temporarily stopped and then
restarted.
b.
Redirection
The results of executing a single command can be saved to a file by using redirection.
Unlike the PRINT command, however, command input is not saved.
There are two redirection specification formats as follows:
Writing to a new file:
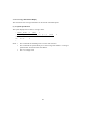
<command line>∆\>∆"<file name>"
Appending to an existing file: <command line>∆\>>∆"<file name>"
Note that redirection cannot be used with the COMMAND_CHAIN command.
25
2.15 Saving Input Commands to a File
The PRINT command also provides a function for saving only command input. Test re-execution
can be automated by using this function to create a command file and using that command file
with the COMMAND_CHAIN command.
2.16 Test Functions
2.16.1 Stub Function
During simulation of a object program, the simulator/debugger can stop execution and execute a
specified set of simulator/debugger commands each time the program passes a location specified
with the STUB command. When this execution is completed, the simulator/debugger returns to
simulation of the object program. This is referred to as a “stub”.
The return location following stub execution can be specified as desired. When the stub execution
location is not the same as the return location, the resulting execution can be seen as stub execution
replacing one part of the program simulation. This is referred to as “stub proxy execution”.
Stub proxy execution is used, for example, to jump over subroutine processing that has not yet
been implemented. This allows simulation to be performed even if the program is not completed.
On the other hand, when the return location is the same as the stub location, since the simulation
returns to the same location after executing the simulator commands, this function can be used to
insert instructions in the debugging object program. This is referred to as an “insertion stub”.
Insertion stubs can be used, for example, to insert a patch in a program.
Up to 16 stubs can be specified.
2.16.2 Coverage Measurement
The final stages of program development, i.e, the steps immediately prior to release as a product,
include functional evaluation, performance evaluation, optimization, and quality assurance. The
simulator/debugger supports the coverage method, which is a testing technique used for quality
assurance.
The coverage function is a function to investigate whether program testing has covered all the
program’s functions, and to determine if those tests are adequate. While there are several coverage
techniques, this simulator/debugger supports C0 and C1 coverage.
C0 coverage indicates what sections of the program code have been executed as a percentage of
the entire object of measurement.
C1 coverage indicates as a percentage, which branch instructions have been tested for the cases of
26
branch taken and branch not taken, for all branch instructions within the object of measurement.
Furthermore, the simulator/debugger supported coverage functions not only indicate the results as
percentages, but can also indicate exactly which lines of code have been executed.
(1) Coverage Measurement Sequence
The coverage measurement sequence and the commands used are as follows.
•
Measurement range specification:
SET_COVERAGE
•
Coverage start declaration:
COVERAGE file name
•
Program execution:
Simulator commands
•
Temporary stop, restart,
and initialization of
the coverage measurement:
COVERAGE ; option
•
Display of measurement results:
DISPLAY_COVERAGE
•
Coverage termination:
COVERAGE–
a.
Measurement range specification
The SET_COVERAGE command specifies the range of the measurement area.
Up to 16 coverage areas can be specified. The program code sections (and no other sections)
are automatically set as the coverage measurement range when the simulator/debugger is
started, or when an object program (object module or load module file) is loaded with the
LOAD command.
b.
Coverage start
The start of the coverage function is declared with the COVERAGE command.
Prior to actually starting measurement, the file used to store the measured data is specified
with the COVERAGE command. If a file which already holds measurement data is specified,
the measurement range and the measurements stored in that file are read out and used, thus
allowing the measurement to be continued. In this case, since the measurement range will be
read from the file, there is no need to specify the range with the SET_COVERAGE command.
Furthermore, the range from the file takes precedence over any SET_COVERAGE command
range setting.
27
c.
Program execution
When coverage measurement preparations are complete, use a GO, STEP, STEP_INTO,
CALL, or VECTOR command to execute the object program.
d.
Temporary stop, restart, and initialization of coverage measurement
Coverage data measurement is performed between the start of coverage and coverage
termination. However, temporary stop of measurement, restart, and initialization of
measurement data can be selected with the D (disable), E (enable), and R (reset) COVERAGE
command options, respectively.
e.
Display of measurement results
The DISPLAY_COVERAGE command is used to display the measurement results. Four
types of display methods (selected by options) for different purposes are supported.
f.
•
T option:
Displays C0 and C1 coverage
•
G option:
Displays the coverage results in units of source line
•
D option:
Displays the coverage results in units of machine language
•
N0 and N1 options:
Displays the addresses of lines that were not executed
Coverage termination
Coverage is terminated using the COVERAGE command termination specification:
COVERAGE–.
The measured data is stored in the file specified in the coverage start declaration.
28
Section 3 Using the Simulator/Debugger
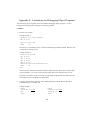
This section describes the use of the simulator/debugger with a sample program. See appendix D,
Sample Program, for a source listing of the sample program.
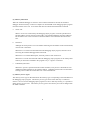
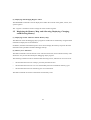
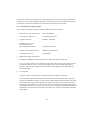
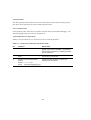
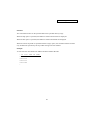
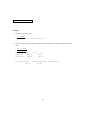
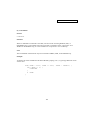
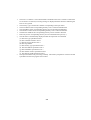
3.1 Sample Program Description
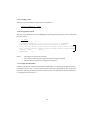
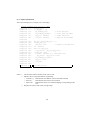
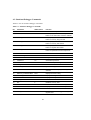
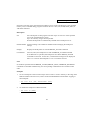
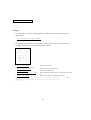
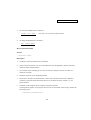
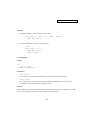
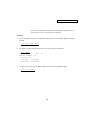
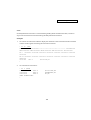
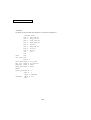
The sample program used in this manual dumps each record of an SH-series object file. Lines of
data are read from the file and dumped one at a figure. Figure 3-1 shows an example of the input
data.
80200080
80008080
842B2039
01003031
726F6706
00000003
30303931
00800080
00000000
31303830
30300810
48382F33
0470726F
30383036
00008080
00000000
36313432
10000000
3030D886
6708415F
31343235
80808080
0000005F
35343200
00000470
25400001
48382F33
34320000
Figure 3-1 Input File Example (input.obj)
This program consists of 5 modules.
•
main( ):
Handles loop control of the initialization, reading, editing, and display
operations.
•
Print_rec( ):
Reads, edits, and displays data.
•
Read_rec( ):
Reads a single record.
•
Bin_ascii( ):
Converts binary data to ASCII.
•
Ph_read( ):
Inputs data by calling an assembly language routine.
Note that when executing the sample program, an assembly language routine must be written to
allow binary data to be read into a C source file.
29
3.2 Procedure for Creating the Debugging Object Program
This section describes the procedure for creating the debugging object program.
(1) Source Program Creation
The C source program to be debugged is created with a text editor. Here we assume that the file
containing this C source program is sample.c, and that the assembler source program file is
prog.src.
(2) Object Module Creation
The object module is created by compiling the C source program with the SH-series C compiler.
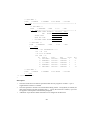
Specify the DEBUG and OPTIMIZE options when compiling the sample program.
% shc˘sample.c˘-debug˘-optimize=0
1
2
3
4
Notes: 1
2
3
4
(RET)
shc is the SH-series C compiler command.
The file name of the C source program (sample. c in this case).
A command line option to the C compiler. This option specifies that debugging
information is output to the relocatable object program.
This option specifies the optimization level.
Refer to the SH-Series C Compiler User’s Manual for more information.
Create an object module by assembling the source program prog.src with the SH-series cross
assembler, using the following command.
% asmsh˘prog.src˘-debug
(RET)
Refer to the SH-Series Cross Assembler User’s Manual for more information.
(3) Creating the Debugging Object Program
Use the linkage editor to combine the object module output by the C compiler with the object
module output by the cross assembler, by entering the following command line. Be sure to include
the EXCLUDE, DEBUG, and ENTRY options.
% lnk˘sample,prog˘-exclude˘-debug˘
-entry =_main˘-start=P/8000400˘
-start= D,B,dt/9000000
(RET)
30
Here, standard library (shclib.lib) and low-level library must be specified as default libraries.
Refer to the H-Series Linkage Editor User’s Manual for more information.
3.3 Simulator/Debugger Usage Example
This section describes the command inputs and simulator/debugger outputs for a sample
simulator/debugger session.
3.3.1 Creating the CPU Information File
A CPU information file which corresponds to the SH-series device to be used must be created
before using the simulator/debugger. Refer to part II, CPU Information Analysis Program, in this
manual.
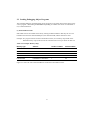
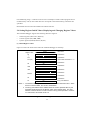
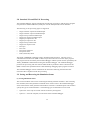
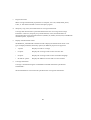
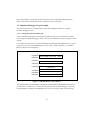
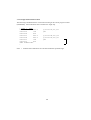
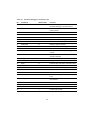
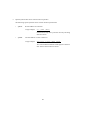
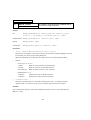
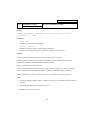
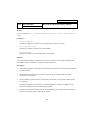
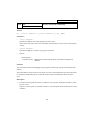
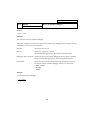
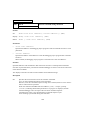
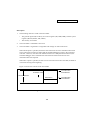
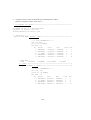
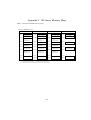
Our example uses the memory map for the SH7000 extended mode with ROM (mode 2). Figure
3-2 gives an overview of the SH7000 mode 2 memory map. Refer to appendix C.1, SH7000
Memory Map for more information.
H'0000000
Internal ROM area (32 bits, 1 state)
H'0FFFFFF
H'5000000
Internal I/O area (16 bits, 3 states)
H'5FFFFFF
H'8000000
H'9000000
H'F000000
H'FFFFFFF
Vector area
Internal ROM area (32 bits, 1 state)
External ROM area (16 bits, 3 states)
Internal RAM area (32 bits, 1 state)
Figure 3-2 SH7000 Memory Map (Mode 2)
The internal ROM areas H'0000000 to H'0FFFFFF and H'8000000 to H'8FFFFFF correspond to
the same area in the SH series, but are treated separately by the simulator/debugger. To use the
internal ROM area ranging from H'8000000 as the vector area, specify either of the following.
31
(1) Copy the data from H'8000000 to H'800000F to the memory starting from H'0.
: MAP
8000000
800000F
(RET)
: MOVE
8000000
800000F
0
(RET)
(2) Write H'8000000 to VBR.
: . VBR
8000000
(RET)
Since VBR is not affected by reset interrupts, copy the data from H'8000000 to H'800000F to the
memory starting from H'0 by entering the command line as shown in item (1).
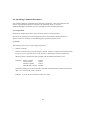
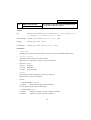
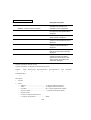
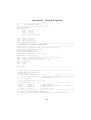
3.3.2 Loading the Program
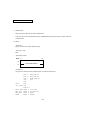
When the simulator/debugger is invoked by the following command line, the debugging object
program is loaded and the simulator/debugger enters the command wait state.
% sdsh˘sample.abs˘-cpu=mode2
1
(RET)
2
SH SERIES SIMULATOR-DEBUGGER Ver. 1.1
Copyright (C) Hitachi, Ltd. 1992
Licensed Material of Hitachi, Ltd.
: 3
Notes: 1
2
3
(HS0700SDCU1SM)
“sdsh” is the simulator/debugger command.
“sample.abs” is the debugging object program file name.
The colon is the simulator/debugger command prompt.
32
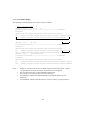
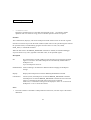
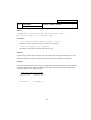
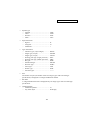
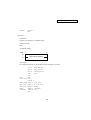
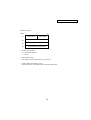
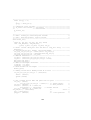
3.3.3 Memory Map Display and Memory Allocation
The MAP command is used to verify the memory map as follows.
: MAP ;M (RET)
<KIND> <START>
NOT_A
00000000
I/O
05000000
NOT_A
06000000
ROM
08000000
EXT
09000000
RAM
0F000000
1
-
<END>
04FFFFFF
05FFFFFF
07FFFFFF
08FFFFFF
0eFFFFFF
0FFFFFFF
<STATE>
2
: MAP 0F000000 0FFFFFFF
:
(RET)
<BUS>
3
16
1
3
1
32
16
32
3
4
5
Notes: The M option displays the memory map specified in the CPU information file.
1
2
3
4
5
Indicates the type of memory.
ROM:
Internal ROM area
EXT:
External bus area
NOT_A: Unused area
I/O:
Internal I/O area
RAM:
Internal RAM area
The first and last addresses of the memory area.
The number of states.
The width of the data bus.
This command allocates the area from H'F000000 to H'FFFFFFF as a stack area.
33
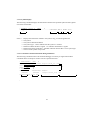
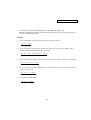
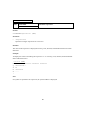
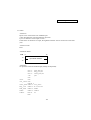
3.3.4 Displaying Section Load Addresses and Allocating Memory Areas
The following commands are used to determine at what addresses the program sections are loaded
and to change the section attributes.
: MAP (RET)
<START>
<END>
08000400 - 08000D83
09000000 - 09000064
09000068 - 090035AB
090035AC - 09003663
0F000000 - 0FFFFFFF
<ATTR>
R
RW
RW
RW
RW
<SECT_NAME>
P
D
B
dt
1
2
3
: MAP
5000000 5FFFFFF ;RW
(RET) 5
: MAP (RET)
<START>
<END>
<ATTR> <SECT_NAME>
05000000 - 05FFFFFF
RW
08000400 - 08000D83
R
P
09000000 - 09000064
RW
D
09000068 - 090035AB
RW
B
090035AC - 09003663
RW
dt
0F000000 - 0FFFFFFF
RW
:
4
6
Notes: The MAP command displays the currently allocated memory areas.
1
2
3
4
5
6
The first and last address of each section.
The section attribute.
R: Read-only
W: Write-only
RW: Read/write
The section name. Sections without a name include the vector area and those allocated
by the MAP command.
The memory areas.
08000400 to 08000D83 is section P
09000000 to 09000064 is section D
09000068 to 090035AB is section B
090035AC to 09003663 is section dt
0F000000 to 0FFFFFFF is stack area allocated with the MAP command.
This command allocates memory area.
The MAP command verifies the allocated memory areas.
34
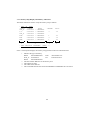
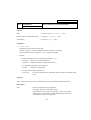
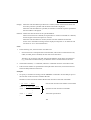
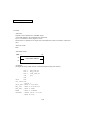
3.3.5 Disassembly Display
The following command disassembles 16 lines and displays the result. (When option I is specified
by the DEBUG-LEVEL command.)
: DISASSEMBLE 8000A78 (RET)
%prog.src!P:
1
08000A78
STS.L
PR,@-R15
08000A7A
MOV.L
R4,R0
08000A7C
MOV.L
%prog.src!PARM_1,R1
08000A7E
MOV.L
R0,@R1
08000A80
MOV.L
%prog.src!REQ_CD_1,R0
08000A82
MOV.L
%prog.src!TRP_AD_1,R3
08000A84
JSR
@R3
08000A86
NOP
08000A88
MOV.L
%prog.src!PARM_1,R3
08000A8A
MOV.L
@R3,R1
08000A8C
MOV.B
@R1,R0
08000A8E
CMP/EQ.L
#00000000,R0
08000A90
BT
%prog.src!R_EXIT
08000A92
MOV.L
#00000001,RO
08000A94
MOV.L
%prog.src!RTN_AD_1,R3
08000A96
BRA
%prog.src!R_RTN
2
3
4
:
Notes: 1
2
3
4
The line “%prog.src!P” is the symbol defined for address H'8000A78. Here,
“prog.src” is the file name and “P” is the label.
Note that “%prog.src!P” can be specified instead of H'8000A78.
The first address of the instructions.
The instruction mnemonics.
The instruction operand.
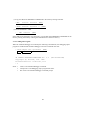
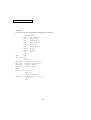
3.3.6 Checking Memory Contents
: DUMP stop_f @6 (RET)
1
address
+0
+2
+4
+6
+8
+A
+C
09002F48
0000 0000 0000 0000 0000 0000
2
3
+E
ASCII
.....
4
:
35
Notes: 1
2
3
4
This command displays six 2-byte blocks of data starting at the symbol “stop_f” in
hexadecimal.
The first address. Displayed in 16-byte units.
The contents of 12 bytes of data (six 2-byte blocks).
The contents of 3 as ASCII characters. Periods are displayed when the values cannot
be converted.
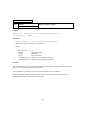
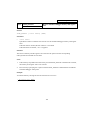
3.3.7 System Call Start Address
Line 24 of the sample program prog.src (see appendix D, Sample Program) inputs a single line
using the instruction JSR @R3. The starting address of the system call is specified with the
simulator/debugger TRAP_ADDRESS command as follows.
: TRAP_ADDRESS TRAP
:
Note: 1
(RET) 1
Specifies TRAP as the location for the start of the system call.
3.3.8 Setting and Checking Breakpoints
The following command sets a breakpoint so that the program will stop at location H'800040C.
: BREAK 800040C (RET) 1
: BREAK (RET)
2
<E/D> <ADDR> <COUNT> <COMMAND LINE> <SYMBOL
E
0800040C
1
------- %sample.c/main(#
3
Notes: 1
2
3
4
5
6
7
4
5
6
38)
7
Sets a breakpoint at address H'800040C.
Confirms the breakpoint settings.
The breakpoint enable or disable condition.
The location where the breakpoint is set.
The number of times the breakpoint has been passed.
Command to be executed when the program execution stops at the breakpoint.
Indicates the symbol corresponding to the location where the breakpoint is set. When
there is no corresponding symbol, nothing is displayed.
When there are multiple symbols corresponding to the same address, the displayed
symbol may be different from the symbol used in setting the breakpoint.
36
3.3.9 Starting a Trace
The following command starts acquiring trace information.
: TRACE_CONDITION
:
(RET)
3.3.10 Program Execution
The following command executes the debugging object program starting at the current value of the
program counter.
: GO (RET)
Exec instructions = 18
1
PC=0800040C SR=00000000:**********************------**-- SP=0FFFFFF8
GBR=00000000 VBR=00000000 MACH=00000000 MACL=00000000 PR=0800040C
R0-7
00000000 090035AC 00000000 08000CB8 09000020 00000000 00000000 00000000
2
R8-15 00000000 00000000 00000000 00000000 00000000 00000000 00000000 0FFFFFF8
08000ACE
LDS.L
@R15+,PR
3
BREAK POINT
:
Notes: 1
2
3
The number of instructions executed.
The contents of the registers at the point when the program stopped.
Indicates that the program has stopped at a breakpoint.
3.3.11 Single Step Execution
After the program has stopped at the breakpoint (H'800040C), the following command executes 3
instructions one at a time. At each step the executed instruction is displayed. (In this example, the
instruction following the delayed branch instruction is also executed because the third instruction
is a delayed branch instruction.)
37
: STEP_INTO 3;R
(RET)
PC=0800040E SR=00000000:**********************------**-- SP=0FFFFFF8
GBR=00000000 VBR=00000000 MACH=00000000
MACL=00000000 PR=0800040C
R0-7
00000000 090035AC 00000000 08000CB8 09003554 00000000 00000000 00000000
R8-15
00000000 00000000 00000000 00000000 00000000 00000000 00000000 0FFFFFF8
%sample.c#
0800040C
38
MOV.L
Read(f_name);
@(00000048,PC),R4
PC=08000410 SR=00000000:**********************------**-- SP=0FFFFFF8
GBR=00000000 VBR=000000000 MACH=00000000 MACL=00000000 PR=0800040C
R0-7
00000000 090035AC 08000A78 08000CB8 09003554 00000000 00000000 00000000
R8-15
00000000 00000000 00000000 00000000 00000000 00000000 00000000 0FFFFFF8
080040E
MOV.L
@(0000004C,PC),R2
PC=08000A78 SR=00000000:**********************------**-- SP=0FFFFFF8
GBR=00000000 VBR=000000000 MACH=00000000 MACL=00000000 PR=08000414
R0-7
00000000 090035AC 08000A78 08000CB8 09003554 00000000 00000000 00000000
R8-15
00000000 00000000 00000000 00000000 00000000 00000000 00000000 0FFFFFF8
08000410
JSR
@R2
PC=08000A78 SR=00000000:**********************------**-- SP=0FFFFFF8
GBR=00000000 VBR=00000000 MACH=00000000 MACL=00000000 PR=08000414
R0-7
00000000 090035AC 08000A78 08000CB8 09003554 00000000 00000000 00000000
R8-15
00000000 00000000 00000000 00000000 00000000 00000000 00000000 0FFFFFF8
08000412
NOP
STEP NORMAL END
:
38
3.3.12 Single Subroutine Execution
The following command executes 7 instructions starting at the current program counter
(H'8000406)). Each subroutine call is executed as a single step.
: STEP 7 (RET)
08000406
MOV.L
08000408
JSR
0800040A
NOP
0800040C
MOV.L
0800040E
MOV.L
08000410
JSR
08000412
NOP
STEP NORMAL END
:
@(0000004C,PC,)R3
@R3
@(00000048,PC),R4
@(0000004C,PC),R2
@R2
1
Note: 1 Indicates that a subroutine was executed within the specified range.
39
3.3.13 Trace Buffer Display
The following command displays the contents of the trace buffer.
: TRACE -17, @3;A
08000400
MOV.L
(RET)
1
R8,@-R15
2
PC=08000402 SR=00000000:**********************------**-- SP=0FFFFFFC
W=00000000
GBR=00000000 VBR=00000000 MACH=00000000 MACL=00000000 PR=00000000
R0-7
00000000 00000000 00000000 00000000 00000000 00000000 00000000 00000000
R8-15
00000000 00000000 00000000 00000000 00000000 00000000 00000000
0FFFFFFFC
08000402
3
STS.L
PR,@-R15
5
PC=08000404 SR=00000000:**********************------**-- SP=0FFFFFF8
W=00000000
GBR=00000000 VBR=00000000 MACH=00000000 MACL=00000000 PR=00000000
R0-7
00000000 00000000 00000000 00000000 00000000 00000000 00000000 00000000
R8-15
00000000 00000000 00000000 00000000 00000000 00000000 00000000
4 0FFFFFF8
08000404
MOV.L
@(00000048,PC),R4
PC=08000406 SR=00000000:**********************------**-- SP=0FFFFFF8
R=09000020
GBR=00000000 VBR=00000000 MACH=00000000 MACL=00000000 PR=0800000C
R0-7
00000000 00000000 00000000 00000000 09000020 00000000 00000000 00000000
R8-15
00000000 00000000 00000000 00000000 00000000 00000000 00000000 0FFFFFF8
:
Notes: 1
2
3
4
5
Displays 3 instructions from the trace buffer starting 17 instructions back. Option
“;A”specifies that all of the saved trace information is to be displayed.
The executed instructions are disassembled and displayed.
The contents of the registers after instruction execution.
“R=09000020” indicates that data H'9000020 was read from memory by the
instruction.
“W=00000000” indicates that data H'0 was written to memory by the instruction.
40
3.3.14 Symbol Display
The following command displays the information related to the specified symbol from the global
area of the load module.
: SYMBOL %!stop_f (RET)
1
stop_f.......................... 09002F48 VAR S WORD 0002
2
3
4
5
6
7
:
Notes: 1
2
3
4
5
6
7
Displays the information related to the symbol “stop_f” from the global area.
The symbol.
The symbol’s definition address.
The symbol type. “VAR” indicates that the symbol is variable.
Indicates whether the data is signed. “S” indicates that the data is signed.
Indicates the format of the data. “WORD” indicates that the data is a two byte integer.
The size of the symbol in byte units.
3.3.15 Automatic Command Execution during Simulation
The following command instructs the simulator/debugger to execute pre-registered simulator
commands when an attempt is made to execute a specified location.
: STUB 800055E {
(RET)
1
STUB> DISPLAY_CHARACTERS ENTRY %sample.c/Print_rec
STUB> REGISTER
STUB> }
: STUB
(RET)
(RET)
<ENTRY ADDR>
0800055E
(RET)
2
3
4
<RETURN ADDR> <SYMBOL>
0800055E
%sample.c/Print_rec(#
5
(RET)
%sample.c/Print_rec(#
85)
85)
6
7
:
41
8
Notes: 1
2
3
4
5
6
7
8
This command instructs the simulator/debugger to start stub execution when the
instruction at address H'800055E is about to be executed.
Specifies the stub execution commands. Here a command to display a message
confirming passage through the stub point and a command to display the contents of
the registers are specified. Note that “STUB>” is the prompt used by the STUB
command.
Indicates completion of the setting.
Confirms the setting.
The stub execution start address.
The simulation return address.
The symbol corresponding to the start address and its line number.
The symbol corresponding to the return address and its line number.
3.3.16 Coverage Range Display
The following command displays the coverage range. When no coverage range has been set, the
code sections of the debugging object program are used as the default value.
: SET_COVERAGE (RET)
coverage area
08000400 - 08000D83
1
2
:
Notes: 1
2
The starting address for coverage data acquisition.
The terminating address for coverage data acquisition.
3.3.17 Starting Coverage Data Acquisition
The following command starts the acquisition of coverage data. Since no coverage file is
specified, the file “temp.cov” is used.
: COVERAGE (RET)
coverage area
08000400 - 08000D83
:
42
3.3.18 Setting and Executing Sequential Breakpoints
The following command sets a breakpoint so that execution will stop when the debugging object
program passes through the 3 specified locations.
: BREAK SEQUENCE 80004BA 80009E8 8000566
: BREAK SEQUENCE
(RET)
(RET)
1
2
1st BREAKPOINT = 080004BA
%sample.c/Print_rec (#
78)
2nd BREAKPOINT = 080009E8
%sample.c/Bin_ascii (#
217)
3rd BREAKPOINT = 08000566
%sample.c/Print_rec (#
87)
3
4
5
<COMMAND LINE>
6
:GO
(RET)
ENTRY %sample.c/Print_rec
7
PC=0800055E SR=00000000:**********************------**-- SP=0FFFFE40
GBR=00000000 VBR=00000000 MACH=00000000 MACL=00000000 PR=0800055E
R0-7
8
00000000 0FFFFE44 08000030 0FFFFE45 0FFFFE45 00000000 00000000 00000000
R8-15 00000000 00000000 00000000 00000000 00000000 00000000 00000000 0FFFFE40
Exec instructions = 156
PC=08000566 SR=00000000:**********************------**-- SP=0FFFFE40
GBR=00000000 VBR=00000000 MACH=00000000 MACL=00000000 PR=08000566
R0-7
00000000 0FFFFE44 08000030 0FFFFE44 0FFFFE44 00000000 00000000 00000000
9
R8-15 00000000 00000000 00000000 00000000 00000000 00000000 00000000 0FFFFE40
%sample.c#
225
}
BREAK SEQUENCE
:
Notes: 1
2
3
4
5
6
7
8
9
This command instructs the simulator/debugger to stop at location H'8000566 (the last
location) when the 3 locations H'80004BA, H'80009E8, and H'8000566 are passed in
sequence.
This command displays the sequential breakpoint settings.
Indicates the setting order.
The breakpoint address.
The symbol corresponding to the breakpoint address.
Command to be executed when the program execution stops at the breakpoint.
The output for confirming passage through the point set by the STUB command.
Register display set by the STUB command.
At this point the sequential break conditions are satisfied and execution stops.
43
3.3.19 Coverage Information Display
This section lists the coverage information for each of the command options.
(1) T Option Specification
This option displays the C0 and C1 coverage values.
: DEBUG_LEVEL ;S (RET)
1
: DISPLAY_COVERAGE /Read_rec @14 ;T
C0: 44.0%
3
C1: 50.0%
4
:
Notes: 1
2
3
4
(RET)
2
This command sets the debug level to source code line units.
This command sets symbol /Read_rec as the coverage start address. Coverage is
performed for 20 lines from the start address.
The C0 coverage value
The C1 coverage value
44
(2) G Option Specification
The G option displays C0 coverage over a wide range.
: DISPLAY_COVERAGE /Read_rec @14 ;G
(RET)
%sample.c#
172 * void Read_rec()
%sample.c#
177 *
%sample.c#
179 .
Ph_read(phg_rec);
/*: First 256 bytes.
%sample.c#
180 .
Ph_read(phg_rec+256);
/*: First spare 256 bytes.
%sample.c#
181 .
phg_pos = (short)0;
/*: Index initialize.
%sample.c#
182 .
rec_num = (short)0;
/*: Physical record number
if (phg_pos == -1)
initialize
%sample.c#
185 *
phg_lng = phg_rec[phg_pos + 1];
%sample.c#
186 *
if (phg_lng < 0)
%sample.c#
188 .
%sample.c#
191 *
wi = (short)0;
%sample.c#
192 *
while (wi <phg_lng)
%sample.c#
194 .
%sample.c#
197 *
%sample.c#
200 .
%sample.c#
202 .
%sample.c#
205 .
Ph_read(&phg_rec[256]);
%sample.c#
206 .
phg_pos —= 256;
%sample.c#
207 .
%sample.c#
209 *
}
%sample.c#
214 .
void Bin_ascii(p)
1
phg_lng += 256;
/*: Adjust to unsigned char.
log_rec[wi++] = phg_rec[phg_pos++];
if (phg_pos > 255)
for (wi = (short)0; wi < (short)256; wi++)
phg_rec[wi] = phg_rec[wi + 256];
rec_num++;
2
3
:
Notes: 1
2
3
The file name and line number of the source code.
Indicates the coverage information symbolically.
• Asterisk (*): Indicates that this address was accessed and executed.
• Period (.):
Indicates that this line was not executed.
• Space (∆):
Indicates that there is no machine language corresponding to this
line.
Displays the source code in the coverage range.
45
46
Section 4 Simulator/Debugger Invocation and
Command Input
4.1 Invoking the Simulator/Debugger
The following command invokes the simulator/debugger.
%sdsh[˘{[<debugging object program file name>]
1
2
[[˘]-com=<command file name>][[˘]-cpu=<CPU information file name>]}
3
4
|-stat=<simulator state file name>] (RET)
5
Notes: 1
2
3
4
5
"sdsh" is the command name of the simulator/debugger installed on the host computer.
The file name of the debugging object program loaded when the simulator/debugger
starts. When the file extension is omitted ".abs" is used as the default.
When the -com command line option is specified, the simulator/debugger reads a
command from the file whose name is specified following the equal sign (=) and
executes it.
When the -cpu command line option is specified, the simulator/debugger creates a
memory map from the information stored in the CPU information file whose name is
specified following the equal sign (=). When the file extension is omitted ".cpu" is
used as the default.
The state at the time a SAVE_STATUS command was executed in a previous
debugging session can be restored by specifying the simulator state file following an
equal sign (=) with the -stat command line option. When the file extension is omitted
".sav" is used as the default.
4.2 Exiting the Simulator/Debugger
To exit the simulator/debugger, enter the following simulator command line.
: QUIT (RET)
%
47
4.3 Simulator/Debugger Commands
Table 4-1 lists the simulator/debugger commands.
Table 4-1 Simulator/Debugger Commands
No.
Command
Abbreviation
Function
1
ASSEMBLE
A
Assembles line by line
2
BREAK
B
Sets, displays, and cancels breakpoints
based on the instruction execution address
3
BREAK_ACCESS
BA
Sets, displays, and cancels break conditions
based on memory range access
4
BREAK_DATA
BD
Sets, displays, and cancels break conditions
based on memory data values
5
BREAK_REGISTER
BR
Sets, displays, and cancels break conditions
based on register data values
6
BREAK_SEQUENCE
BS
Sets, displays, and cancels breakpoints
based on specified execution sequences
7
CALL
CA
Calls a function
8
COMMAND_CHAIN
CC
Executes commands from a file
9
COMPARE
CMP
Compares memory contents
10
CONVERT
CV
Calculates expression
11
COVERAGE
COV
Starts and stops coverage measurement
12
DATA_SEARCH
DS
Searches for data
13
DEBUG_LEVEL
DL
Specifies debug level
14
DISASSEMBLE
DA
Disassembles and displays memory
contents
15
DISPLAY_CHARACTERS
DCH
Displays character string
16
DISPLAY_COVERAGE
DCV
Displays coverage data
17
DUMP
D
Displays memory contents
18
EXEC_MODE
EM
Switches execution mode
19
FILL
F
Initializes memory area
20
GO
G
Executes instructions continuously
21
HELP
HE
Displays command name and input format
22
LOAD
L
Loads file
23
LOAD_STATUS
LS
Restores simulator/debugger memory and
register state
48
Table 4-1 Simulator/Debugger Commands (cont)
No.
Command
Abbreviation
Function
24
MACRO
MA
Defines, displays, executes, and deletes
simulator/debugger command macros.
25
MAP
MP
Defines, displays, modifies, and deletes
memory areas.
26
MEMORY
M
Modifies memory contents
27
MOVE
MV
Copies memory block
28
PRINT
P
Executes history file
29
QUIT
Q
Exits the simulator/debugger
30
RADIX
RX
Sets the radix
31
REGISTER
R
Displays register contents
32
RESET
RS
Resets the simulator/debugger
33
SAVE
SV
Saves memory data to a file
34
SAVE_STATUS
SS
Saves the current simulator/debugger state
in a file
35
SCOPE
SCP
Displays the name of function at the current
execution address.
36
SET_COVERAGE
SCV
Sets coverage range
37
SHOW_CALLS
SHC
Displays function call
38
STEP
S
Performs step execution in subroutine units
39
STEP_INTO
SI
Performs step execution
40
STUB
SB
Executes command during simulation
41
SYMBOL
SY
Displays symbol information
42
TRACE
T
Displays trace buffer
43
TRACE_CONDITION
TC
Sets trace condition, and starts or stops
trace
44
TRAP_ADDRESS
TA
Sets, displays, and clears the system call
start address
45
TYPE
TY
Displays variable value
46
VECTOR
V
Executes from an interrupt vector address
47
.<register>
—
Modifies register contents
48
!
—
Invokes sub-process
49
4.4 Specifying Command Parameters
The simulator/debugger commands allow parameter specification. This section describes the
aspects of parameter specification common to all commands. Refer to section 5,
Simulator/Debugger Commands, for more information on the command parameters.
4.4.1 Expressions
Expressions (integer expressions) consist of terms, operators, and parentheses.
Operations are performed in 32-bit unsigned operations, and overflows during operation is
ignored. However, divide by zero and floating-point operations generate errors.
(1) Terms
The following terms can be used in integer expressions.
a.
Numeric constants
Numeric constants represent 32-bit integer constants. Numeric constants can be prefixed with
B', Q', D', or H' to represent binary, octal, decimal, or hexadecimal constants respectively.
When the prefix is omitted, the base specified with the RADIX command is used.
Examples: Binary constant:
Octal constant:
Decimal constant:
Hexadecimal constant:
B'1010
Q'4567
D'1234
H'A4FF
Note that a leading zero must be inserted at the head of a hexadecimal constant when the first
digit is A to F and the H' prefix is omitted.
Example: To write “H'A0” without the prefix, use “0A0”.
50
b.
Register values
Register value terms represent the current value stored inside the register at the time they are
evaluated. Register values are zero-extended to 32-bit integer values.
R0
|
R15
SP
PC
SR
GBR
VBR
MACH
MACL
PR
c.
Symbols
Symbols represent an address or constant value.
The syntax for symbols is shown below.
• [!]symbol[.member name[...]]
• %file name
• /function name
The <function name> indicates a C function. It is not used with assembler language symbols.
Although alphanumerics and the $ and _ characters can be used in symbols (as well as
function and member names), symbols, function names, and member names must be 32 or
fewer characters in length, and must start with either a letter, the “$” character, or the “_”
character.
Upper and lower case letters are distinguished.
Member names express elements of structures or unions. Member names are not used with
assembler language symbols.
51
There are three classes of symbol scope in C: global symbols which are valid over the whole
program, static symbols that are valid in a single file, and local symbols that are valid within a
function.
If a symbol is specified, the simulator debugger searches for it with local symbols in the
currently valid function, static symbols in the file, and global symbols valid in the whole
program, in that order. The simulator debugger allows the following specifications to refer to
the same symbols of other level, or those included in other functions or files.
• /function!symbol
Refers to the local symbols in the specified function
• %file!symbol
Refers to the static symbols in the specified file
• %!symbol
Refers to the specified global symbol
The valid file and function names can be determined with the SCOPE command. For both file
names and symbol names, items specified with upper case letters and items specified with
lower case letters will be treated as distinct objects.
Examples:
Caution:
%main.c!sym
Indicates the symbol "sym" which appears in the file
"main.c".
/func!sym
Indicates the symbol "sym" which appears in the
function "func".
!TEST
Indicates the symbol TEST that is included in the file
that the program counter is currently pointing to.
%!sym
Indicates the global symbol "sym".
The following points require caution when programs written in C and programs
written in assembler are linked together.
When an assembler language subroutine is to be called from a C program, the
subroutine name in the assembler language program must begin with an
underscore (_) character.
52
Example:
C source
Read(&b)
Assembler source
.EXPORT _Read
_Read:
To apply a breakpoint to this “Read” subroutine, either of the following commands can be
used.
• From C:
BREAK _Read
• From assembler: BREAK _Read
d.
Indirect memory values
The contents of an address can be referenced by prefixing the address with an asterisk (*).
Examples: *1000: Indicates the contents of address H'1000.
*R1:
Indicates the contents of the address pointed to by register R1.
e.
Line numbers
Line numbers are preceded by a number sign (#).
The value of a line number is the address of the first location in the machine language code
into which that line was compiled.
Since line numbers should have consecutive values within a single file, they must generally be
prefixed by a file name. If the file name is omitted, the file that includes the current value of
the program counter will be used.
The syntax for line numbers is shown below.
[%<file name>]#<line number>
Line numbers are always expressed in decimal.
The RADIX command has no influence on the interpretation of line numbers.
Examples:
Caution:
%sub.c#100
Indicates line 100 in the file “sub.c”.
#120
Indicates line 120 in the file which includes the current value
of the program counter.
•
Line number specification is only valid when debugging information output
was specified during compilation. Also, if the specified line number is a line
number for which debugging information was not output, an error occurs.
53
f.
Special symbols that can be used as location specifiers
The following special symbols can be used for location specification.
•
@RTN:
Return address of a function
Usage example:
GO ,@RTN (RET)
Execution will stop at the point the currently executing
function returns.
•
@END:
The last address in a file or function.
Usage example:
DA %file.c/func @END (RET)
This command disassembles and displays the function
func from its first location to its last.
54
(2) Operators
Table 4-2 shows the operators that can be used in expressions and their priorities.
Table 4-2 Operators and Operator Priorities
Priorities
Symbol
Description
1
.
Structure member operator
–>
Structure member operator
+
Plus sign
(unitary operator)
–
Minus sign
(unitary operator)
~
Bit inversion
(unitary operator)
*
Pointer
(unitary operator)
&
Address operator
(unitary operator)
*
Multiplication
/
Division
+
Addition
–
Subtraction
<
Less than
(relational operator)
<=
Less than or equal
(relational operator)
>
Greater than
(relational operator)
>=
Greater than or equal
(relational operator)
==
Equal
(relational operator)
!=
Not equal
(relational operator)
7
&
Logical and
8
^
Logical exclusive or
9
|
Logical or
10
=
Assign the left hand side to the right hand side
(assignment operator)
2
3
4
5
6
Relational operators are used to compare the values on the right and left sides. If the comparison
is true, the value of the operation is H'FFFFFFFF, and if the comparison is false, H'00000000.
Parentheses can be used to override the operator precedence.
Assignment operator can only be used within the MACRO command.
55
4.4.2 Locations
Location expressions are expressions whose values are addresses. Instruction locations cannot
contain automatic variables or pointer variables.
The following symbols can be used for locations:
Variable name, label, function name, file name: Symbol addresses
EQUATE name: Symbol values
Note, however, that symbols defined for registers cannot be used for locations.
Examples:
1000
Indicates location 1000.
!ABCD
Indicates the address of the symbol ABCD in the file associated with the
current value of the program counter.
#100
Indicates the address of line 100 in the file associated with the current
value of the program counter.
4.4.3 Data
Data expressions consist of an expression and a size indicator.
The syntax for data expressions is shown below.
<expression>[:<size>]
size: B (byte): 8 bits
W (word): 16 bits
L (long): 32 bits
Word is the default size when the size specification is omitted.
When the value of the expression is larger than the size, the overflow digits are ignored, i.e., only
the lower order <size> digits are valid.
56
The following symbols can be used for data:
Variable name and label: Symbol contents
Function name and file name: Symbol addresses
EQUATE name: Symbol values
Example: The data expression H'1234:B has the same value as the expression H'34:B.
4.4.4 Floating Point Data
Floating point constants are either single (S) or double (D) precision and have the following
syntax.
F’[{–}] { n[.[m]] } [t[[{–}] xx]]
.m
F':
n:
m:
±:
t:
Prefix indicating floating-point data. Cannot be omitted.
Integer part (in decimal)
Fraction part (in decimal)
Sign. + is is the default at omission.
Precision specifier. S is the default when the precision specifier is omitted.
S = Single precision
D = Double precision
xx: Exponent part (in decimal). 0 is the default when the exponent specification is
omitted.
Examples: F’1.S
F’.1D-2
Specifies 1.0 in single precision.
Specifies 0.1 × 10⁻² in double precision.
4.4.5 Character Strings
Character strings are handled as data sequences consisting of the ASCII code of each character in
turn, and are enclosed by double quotation marks. To include a double quotation mark in a
character string, insert two double quotation marks in sequence. To include a non-text ASCII
code, surround the numeric constant representing the code in angle brackets. Note however, that
the <numeric constant> notation can only be used with the MEMORY and DATA_SEARCH
commands.
Example: "ABCDEF"<0A>
Note when the number of characters within the double quotation marks is four or less, the string is
handled as a character constant.
57
4.4.6 File Names
File name notations must follow the restrictions on file names imposed by the operating system.
File names can be optionally enclosed in double quotation marks.
4.4.7 Comment Lines
Lines beginning with a semicolon are treated as comment lines by the simulator/debugger. The
simulator/debugger takes no action for comment lines.
4.4.8 Limitations on C Expressions
Table 4-3 lists the limitations on C expressions used in command parameters.
Table 4-3 C Expression Limitations and Workarounds
No.
Limitation
Workaround
1
Arrays are limited to 2 dimensions
Acquire the starting address of 3-dimensional or
greater arrays with the SYMBOL command and
then specify the address by computing the index
with an expression.
2
Parentheses are limited to 8 nesting
levels
Simplify the structure of the parameter to reduce
the number of parentheses.
3
Pointers and arrays are limited to
8 levels
Simplify the data structures or specify the
reference with an address.
Pointers: * * * * * * * *p t r
Arrays: a [ b [ c [ d [ e [ f [ g [ h [ 0 ] ] ] ] ] ] ] ]
58
Section 5 Simulator/Debugger Commands
This section provides detailed descriptions of the individual simulator/debugger commands.
Figure 5-1 shows the command description format used in this section.
5
2
1
4
3
Format
6
Parameter
7
Function
8
Description
9
Note
0
Example
q
Figure 5-1 Command Description Format
The numbered items in the above format are described below.
1
2
3
4
5
6
Section number
Command name
Command abbreviation
Command function
Command name
Input format for the command
59
7
8
9
0
q
Description of command parameters and options.
• Options indicated as "start-up settings" are defaults at start-up only. As a result,
specifying these command options creates new default values to be used if the options are
omitted next time.
• Options indicated as "default" are not influenced by previous specifications if later
omitted, i.e. these defaults do not change. However, in commands such as the DUMP
command that continuously display memory, the value of the memory start address option
is inherited from the previous command specification if omitted.
Command function.
Command description.
Notes on command usage.
Usage examples.
60
ASSEMBLE
5.1
ASSEMBLE
Assembles line by line
A
Format
ASSEMBLE∆<start address>(RET)
Parameter
•
<start address>
Indicates the address to store the results of assembly.
Function
This command converts assembly language notations to machine language in line units and stores
the results starting at the indicated start address. Long word or word integer can be defined by the
.DATA directive.
Description
1.
When this command is entered, the current contents of the specified address are displayed and
the command enters interactive mode. The display and input format are as follows.
ASSEMBLE <start address> (RET)
<instruction mnemonic>
address xxxx ? <assembly language or .DATA notation> (RET)
address xxxx ? <assembly language or .DATA notation> (RET)
:
:
address xxxx ? . (RET)
The above terms are described below:
<instruction mnemonic> : The current disassembled contents of the start address.
address
: The start address.
xxxx
: The value of the first two bytes of the memory address
indicated by “address”.
periods (.)
: Terminates the line assembly command.
61
ASSEMBLE
2.
The following processing is performed if only (RET) is entered.
•
Prior to assembly language notation input
The address counter is advanced to value equal to the current address plus the instruction
length, the instruction mnemonic is displayed, and the command waits for assembly language
notation input.
•
After assembly language notation input
The address counter is advanced to the current address plus 2, and the command waits for
assembly language notation input.
Notes
1.
Refer to the SH-Series Cross Assembler User’s Manual for details on assembly language
syntax and the .DATA directive.
2.
Refer to appendix A, Differences Between SH-Series Cross Assembler Syntax and Line
Assembly Command, for differences between the notations used with this command and those
of the cross assembler.
Example
To interactively input assembly language expressions, convert them to machine language, and store
them starting at address H'400:
: ASSEMBLE 400 (RET)
00000400 MOV.L
#0000002E,R1
00000400 E12E ?
(RET)
00000402 MOV.L
#FFFFFFF,R2
00000402 E2FF ?
MOV.L #0FF,R3 (RET)
00000404 0009 ?
ADD R1,R2 (RET)
00000406 0009 ?
.(RET)
: DISASSEMBLE 400 @3 (RET)
00000400
MOV.L
#0000002E,R1
00000402
MOV.L
#FFFFFFFF,R3
00000404
ADD.L
R1,R2
:
62
BREAK
5.2
BREAK
B
Sets, displays, and cancels breakpoints based on
instruction execution address
Format
Set:
BREAK∆<instruction address>[∆<repeat count>]
[;"<command line>"] (RET)
Enable/disable: BREAK∆<instruction address>;{E|D} (RET)
Display:
BREAK (RET)
Cancellation:
BREAK-[∆<instruction address>] (RET)
Parameters
•
<instruction address>
Specifies the address of the breakpoint.
•
<repeat count>
Specifies the number of times the instruction of the specific position is fetched before
breaking. (A value between H'1 and H'3FFF; default is H'1.)
•
Option
— Enable/disable {E|D}
E (enable):
Enables previously set breakpoints.
D (disable):
Disables previously set breakpoints.
•
<command line>
Specifies a certain command line to be executed when the break occurs. To indicate a double
quotation mark in a character string, insert two double quotation marks in sequence.
Function
Sets, displays, and cancels breakpoints based on instruction execution address.
When the instruction at the specified address has been fetched the specified number of times
during execution by a CALL, GO, STEP, STEP_INTO, or VECTOR command, instruction
execution is stopped.
63
BREAK
Description
Set:
Sets a break address and count.
Program execution stops before the instruction at the break address is executed.
Up to 8 breakpoints can be set.
Note that breakpoints are automatically enabled when a breakpoint is set.
Enable/disable: Allows breaking to be enabled or disabled without changing the breakpoint
settings.
Display:
Displays the breakpoints set with the BREAK command.
Cancellation:
Cancels (clears) the breakpoints set with the BREAK command.
If no instruction addresses are specified, all breakpoints set with the BREAK
command are removed. In this case a confirmation message will be displayed.
Enter "Y" to remove all breakpoints or "N" to cancel the removal.
Notes
1.
If a breakpoint is set at any address other than the first byte of an instruction, the break will
not be detected.
2.
The execution count is reset at the point that instruction execution stops.
3.
If a breakpoint is set at an instruction following a delayed branch instruction, execution stops
at the start address of the delayed branch instruction.
4.
If conditions specified with the BREAK and BREAK_SEQUENCE commands are satisfied
simultaneously, the command line specified with the BREAK command is executed first.
64
BREAK
Examples
1.
To set a breakpoint that breaks just prior to the eighth time the instruction at address H'2000 is
about to be executed, and to execute the REGISTER command after stopping at the
breakpoint:
: B 2000 8 ;"REGISTER" (RET)
:
2.
To disable the break at address H'2000:
: B 2000 ;D (RET)
:
3.
To display currently set breakpoints (note that addresses and counts are displayed in
hexadecimal):
: B (RET)
<E/D> <ADDR> <COUNT>
D
00002000
8
:
4.
<COMMAND LINE>
"REGISTER"
To clear the breakpoint at address H'2000:
: B- 2000 (RET)
:
65
<SYMBOL>
%file.c!symbol(#
100)
BREAK_ACCESS
5.3
BREAK_ACCESS
BA
Sets, displays, and cancels break conditions based
on access to a range of memory
Format
Set:
BREAK_ACCESS∆<start address>[∆{<end address>|@<byte
count>}] [;[{R|W|RW}][,"<command line>"]] (RET)
Enable/disable: BREAK_ACCESS∆<start address>;{E|D} (RET)
Display:
BREAK_ACCESS (RET)
Cancellation:
BREAK_ACCESS-[∆<start address>] (RET)
Parameters
•
<start address>∆{<end address>|@<byte count>}
Specifies the start address or the range of memory for which the simulator/debugger will stop
if accessed by the object program being debugged.
When the end address is not specified, the range consists of only the specified address.
•
Options
— Access type {R|W|RW}
R (read):
Break on a read from the specified memory.
W (write):
Break on a write to the specified memory.
RW (read/write): Break on either a read or a write. (default)
— Enable/disable {E|D}
E (enable):
Enables previously set break conditions.
D (disable):
Disables previously set break conditions.
•
<command line>
Specifies a command line to be executed when the break occurs. To indicate a double
quotation mark in a character string, insert two double quotation marks in sequence.
Function
This command sets, displays, and cancels breakpoints based on access to a specified memory
address or range.
66
BREAK_ACCESS
Instruction execution stops when the break condition (access of the specified type to the specified
memory area) is satisfied during program execution due to a CALL, GO, STEP, STEP_INTO, or
VECTOR command.
Description
Set:
Sets a breakpoint so that program execution stops on an access of the specified
type to the specified memory range.
Up to two memory ranges can be specified.
Note that breakpoints are automatically enabled when a breakpoint is set.
Enable/disable: Allows breaking to be enabled or disabled without changing the breakpoint
settings.
Display:
Displays the breakpoints set with the BREAK_ACCESS command.
Cancellation:
Cancels (clears) the breakpoints set with the BREAK_ACCESS command.
If no addresses are specified, all breakpoints set with the BREAK_ACCESS
command are removed. In this case, a confirmation message will be displayed.
Enter "Y" to remove all breakpoints or "N" to cancel the removal.
Note
If conditions specified with the BREAK_ACCESS, BREAK_DATA, and BREAK_REGISTER
commands are satisfied simultaneously, the corresponding command lines are executed in that
order.
Examples
1.
To set a breakpoint so that execution stops when a read or a write to memory in the range from
address H'1000 to H'1100 occurs, and to execute the REGISTER command after stopping at
the breakpoint:
: BA 1000 1100 ;RW, "REGISTER" (RET)
:
2.
To disable the breakpoint at address H'1000:
: BA 1000 ;D (RET)
:
67
BREAK_ACCESS
3.
To display the currently set breakpoints:
: BA (RET)
<E/D>
D
<START>
00001000
<END>
00001100
<ATTR>
<COMMAND LINE>
RW
“REGISTER”
:
4.
To clear the breakpoint at address H'1000:
: BA- 1000 (RET)
:
68
<SYMBOL>
%file.c!table_a (#
4)
BREAK_DATA
5.4
BREAK_DATA
BD
Sets, displays, and cancels breakpoints based on the
value of memory data
Format
Set:
BREAK_DATA∆<break address>∆{<data>[:<size>][∆<mask>]|
<real number>}[;[{EQ|NE}][,"<command line>"]] (RET)
Enable/disable: BREAK_DATA∆<break address>;{E|D} (RET)
Display:
BREAK_DATA (RET)
Cancellation:
BREAK_DATA-[∆<break address>] (RET)
Parameters
•
<break address>
Specifies the address whose contents are to be checked during execution.
•
<data>[:<size>]
Specifies the accessed data.
Although word is the default size, when the break address corresponds to a high-level
language variable, the size of that variable will be used.
•
Data size {B|W|L}
B (byte):
W (word):
L (long):
Byte data
Word data
Long word data
•
<mask>
Only the bits for which the mask is set to 1 will be compared.
When omitted, all bits are compared.
Note that a mask may not be specified when a real number is specified.
•
<real number>
Specifies floating point number.
69
BREAK_DATA
•
Options
— Data match/differ {EQ|NE}
EQ (equal):
Break when the data matches. (default)
NE (not equal): Break when the data differs.
— Enable/disable {E|D}
E (enable):
Enables previously set break conditions.
D (disable):
Disables previously set break conditions.
•
<command line>
Specifies a command line to be executed when the break occurs. To indicate a double
quotation mark in a character string, insert two double quotation marks in sequence.
Function
This command sets, displays, and cancels breakpoints based on data written to memory.
Instruction execution stops when the break condition (data written to the specified memory address
matches/differs from the specified value) is satisfied during program execution due to a CALL,
GO, STEP, STEP_INTO, or VECTOR command.
Description
Set:
Sets up to 8 breakpoints based on the data value written to memory.
Note that breakpoints are automatically enabled when a breakpoint is set.
Display:
Displays the breakpoints set with the BREAK_DATA command.
Cancellation: Cancels (clears) the breakpoints set with the BREAK_DATA command.
If no arguments are specified, all breakpoints set with the BREAK_DATA
command are removed. In this case a confirmation message will be displayed.
Enter "Y" to remove all breakpoints or "N" to cancel the removal.
Note
If conditions specified with the BREAK_ACCESS, BREAK_DATA, and BREAK_REGISTER
commands are satisfied simultaneously, the corresponding command lines are executed in that
order.
70
BREAK_DATA
Examples
1.
To set a breakpoint so that execution stops when word-size data with the value 10 is written to
address H'2000 and execute the REGISTER command after stopping at the breakpoint:
: BD 2000 10:W ;,"REGISTER" (RET)
:
2.
To set a breakpoint so that execution stops when byte-size data with a value other than 20 is
written to address H'AF00:
: BD 0AF00 20:B ;NE (RET)
:
3.
To set a breakpoint so that execution stops when a byte-size data whose lower 2 bits have the
value 10 is written to address H'FF00:
: BD 0FF00 2:B 3 (RET)
:
4.
To disable the breakpoint at address H'2000:
: BD 2000 ;D (RET)
:
5.
To generate a break if 100 is written to symbol rsym:
: BD rsym 100 (RET)
:
71
BREAK_DATA
6.
To display the currently set breakpoints (note that addresses, data, and masks are displayed in
hexadecimal):
: BD (RET)
<E/D>
<ADDR>
D
00002000
E
0000AF00
E
0000FF00
E
R4
<DATA>
<MASK>
0010:W
---20:B
---02:B
03
00000100:L
--------
<EQ/NE> <COMMAND LINE>
<SYMBOL>
EQ
"REGISTER"
%file.c!a(#
4)
NE
-------------%file.c!b(# 236)
EQ
-------------%file.c!c(# 246)
EQ
-------------rsym
:
If a symbol assigned to a register is specified as a break addresses, the register name is
indicated at <ADDR>.
7.
To clear the breakpoint at address H'FF00:
: BD- 0FF00 (RET)
:
72
BREAK_REGISTER
5.5
BREAK_REGISTER
BR
Sets, displays, and cancels break conditions based
on the value of data in a register
Format
Set:
BREAK_REGISTER∆<register>∆[∆<data>[:<size>][∆<mask>]]
[;[{EQ|NE}][,"<command line>"]] (RET)
Enable/disable: BREAK_REGISTER∆<register>;{E|D} (RET)
Display:
BREAK_REGISTER (RET)
Cancellation:
BREAK_REGISTER-[∆<register>] (RET)
Parameters
•
<register>
Specifies the register for which the break is to be set. SP can be specified instead of R15.
•
<data>[:<size>]
Specifies the data value for the break condition.
When the size is omitted, the register size is used as default.
•
Data size {B|W|L}
B (byte): Byte data
W (word): Word data
L (long): Long word data
•
<mask>
Only the bits for which the mask is one will be compared.
When omitted, all bits are compared.
•
Options
— Data match/differ {EQ|NE}
EQ (equal):
Break when the data matches. (default)
NE (not equal): Break when the data differs.
— Enable/disable {E|D}
E (enable):
Enables previously set break conditions. (default)
D (disable):
Disables previously set break conditions.
73
BREAK_REGISTER
•
<command line>
Specifies a command line to be executed when the break occurs. To indicate a double
quotation mark in a character string, insert two double quotation marks in sequence.
Function
This command sets, displays, and cancels breakpoints based on data written to the CPU registers.
Instruction execution stops when the break condition (data written to the specified register matches
the specified value) is satisfied during program execution due to a CALL, GO, STEP,
STEP_INTO, or VECTOR command.
When the data value in the BREAK_REGISTER command is omitted, the simulator/debugger
stops execution on any write, regardless of the data value, to the specified register.
Description
Set:
The command sets a break condition so that execution stops when the specified
register is accessed. Note that breakpoints are automatically enabled when a
breakpoint is set.
Up to 8 breakpoints can be set.
Enable/disable: Allows breaking to be enabled or disabled without changing the breakpoint
settings.
Display:
Displays the breakpoints set with the BREAK_REGISTER command.
Cancellation:
Cancels (clears) the breakpoints set with the BREAK_REGISTER command.
All breakpoints set with the BREAK_REGISTER command are removed if the
register is omitted from the break removal form of the command.
In this case, a confirmation message will be displayed. Enter "Y" to remove all
breakpoints or "N" to cancel the removal.
Notes
1.
If a break condition is satisfied at a delayed branch instruction, execution stops at the branch
destination.
74
BREAK_REGISTER
2.
If conditions specified with the BREAK_ACCESS, BREAK_DATA, and
BREAK_REGISTER commands are satisfied simultaneously, the corresponding command
lines are executed in that order.
Examples
1.
To set a breakpoint so that execution stops whenever R0 is written:
: BR R0 (RET)
:
2.
To set a breakpoint so that execution stops if the value FF is written to register R1, and to
execute the REGISTER command after the break:
: BR R1 0FF ;,"REGISTER" (RET)
:
3.
To set a breakpoint so that execution stops if any value other than FF is written to register R2:
: BR R2 0FF ;NE (RET)
:
4.
To set a breakpoint so that execution stops if a value whose lower two bits have the value 10 is
written to register R10:
: BR R10 2 3 (RET)
:
5.
To disable the breakpoint R1:
: BR R1 ;D (RET)
:
75
BREAK_REGISTER
6.
To display the currently set breakpoints (note that data and masks are displayed in
hexadecimal):
: BR (RET)
<E/D> <REGISTER>
E
R0
D
R1
E
R2
E
R10
<DATA> <EQ/NE>
<MASK>
-------EQ
-------000000FF
EQ
-------000000FF
NE
-------00000002
EQ
00000003
:
7.
To clear the breakpoint R0:
: BR- R0 (RET)
:
76
<COMMAND LINE>
"REGISTER"
BREAK_SEQUENCE
5.6
BREAK_SEQUENCE
BS
Sets, displays, and cancels breakpoints based on a
specified execution sequence
Format
Set:
BREAK_SEQUENCE∆<instruction address>[∆<instruction
address>[∆<instruction address>[...]]]
[;"<command line>"](RET)
Display:
BREAK_SEQUENCE (RET)
Cancellation:
BREAK_SEQUENCE- (RET)
Parameters
•
<instruction address>
Specifies the address(es) that will form the sequential breakpoint condition.
•
<command line>
Specifies a command line to be executed when the break occurs. To indicate a double
quotation mark in a character string, insert two double quotation marks in sequence.
Function
This command sets, displays, and cancels a breakpoint based on a specified execution sequence.
Instruction execution stops when the break condition (sequential execution of the specified
addresses) is satisfied during program execution due to a CALL, GO, STEP, STEP_INTO, or
VECTOR command.
Description
Set:
Sets a break condition so that execution stops at the last specified address when the
instructions at the specified addresses have been executed in the specified order.
Note that a sequence of up to 8 addresses can be specified with this command.
Display:
Displays the breakpoints set with the BREAK_SEQUENCE command.
Cancellation: Cancels (clears) the breakpoints set with the BREAK_SEQUENCE command.
77
BREAK_SEQUENCE
Notes
1.
If a breakpoint is set at any address other than the first byte of an instruction, the break will
not be detected.
2.
The execution sequence condition is reset at the point that instruction execution is stopped.
3.
If the instruction following a delayed branch instruction is specified as the last instruction
address, execution stops at the start address of the delayed branch instruction.
4.
If conditions specified with the BREAK and BREAK_SEQUENCE commands are satisfied
simultaneously, the command line specified with the BREAK command is executed first.
Examples
1.
To set a sequential breakpoint for addresses H'2000, H'2100, and H'3000, and to execute the
REGISTER command after break:
: BS 2000 2100 3000 ; "REGISTER" (RET)
:
Execution will break when execution has passed addresses H'2000, H'2100, and H'3000.
Note that “passing an address” is defined as “passing at least once”. Thus, the breakpoint
sequence is not reset when an address is executed more than once.
2.
To display the currently set sequential breakpoint:
: BS (RET)
1ST BREAK POINT = 00002000 %file.c!entry_add(# 36)
2ND BREAK POINT = 00002100 %file.c!entry_sub(# 58)
3RD BREAK POINT = 00003000 %file.c!entry_mult(# 102)
<COMMAND LINE>
"REGISTER"
3.
To clear the sequential breakpoint:
: BS- (RET)
:
78
CALL
5.7
CALL
Calls a function
CA
Format
CALL∆<function name>([[<argument>],[<argument>]...])
[∆<return address>] (RET)
Parameters
•
<function name>
Specifies the name of the function to be simulated.
•
<argument>
These parameters specify the arguments to the function.
The arguments are pushed onto the stack in order from right to left.
Expressions which represent data values (including floating point values) can be used as
arguments. Data items are stored on the stack in the specified size.
Up to 63 arguments can be specified.
When arguments are omitted, zero (0) is assumed.
•
<return address>
Specifies the address to store the return value.
Function
This command creates the stack frame required by C language functions, and calls the specified
function. It can be used for testing individual functions. Execution stops if an error occurs or a
break condition is satisfied.
Description
Usage:
The command line specifies the arguments to be passed to the function, and the
address to store the return value.
This specification creates the stack frame, sets up the SP, PC and PR registers,
and executes the function.
The following values are loaded into the SP, PC, and PR.
• SP: The SP is automatically decremented by an amount corresponding to the
size of the area allocated.
• PC: The PC is set to the entry address of the specified function.
• PR: The PR indicates the current PC address.
79
CALL
The format of the stack frame is as follows.
1.
Stack frame when a register is used to pass the return value.
This format is used when the register is equal to or larger than the size of the returned data.
High
Argument 1
Address
.
.
.
Low
Argument n
When the function completes and returns, the return value is copied from register R0 to the
specified address. However, if no return value storage address is specified, the value is not
copied.
2.
Stack frame when the return value is passed to the specified address.
This format is used when the size of the return value is greater than the CPU register size, and
the return value address was specified in the CALL command.
High
Return value area address
Argument 1
Address
.
.
.
Low
Argument n
The return area address is set to the return value address specified in the command line.
80
CALL
3.
Stack frame when the return value is passed on the stack.
This format is used when the size of the return value is larger than the CPU register size, and
the return value address was not specified in the CALL command.
High
Return value area address
Argument 1
Address
.
.
.
Argument n
Low
Return value area
Since the return value address was not specified, a return value area is allocated on the stack,
and the return value is stored in that area.
The value of the stack pointer must be set to an appropriate value beforehand, since the current
stack area, registers, and memory areas are used during function execution.
Note that the SAVE_STATUS and LOAD_STATUS commands can be used to restore the system
to the simulator/debugger state prior to function execution after executing a function with the
CALL command.
Refer to the SH-Series C Compiler User’s Manual for more information on the function call
interface.
Note
If optimization is performed at compilation, arguments may be stored in the registers instead of on
the stack.
81
CALL
Examples
1.
To call the function “func1” with the arguments 1 and 10, and to store the return value at
address 5000:
: CA /func1(1,10) 5000 (RET)
:
2.
To show the setup required to test the function “func2” shown below. The results of the
arithmetic operations are stored starting at address H'1800:
func2(p,i,j)
int *p ;
int i,j ;
{
*p++ = i +
*p++ = i –
*p++ = i *
*p++ = i /
}
j
j
j
j
;
;
;
;
: L test2.obj (RET)
UNDEFINED SYMBOL : symbol
: MP 1000 @1000 (RET)
: .R15 1800 (RET)
: CA /func2(1800,50,10) (RET)
Loads the file test2.obj.
Allocates the stack and return areas.
Initializes the stack pointer.
The return address will be H'100, i.e., the current value of the
PC.
: D 1800 @10 (RET)
Confirms the results of the arithmetic operations.
address
+0 +1 +2 +3 +4 +5 +6 +7 +8 +9 +A +B +C +D +E +F
ASCII
00001800 00 00 00 60 00 00 00 40 00 00 05 00 00 00 00 05
...’...@........
:
82
COMMAND_CHAIN
5.8
COMMAND_CHAIN
Executes commands from a file
CC
Format
COMMAND_CHAIN∆<file name>[∆["<actual parameter>"],["<actual
parameter>"]...] (RET)
Parameters
•
<file name>
Specifies the name of the command file.
•
<actual parameter>
Specifies a character string to replace dummy parameters.
To omit an actual parameter, skip its position by inserting an extra comma.
Function
This command reads commands from a file and executes them in sequence.
Dummy arguments can be specified within a command file to be replaced with the “actual
parameters” specified in the COMMAND_CHAIN command.
There are 10 dummy parameters, ¥0 to ¥9.
Use the strings ¥¥0 to ¥¥9 to represent ¥0 to ¥9 within character stings, or as character strings in
option command lines of the BREAK, BREAK_ACCESS, or BREAK_DATA commands.
Dummy parameters for which no actual parameters are specified are replaced with NULL.
Notes
1.
To include a double quotation mark in a character string, insert two double quotation marks in
sequence.
2.
Command chain files can be nested up to 8 levels.
3.
Redirection cannot be specified.
83
COMMAND_CHAIN
Examples
1.
To execute the commands in the auto.com command file in sequence:
:
:
:
:
:
:
2.
CC auto.com (RET)
P out.log
S 100
;END
Execution history is stored in out.log.
The debugging object program is executed for H'100 steps starting
at the current PC.
A comment line.
To use dummy parameters:
a. The following command file uses dummy parameters.
RADIX ¥0
MEMORY ¥1 100
autol.sbt
The first parameter (¥0) is used as the argument to the RADIX command.
The second parameter (¥1) is used as the first argument to the MEMORY
command.
b. The following command executes the commands in the “auto1.sbt” command file.
: CC auto1.sbt "D", "1000" (RET)
: RX D
The RADIX command is executed with D as the actual parameter.
: M 1000 100
The MEMORY command is executed with 1000 as the actual
:
parameter.
84
COMPARE
5.9
COMPARE
Compares memory contents
CMP
Format
COMPARE∆<start address>∆{<end address>|@<byte count>}
∆<comparison memory start address> (RET)
Parameters
•
<start address>∆{<end address>|@<byte count>}
Specifies the range of memory (the source data) to be compared.
•
<comparison memory start address>
Specifies the start of the comparison data memory area.
Function
Compares the specified range of memory (the source data) with the comparison data in byte units.
When data that does not match is found, those data items and their addresses are displayed.
Example
To compare the H'500 bytes of data starting at address H'1000 with the H'500 bytes of data starting
at address H'2000, and to display the addresses and values of the source data and compared data
when data which does not match is found:
: CMP 1000 @500 2000 (RET)
source data
compared data
00001005 3F
00002005 42
:
:
000014FE 00
000024FE 80
:
85
CONVERT
5.10
CONVERT
Calculates expression
CV
Format
CONVERT∆<expression> (RET)
Parameter
•
<expression>
Specifies an integer expression for conversion.
Function
The value of the expression is displayed in binary, octal, decimal, and hexadecimal and as ASCII
characters.
Example
To display the result of evaluating the expression “3*5” in binary, octal, decimal, and hexadecimal
and as ASCII characters:
: CV 3*5 (RET)
B' 00000000 00000000 00000000 00001111
Q' 00000000017
D' 15
H' 0000000F
A' ....
:
Note
If a symbol is specified in an expression, the symbol address is displayed.
86
COVERAGE
5.11
COVERAGE
Starts and stops coverage measurement
COV
Format
Start:
COVERAGE[∆<file name>] (RET)
Restart/temporary halt/initialization:
COVERAGE ;{E|D|R} (RET)
Termination:
COVERAGE-[;N] (RET)
Parameters
•
<file name>
Specifies the file to hold coverage data.
The file "temp.cov" is used as default when the a file name is omitted.
When the file extension is omitted, ".cov" is supplied as default.
•
Options
— Restart and temporary halt coverage measurement {E|D}
E (enable): Restarts coverage measurement.
D (disable): Temporarily halts coverage measurement.
— Coverage data initialization specification R
R (reset):
Initializes coverage data.
— Coverage data storage specification N
N (not save):
Coverage measurement is terminated without saving the acquired data to
a file.
Function
Starts, temporarily stops, restarts, and terminates coverage measurement data acquisition.
Description
Start:
Starts the acquisition of coverage data.
Previously acquired coverage data is lost.
The addresses of instructions executed by a CALL, GO, STEP,
STEP_INTO, or VECTOR command following the input of this
command are saved as coverage data.
87
COVERAGE
If the specified file exists, the information in that file is read in, thus
resetting the address range.
If the file name is omitted, the current coverage range setting is
displayed, and acquisition of coverage data begins.
Restart/temporary halt/
initialization:
Data acquisition is restarted, temporarily halted, or re-initialized with
no change in other settings.
Termination:
Acquisition of coverage data is terminated, and the acquired data is
output to the file.
Specify the N option to terminate coverage data acquisition without
saving the data to a file.
Notes
1.
Use the SET_COVERAGE command to confirm the setting state.
2.
The coverage calculation involves disassembling the program to count instructions. As a
result, correct values cannot be computed for programs which include data within their code
areas.
Examples
1.
To start the acquisition of coverage data:
: COV (RET)
coverage area
00001000 - 000012FF
00001800 - 00001FFF
:
88
COVERAGE
2.
To load a coverage file and start the acquisition of coverage data:
: COV test1.cov (RET)
object file name = test.abs
coverage area
00001000 - 000012FF
00001800 - 00001FFF
:
3.
To initialize coverage measurement:
: COV ;R (RET)
:
4.
To terminate coverage measurement:
: COV- (RET)
:
89
DATA_SEARCH
5.12
DATA_SEARCH
Searches for data
DS
Format
DATA_SEARCH∆<start address>∆{<end address>|@<byte count>}∆
{<search string>|<search data>[:<size>][∆<mask>]}[;[S=<byte
count>][∆{EQ|NE}]] (RET)
Parameters
•
<start address>∆{<end address>|@<byte count>}
Specifies the range of the addresses to be searched.
•
{<search string>|<search data>[:<size>][∆<mask>]}
Specifies the string or data to be searched for.
•
<size>
B (byte):
W (word):
L (long):
Searches for byte sized data.
Searches for word sized data (default).
Searches for long-word sized data.
•
<mask>
Only bits which correspond to 1 bits in the mask are tested.
The size of the mask data depends on the size of the search data.
•
Options
— Search step width
S=<byte count> : Specifies the search step width in byte units.
The default search step width is the size of the data.
— Data match/differ {EQ|NE}
EQ (equal):
Searches for data that matches the search data (default).
NE (not equal): Searches for data that differs from the search data.
90
DATA_SEARCH
Function
This command searches for the specified data in the specified memory range.
When the EQ option is specified, the addresses of data which match are displayed.
When the NE option is specified, the addresses of data which differ are displayed.
When the search step width is specified with the S (step) option, the command searches for data
only at addresses separated by the step width starting at the start address.
Example
To search for the value 005E from address H'1000 to address H'14FF:
: DS 1000 14FF 5E (RET)
address
00001004
00001100
000011A8
:
91
DEBUG_LEVEL
5.13
DEBUG_LEVEL
Specifies debug level
DL
Format
Specification:
DEBUG_LEVEL [;] {S|I|N} (RET)
Display:
DEBUG_LEVEL (RET)
Parameter
•
Option
— Specification of the units for source line display and of the step count for the step
execution command. {S|I|N}
Option
Source Line Display
S and SI Command Step Units
S (Source display, source
line step)
C source only
Line units
I (Instruction and source
display, instruction step)
Both C source and machine
language
Machine language instruction units
N (No source display,
instruction step)
Machine language only
Function
This command specifies whether high-level language debugging is performed or not.
There are three aspects to high-level language debugging as listed below.
1.
Source line display
The display consists of the source program corresponding to the results of command
execution.
The following commands display the source program in their execution results.
•
•
•
The disassembly command (DA)
The trace buffer display command (T)
The debugging object program execution commands (G, S, SI, V)
92
DEBUG_LEVEL
2.
Step execution units
This specification determines whether or not the step execution commands (S and SI) take the
C source line as the step.
3.
BREAK stop address
This command also specifies whether the simulator/debugger stops on source line units or
machine instruction units when a break condition specified by a BREAK_ACCESS,
BREAK_DATA, or BREAK_REGISTER is detected.
Description
Specification:
Sets the source program display and step execution unit.
• S option: Only C source lines are displayed, and step execution steps in
source line units. (Start-up setting)
• I option: Both C source lines and machine language are displayed, and step
execution steps in machine language units.
• N option: Only machine language is displayed, and step execution steps in
machine language units. (Assembly source programs are
displayed in the same way while the I option is specified.)
Display:
Displays the current setting state.
Note
The S and I options cannot be specified for files without debugging information.
93
DEBUG_LEVEL
Examples
1.
To display the setting state:
: DL (RET)
Source/Instruction/Not display = S
:
2.
To set the step unit for the STEP and STEP_INTO commands to machine language instruction
units:
: DL ;I (RET)
: S 10 (RET)
%filename.c#100
a = b + 1;
00000556
MOV.L
R1,R0
00000558
MOV.L
R3,R2
:
:
%filename.c#101
printf("simulator debugger¥n");
MOV.L
R5,R3
:
94
DISASSEMBLE
5.14
DISASSEMBLE
Disassembles and displays memory contents
DA
Format
DISASSEMBLE∆<start address>[∆{@<instruction count>|<end address>}
(RET)
Parameters
•
<start address>
Specifies the address from which to start disassembly of memory contents.
•
<instruction count>
Specifies the number of instructions to disassemble.
•
<end address>
Specifies the address at which disassembly is terminated.
Function
This command disassembles and displays the contents of memory in the range specified by the
start address and the end address or instruction count parameters.
Description
1.
When the end address or instruction count parameter is omitted, 16 lines from the start address
are disassembled.
2.
The hexadecimal representation for the two bytes of data is displayed when an illegal
instruction is encountered.
3.
The first address of the instruction, the instruction mnemonic, the operands, and the symbol
are displayed.
Note that the address corresponding to a symbol displayed as a label is the address of the
instruction displayed on the line following the symbol.
4.
After this command is executed, pressing the RETURN key again disassembles and displays
the next 16 lines until other commands are entered.
95
DISASSEMBLE
5.
When the SP is specified as a register in PC-relative or register-indirect-with-displacement
addressing mode, the displacement value will be converted to the corresponding automatic
variable symbol and the conversion results will be displayed.
Note
Since the DISASSEMBLE command does not recognize delay branch instructions correctly,
symbol conversion may not be performed correctly.
Examples
1.
To disassemble and display from addresses H'400 to H'406. In the output below,
“%sample.src!SECT1” is a symbol which corresponds to address H'404:
: DA 400 406 (RET)
00000400
MOV.W
00000402
MOV.W
%sample.src!SECT1:
00000404
MOV.L
00000406
ADD.L
:
2.
@(12,PC),R0
@R1,R0
#00000012,R3
R2,R1
To disassemble and display the four instructions starting at address H'400:
: DA 400 @4 (RET)
00000400
MOV.W
00000404
MOV.W
%sample.src!SECT1:
00000408
MOV.L
0000040A
ADD.L
:
@(12,PC),R0
@R1,R0
#00000012,R3
R2,R1
96
DISPLAY_CHARACTERS
5.15
DISPLAY_CHARACTERS
Displays character string
DCH
Format
DISPLAY_CHARACTERS˘"<character string>" (RET)
Parameter
•
<character string>
Specifies an arbitrary character string.
Function
Displays the specified character string on the screen.
This command can be used to display messages, for example, with the STUB command.
Examples
1.
To display "SIMULATOR" on the screen:
: DCH "SIMULATOR" (RET)
SIMULATOR
:
2.
To insert the DISPLAY_CHARACTERS command in a STUB command sequence so that it
displays its argument during simulation:
: SB 10 { (RET)
STUB > DCH "PASS 10" (RET)
STUB > } (RET)
: G 8 (RET)
PASS 10 The DCH command is executed when the instruction at address H'10 is executed.
:
97
DISPLAY_COVERAGE
5.16
DISPLAY_COVERAGE
Displays coverage data
DCV
Format
DISPLAY_COVERAGE [˘<first address>[˘{<end address>|@<source line
count>|@<instruction count>}]] [;{T|G|D|N0|N1}] (RET)
Parameters
•
<first address>˘{<end address>|@<source line count>|
@<instruction count>}
Specifies the range of coverage data to be displayed.
•
Options
Display format specification {T|G|D|N0|N1}
T (total):
Specifies display of both C0 and C1 coverage values.
G (general):
Specifies display of the results in source line units. (default)
D (detail):
Specifies display of the results in machine instruction units.
N0, N1 (not executed): Specifies display of addresses that were not executed.
Function
Displays C0 and C1 coverage data.
•
When the T option is specified
Only coverage values are displayed.
If only the option is specified, (i.e., if the range specification is omitted) then the whole
coverage range is taken as the object of the coverage values.
•
When the G option is specified
The coverage results are displayed in source line units.
When the range specification is omitted, display continues from the previous use of the
command.
When the end address or source line count specification is omitted, 16 lines are displayed.
•
When the D option is specified
The coverage results are displayed in machine instruction units.
When the range specification is omitted, display continues from the previous use of the
command.
When the end address or source line count specification is omitted, 16 lines are displayed.
98
DISPLAY_COVERAGE
•
When the N0 or N1 option is specified
The addresses of unexecuted instructions are displayed.
Line numbers will be displayed if line number information is available.
N0 specifies the addresses not executed under C0 coverage, and N1 specifies the branches not
taken under C1 coverage.
Description
After the DISPLAY_COVERAGE command has been executed once, pressing (RET) again will
show the next 16 lines of coverage information until another command is entered.
Examples
1.
To display the coverage data with specifying the T option:
: DCV 0 @30 ;T (RET)
C0 : 87.5%
C1 : 50.0%
:
2.
To display the coverage data with specifying the G option:
: DCV 0 @10 ;G (RET)
(This example is a C program.)
%sample.c#
4 *
for(i=0; i<20; ++i)
%sample.c#
6 .
printf("Number is %c", number[i]);
:
•
•
•
•
C0 coverage is displayed.
The objects of display are C and assembler source programs.
An indicator mark is inserted in column 1.
Indicator interpretations:
* (asterisk) — This address was accessed and executed.
. (period) — This address was not executed.
˘ (space) — No machine instruction was generated for this line.
99
DISPLAY_COVERAGE
3.
To display the coverage data with specifying the D option:
: DCV 0 ;D (RET)
* 00000000
%sample.c#
4
* 00000002
* 00000004
* 00000006
* 00000008
* 0000000A
* 0000000C
* 0000000E
* 00000010
* 00000012
* 00000014
T 00000016
:
•
•
•
•
ADD.L
#FFFFFFFC,R15
for(i=0; i<20; ++i)
MOV.L
#00000000,R3
MOV.L
R3,@R15
BRA
00000010
NOP
MOV.L
@R15,R2
ADD.L
#00000001,R2
MOV.L
R2,@R15
MOV.L
@R15,R3
MOV.L
#00000014,R2
CMP/GE.L
R2,R3
BF
0000040A
The disassembled source program corresponding machine code are displayed.
C0 and C1 are displayed.
An indicator mark is inserted to the left of the disassembled machine code.
Indicator interpretations:
* (asterisk) — Accessed and executed.
T
— The true branch was taken.
F
— The false branch was taken.
TF
— Both branches have been taken.
. (period) — Not executed.
100
DISPLAY_COVERAGE
4.
To display the coverage option with specifying the N option:
: DCV 0 ;N1 (RET)
.F 0000002C %main#009
:
(This example is coverage data for a C program.)
• There are two N options, N0 and N1. N0 displays the line numbers for addresses not
executed under C0, and N1 displays the line numbers for addresses not executed under C1.
• An indicator mark is inserted at column 1 for the C1 display.
• Indicator interpretations:
T. — The true branch was taken.
.F — The false branch was taken.
.. — Not executed.
101
DUMP
5.17
DUMP
Displays memory contents
D
Format
DUMP˘<start address>[˘{<end address>|@<item count>}]
[;{B|W|L|S|D}] (RET)
Parameters
•
<start address>[˘{<end address>|@<item count>}]
Specifies the range of memory to be displayed.
•
Options
— Data size {B|W|L|S|D}
B (byte):
Byte data (default).
w (word):
Word data.
L (long):
Long-word data.
S (single precision): Single-precision floating point data.
D (double precision): Double-precision floating point data.
Function
This command displays, in the specified format, the block of data from the start address to the end
address, or for the specified number of data items.
If the end address is omitted, 16 lines are displayed starting at the first address.
After executing the DUMP command once, the next 16 lines of data can be displayed by just
pressing (RET) before entering any other command.
102
DUMP
Examples
1.
To display the memory contents in byte units starting at address H'1000:
: D 1000 ;B (RET)
address
00001000
+0 +1 +2 +3 +4 +5 +6 +7 +8 +9 +A +B +C +D +E +F
FF 00 FF 00 FF 00 FF 00 FF 00 FF 00 FF 00 FF 00
:
:
:
00001070
ASCII
................
:
41 42 43 44 45 46 47 48 49 4A 4B 4C 4D 4E 4F 50
ABCDEFGHIJKLMNOP
:
2.
To display two items of single precision floating point data starting at address H'2000:
: D 2000
address
00002000
00002004
:
@2 ;S
+0 +1
49 96
3F 80
(RET)
+2 +3
B4 38 1.234567S+6
00 00 1.0S+0
103
EXEC_MODE
5.18
EXEC_MODE
Switches execution mode
EM
Format
Set:
Display:
EXEC_MODE ;{S|C}
EXEC_MODE (RET)
(RET)
Parameter
•
Options
Execution mode specifier {S|C}
S (stop)
In this mode execution is stopped when the simulator/debugger detects an
abnormality (simulation error) in the debugging object program.
C (continue): In this mode simulation errors are ignored and execution continues when the
simulator/debugger detects an abnormality (simulation error) in the debugging
object program.
The simulator/debugger execution mode is set to S when first invoked.
Function
This command selects whether execution will continue or stop when an abnormality is detected
during debugging object program execution.
When the execution mode specifier is omitted, the current setting of the execution mode is
displayed.
Refer to section 2.11 (2), Break due to detection of an execution time error in the debugging object
program, for more information on abnormalities occurring while executing the debugging object
program.
Description
Set:
Stop mode is recommended for the early stages of debugging, with continue mode
being useful in the later stages.
Display:
“STOP” is displayed in stop mode, and “CONTINUE” in continue mode.
104
EXEC_MODE
Examples
1.
To set the execution mode to continue mode:
: EM ;C
:
2.
(RET)
To display the current execution mode:
: EM (RET)
EXEC_MODE = CONTINUE
:
105
FILL
5.19
FILL
Initializes memory area
F
Format
Fill˘<start address>˘{<end address>|@<data item count>}
˘<initialization data>[:<size>] (RET)
Parameters
•
<start address>˘{<end address>|@<data item count>}
Specifies the range of addresses to be initialized.
•
<initialization data>
Specifies the data value to be stored.
•
<size>
B (byte):
W (word):
L (long):
{B|W|L}
Initialization is performed in byte units.
Initialization is performed in word units. (default)
Initialization is performed in long word units.
When the size specification is omitted, word is used as the default unless the start address was
specified with a high level language variable. In that case, the size will be the size of that
variable.
Function
The initialization data is stored in the specified memory range.
Example
To clear addresses H'1000 to H'1FFF to zero:
: F 1000 1FFF 0
:
(RET)
106
GO
5.20
GO
Executes instructions continuously
G
Format
GO [˘[<start address>][,[<break address>]][;D]] (RET)
Parameters
•
<start address>
Specifies the address from which program execution starts.
When omitted, execution starts from the address specified by the current value of the program
counter.
•
<break address>
Specifies the address at which to stop program execution.
•
Options
— Break disable D
D (disable breaks): Breakpoints specified with the break commands are temporarily
disabled.
Function
This command executes the debugging object program continuously starting at the specified start
address.
The break address, break instruction execution cycle count, and break disable option specifications
are temporary disabled during GO command execution but are enabled again when execution
stops.
Description
1.
Execution is interrupted when either a condition set by a break command is satisfied, or when
an error occurs.
However, if the D option is specified, execution is not interrupted on the satisfaction of a break
condition.
107
GO
2.
When execution is interrupted, the instruction execution count (in decimal), the current
register values, a disassembled display of the last instruction executed, and a confirmation
message are displayed.
3.
If the E option has been specified with the TRACE_CONDITION command, the execution
history is written to the trace buffer.
Notes
1.
If a break address is specified at a point that is not the start address of an instruction, the
break will not be detected.
2.
If a break address is specified at an instruction following a delayed branch instruction,
execution stops at the start address of the delayed branch instruction.
Examples
1.
To execute the debugging object program continuously while temporarily ignoring the
currently specified break conditions:
: G ;D
(RET)
Exec Instructions = 159
PC=00000402 SR=00000000:**********************------**-- SP=05000000
GBR=00000000 VBR=00000000 MACH=00000000 MACL=00000000 PR=00000000
R0-7
00000000 00000000 00000000 00000000 00000000 00000000 00000000 00000000
R8-15 00000000 00000000 00000000 00000000 00000000 00000000 00000000 05000000
00000400 SLEEP
SLEEP
:
108
GO
2.
To execute the debugging object program from address H'1000 to address H'1020:
: G 1000,1020
(RET)
Exec Instructions = 30
PC=00001020 SR=00000000:**********************------**-- SP=05000000
GBR=00000000 VBR=00000000 MACH=00000000 MACL=00000000 PR=00000000
R0-7
00000000 0000FFFF 00000000 00000000 01000000 00000000 00000000 00000000
R8-15 00000000 00000000 00000010 00000000 0000FFFF 00000000 00000000 05000000
0000101E
MOV.L
R0,@R4
BREAK POINT
:
109
HELP
5.21
HELP
Displays command name and input format
HE
Format
HELP [˘<command name>] (RET)
Parameter
•
<command name>
Specifies the name of the command for which the help message is to be displayed.
Function
Displays the help message for the specified command.
Description
•
When a command name is specified, the help message for the specified command is
displayed.
•
When the command name is omitted, a table of commands is displayed.
110
HELP
Examples
1.
To display a table of commands:
: HE (RET)
Assemble
Break_Register Break_Access
Break_Data
Break
Break_Sequence
CAll
Command_Chain
CoMPare
ConVert
COVerage
Data_Search
Debug_Level
DisAssemble
Display_CoVerage Dump
Exec_Mode
Fill
Go
HElp
Load
Load_Status
MAcro
MaP
Memory
MoVe
Print
Quit
RadiX
Register
ReSet
SaVe
Save_Status
SCoPe
Set-CoVerage
SHow_Calls
Step
Step_Into
StuB
SYmbol
Trace
Trace_Condition Trap_Address TYpe
Vector
.<register>
!
Display_CHaracters
:
2.
To display the syntax of the HELP command:
: HE HELP (RET)
HE|HELP [command-name]
111
LOAD
5.22
LOAD
Loads file
L
Format
LOAD˘<file name>[˘[<load address>][;[{OD|O|M}][,U]]] (RET)
Parameters
•
<file name>
Specifies the name of the file to be loaded.
When the file format is omitted from the file name, ".abs" is supplied for debugging object
programs and ".dat" is supplied for memory image files.
•
<load address>
Specifies the address to which the file is loaded.
If a load position is specified for an absolute load module, the specification will be ignored.
When omitted, relocatable load modules will be loaded at H'400. Absolute load modules will
be loaded at their load address. Memory image files are loaded starting at address H'0.
•
Options
— File format specifier {OD|O|M}
OD (object and debug information):
O (object):
M (memory image file):
— Undefined symbol allocation U
U (undefined):
Both the machine language and the debugging
information are loaded. (default)
Only the machine language is loaded.
A memory image file is loaded.
Addresses are allocated for undefined symbols.
Function
This command loads debugging object programs and memory image files, including files created
with the SAVE command.
When a memory image file is loaded, the load start and end addresses are displayed after loading.
When the U option is specified, a 4-byte area is allocated for each undefined symbol, and its
address is used as the value of the symbol. These areas are allocated in the external bus space or
internal RAM area, and are displayed on the screen.
112
LOAD
Although the LOAD command allocates the required memory when loading a debugging object
program, memory is not allocated when loading a memory image file.
In addition, before loading a memory image file, memory must be allocated using the MAP
command.
Description
The figure below shows the load map for a debugging object program and its undefined symbol
area.
Section 1
Internal ROM area
Unused
Section 2
External bus space
Undefined symbol area
(See note)
Note: The address of the area allocated will be filled with the number of undefined symbols.
The initial settings following the loading of a debugging object program are as follows:
Memory areas ..........The debugging object program areas and an undefined symbol area are
allocated.
Coverage .................The coverage areas are automatically set to be the code sections. The
maximum number of areas is 16.
PC ............................If an entry address was specified in the debugging object program, the PC is
set to that address. Otherwise, the PC is set to the start address of the code
segment that appeared first.
SP.............................The SP is set to the last address of the internal RAM area + 1.
No other registers or flags are set.
113
LOAD
Notes
1.
Before loading a memory image file, memory must be allocated using the MAP command.
2.
The information loaded by the LOAD_STATUS command differs from that loaded by the
LOAD command.
Examples
1.
To load “test1.abs” as the debugging object program:
: L test1.abs (RET)
:
2.
To load “test2.dat” as a memory image file, starting at address H'3000:
: L test2.dat 3000 ;M (RET)
<START>
<END>
00003000 - 000030FF
:
114
LOAD_STATUS
5.23
LOAD_STATUS
LS
Restores simulator/debugger memory and register
state
Format
LOAD_STATUS [˘<file name>] (RET)
Parameter
•
<file name>
Specifies the name of a file that was used to save the simulator/debugger memory and register
state.
If the file name is omitted, the file "sdsh.sav" is assumed.
If the file format is omitted, ".sav" is supplied.
Function
The states of memory and the registers are restored to the point when the corresponding
SAVE_STATUS command was executed.
Notes
1.
If the memory map differs from that at the point the SAVE_STATUS command was executed,
the memory and register state is not restored.
2.
Files saved by specifying the A option with the SAVE_STATUS command must be loaded at
simulator/debugger startup time.
Example
To load the memory and register state saved in the file “test1.sav”:
: LS test1.sav (RET)
:
115
MACRO
5.24
MACRO
MA
Defines, displays, executes, and deletes
simulator/debugger command macros
Format
Definition: MACRO˘<macro name>{ (RET)
Display:
MACRO[˘<macro name>] (RET)
Execution: <macro name> [˘["<actual parameter>"],["<actual
parameter>"]...] (RET)
Deletion: MACRO- [˘<macro name>] (RET)
Parameters
•
<macro name>
Specifies the name of the macro.
A macro name must be an alphanumeric string starting with an alphabetic character.
A macro name must be 32 or fewer characters in length.
Note that upper and lower case characters are not distinguished.
Since the following symbols are used as macro internal functions, they may not be specified as
macro names.
—
—
—
—
—
—
—
WHILE
FOR
DO
IF
ELSE
MBREAK
CONTINUE
Also note that if a simulator/debugger command name is redefined as a macro, the macro
usage will take precedence.
•
<actual parameter>
Specifies the parameters passed to the macro.
To omit an actual parameter, specify both the comma delimiting the previous actual parameter
and a comma to correspond to the omitted parameter.
Omitted actual parameters are replaced by ‘NULL’ during macro expansion.
116
MACRO
Function
Definition:
Defines a macro command.
Up to 64 macro commands can be defined.
However, since the area used for storing the macro definitions is limited, there are
cases when a full 64 macros cannot be defined.
When the command line “MACRO∆<macro name>{(RET)” is entered, the
simulator/debugger displays a prompt (“0001>”) indicating macro definition in
progress, and waits for input of the macro body.
The macro body can include multiple simulator/debugger commands, macro
commands, and macro internal commands.
Furthermore, %0 to %9 can be used as dummy arguments inside a macro body.
The dummy arguments are replaced with the actual parameters specified when the
macro is called.
Use the strings %%0 to %%9 to represent %0 to %9 in character stings, or in
command line option character strings in BREAK, BREAK_ACCESS,
BREAK_DATA, BREAK_REGISTER, or BREAK_SEQUENCE command lines.
Note that no command line syntax checking is performed during macro definition.
Error checking is performed during macro command execution.
Macro command definition is terminated by entering “}(RET)” at nesting depth 0.
Display:
The definition state of the specified macro command is displayed.
If the macro name is omitted, all the currently defined macro names are displayed.
When a macro name is specified, the macro body (i.e., the contents of the macro
definition) of the specified macro command is displayed.
Execution:
The specified macro command is executed.
Processing is terminated if an error occurs in the macro command or if the user
performs a manual break with (CTRL) + (C).
Although a macro command with the same name as a simulator/debugger command
takes precedence over the simulator/debugger command, the simulator/debugger
command can be executed by preceding the name with a caret ("^").
Macro commands are executed with the dummy arguments in the macro body
replaced with the actual parameters specified in the macro call.
117
MACRO
Deletion:
A previously defined macro is deleted.
If a macro name is specified, the macro command defined with that name is deleted.
If the macro name is omitted, all defined macro commands are deleted.
In this case a confirmation message will be displayed. Respond "Y" to delete all
macro commands or "N" to cancel the deletion.
Notes
1.
Macro display, definition, and deletion, as well as execution of “!” commands, are not allowed
within macro bodies.
2.
Re-direct cannot be specified for macro command execution.
Examples
1.
To define a macro command:
: MA ISTEP { (RET)
0001 > ·PAR = %0 (RET)
0002 > IF(*1000 == ·PAR) { (RET)
If the value of address H'1000 agrees with the
parameter,
0003 >
SI (RET)
the STEP_INTO command will be executed.
0004 > }ELSE{ (RET)
If they are not the same, the STEP command will be
0005 >
S (RET)
executed.
0006 > } (RET)
Termination of the IF internal macro command.
0007 > } (RET)
Termination of the macro command definition.
:
2.
To display the ISTEP macro command:
: MA ISTEP (RET)
ISTEP {
·PAR = %0
IF(*1000 == ·PAR) {
SI
}ELSE{
S
}
}
:
118
MACRO
3.
To execute the ISTEP macro command:
: ISTEP "10" (RET)
: STEP
:
4.
The value “10” is passed as the parameter.
To delete the ISTEP macro command:
: MA- ISTEP (RET)
:
Macro Internal Variables
Format
·<variable name>
Description
1.
Variables can be used within macro commands.
2.
The first character must be "¥", the second character must be alphabetic, and the remaining
characters must be alphanumeric.
3.
The variable name, including the "¥", must be at least 2 characters and no more than 32
characters in length.
4.
Variables represent 32-bit unsigned quantities.
5.
Since macro variables are inherited when a macro call is nested inside a macro definition,
variables of the same name within both macros are treated as the same variable, i.e., as a
global variable.
6.
Variables can be assigned values using the assignment operator.
The assignment operator is an operator that can only be used inside a macro body, and has the
following syntax.
<variable>=<expression>
119
MACRO
The names and usage of pre-defined macro internal variables are described below.
These variables are reference-only variables, and thus their values cannot be changed by the user.
·SIMSTAT : Indicates the simulator stop factor.
When one of the bits shown in figure 5-2 is 1, the simulator/debugger has stopped
for the corresponding reason, and when a bit is 0, that factor is not the cause of the
stop.
MSB
—
LSB
—
—
—
31
BREAK or BREAK_SEQUENCE
BREAK_ACCESS, BREAK_DATA,
or BREAK_REGISTER
Error
STEP normal end
Trace buffer
Figure 5-2 Macro Internal Variable ¥SIMSTAT
120
MACRO
Macro Internal Commands
(1) WHILE
Format
WHILE (<expression>){
<macro body>
}
Parameters
•
<expression>
The <expression> parameter expresses the condition for macro body execution or iteration.
•
<macro body>
The <macro body> parameter expresses the sequence of commands or macro internal
commands to be executed while the condition is true.
Function
The <expression> is evaluated, and if its value is any value other than zero the macro body is
executed.
The macro body is iterated until <expression> evaluates to zero.
If the value of <expression> is zero initially, the macro body is not executed even once.
Multiple simulator/debugger commands, macro commands, or macro internal commands can be
included in the macro body.
Example
To display the fifth to tenth elements in array ABC:
·NUM = 5
WHILE(·NUM <= 10) {
TYPE ABC[·NUM-1]
·NUM = ·NUM + 1
}
121
MACRO
(2) FOR
Format
FOR ([<expression 1>];[<expression 2>];[<expression 3>]) {
<macro body>
}
Parameters
•
<expression 1>
The parameter <expression 1> is evaluated prior to testing the <macro body> execution
condition.
•
<expression 2>
The parameter <expression 2> expresses the <macro body> execution or iteration condition.
•
<expression 3>
The parameter <expression 3> is evaluated after <macro body> execution.
•
<macro body>
The <macro body> parameter expresses the sequence of commands or macro internal
commands to be executed when the condition is true.
Function
The FOR loop executes <expression 1> and then evaluates <expression 2>. If that latter value was
any value other than zero, the FOR loop executes the <macro body> and then <expression 3>.
The <macro body> and <expression 3> are iterated until <expression 2> evaluates to zero.
If the value of <expression 2> is zero initially, the <macro body> is not executed even once.
Multiple simulator/debugger commands, macro commands, or macro internal commands can be
included in the <macro body>.
122
MACRO
Examples
1.
To display the fifth to tenth elements in array ABC:
FOR(·NUM = 5; ·NUM <= 10; ·NUM = ·NUM+1) {
TYPE ABC[·NUM-1]
}
2.
To operate identically to the loop in example (1):
·NUM = 5
FOR(;·NUM <= 10;) {
TYPE ABC[·NUM-1]
·NUM = ·NUM+1
}
(3) DO/WHILE
Format
DO {
<macro body>
} WHILE <expression>
Parameters
•
<expression>
The <expression> parameter expresses the <macro body> iteration condition.
•
<macro body>
The <macro body> parameter expresses the sequence of commands or macro internal
commands to be executed when the condition is true.
Function
The DO/WHILE loop first executes the macro body and then evaluates the <expression>. If that
value is any value other than zero, the macro body is executed again.
123
MACRO
The macro body is iterated until the <expression> evaluates to zero.
If the value of <expression> is zero initially, the macro body is executed exactly once.
Multiple simulator/debugger commands or macro internal commands can be included in the
<macro body>.
Examples
To display the fifth to tenth elements in array ABC:
·NUM = 5
DO {
TYPE ABC[·NUM-1]
·NUM = ·NUM+1
} WHILE(·NUM <= 10)
(4) IF
Format
IF (<expression>) {
<macro body 1>
[} ELSE {
<macro body 2>]
}
Parameters
•
<expression>
The <expression> parameter expresses the condition for execution of <macro body 1>
selectively.
•
<macro body 1>
The <macro body 1> parameter expresses the sequence of commands or macro internal
commands to be executed when the condition is true.
124
MACRO
•
<macro body 2>
The <macro body 2> parameter expresses the sequence of commands or macro internal
commands to be executed when the condition is false.
Function
The <expression> is evaluated, and if its value is any value other than zero, the <macro body 1> is
executed.
When the value is zero, if the optional ELSE clause is present, <macro body 2> will be executed,
otherwise nothing is executed.
Multiple simulator/debugger commands or macro internal commands can be included in <macro
body 1> and <macro body 2>.
Examples
1.
To display the value of address H'2000 if its value is any value other than zero:
IF(*2000 != 0) {
D 2000
}
2.
To display the value of address H'2000 if its value is any value other than zero, and if its value
is zero, to display the value of address H'2100:
IF(*2000 != 0) {
D 2000
}ELSE{
D 2100
}
125
MACRO
(5) MBREAK
Format
MBREAK
Function
When an MBREAK command is executed, the enclosing WHILE, FOR, or DO/WHILE loop is
interrupted, and control exits one level of iteration nesting.
Notes
The MBREAK command can only be used inside a WHILE, FOR, or DO/WHILE loop.
Example
To display the values of addresses H'1000 to H'2000, and to terminate the display if the value zero
is encountered:
FOR(·ADDR = 1000; ·ADDR <= 2000; ·ADDR = ·ADDR+2) {
D ·ADDR
IF(*·ADDR == 0){
MBREAK
}
}
126
MACRO
(6) CONTINUE
Format
CONTINUE
Function
When a CONTINUE command is executed, execution of the enclosing WHILE, FOR, or
DO/WHILE loop is interrupted, and control proceeds to evaluation of the <expression> for a
WHILE or DO/WHILE loop, or to the evaluation of <expression 3> for a FOR loop.
Note
The CONTINUE command can only be used inside a WHILE, FOR, or DO/WHILE loop.
Example
To display the values of addresses H'1000 to H'2000, jumping over (i.e. ignoring) addresses whose
value is zero:
FOR(·ADDR = 1000; ·ADDR <= 2000; ·ADDR = ·ADDR+1) {
IF(*·ADDR == 0) {
CONTINUE
}
D ·ADDR
}
127
MAP
5.25
MAP
MP
Defines, displays, modifies, and deletes memory
areas
Format
Set:
MAP˘<start address>˘{@<byte count>|<end address>}
[;{R|W|RW}] (RET)
Display:
MAP [;M] (RET)
Modification: MAP˘<start address> [;{R|W|RW}] (RET)
Deletion:
MAP-[˘<start address>] (RET)
Parameters
•
<start address>
Specifies the address of the start address in the memory area.
•
<byte count>
Specifies the number of bytes in the memory area.
•
<end address>
Specifies the address of the end address in the memory area.
•
Option
— Access type {R|W|RW}
R (read):
Specifies the memory area to be read-only.
W (write):
Specifies the memory area to be write-only.
RW (read/write): Specifies the memory area to be read/write.
When omitted, the access type is set as follows.
Æ Internal ROM area (only when defining a memory area):
Æ All other cases:
R
RW
— CPU information memory map display: M
M (map):
Specifies display of the memory map information from the CPU
information file.
128
MAP
Function
This command defines (sets) the memory area to be used by the object program, displays the state,
and changes the access type for the memory areas used by the debugging object program.
Description
Set:
This command is used to allocate memory areas other than those allocated when
the debugging object program was loaded.
Up to 20 memory areas can be allocated with the MAP command.
Display:
Displays the start address, end address, access type, and section names of the
allocated memory areas.
When the “;M” option is specified, the CPU information file memory map is
displayed.
The memory map information is displayed in the following format.
<KIND> <START> <END> <STATE> <BUS>
1
2
3
4
5
1
Memory type:
2
Start address:
3
Last address:
4
5
State count:
Bus width:
Indicates the memory type with a keyword.
• ROM:
Internal ROM area
• I/O:
Internal I/O area
• NOT_A: Unused area
• EXT:
External bus space
• RAM:
Internal RAM area
The address of the start address in the memory specified
by the memory classifier.
The address of the last address in the memory specified
by the memory classifier.
The number of memory access states.
The width of the memory data bus.
Modification:
This form of the command allows the access type of an already allocated memory
area to be changed by specifying its start address.
Deletion:
This form of the command allows an already allocated memory area to be deleted
by specifying its start address.
129
MAP
Notes
1.
Always confirm the address of the start address in the memory area with the MAP command
before changing the access type.
2.
An error occurs if an attempt is made to use the MAP command to allocate a memory area
that is already allocated.
3.
An error occurs if an attempt is made to use the MAP command to allocate a memory area
that includes any part of the invalid area.
4.
It is not possible to allocate a memory area that covers multiple memory areas, including the
internal ROM area, the external bus space, the internal RAM area, and the internal I/O space.
5.
Areas other than those allocated with the MAP command cannot be deleted with the MAP
command.
6.
Areas specified by the MAP command cannot be initialized.
Examples
1.
To allocate addresses H'3000 to H'301F as a read-only memory area:
: MP 3000 301F ;R (RET)
:
2.
To allocate a 50 byte area starting at address H'4000 as a write-only memory area:
: MP 4000 @50 ;W (RET)
:
3.
To change the access type for memory area allocated from address H'0 to address H'03FF to
write-only:
: MP 0 ;W (RET)
:
130
MAP
4.
To display the current memory allocation state:
: MP (RET)
<START>
00000000 00002000 00003000 00004000 00004050 :
5.
<END>
000003FF
000020EF
0000301F
0000404F
0000504F
<ATTR>
W
RW
R
W
RW
<SECT_NAME>
SECT1
It is not possible to allocate an area that includes an already allocated memory area:
: MP 2000 2FFF (RET)
MEMORY AREA ALREADY EXISTS
:
6.
The access type of a memory area that has not been allocated cannot be changed:
: MP 1050 ;R (RET)
INVALID ADDRESS
:
131
MAP
7.
It is not possible to allocate a single memory are that covers multiple memory areas. For
example, when the area from H'0 to H'3FFF is the internal ROM area and the external bus area
starts at H'4000, the following command generates an error as shown:
:MP 3F00 40FF (RET)
ADDRESS EXCEEDS MEMORY SPACE BOUNDARY
:
In this case, this area must be allocated as two separate areas as shown below.
: MP 3F00 3FFF (RET)
: MP 4000 40FF (RET)
:
8.
To display the memory map from the CPU information file:
: MP ;M (RET)
<KIND>
<START>
EXT
00000000
EXT
01000000
I/O
05000000
EXT
06000000
NOT_A
08000000
RAM
0F000000
:
-
<END>
00FFFFFF
04FFFFFF
05FFFFFF
07FFFFFF
0EFFFFFF
0FFFFFFF
132
<STATE>
3
2
3
3
<BUS>
8
8
8
8
1
32
MEMORY
5.26
MEMORY
Modifies memory contents
M
Format
Modify:
MEMORY˘<start address>˘{<data>[:size]|<real number>|
<character string>} (RET)
Interactive form: MEMORY˘<start address>[;{B|W|L|S|D}] (RET)
Parameters
•
<start address>
Specifies the start address to be modified.
•
<data>
Specifies the new value to be stored.
•
<size>
B (byte): Specifies that memory is to be modified in byte units.
W (word): Specifies that memory is to be modified in word units (default).
L (long): Specifies that memory is to be modified in long word units.
When the size specification is omitted, word units are used as the default unless the start
address was specified with a high level language variable. In that case, the size will be the
size of that variable.
•
<real number>
Specifies a floating point number.
•
<character string>
Specifies a character string.
•
Option
— Size specification {B|W|L|S|D}
B (byte):
Specifies byte units.
W (word):
Specifies word units (default).
L (long):
Specifies long word units.
S (single precision): Specifies single precision floating point units.
D (double precision): Specifies double precision floating point units.
133
MEMORY
Function
Changes the contents of memory to an arbitrary value.
Examples
1.
To change the contents of one byte of memory at address H'1000 to 3E:
: M 1000 3E:B (RET)
:
2.
To input in interactive form:
a. To modify memory interactively one byte at a time starting at address H'1000:
: M 1000 ; B (RET)
00001000
3E 5F (RET)
00001001
FF
(RET)
00001002
55 25 (RET)
:
:
00001005
CC . (RET)
:
The following abbreviated commands can be used here, in addition to data specification:
(RET) only : The contents of the immediately following address are displayed.
^
: The contents of the immediately preceding address are displayed.
. (period) : Terminates the command.
134
MEMORY
b. To interactively modify memory a single precision floating point number at a time starting
at address H'2000:
: M 2000 ;S (RET)
00002000 1.413991S-3 F’-3.1415922S+1 (RET)
00002004 1.234567S+5 . (RET)
:
135
MOVE
5.27
MOVE
Copies memory block
MV
Format
MOVE˘<start address>˘{<end address>|@<byte count>}˘<transfer
destination address> (RET)
Parameters
•
<start address>˘{<end address>|@<byte count>}
Specifies the range of addresses to be copied.
•
<transfer destination address>
Specifies the address of the transfer destination.
Function
Copies the specified range of memory data to the specified transfer destination.
Note
The transfer destination area must have been allocated in advance with the MAP command.
Example
To copy the H'500 bytes of data starting at address H'1000 to the area starting at address H'2000:
: MV 1000 @500 2000 (RET)
:
136
PRINT
5.28
PRINT
Creates execution history file
P
Format
Start:
PRINT [˘<file name>][˘;[A][C]] (RET)
Temporary stop/restart:
PRINT ;{E|D} (RET)
Terminate:
PRINT- (RET)
Parameters
•
<file name>
Specifies the file name.
When the file name specification is omitted, the simulator/debugger creates a file in the
directory from which the simulator/debugger was started with the same name as the
debugging object program and the extension ".prt".
When the file extension is omitted, the extension ".prt" is supplied.
•
Options
— Append mode specification A
A (append):
If a file name was specified, the execution history is appended to the
specified file.
When this option is omitted, the execution history is stored in the file
starting at the beginning of the file.
— Write data selection C
C (commands): When the C option is specified, only the input commands are written to
the file.
— File output suspend/restart {E|D}
E (enable):
File output is restarted.
D (disable):
File output is temporarily stopped.
137
PRINT
Function
This command starts the output of a command execution history to a file.
When the C option is specified, only the input commands are saved to the file.
Furthermore, the file output can be temporarily halted, restarted, and terminated.
Description
Start:
Starts the output of an execution history to a file.
If the specified file exists, that file is deleted and a new file is created.
If the A option is specified, the execution history is appended to the end
of the specified file.
Temporary stop/restart: File output is suspended when the D (disable) option is specified, and
restarted when the E (enable) option is specified.
Terminate:
Execution history output is terminated.
Notes
1.
The C (command) option only handles typed input, and commands executed from command
files are not output.
2.
When an error occurs in command input or in single line I/O processing, the input/output data
is not written to the output file.
3.
Execution results from the “!” command (sub-process creation) are not written to the output
file.
138
PRINT
Examples
1.
To specify output of input command and displayed data to the file “sample1.prt”, and to start
output to that file:
: P sample1.prt (RET)
:
2.
To specify output of only input command to the file “sample2.prt”, and to start output to that
file:
: P sample2.prt ;C (RET)
:
3.
To append an execution history to the file “sample1.prt”:
: P sample1.prt ;A (RET)
:
a. To temporarily suspend execution history output:
: P ;D (RET)
:
b. To resume execution history output:
: P ;E (RET)
:
139
QUIT
5.29
QUIT
Exits the simulator/debugger
Q
Format
QUIT (RET)
Function
Exits the simulator/debugger and returns to the OS.
Description
1.
If an execution history file is open, it will be closed.
2.
If a command file is open, it will be closed.
3.
If the COVERAGE command is being executed, the results up to the present will be written to
the file and that file will be closed.
Note
If the coverage data could not be saved due to, e.g., insufficient disk space, when the
simulator/debugger is terminated during COVERAGE command execution (i.e., coverage has not
been terminated with a COVERAGE- command), the following message will be displayed.
Coverage data could not be saved
In such a case, check the program execution environment, and save the coverage data once again.
Example
To terminate simulator/debugger processing:
: Q (RET)
%
140
RADIX
5.30
RADIX
Sets the radix
RX
Format
Set:
RADIX˘{B|Q|D|H} (RET)
Display:
RADIX (RET)
Parameter
•
Options
— Radix {B|Q|D|H}
B : Sets the radix to binary.
Q : Sets the radix to octal.
D : Sets the radix to decimal.
H : Sets the radix to hexadecimal.
The radix is set to hexadecimal when the simulator/debugger is first invoked.
Function
Specifies the radix for command parameter input.
Displays the state of the radix setting.
Examples
1.
To display the current radix:
: RX (RET)
Hexadecimal
:
2.
To change the radix to decimal:
: RX D (RET)
: RX (RET)
Decimal
:
141
REGISTER
5.31
REGISTER
Displays register contents
R
Format
REGISTER (RET)
Function
Displays the contents of the general registers (R0–R15), the control registers (SR, GBR, VBR)
and system registers (MACH, MACL, PR, PC).
Description
1.
The same value is displayed for the SP and R15.
2.
The SR is displayed first as a value and then as the states of each bit.
•
Bits with the value 1: The mnemonic of these bits is displayed.
T:
Indicates true or false referred to by the MOVT, CMP, TAS, TST, BT, BF, SETT,
and CLRT instruction, or indicates carry, borrow, over/underflow referred to by the
ADDV/C, SUBV/C, DIVOU/S, DIV1, SHAR/L, SHLR/L,ROTR/L and ROTCR/L
instructions.
S:
Referred to by the MAC instruction.
I:
Functions as an interrupt mask bit.
Q, M: Referred to by the DIVOU/S and DIV1 instructions.
•
Bits with the value 0: These bits are displayed as a minus sign (-).
Example
To display the general and control register values:
: R
(RET)
PC=02000000 SR=000003F3:**********************MQIIII**ST SP=0FFFFFF4
GBR=00000000 VBR=00000000 MACH=00000000 MACL=00000000 PR=00000000
R0-7
00000000 00000000 00000000 00000000 00000000 00000000 00000000 00000000
R8-15 00000000 00000000 00000000 00000000 00000000 00000000 00000000 0FFFFFF4
:
142
RESET
5.32
RESET
Resets the simulator/debugger
RS
Format
RESET (RET)
Function
This function resets the simulator/debugger.
When this command is executed, the registers, the memory, the debugging object program, and the
commands are reset to the following states.
Registers:
All registers are set to 0.
Memory:
All memory settings are cleared.
The simulator/debugger goes to the memory unspecified state.
Debugging object program: All information concerning the debugging object program is deleted,
and the simulator/debugger goes to the no program loaded state.
Commands:
Except for settings made with the following commands, all settings
are cleared, and the simulator/debugger returns to its initial state.
• EXEC_MODE
• MACRO
• RADIX
Example
To reset the simulator/debugger:
: RS (RET)
:
143
SAVE
5.33
SAVE
Saves memory data to a file
SV
Format
SAVE˘<file name>˘<start address>˘{<end address>|
@<byte count>} (RET)
Parameters
•
<file name>
Specifies the name of the file to be saved.
When the file extension is omitted, the extension ".dat" is supplied.
•
<start address>˘{<end address>|@<byte count>}
Specifies the range of addresses to be saved.
Function
Outputs to a file the contents of memory in the specified range as a memory image.
Notes
1.
If the end address of the memory data exceeds the allocated memory areas, only that portion
of the data within allocated memory areas is saved.
2.
The data saved with this command differs from that saved with the SAVE_STATUS
command.
Examples
1.
To save the memory data from addresses H'2000 to H'3000 in the file “sample.lo”:
: SV sample.lo 2000 3000 (RET)
:
2.
To save the H'100 bytes of memory starting at address H'3000 in the file “sampl2.lo”:
: SV sampl2.lo 3000 @100 (RET)
:
144
SAVE_STATUS
5.34
SAVE_STATUS
SS
Saves the current simulator/debugger status in a
file
Format
SAVE_STATUS [˘<file name>][˘;{M|A}] (RET)
Parameters
•
<file name>
Specifies the name of the file in which to save the simulator/debugger status.
If the file name is omitted, the file "sdsh.sav" is used.
If the extension is omitted, the extension ".sav" is supplied.
•
Options
— Data saved {M|A}
M (memory and registers): The status of the memory and registers is saved. (default)
A (all):
The complete state of the simulator/debugger is saved.
Function
Saves the current status of the simulator.
The status of the simulator/debugger immediately following the execution of this command can be
restored by executing the LOAD_STATUS command.
Description
1.
Use with the M option
Only the status of the memory and registers is saved. This command is useful, for example,
when program errors are expected during execution by the GO, STEP, or STEP_INTO
command. If the status of the simulator/debugger is saved prior to execution with the GO,
STEP, or STEP_INTO command, then the status can be restored after an error occurs.
2.
Use with the A option
The complete state of the simulator/debugger is saved.
This form of the command is useful to resume program debugging from a particular point
after exiting and restarting the simulator/debugger.
145
SAVE_STATUS
Notes
1.
When the A option is specified, the resultant status file is not loaded with the LOAD_STATUS
command, but rather, that file is specified at simulator/debugger startup.
2.
The A option cannot be specified from within a command chain file.
Examples
1.
To save the current status of the memory and register in the file "test1.sav":
: SS test1.sav ;M (RET)
:
2.
To save the complete current status of the simulator/debugger in the file "test2.sav":
: SS test2.sav ;A (RET)
:
146
SCOPE
5.35
SCOPE
SCP
Displays the function that includes the current
execution address
Format
SCOPE (RET)
Function
Displays the file and function that include the current value of the program counter.
This command allows the user to confirm the name of the currently executing function.
Example
To display the file and function that include the current value of the program counter:
: SCP (RET)
%calc.c/add32
:
147
SET_COVERAGE
5.36
SET_COVERAGE
Sets coverage range
SCV
Format
Set:
SET_COVERAGE˘<start address>˘{<end address>|
@<byte count>} (RET)
Setting state display: SET_COVERAGE (RET)
Clear:
SET_COVERAGE- [˘<start address>] (RET)
Parameter
•
<start address>˘{<end address>|@<byte count>}
Specifies the range for which coverage information is to be acquired.
Function
Sets, displays, and clears the range of addresses over which C0 and C1 coverage information is
acquired.
Note that this command only sets the range for coverage measurement, and that the COVERAGE
command is used to start the acquisition of coverage information.
Description
Set:
Sets the area for the acquisition of C0 and C1 coverage information.
Up to 16 address ranges can be specified.
The coverage ranges may not be set during coverage execution.
When a debugging object program is loaded with the LOAD command, the
code segment areas in that program are automatically set as the address
range.
Setting state display: Displays the setting state.
When the setting state is displayed during coverage execution, the address
range(s), the file name, and the enable/disable state are displayed.
When coverage is not being executed, only the coverage areas are
displayed.
Clear:
The specified coverage area is made invalid.
When the address specification is omitted, all areas settings are cleared.
148
SET_COVERAGE
In this case a confirmation message will be displayed. Respond "Y" to
clear all areas or "N" to cancel the clear operation.
Examples
1.
To set the address range for coverage data acquisition to be from address H'1000 to address
H'12FF:
: SCV 1000 12FF (RET)
:
2.
To display coverage setting following the start of coverage measurement:
: SCV (RET)
file name
= test1.cov
Enable/Disable = E
coverage area
00001000 - 000012FF
00001800 - 00001FFF
:
3.
To cancel the area starting at address H'1000 from the coverage address ranges:
: SCV- 1000 (RET)
149
SHOW_CALLS
5.37
SHOW_CALLS
Displays function call
SHC
Format
SHOW_CALLS [˘<display count>] (RET)
Parameter
•
<display count>
Specifies the number of function calls displayed.
When omitted, all function calls are displayed.
Function
Displays the functions called up to arrival at the current address.
Description
1.
Functions are displayed in the reverse order from the order called.
2.
The display includes the file, function, and line number of the call and the arguments.
3.
When the specified display count exceeds the actual function call depth, the number of
function calls displayed is the actual function call depth.
4.
The following is displayed when there is no debugging information or when the function was
written in assembler.
•
•
The file, function, line number, and address are displayed.
Arguments: A “?” is displayed.
150
SHOW_CALLS
Examples
1.
To display the last 3 function calls:
: SHC 3 (RET)
%file.c/func_d(#
%file.c/func_c(#
%file.c/func_b(#
:
2.
2002)
1004)
777)
func_e(1,3,0)
func_d()
func_c(2)
To display all functions called up to the current function:
: SHC (RET)
%file.c/func_d(#
%file.c/func_c(#
%file.c/func_b(#
%file.c/func_a(#
%file.c/main(#
:
2002)
1004)
777)
307)
32)
func_e(1,3,0)
func_d()
func_c(2)
func_b(0)
func_a(10,1024)
151
STEP
5.38
STEP
Performs step execution in subroutine units
S
Format
STEP [˘<step count>][;R] (RET)
Parameters
•
<step count>
Specifies the number of instruction execution steps. (H'1 to H'7FFFFFFF)
When omitted, 1 step is executed.
•
Option
— Register content display R
R (register): Displays the contents of the registers after instruction execution.
Function
Executes instructions one at a time starting at the current program counter for the specified number
of steps.
Description
1.
Each time an instruction is executed the mnemonic of the executed instruction is displayed.
If the R option was specified, the contents of the registers are displayed after instruction
execution.
2.
This command executes subroutines called with a BSR or JSR instruction, from the start of
the subroutine through the RTN instruction, as a single step.
3.
Execution is halted if a condition set by a break command is satisfied, or if a
simulator/debugger error occurs. The cause of the halt is displayed when execution stops.
4.
The simulator/debugger performs processing identical to that for the input of a “STEP (RET)”
command line if a (RET) is input following the completion of STEP command execution.
152
STEP
Note
If a delayed branch instruction is executed during STEP command execution, execution stops at
the end of the instruction following the delayed branch instruction.
Example
To execute five instructions, with executing the subroutine as though it were a single step:
: S 5 (RET)
00000000
STS.L
00000002
MOV.L
00000004
JSR
00000006
NOP
00000008
LDS.L
STEP NORMAL END
:
PR,@—R15
@(0000000C,PC),R3
@%file.c/func!sub1
@R15+,PR
153
STEP_INTO
5.39
STEP_INTO
Performs step execution
SI
Format
STEP_INTO [˘<step count>][;R] (RET)
Parameters
•
<step count>
Specifies the number of instruction execution steps. (H'1 to H'7FFFFFFF)
When omitted, 1 step is executed.
•
Options
— Register content display R
R (register): Displays the contents of the registers after instruction execution.
Function
Executes instructions one at a time starting at the current program counter for the specified number
of steps.
Description
1.
Each time an instruction is executed the mnemonic of the executed instruction is displayed.
If the R option was specified, the contents of the registers are displayed after instruction
execution.
2.
The step unit is set to the source line unit at startup time, but can be changed to the machine
language instruction level with the I or N option to the DEBUG_LEVEL command.
3.
When a function is called within the program, the called function is also executed one step at a
time.
4.
Execution is halted if a condition set by a break command is satisfied, or if a
simulator/debugger error occurs.
The cause of the halt is displayed when execution stops.
5.
The simulator/debugger performs processing identical to that for the input of a “STEP_INTO
(RET)” command line if a (RET) is input following the completion of STEP_INTO command
execution.
154
STEP_INTO
Notes
If a delayed branch instruction is executed during STEP_INTO command execution, execution
stops at the end of the instruction following the delayed branch instruction.
Examples
1.
To execute one instruction and then display the mnemonic of the executed instruction and the
contents of the registers following the instruction execution:
: SI ;R (RET)
PC=00000404 SR=00000000:**********************------**-- SP=0FE00000
GBR=00000000 VBR=00000000 MACH=00000000 MACL=00000000 PR=00000000
R0-7 00000000 0000002E 00000000 00000000 00000000 00000000 00000000
00000000
R8-15 00000000 00000000 00000000 00000000 00000000 00000000 00000000
0FE00000
00000402
MOV.L
#0000002E,R1
:
2.
To execute three instructions:
: SI 3 (RET)
00000404
MOV.L
00000406
MOV.L
00000408
ADD.L
STEP NORMAL END
:
#0000002E,R4
#FFFFFFFF,R3
R1,R2
155
STUB
5.40
STUB
Executes command during simulation
SB
Format
Set:
STUB˘<stub start address>[˘<return address>] {(RET)
Display: STUB[˘<stub start address>] (RET)
Delete:
STUB- [˘<stub start address>] (RET)
Parameters
•
<stub start address>
Specifies the address in the debugging object program at which command execution is to be
performed.
•
<return address>
Specifies the address of the address to restart the debugging object program after command
execution.
When omitted, the debugging object program is restarted at the <stub start address>.
Function
Specifies addresses and commands so that instruction execution is interrupted and command
execution is performed at the point that the simulator/debugger is about to execute the instruction
at the stub start address.
Also displays and clears the stub execution address and command settings.
Description
Set:
Specifies the stub execution actions as simulator commands.
Up to 16 stub command executions can be specified.
However, since the command sequence storage area is limited, there are cases where a
full 16 stubs cannot be specified.
When the command “STUB∆<stub start address>{(RET)” is input, a prompt
(“STUB>”) indicating that STUB specification is in progress is displayed, and the
simulator/debugger waits for input of the execution command sequence.
Command line syntax is not checked during command sequence input.
Error checking is performed during stub execution.
156
STUB
Display: When the stub start address specification is omitted, a table of the stub execution start
and return positions specified with the STUB command is displayed.
When the stub start address is specified, the simulator command sequence specified for
that start address is displayed.
Deletion: Deletes the stub execution for the specified address.
When a stub execution is deleted, the replacement or insertion command set is deleted,
and the original execution sequence is restored.
When the stub start address is omitted, all stub execution addresses are deleted.
In this case a confirmation message will be displayed. Respond "Y" to delete all stub
executions or "N" to cancel the deletion.
Notes
1.
In the following case, the stub will be executed twice.
•
If stub execution is interrupted with a manual break, and execution resumed with a GO,
STEP, or STEP_INTO command, the stub will be executed twice.
Therefore, do not specify stubs that will generate different results when executed twice
(e.g., stubs that increment memory) in situations where a manual break will be used.
2.
The STUB command, “!” commands, and macro commands cannot be used within a stub.
3.
If the stub start address is specified after a delayed branch instruction, stub execution starts
before the delayed branch instruction.
Examples
1.
To specify a command set starting with the MEMORY command to be executed just prior to
the execution of the instruction at address H'1200:
Simulation will be resumed at address H'1200 after execution of the stub commands.
: SB 1200 { (RET)
STUB > M 5000 FF (RET)
STUB >
:
:
:
STUB > } (RET)
:
Sets the stub execution start address to be H'1200.
Specifies the stub execution commands.
Terminates specification.
157
STUB
2.
To display a table of stub execution addresses:
: SB (RET)
<ENTRY ADDR> <RETURN ADDR> <SYMBOL>
00001000
00001000
%file.c!eradd(#
00001200
%file.c!entrya(#
100) %file.c!eradd(#
100)
00001200
542) %file.c!entrya(#
542)
:
3.
To display the simulator command set specified for the stub execution command registered at
address H'1200:
: SB 1200 (RET)
entry address = 00001200 %file.c!entrya(#
return address = 00001200 %file.c!entrya(#
command {
M 5000 FF
:
:
:
}
:
4.
To delete the stub execution registered at address H'1200:
: SB- 1200 (RET)
:
158
542)
542)
SYMBOL
5.41
SYMBOL
Displays symbol information
SY
Format
SYMBOL [˘[%<file name>][/<function name>][!<symbol>[.<member
name>]]] (RET)
Parameters
•
<file name>
Specifies the file in which the referenced symbol is defined.
•
<function name>
Specifies the function in which the referenced symbol is defined.
•
<symbol>
Specifies the referenced symbol.
•
<member name>
Specifies the member referenced.
Function
Displays symbol information.
Description
The following symbol information is displayed according to the specified parameters.
•
Parameter specification and displayed information
In items 1 to 3 in the following table, information pertaining to the member will be displayed
if a structure or union member is specified along with the symbol.
159
SYMBOL
Item
Parameter Specification
1
SYMBOL %<file name>/<function name>!<symbol> Information pertaining to the
specified local symbol in the
SYMBOL /<function name>!<symbol>
specified function is displayed.
2
SYMBOL %<file name>!<symbol>
Information pertaining to the specified
local symbol in the specified file is
displayed.
3
SYMBOL !<symbol>
Information pertaining to the specified
global symbol is displayed.
4
SYMBOL %<file name>/<function name>
Information pertaining to the local
symbols in the specified function is
displayed.
5
SYMBOL %<file name>
Information pertaining to the local
symbols in the specified file is
displayed.
6
SYMBOL
Information pertaining to all symbols
that can be referenced currently is
displayed.
7
SYMBOL ! symbol name
Local symbols in the function, static
symbols in the file, and global
symbols are searched for in that
order, and the first symbol to be
detected is displayed.
•
Displayed Information
Symbol information display format
Symbol information is displayed in the following format.
Symbol
1
Value
2
Symbol type Sign information Type information
3
4
5
Size
6
Bit offset
7
Undefined status
8
Description:
1
Symbol
2
Value
— Address ................................................... <8 digit hexadecimal number>
— Value ....................................................... <8 digit hexadecimal number>
— SP offset.................................................. SP+<4 digit hexadecimal number>
— Structure offset........................................ +<4 digit hexadecimal number>
— Register name
— Cannot be referenced because of
C compiler optimization ......................... 'REG'
160
SYMBOL
3
Symbol type
— Variable ................................................... 'VAR'
— Label ....................................................... 'LAB'
— Function ................................................. 'FUN'
— Value ....................................................... 'VAL'
4
Sign information
— Signed ..................................................... 'S'
— Unsigned ................................................. 'U'
— Undefined ............................................... '-'
5
Type information
— Character type (1-byte integer) ............... 'BYTE'
— Integer type (2-byte) ............................... 'WORD'
— Integer type (4-byte) .............................. 'LONG'
— Floating point type (single precision) ..... 'SGL'
— Floating point type (double precision) ... 'DBL'
— Bit type.................................................... 'BITF'
— Enumerated type ..................................... 'ENUM'
— Structure type.......................................... 'STRU'
— Union type .............................................. 'UNI'
— Pointer type............................................. 'PTR'
— All other types......................................... '------'
6
Size
The number of bytes (the number of bits for integer types with a bit field type
specification) is displayed as a 4-digit hexadecimal number.
7
Bit offset
A 2-digit hexadecimal value is displayed only for integer types with a bit field type
specification.
8
Undefined status
— Undefined symbols ................................. 'U'
— Any other object ..................................... No display
161
SYMBOL
Examples
1.
To display information concerning the local symbols from the file sample:
: SY %sample.c (RET)
number................................. 00000038 VAR S BYTE 0015
:
2.
To display information concerning the local symbols from the function “main” in the file
sample:
: SY %sample.c/main (RET)
i...................................... SP+0008
:
162
VAR S LONG 0004
TRACE
5.42
TRACE
Displays trace buffer
T
Format
TRACE [˘-<start instruction index>][˘,{@<instruction count>|-<end
instruction index>|][;{I|A}] (RET)
Parameters
•
<start instruction index>
Specifies the first instruction to display.
The value indicates the point in the trace buffer at which to start display as a number of
instructions back from the end instruction stored in the trace buffer.When omitted, display
starts at the beginning of the trace buffer.
•
<instruction count>
Specifies the number of instruction to display.
When both the instruction count and the end instruction index are omitted, the end instruction
executed is displayed.
•
<end instruction index>
Specifies the end instruction to display.
The value indicates the point in the trace buffer at which to end display as a number of
instructions back from the end instruction stored in the trace buffer.
•
Options
— Display content {I|A}
I (instruction): Only instruction addresses and mnemonics are displayed.
A (all):
The instruction address, instruction mnemonic, register data, and memory
access data are displayed.
When omitted, the I option is assumed.
Function
Displays the trace results stored in the trace buffer.
163
TRACE
Description
1.
The following information is displayed.
•
•
•
•
2.
The address of the executed instruction
The mnemonic of the executed instruction
The general registers (R0 to R15), the control registers (SR, GBR, VBR), and the system
registers (MACH, MACL, PR, and PC)
The memory access data (read data is displayed as R=xxxxxx and write data as
W=xxxxxx)
Display range specified by the start instruction index.
Figure 5-3 shows the contents of the trace buffer when displaying starting at 5 instructions
back from the end of the trace buffer.
(This example assumes the command “TRACE -5”.)
First instruction executed
First instruction
displayed
–5
Display range
–1
0
Last instruction executed
Breakpoint
Trace buffer
Figure 5-3 Display Range Specified by the Start Instruction Index
164
TRACE
3.
Display range specified by the start instruction index and instruction count
Figure 5-3 shows the contents of the trace buffer when displaying 3 instructions starting at 5
instruction back from the end of the trace buffer.
(This example assumes the command “TRACE -5 @3”.)
First instruction executed
First instruction
displayed
Display range
Last instruction
displayed
–5
–4
–3
Instruction count
–2
–1
Last instruction executed
0
Breakpoint
Trace buffer
Figure 5-4 Display Range Specified by the Start Instruction Index and
the Instruction Count
Notes
1.
The addresses of the executed instructions are stored in the trace buffer during trace data
acquisition.
When displaying the contents of the trace buffer, the contents of the stored address is
disassembled and displayed as a mnemonic instruction.
As a result, if memory contents are overwritten between trace data acquisition and trace buffer
display, the displayed mnemonic can differ from the actually executed instruction.
2.
The trace buffer can hold 1023 instruction execution cycles of data. If the 1023th instruction
is a delayed branch instruction, the trace buffer can hold 1024 instructions.
165
TRACE
Examples
1.
To display the instruction addresses and mnemonics for the last five instructions stored in the
trace buffer:
: T -5 (RET)
00000100
00000102
0000010E
00000110
00000114
:
2.
STS.L
MOV.L
ADD.L
MOV>L
CMP/GE.L
PR,@—R15
#00000000,R4
#00000001,R4
#0000000A,R3
R3,R4
To display the instruction address, instruction mnemonic, register data, and memory access
data for the H'3 instructions starting five instructions back from the end of the trace buffer:
: T -5 @3 ;A (RET)
00000400
STS.L
PR,@—R15
PC=00000402 SR=00000000:**********************------**-- SP=FFFFFF8
W=00000000
GBR=00000000 VBR=00000000 MACH=00000000 MACL=00000000 PR=00000000
R0-7
00000000 0000002E 00000000 0000000A 00000001 00000000 00000000 00000000
R8-15 00000000 00000000 00000000 00000000 00000000 00000000 00000000 FFFFFFF8
00000402
MOV.L
#00000000,R4
PC=00000404 SR=00000000:**********************------**-- SP=FFFFFF8
W=00000000
GBR=00000000 VBR=00000000 MACH=00000000 MACL=00000000 PR=00000000
R0-7
00000000 0000002E 00000000 0000000A 00000001 00000000 00000000 00000000
R8-15 00000000 00000000 00000000 00000000 00000000 00000000 00000000 FFFFFFF8
00000404
ADD.L
#00000001,R4
PC=00000406 SR=00000000:**********************------**-- SP=FFFFFF8
W=00000000
GBR=00000000 VBR=00000000 MACH=00000000 MACL=00000000 PR=00000000
R0-7
00000000 0000002E 00000000 0000000A 00000001 00000000 00000000 00000000
R8-15 00000000 00000000 00000000 00000000 00000000 00000000 00000000 FFFFFFF8
:
166
TRACE_CONDITION
5.43
TRACE_CONDITION
Sets trace condition, and starts or stops trace
TC
167
TRACE_CONDITION
Format
Start: TRACE_CONDITION [;[{I|S}][˘E][˘{C|B}]] (RET)
Stop: TRACE_CONDITION ;D (RET)
Parameter
•
Options
— Instruction type {I|S}
I (instruction): All instructions are recorded in the trace buffer. (default)
S (subroutine): Only subroutine calling instructions (BSR and JSR) are recorded in the
trace buffer.
The I setting is assumed when this option is omitted.
— Trace start/stop {E|D}
E (enable):
Starts recording to the trace buffer. (default)
D (disable):
Turns off recording to the trace buffer.
The E setting is assumed when this option is omitted.
— Trace buffer full handling {C|B}
C (continue): Overwrites the previous contents of the trace buffer after the trace buffer
overflows.
B (break):
Interrupts program execution when the trace buffer overflows.
The C setting is assumed when this option is omitted.
Function
Specifies the conditions for storing the results of instruction execution in the trace buffer during
debugging object program execution due to a CALL, GO, STEP, STEP_INTO, or VECTOR
command.
168
TRACE_CONDITION
Description
1.
The following items are stored in the trace buffer.
•
•
The general registers (R0 to R15), the control registers (SR, GBR, VBR), and the system
registers (MACH, MACL, PR, and PC)
The memory access data
2.
The trace buffer is initialized at trace start.
3.
The trace buffer is organized as a ring buffer with storage for 1023 instructions.
When the B option is specified, and when 1023 instructions for trace information have been
stored, instruction execution is halted, and the simulator/debugger returns to the command
wait state. However, note that if the 1023th instruction is a delayed branch instruction, the
simulator/debugger enters command wait state when the 1024 instructions of trace
information has been acquired.
When the C option is specified, if 1024 or more instructions have been executed, the buffer is
overwritten starting at the beginning.
Figure 5-5 shows the contents of the trace buffer.
Execution order
1023 instructions
Instruction 1
.
.
.
The instruction
executed first
Instruction n
The instruction
executed last
Figure 5-5 Trace Buffer Contents
169
TRAP_ADDRESS
5.44
TRAP_ADDRESS
Sets, displays, and clears the system call start
address
TA
Examples
1.
To record all instructions in the trace buffer following the execution of the following
command:
: TC ;I (RET)
:
2.
To record only subroutine calls in the trace buffer:
: TC ;S E (RET)
:
3.
To terminate recording in the trace buffer:
: TC ;D (RET)
:
4.
To store the results of program execution in the trace buffer when instructions are executed by
a CALL, GO, STEP, STEP_INTO, or VECTOR command:
: TC ;I (RET)
: B 348 (RET)
: G (RET)
Exec Instructions = 97 Cycle=387
PC=00000348 SR=00000000:**********************------**-- SP=0FF00000
GBR=00000000 VBR=00000000 MACH=00000000 MACL=00000000 PR=00000000
R0-7
00000000 00000000 00000000 00000000 00000000 00000000 00000000
00000000
R8-15 00000000 00000000 00000000 00000000 00000000 00000000 00000000
0FF00000
00000346
MOV.L
R6,R5
: T —5 (RET)
00000340
MOV.L
#00000000,R4
00000342
ADD.L
#00000001,R4
00000344
MOV.L
#0000000A,R3
00000346
MOV.L
R6,R5
170
TRAP_ADDRESS
00000348
MOV.L
R6,R5
:
Format
Set:
TRAP_ADDRESS˘<instruction address> (RET)
Display: TRAP_ADDRESS (RET)
Clear:
TRAP_ADDRESS- (RET)
Parameter
•
<instruction address>
Specifies the system call start address.
Function
Sets, displays, and clears the system call start address used when the debugging object program
uses standard I/O or file I/O.
Only one address can be specified.
Description
Set:
If the branch address of an executed JSR or BSR instruction is the same as the address
specified with this command, normal simulation is not performed, but rather the system
call indicated by the function code is executed.
A parameter block and an I/O buffer must be allocated within the debugging object
program.
The debugging object program must set up R0 and R1, the parameter block, and the I/O
buffer before executing the JSR or BSR instruction.
Simulation is restarted from the instruction following the JSR or BSR when the system
call processing finishes.
The contents of R0 and R1 and the other registers are shown below.
Since the contents stored in the parameter bock differ for each system call function, the
parameter block contents are described under each function.
171
TRAP_ADDRESS
MSB
Register R0
1 byte
1 byte
H'01
Function code
Register R1
LSB
—
—
Parameter block address
Display: Displays the state of the system call start address setting.
Clear:
Clears the system call start address.
Notes
1.
If a JSR or BSR instruction is executed following a delayed branch instruction, an INVALID
SLOT INSTRUCTION error occurs during simulation.
2.
If a JSR or BSR instruction executed as a system call, the following instruction is executed as
a normal instruction, and not as a slot instruction. Accordingly, JSR and BSR instructions
must not be followed by an instruction whose execution results differ between the cases when
it is executed as a slot instruction and when it is executed as a normal instruction.
172
TRAP_ADDRESS
<System Call Functions>
The simulator/debugger provides functions to simulate system calls to the host system by the
debugging object program.
The table below lists the host system calls that can be used by a debugging object program.
Table 5-1 System Call Functions
Item
Function code
Function
Description
1-1
H'21
GETC
Inputs one character from standard input.
1-2
H'22
PUTC
Outputs one character to standard output.
1-3
H'23
GETS
Inputs a line of characters from standard input.
1-4
H'24
PUTS
Outputs a line of characters to standard output.
2-1
H'25
FOPEN
Opens a file.
2-2
H'26
FCLOSE
Closes a file.
2-3
H'27
FGETC
Inputs one byte from a file.
2-4
H'28
FPUTC
Outputs one byte to a file.
2-5
H'29
FGETS
Inputs a line from a file.
2-6
H'2A
FPUTS
Outputs a line to a file.
2-7
H0B
FEOF
Checks for end of file.
2-8
H'0C
FSEEK
Moves the file pointer.
2-9
H'0D
FTELL
Returns the current position of the file pointer.
173
TRAP_ADDRESS
1.
Standard I/O
These functions perform I/O from standard I/O.
Character input from standard I/O during COMMAND_CHAIN execution is taken from the
command file.
1-1 GETC
<Function>
Inputs one character from standard input.
<Function code>
H'21
<Parameter block>
MSB
15
0
+0
Input buffer address
+2
<Example>
To input one character from standard input (usually the keyboard):
MOV.L PAR_ADR,R1
MOV.L REQ_COD,R0
MOV.L CALL_ADR,R3
JSR
@R3
NOP
STOP
NOP
SYS_CALL NOP
ALIGN 4
CALL_ADR DATA.L SYS_CALL
REQ_COD .DATA.L H’01210000
PAR_ADR .DATA.L PARM
PARM
.DATA.L INBUF
174
TRAP_ADDRESS
INBUF
.RES.B 2
.END
1-2 PUTC
<Function>
Outputs one character to standard output.
<Function code>
H'22
<Parameter block>
MSB
15
0
+0
Output buffer address
+2
<Example>
To output the character 'A' to standard output (usually the console):
MOV.L PAR_ADR,R1
MOV.L REQ_COD,R0
MOV.L CALL_ADR,R3
JSR
@R3
NOP
STOP
NOP
SYS_CALL NOP
.ALIGN 4
CALL_ADR.DATA.L SYS_CALL
REQ_COD .DATA.L H’01220000
PAR_ADR .DATA.L PARM
PARM
.DATA.L OUTDATA
OUTDATA .DATA.B "A"
.END
175
TRAP_ADDRESS
176
TRAP_ADDRESS
1-3 GETS
<Function>
Inputs a line of characters from standard input.
A line feed character (LF) terminates the input line.
Up to 79 characters can be input in a line.
If more than 79 characters are input, the eightieth character will be converted to a line feed
(LF).
<Function code>
H'23
<Parameter block>
MSB
15
0
+0
Input buffer address
+2
<Example>
To input one line from standard input (usually the keyboard):
MOV.L PAR_ADR,R1
MOV.L REQ_COD,R0
MOV.L CALL_ADR,R3
JSR
@R3
NOP
STOP
NOP
SYS_CALL NOP
.ALIGN 4
CALL_ADR.DATA.L SYS_CALL
REQ_COD .DATA.L H’01230000
PAR_ADR .DATA.L PARM
PARM
.DATA.L INBUF
INBUF
.RES.B 80
.END
177
TRAP_ADDRESS
1-4 PUTS
<Function>
Outputs a line of characters to standard output.
A line feed character (LF) terminates the output line.
Up to 131 characters can be output on a line.
If more than 131 characters are output, the 132nd character will be converted to a line feed
(LF).
<Function code>
H'24
<Parameter block>
MSB
15
0
+0
Output buffer address
+2
<Example>
To output the string "Hello world" to standard output (usually the console):
MOV.L PAR_ADR,R1
MOV.L REQ_COD,R0
MOV.L CALL_ADR,R3
JSR
@R3
NOP
STOP
NOP
SYS_CALL NOP
.ALIGN 4
CALL_ADR .DATA.L SYS_CALL
REQ_COD .DATA.L H’01240000
PAR_ADR .DATA.L PARM
PARM
.DATA.L OUTDATA
OUTDATA .SDATA "Hello world"
.DATA.B H’0A
178
TRAP_ADDRESS
.END
2.
File I/O
A file number is returned when a file is opened with FOPEN.
All following operations on that file, including I/O and closing, are performed using that file
number.
Up to 16 files can be opened at the same time.
2-1 FOPEN
<Function>
Opens a file
<Function code>
H'25
<Parameter block>
MSB
8
0
15
+0
Return value
File number
+2
Open mode
Unused
+4
Start address of file name
+6
•
Return value (output)
0: Normal termination
–1: Error
•
File number (output)
The value to be used in all processing following the open.
179
TRAP_ADDRESS
•
Open mode (Input)
00 : "r"
01 : "w"
02 : "a"
03 : "r+"
04 : "w+"
05 : "a+"
10 : "rb"
11 : "wb"
12 : "ab"
13 : "rb+"
14 : "wb+"
15 : "ab+"
These modes are interpreted as follows.
"r"
"w"
"a"
"r+"
"w+"
"a+"
"b"
•
:
:
:
:
:
:
:
Open for reading.
Open for writing.
Open for appending (write starting at the end of the file).
Open for reading and writing.
Open an empty file for reading and writing.
Open for reading and appending.
Open in binary mode.
Start address of file name
The first address in the area that holds the file name.
180
TRAP_ADDRESS
<Example>
To open the file "sample.src":
.EXPORT FNUM
MOV.L PAR_ADR,R1
MOV.L REQ_COD,R0
MOV.L CALL_ADR,R3
JSR
@R3
NOP
STOP
NOP
SYS_CALL NOP
.ALIGN 4
CALL_ADR.DATA.L SYS_CALL
REQ_COD .DATA.L H’01250000
PAR_ADR .DATA.L PARM
PARM:
FOPEN_BUF.RES.B 1
FNUM
.RES.B 1
.DATA.B.0
.RES.B. 1
.DATA.L FNAME
FNAME
.SDATA "sample.src"
.DATA.B 0
.END
2-2 FCLOSE
<Function>
Closes a file.
<Function code>
H'06
<Parameter block>
181
TRAP_ADDRESS
MSB
+0
0
8
Return value
15
File number
•
Return value (output)
0: Normal termination
–1: Error
•
File number (input)
The number returned when the file was opened.
<Example>
To close the file with the file number 2:
MOV.L FNUM_ADR,R0
MOV.L #H’00000002, R1
MOV.B R1,@R0
MOV.L REQ_COD,R0
MOV.L PAR_ADR,R1
MOV.L CALL_ADR,R3
JSR
@R3
NOP
STOP
NOP
SYS_CALL NOP
.ALIGN 4
CALL_ADR .DATA.L SYS_CALL
REQ_COD
.DATA.L H’01060000
PAR_ADR
.DATA.L PARM
FNUM_ADR .DATA.L FNUM
PARM:
FCLSE_BUF .RES.B 1
FNUM
.RES.B 1
.END
2-3 FGETC
<Function>
Inputs one byte from a file.
<Function code>
H'27
<Parameter block>
182
TRAP_ADDRESS
MSB
+0
+2
8
0
Return value
15
File number
Unused
+4
Start address of input buffer
+6
•
Return value (output)
0: Normal termination
–1: EOF detected
•
File number (input)
The number returned when the file was opened.
•
Input buffer start address
The start address of the buffer for writing input data.
<Example>
To read one byte of data from the file "sample.src":
.IMPORT FNUM
MOV.L PAR_ADR,R1
MOV.L REQ_COD,R0
MOV.L CALL_ADR,R3
MOV.L FNUM_ADR,R2
MOV.B @R2,R4
MOV.L PAR_ADR,R2
ADD.L #01,R2
MOV.B R4,@R2
JSR
@R3
NOP
STOP
NOP
SYS_CALL NOP
.ALIGN 4
183
TRAP_ADDRESS
CALL_ADR
REQ_COD
PAR_ADR
FNUM_ADR
PARM:
FGETC_BUF
.DATA.L
.DATA.L
.DATA.L
.DATA.L
SYS_CALL
H’01270000
PARM
FNUM
.RES.B 2
.RES.W 1
.DATA.L INBUF
.RES.B
.END
INBUF
2-4 FPUTC
<Function>
Outputs one byte to a file.
<Function code>
H'28
<Parameter block>
MSB
+0
+2
8
0
Return value
15
File number
Unused
+4
Start address of output buffer
+6
•
Return value (output)
0: Normal termination
–1: Error
•
File number (input)
The number returned when the file was opened.
184
TRAP_ADDRESS
•
Output buffer start address
The start address of the buffer used to hold the output data.
185
TRAP_ADDRESS
<Example>
To output one byte of data (the character 'A') to the file "sample.src":
.IMPORT FNUM
MOV.L PAR_ADR,R1
MOV.L REQ_COD,R0
MOV.L CALL_ADR,R3
MOV.L FNUM_ADR,R2
MOV.B @R2,R4
MOV.L PAR_ADR,R2
ADD.L #01,R2
MOV.B R4,@R2
JSR
@R3
NOP
STOP
NOP
SYS_CALL NOP
.ALIGN 4
CALL_ADR.DATA.L SYS_CALL
REQ_COD .DATA.L H’01280000
PAR_ADR .DATA.L PARM
FNUM_ADR.DATA.L FNUM
PARM:
FPUTC_BUF.RES.B 2
.RES.W 1
.DATA.L OUTDATA
OUTDATA .DATA.B "A"
.END
186
TRAP_ADDRESS
2-5 FGETS
<Function>
Reads in character string data from a file. Data is read in until either a newline code or a
NULL code is read, or until the buffer is full.
A NULL code is appended to the end of the character string read from the file.
<Function code>
H'29
<Parameter block>
MSB
+0
+2
+4
8
0
Return value
15
File number
Buffer size
Start address of input buffer
+6
•
Return value (output)
0: Normal termination
–1: EOF detected
•
File number (input)
The number returned when the file was opened.
•
Buffer size (input)
The size of the area for storing data. A maximum of 256 bytes can be stored.
•
Input buffer start address (input)
The start address of the buffer for storing input data.
187
TRAP_ADDRESS
<Example>
To read character string data from the file "sample.src":
.IMPORT FNUM
MOV.L PAR_ADR,R1
MOV.L REQ_COD,R0
MOV.L CALL_ADR,R3
MOV.L FNUM_ADR,R2
MOV.B @R2,R4
MOV.L PAR_ADR,R2
ADD.L #01,R2
MOV.B R4,@R2
JSR
@R3
NOP
STOP
NOP
SYS_CALL NOP
CALL_ADR .DATA.L SYS_CALL
REQ_COD
.DATA.L H’01290000
PAR_ADR
.DATA.L PARM
FNUM_ADR .DATA.L FNUM
PARM
.RES.B 2
.DATA.W 256
.DATA.L INBUF
OUTDATA .RES.B 256
.END
2-6 FPUTS
<Function>
Writes character string data to a file.
The NULL character terminating the character string is not written to the file.
<Function code>
H'2A
188
TRAP_ADDRESS
<Parameter block>
MSB
+0
+2
0
15
8
Return value
File number
Unused
+4
+6
Start address of output buffer
•
Return value (output)
0: Normal termination
–1: Error
•
File number (input)
The number returned when the file was opened.
•
Output buffer start address (input)
The start address of the buffer used to hold the output data.
189
TRAP_ADDRESS
<Example>
To write the character string "Hello world" the file "sample.src":
.IMPORT FNUM
MOV.L PAR_ADR,R1
MOV.L REQ_COD,R0
MOV.L CALL_ADR,R3
MOV.L FNUM_ADR,R2
MOV.B @R2,R4
MOV.L PAR_ADR,R2
ADD.L #01,R2
MOV.B R4,@R2
JSR
@R3
NOP
STOP
NOP
SYS_CALL NOP
.ALIGN 4
CALL_ADR .DATA.L SYS_CALL
REQ_COD
.DATA.L H’012A0000
PAR_ADR
.DATA.L PARM
FNUM_ADR .DATA.L FNUM
PARM:
FPUTS_BUF .RES.B 2
.RES.W 1
.DATA.L OUTDATA
OUTDATA
.SDATA "Hollow world"
.DATA.B 0
.END
190
TRAP_ADDRESS
2-7 FEOF
<Function>
Checks for end of file.
<Function code>
H'0B
<Parameter block>
MSB
+0
0
8
Return value
15
File number
•
Return value (output)
0: File pointer is not at EOF.
–1: EOF detected.
•
File number (input)
The number returned when the file was opened.
<Example>
To test the file "sample.src" for EOF:
.IMPORT FNUM
MOV.L PAR_ADR,R1
MOV.L REQ_COD,R0
MOV.L CALL_ADR,R3
MOV.L FNUM_ADR,R2
MOV.B @R2,R4
MOV.L PAR_ADR,R2
ADD.L #01,R2
MOV.B R4,@R2
JSR
@R3
NOP
STOP
NOP
SYS_CALL NOP
.ALIGN 4
CALL_ADR .DATA.L SYS_CALL
REQ_COD .DATA.L H’010B0000
191
TRAP_ADDRESS
PAR_ADR .DATA.L PARM
FNUM_ADR .DATA.L FNUM
PARM:
FEOF_BUF .RES.B 2
.END
2-8 FSEEK
<Function>
Moves the file pointer to the specified position.
<Function code>
H'0C
<Parameter block>
MSB
8
0
+0
Return value
+2
Direction
15
File number
Unused
+4
Offset (upper word)
+6
Offset (lower word)
•
Return value (output)
0: Normal termination
–1: Error
•
File number (input)
The number returned when the file was opened.
•
Direction (input)
0: The offset specifies the position as a byte count from the start of the file.
1: The offset specifies the position as an offset from the current file pointer.
2: The offset specifies the position as a byte count from the end of the file.
•
Offset (input)
192
TYPE
5.45
TYPE
Displays variable value
TY
The byte count to be interpreted as specified by the direction parameter.
193
TYPE
<Example>
To move the file pointer in "sample.src" to the H'100th byte from the start of the file:
.IMPORT FNUM
MOV.L PAR_ADR,R1
MOV.L REQ_COD,R0
MOV.L CALL_ADR,R3
MOV.L FNUM_ADR,R2
MOV.B @R2,R4
MOV.L PAR_ADR,R2
ADD.L #01,R2
MOV.B R4,@R2
JSR
@R3
NOP
STOP
NOP
SYS_CALL NOP
.ALIGN 4
CALL_ADR .DATA.L SYS_CALL
REQ_COD
.DATA.L H’010C0000
PAR_ADR
.DATA.L PARM
FNUM_ADR .DATA.L FNUM
PARM:
FSEEK_BUF .RES.B 2
.DATA.B 0
.RES.B 1
.DATA.W 0
.DATA.W H’100
.END
194
VECTOR
5.46
VECTOR
Executes from an interrupt vector address
V
2-9 FTELL
<Function>
Returns the current position of the file pointer.
<Function code>
H'0D
<Parameter block>
MSB
+0
0
8
Return value
15
File number
+2
Unused
+4
Offset (upper word)
+6
Offset (lower word)
195
VECTOR
•
Return value (output)
0: Normal termination
–1: Error
•
File number (input)
The value returned when the file was opened.
•
Offset (output)
The current position of the file pointer, as a byte count from the start of the file.
<Example>
To determine the current position of the file pointer in the file "sample.src":
.IMPORT FNUM
MOV.L PAR_ADR,R1
MOV.L REQ_COD,R0
MOV.L CALL_ADR,R3
MOV.L FNUM_ADR,R2
MOV.B @R2,R4
MOV.L PAR_ADR,R2
ADD.L #01,R2
MOV.B R4,@R2
JSR
@R3
NOP
STOP
NOP
SYS_CALL NOP
.ALIGN 4
CALL_ADR .DATA.L SYS_CALL
REQ_COD
.DATA.L H’010D0000
PAR_ADR
.DATA.L PARM
FNUM_ADR .DATA.L FNUM
PARM:
FTELL_BUF .RES.B 2
.RES.W 1
.RES.W 2
.END
196
.<register>
5.47
.<register>
Modifies register content
Format
TYPE˘<variable>[;{B|Q|D|H|A}] (RET)
Parameters
•
<variable>
Specifies the variable whose value is to be displayed.
•
Options
— Display format specifier {B|Q|D|H|A}
B : Display in binary.
Q : Display in octal.
D : Display in decimal.
H : Display in hexadecimal.
A : Display as an ASCII character.
Function
Displays the value of the specified variable in the specified format.
When the display format specification is omitted, pointer variables are displayed in hexadecimal,
character variables are displayed in ASCII, and other variables are displayed in decimal. However,
a period is displayed for character variables with values that cannot be displayed.
197
.<register>
Examples
1.
To display the value of the variable "abc" in hexadecimal:
: TY abc ;H (RET)
abc 100F
:
2.
To display the value of the variable "xyz". Since the display format specifier is omitted, the
value is displayed in decimal:
: TY xyz (RET)
xyz 14770
:
3.
To display the value of the static variable "efg":
: TY %file.c!efg (RET)
%file.c!efg
32768
:
198
!
5.48
!
Invokes sub-process
Format
VECTOR˘<vector number> (RET)
Parameters
•
<vector number>
Specifies the interrupt vector number.
Function
Generates the vector address from the vector number and starts exception processing from the
contents of the vector address.
(1) The current PC and SR are saved on the stack.
(2) The vector address is generated from the vector number and exception processing is
initiated from the contents of the vector address.
Description
1.
This command is used to test the operation of exception handlers when exceptions occur.
2.
The terminating conditions are the same as those for the GO, STEP, and STEP_INTO, CALL
commands.
3.
H'0 to H'FF can be specified as the vector number.
Notes
1.
When the content of the vector area memory address is H'0, execution halts after steps (1) and
(2).
2.
There are cases where the range of vector numbers that can be specified in the
simulator/debugger differs from the range that can be specified with the actual CPU.
199
!
Example
To start execution at the address specified in vector number 1:
: VECTOR 1 (RET)
Exec Instructions = 159
PC=0000014A SR=00000000:**********************------**-- SP=0FF00000
GBR=00000000 VBR=00000000 MACH=00000000 MACL=00000000 PR=00000000
R0-7
00000000 00000000 00000000 0000000A 00000000 00000000 00000000 00000000
R8-15 00000000 00000000 00000000 00000000 00000000 00000000 0FF00000 0FF00000
00000148
MOV.L
R7,R6
BREAK POINT
:
200
Part II CPU Information Analysis Program
Section 1 Creating the CPU Information
The simulator/debugger uses a CPU information file to load segments according to the memory
map for the corresponding SH series CPU and to assure that segments are not loaded crossing
memory type boundaries. The CPU information file is created using the CIA (CPU information
analysis) program. Note that the H-series linkage editor can also use the CPU information file to
check segment allocation. Refer to the H-Series Linkage Editor User’s Manual for details.
1.1 CIA Functions
The CIA program provides the following three functions.
1.
CPU information file creation
Produces the CPU memory map information file for the SH-series CPU used.
2.
CPU information file display
Allows the contents of the generated CPU information file to be checked.
3.
CPU information file editing (deletion/addition)
Allows the contents of the generated CPU information file to be modified by deletion or
addition.
1.2 Invoking the CIA Program
The format of the command line used to invoke the CIA program is shown below.
% cia˘<CPU information file name> (RET)
1
2
SH SERIES CIA Ver. 1.1 (HS0700CICU1SM)
Copyright (C) Hitachi, Ltd. 1992
Licensed Material of Hitachi, Ltd.
1
The CIA invocation command.
2
Either an existent or a new CPU information file can be specified. When an existent CPU
information file is specified, the program requests the input of a name for the output CPU
information file. If the extension is omitted, the extension ".cpu" is supplied.
203
1.3 CIA Usage Procedures and Selection Menus
Figure 1-1 shows the procedure used with the CIA program.
CIA program invocation
(1)
CPU selection
(2)
Bit size and comment input processing
(Continue)
(3)
Memory map specification processing
' . ' (Exit)
(Continue)
(4)
Editing
' . ' (Exit)
CIA termination
Figure 1-1 CIA Usage Procedure
1.
The following is presented as a CPU information menu.
1: SH 7000
•
When '1' (SH 7000) is selected, the SH 7000 is specified.
204
2.
Bit size and comment input
The bit size specifies the number of bits in addresses in the memory map, and thus defines the
settable range. For example, if a bit size of 28 is specified, locations from H'0 to H'FFFFFFF
can be used, and if a bit size of 32 is specified, locations from H'0 to H'FFFFFFFF can be
used.
A comment can be specified to identify the CPU information. A comment of up to 127
characters can be specified.
The bit size and comment are only input when creating a new CPU information file. The CIA
procedure starts with step (4), Editing, when an existent CPU information file is specified.
3.
Memory map specification
The following options are presented as a CPU information input menu. Memory map
specification is iterated until a period (the exit command) is specified.
0: ROM
4.
1: EXTERNAL
2: RAM
3: I/O
.: END
•
Options 0 to 3 specify a memory type, and each time one of these options is selected, the
system prompts for the start address, the end address, the number of states, and the data
bus width.
•
When a period ('.') is entered, the memory map setup menu processing terminates.
Editing
The following options are presented as a CPU information editing menu.
1: ADD
2: DELETE
3: COMMENT
4: CIA ABORT
.: CIA END
•
When '1' (ADD) is selected, the memory map specification of step (3) is performed.
•
When '2' (DELETE) is selected, the system prompts (by index number) for input of an
address range to be deleted.
•
When '3' (COMMENT) is selected, the system inputs a new comment line.
•
When '4' (CIA ABORT) is selected, CIA processing is terminated without saving the CPU
information file.
•
When '.' (CIA END) is selected, the system writes out the memory map information to the
CPU information file and completes CIA processing normally.
205
1.4 CIA Sample Sessions
This section presents two sample CIA sessions. The underlined sections are user inputs.
1.
Creating a new CPU information file for the SH 7000 (mode 0).
% cia shmode0.cpu (RET) ← 1
SH SERIES CIA Ver. 1.1 (HS0700CICU1SM)
Copyright (C) Hitachi, Ltd. 1992
Licensed Material of Hitachi, Ltd.
*** NEW FILE ***
*** CPU MENU ***
1:SH 7000
? 1 (RET)
← 2
BIT SIZE 32 ? :32 (RET) ← 3
COMMENT?
:’93.01.25 SH SAMPLE (RET) ← 4
*** MAP MENU ***
0:ROM
1:EXTERNAL
2:RAM
3:I/O
.:END
? 1 (RET)← 5
* EXTERNAL START ADDRESS? 00000000 (RET)
←
6
END
ADDRESS? 00FFFFFF (RET)
←
7
STATE COUNT
? 3 (RET)←
8
DATA BUS SIZE
?
8
(RET)←
9
*
*
EXTERNAL START ADDRESS?
END
ADDRESS?
STATE COUNT
?
DATA BUS SIZE
?
EXTERNAL START ADDRESS?
01000000 (RET)
04FFFFFF (RET)
2 (RET)
8 (RET)
. (RET)←
0
*** MAP MENU ***
0:ROM
1:EXTERNAL
2:RAM
3:I/O
.:END
? 3 (RET)
* I/O AREA START ADDRESS? 05000000 (RET)
END
ADDRESS? 05FFFFFF (RET)
STATE COUNT
? 3 (RET)
DATA BUS SIZE
? 8 (RET)
206
*
I/O AREA START ADDRESS?
207
. (RET)
*** MAP MENU ***
0:ROM
1:EXTERNAL
2:RAM
3:I/O
.:END
? 1 (RET)
* EXTERNAL START ADDRESS? 06000000 (RET)
END
ADDRESS? 07FFFFFF (RET)
STATE COUNT
? 3 (RET)
DATA BUS SIZE
? 8 (RET)
* EXTERNAL START ADDRESS? . (RET)
*** MAP MENU ***
0:ROM
1:EXTERNAL
2:RAM
3:I/O
.:END
? 2 (RET)
* RAM AREA START ADDRESS? 0F000000 (RET)
END
ADDRESS? 0FFFFFFF (RET)
STATE COUNT
? 1 (RET)
DATA BUS SIZE
? 32 (RET)
* RAM AREA START ADDRESS? . (RET)
*** MAP MENU ***
0:ROM
1:EXTERNAL
2:RAM
3:I/O
.:END
? . (RET) ←
***** CPU INFORMATION *****
CPU : SH 7000←
’93.01.25 SH SAMPLE ←
BIT SIZE : 32←
No
Device
Start
End
State
Bus
1 : EXTERNAL : 00000000 - 00FFFFFF 3
8
2 : EXTERNAL : 01000000 - 04FFFFFF 2
8
3 : I/O AREA : 05000000 - 05FFFFFF 3
8
4 : EXTERNAL : 06000000 - 07FFFFFF 3
8
5 : RAM AREA : 0F000000 - 0FFFFFFF 1
32
(d)
(e)
(f)
(g)
(h)
(i)
** EDIT MENU **
1:ADD
2:DELETE
3:COMMENT 4:CIA ABORT
.:CIA END
? . (RET) ←
*** CIA COMPLETED ***
%
Description:
1
2
3
The name of a new CPU information file is specified when the CIA program is invoked.
This item specifies the CPU type.
The bit size is specified in decimal. The displayed default is taken if the specification is
omitted.
208
q
(a)
(b)
(c)
w
4
5
6
7
8
9
0
q
w
This line is a comment. The comment field is left blank if this line is omitted. If more than
127 characters are entered, a warning message is displayed and the characters following the
first 127 are ignored.
The memory type is entered as a number corresponding to the input menu.
The start address of the corresponding memory area is entered in hexadecimal.
The end address of the corresponding memory area is entered in hexadecimal.
The number of states for the corresponding memory area is entered in decimal.
The data bus width for the corresponding memory area is entered in decimal.
Data entry for the corresponding memory area is terminated with a period ('.').
The edit menu is automatically displayed when the input menu is terminated.
(a) The CPU type specified in item 2
(b) The comment entered in item 4
(c) The bit size specified in item 3
(d) The map number
(e) The memory type specified in item 5
(f) The start address specified in item 6
(g) The end address specified in item 7
(h) The number of states specified in item 8
(i) The data bus width specified in item 9
This input terminates CIA processing normally. The memory map data is written to the file
specified when the CIA program was invoked.
209
2.
A sample session in which an SH 7000 CPU information file is edited
Mode 0 is changed to mode 2 in this session.
%
cia shmode0.cpu (RET)← 1
SH SERIES CIA Ver. 1.1 (HS0700CICU1SM)
Copyright (C) Hitachi, Ltd. 1992
Licensed Material of Hitachi, Ltd.
*** OLD FILE ***
NEW CPU FILE NAME? shmode2
(RET) ← 2
***** CPU INFORMATION *****
CPU : SH 7000
’93.01.25 SH SAMPLE
BIT SIZE : 32
No
Device
Start
1 : EXTERNAL : 00000000
2 : EXTERNAL : 01000000
3 : I/O AREA : 05000000
4 : EXTERNAL : 06000000
5 : RAM AREA : 0F000000
End
State
00FFFFFF
3
04FFFFFF
2
05FFFFFF
3
07FFFFFF
3
0FFFFFFF
1
-
Bus
8
8
8
8
32
** EDIT MENU **
1:ADD
2:DELETE
3:COMMENT
4:CIA ABORT
.:CIA END
? 2 (RET) ← 3
DELETE MAP NUMBER? 1 (RET)← 4
***** CPU INFORMATION *****
CPU : SH 7000
’93.01.25 SH SAMPLE
BIT SIZE : 32
No
Device
Start
1 : EXTERNAL : 01000000
2 : I/O AREA : 05000000
3 : EXTERNAL : 06000000
4 : RAM AREA : 0F000000
210
-
End
State
04FFFFFF
2
05FFFFFF
3
07FFFFFF
3
0FFFFFFF
1
Bus
8
8
8
32
** EDIT MENU **
1:ADD
2:DELETE
3:COMMENT
4:CIA ABORT
.:CIA END
? 1 (RET) ← 5
*** MAP MENU ***
0:ROM
1:EXTERNAL
2:RAM
3:I/O
.:END
? 0 (RET)← 6
* ROM AREA START ADDRESS? 00000000 (RET)
END
ADDRESS? 00FFFFFF (RET)
STATE COUNT
? 1 (RET)
DATA BUS SIZE
? 32 (RET)
* ROM AREA START ADDRESS? . (RET)
*** MAP MENU ***
0:ROM
1:EXTERNAL
? . (RET)
2:RAM
3:I/O
***** CPU INFORMATION *****
CPU : SH 7000
’93.01.25 SH SAMPLE
BIT SIZE : 32
No
Device
Start
1 : ROM AREA : 00000000
2 : EXTERNAL : 01000000
3 : I/O AREA : 05000000
4 : EXTERNAL : 06000000
5 : RAM AREA : 0F000000
** EDIT MENU **
1:ADD
2:DELETE
? . (RET)
*** CIA COMPLETED ***
%
3:COMMENT
-
.:END
End
State
00FFFFFF
1
04FFFFFF
2
05FFFFFF
3
07FFFFFF
3
0FFFFFFF
1
4:CIA ABORT
Bus
32
8
8
8
32
.:CIA END
Description:
1
2
3
The name of the file to be edited is specified when the CIA program is invoked. ".cpu" is
supplied if the extension is omitted.
This item specifies a new file to be created when editing is done. If only (RET) is entered, the
data will be output to the file specified in item 1 . If only the extension is omitted, ".cpu" will
be supplied. The map data is automatically displayed.
"DELETE" is specified to delete information to be changed in the edit menu.
211
4
5
6
The information to be deleted is specified as a map number. The state of the map information
after the deletion is displayed.
“ADD” is specified to input the changed information.
The input menu is displayed, and the memory type is entered in the same manner as that used
when creating a new CPU information file. The state of the map information after the
addition is displayed.
1.5 CIA Limitations
Table 1-1 lists the limitations on data specified using the CIA program. The CIA program cannot
handle values which exceed these limitations.
Table 1-1 CIA Limitations
Item
Limitation Value
Input file format
• CPU information files
output by the SH CIA
Bit size
• Only values specified
in decimal
• The specifiable range is
from 24 to 32
Address specifications
• Only values specified in
hexadecimal
• The specifiable range
depends on the bit size
The range is from H'0
to H'FFFFFF when the
bit size is 24.
Number of states
• Only values specified in
decimal
• The specifiable range is
from 1 to 65535
Specify the number of
states including the wait
states when wait states
are inserted.
Data bus width
• Only values specified in
decimal
• The specifiable values are
multiples of 8 between 8 and
65528
Comment length
• Up to 127 characters
Number of map
information items
• Up to 65535 items
212
Notes
Note that there may be
limitations imposed by
the memory capacity of
the system on which the
CIA program is running.
Invalid regions are also
included in the number
of items.
213
Appendix A Differences between Line Assemble Command
and SH-Series Cross Assembler Syntax
Table A-1 lists the differences between the syntax of the SH-series cross assembler and the syntax
of the simulator/debugger line assembly function.
Table A-1 Differences between Line Assemble Command and SH-Series Cross Assembler
Syntax
Item
Line Assemble Command
SH-Series Cross Assembler
Location counter
reference
Not allowed
Allowed
Example:
MOV.L @(H'100-$,R0),R1
Use of the '-'
character to
represent unitary
negation
Not allowed
Example:
Use 0-10 to specify -10,
e.g. MOV.L #0-10,R0
Allowed
Example:
The notation -10
can be used,
e.g. MOV.L #-H'10,R0
Use of control
directives
Allowed in .DATA only
Allowed
Label definition
Not allowed
Allowed
Data value
default radix
Hexadecimal
Decimal
Handling of
instructions that
generate warnings
with the SH assembler.
These instructions are errors,
and no code is generated.
Code is generated.
An instruction following
a delay branch
instruction is
branch instruction.
(Invalid slot Instruction)
Code is generated.
During simulation,
exception processing
starts.
An error occurs and
no code is generated.
215
Appendix B SH-Series Assembler Mnemonics
Table B-1 lists the mnemonics that can be used with the simulator/debugger’s line assemble
commands.
Table B-1 Assembler Mnemonics Recognized by the Line Assemble Command
Type
Instruction
Number of Instructions
Data transfer
MOV, MOVA, MOVT, SWAP, XTRCT
5
Arithmetic
operation
ADD, ADDC, ADDV, CPM/cond,
DIV1, DIV0S, DIV0U, EXTS,
EXTU, MAC, MULS, MULU, NEG,
NEGC, SUB, SUBC, SUBV
17
Logic operation
AND, NOT, OR, TAS, TAT, XOR
6
Shift and rotate
ROTL, ROTR, ROTCL, ROTCR,
SHAL, SHAR, SHLL, SHLR,
SHLLn, SHLRn
10
Branch, jump,
and return
BF, BT, BRA, BSR, JMP, JSR,
RTS
7
Privileged and
control register
manipulations
CLRT, CLRMAC, LDC, LDS, NOP,
RTE, SETT, SLEEP, STC, STS,
TRAPA
11
216
Appendix C SH-Series Memory Maps
Table C-1 shows the SH7000 memory maps.
Table C-1 SH7000 Memory Map
Mode 0
(Extended mode without ROM)
H'0x00000–
H'0x003FF
Vector area
Mode 1
(Extended mode without ROM)
H'0x00000–
H'0x003FF
External bus area/cs0
(Bus width: 8 bits)
H'1x00000
H'1x00000
H'6x00000
H'8x00000
Internal I/O area
(Bus width: 8/16 bits)
External bus area/
cs6 and cs7
(Bus width: 8/16 bits)
External bus area/cs0
(Bus width: 8/16 bits)
H'9x00000
H'5x00000
H'6x00000
H'8x00000
H'FxFFFFF
Notes: 1.
2.
3.
4.
H'1x00000
Internal I/O area
(Bus width: 8/16 bits)
External bus area/
cs6 and cs7
(Bus width: 8/16 bits)
External bus area/cs0
(Bus width: 16 bits)
H'9x00000
Internal RAM area
(Bus witdth: 32 bits)
H'FxFFFFF
Vector area
Internal ROM area
(Bus width: 32 bits)
H'1x00000
H'5x00000
H'6x00000
H'8x00000
Internal I/O area
(Bus width: 8/16 bits)
External bus area/
cs6 and cs7
(Bus width: 8/16 bits)
Internal bus area
(Bus width: 32 bits)
H'9x00000
Internal RAM area
(Bus witdth: 32 bits)
H'0x00000–
H'0x003FF
External bus area/
cs1–cs4
(Bus width: 8 bits)
External bus area/
cs1–cs6
(Bus width: 16 bits)
H'Fx00000
Vector area
Mode 7
(PROM mode)
External bus area/cs0
(Bus width: 32 bits)
External bus area/
cs1–cs4
(Bus width: 8 bits)
External bus area/
cs1–cs6
(Bus width: 16 bits)
H'Fx00000
H'0x00000–
H'0x003FF
External bus area/cs0
(Bus width: 16 bits)
External bus area/
cs1–cs4
(Bus width: 8 bits)
H'5x00000
Vector area
Mode 2
(Extended mode with ROM)
H'5x00000
Internal I/O area
(Bus width: 8/16 bits)
H'6x00000
H'8x00000
Internal ROM area
(Bus width: 32 bits)
H'9x00000
External bus area/
cs1–cs6
(Bus width: 16 bits)
H'Fx00000
Internal RAM area
(Bus witdth: 32 bits)
H'FxFFFFF
The example in section 1.4.1, CPU Information File Creation Program, uses mode 0 (extended mode without ROM).
The example in section 1.4.2, CPU Information File Creation Program, uses mode 2 (extended mode with ROM).
In the SH-series, external bus spaces do not coexist with the same/csn (chip select pins).
Two internal ROM areas exist in modes 2 and 7 are actually the same area in the SH-series.
217
H'Fx00000
H'FxFFFFF
Internal RAM area
(Bus witdth: 32 bits)
218
Notes: 1.
2.
3.
4.
Internal RAM area
(Bus witdth: 32 bits)
External bus area/
cs1–cs6
(Bus width: 16 bits)
External bus area/cs0
(Bus width: 8/16 bits)
External bus area/
cs6 and cs7
(Bus width: 8/16 bits)
Internal I/O area
(Bus width: 8/16 bits)
External bus area/
cs1–cs4
(Bus width: 8 bits)
External bus area/cs0
(Bus width: 8 bits)
Vector area
H'FxFFFFF
H'Fx00000
H'9x00000
H'8x00000
H'6x00000
H'5x00000
H'1x00000
H'0x00000–
H'0x003FF
Internal RAM area
(Bus witdth: 32 bits)
External bus area/
cs1–cs6
(Bus width: 16 bits)
External bus area/cs0
(Bus width: 16 bits)
External bus area/
cs6 and cs7
(Bus width: 8/16 bits)
Internal I/O area
(Bus width: 8/16 bits)
External bus area/
cs1–cs4
(Bus width: 8 bits)
External bus area/cs0
(Bus width: 16 bits)
Vector area
Mode 1
(Extended mode without ROM)
H'FxFFFFF
H'Fx00000
H'9x00000
H'8x00000
H'6x00000
H'5x00000
H'1x00000
H'0x00000–
H'0x003FF
Internal RAM area
(Bus witdth: 32 bits)
External bus area/
cs1–cs6
(Bus width: 16 bits)
Internal bus area
(Bus width: 32 bits)
External bus area/
cs6 and cs7
(Bus width: 8/16 bits)
Internal I/O area
(Bus width: 8/16 bits)
External bus area/
cs1–cs4
(Bus width: 8 bits)
External bus area/cs0
(Bus width: 32 bits)
Vector area
Mode 2
(Extended mode with ROM)
The example in section 1.4.1, CPU Information File Creation Program, uses mode 0 (extended mode without ROM).
The example in section 1.4.2, CPU Information File Creation Program, uses mode 2 (extended mode with ROM).
In the SH-series, external bus spaces do not coexist with the same/csn (chip select pins).
Two internal ROM areas exist in modes 2 and 7 are actually the same area in the SH-series.
H'FxFFFFF
H'Fx00000
H'9x00000
H'8x00000
H'6x00000
H'5x00000
H'1x00000
H'0x00000–
H'0x003FF
Mode 0
(Extended mode without ROM)
Table C-1 SH7000 Memory Map
H'FxFFFFF
H'Fx00000
H'9x00000
H'8x00000
H'6x00000
H'5x00000
H'1x00000
H'0x00000–
H'0x003FF
Internal RAM area
(Bus witdth: 32 bits)
Internal ROM area
(Bus width: 32 bits)
Internal I/O area
(Bus width: 8/16 bits)
Internal ROM area
(Bus width: 32 bits)
Vector area
Mode 7
(PROM mode)
Appendix D Sample Programs
/***************************************/
/**
FILE NAME IS sample.c
**/
/***************************************/
#include "stdio.h"
struct rec_ctl {
short
rec_it;
short
rec_ln;
short
rec_no;
struct rec_ctl *rec_nx;
};
short Print_rec(void);
void
Read_rec(void);
void
Bin_ascii(char *p);
void
Ph_read(char *bp);
/*----------------------------------------------------------------------*/
/* ASSEMBLER I/O SIMULATION SUBROUTINES.
*/
/*----------------------------------------------------------------------*/
extern short F_open(char *name, char *mode, short f_id);
extern short F_close(short f_id);
extern short Read(char *p);
extern void Write(char *p);
extern short F_read(short f_id char *p);
struct
short
char
char
char
short
short
rec_ctl rec_v0[1000];
stop_f, phg_pos, phg_lng, rec_num, nxt_f, l_rec_no;
log_rec[512], phg_rec[1024];
l_buf[30] = "--------------------¥n";
f_name[80];
f_id;
f_no;
void main()
{
/*: Make the file name prompt. -----------------------------------------*/
Write("File Name please.");
Read(f_name);
/*: Try to open INPUT file._--------------------------------------------*/
/*: “F_open” will return 0
n : successful. The number is file ID. ----*/
/*:
-1
: open failed. --------------------------*/
f_no = (short)0;
f_id == F_open(f_name, “rt”, f_no);
/*: Initialization. ----------------------------------------------------*/
stop_f
= (shortt)0;
/*: Loop control.
*/
phg_pos = (shortt)-1;
/*: Record extract index. (-1 = No data) */
nxt_f
= (shortt)0;
/*: EOF marker.
*/
l_rec_no = (shortt)0;
/*: Record counter.
*/
/*:---------------------------------------------------------------------*/
/*: Loop of record read/print process.
*/
/*: “Print_rec” will return 1 when ending data had been processed.
*/
219
/*:---------------------------------------------------------------------*/
while (stop_f == 0)
{
stop_f = Print_rec();
}
/*: Completed. Close and exit. -----------------------------------------*/
/*: “F_close” will return 0 : successful. ------------------------------*/
/*:
1 : unsuccessful. ----------------------------*/
F_close(f_no);
}
/*:---------------------------------------------------------------------*/
/*: Name : Printf_rec; Read and print records.
*/
/*: Func : Read and printf 1 logical record.
*/
/*:---------------------------------------------------------------------*/
short Print_rec()
{
short wi, put_pos, rec_pos, rec_lng, rtncd;
char hex_buf[100], asc_buf[100],
l_char, r_char, il_char, ir_char, *hx_p;
/*: Read 1 record. “Read_rec” sets the data to "log_rec" array. --------*/
Read-rec();
/*: Save Record IT (ID), Length, and record number. --------------------*/
rec_v0[1_rec_no].rec_it = (char)(0x7f & log_rec[0]);
rec_v0[1_rec_no].rec_ln = (unsigned char)log_rec[l];
rec_v0[1_rec_no].rec_no = rec_num;
/*: Make IT characters. ------------------------------------------------*/
il_char = (char)(rec_v0[l_rec_no].rec_it >> 4);
ir_char = (char)(rec_v0[1_rec_no].rec_it & 0x0f);
Bin_ascii(&il_char);
Bin_ascii(&ir_char);
/*: Make record length characters. -------------------------------------*/
l_buf[15] = il_char;
l_buf[16] = ir_char;
/*: Print header. IT and length. ---------------------------------------*/
Write(l_buf);
/*: Ending record check. Ending record IT is 0x7F. ---------------------*/
if (rec_v0[1_rec_no}.rec_it == (char)0x7f)
{
rtncd = (short)l;
return (rtncd);
}
/*: Not a endinf record. Edit and print each 16 bytes. -----------------*/
rec_lng = (short)(
rec_v0[l_rec_no].rec_ln - (short)2 ); /*: length adjust.
*/
rec_pos = (short)2;
/*: data position.
*/
for (wi = (short)0; wi < (short)36;
hex_buf[wi++] = (char)0x20);
/*: buffer initial
*/
for (wi = (short)0; wi < (short)16;
asc_buf[wi++] = (char)0x20);
/*:
clear. */
hx_p = &hex_buf[0];
/*:
*/
put_pos = (short)0;
/*: 1 line position.
*/
220
/*:---------------------------------------------------------------------*/
/*: Edit and print loop.
*/
/*:---------------------------------------------------------------------*/
while (rec_lng > 0)
{
if (put_pos == 16)
{
/*: buffer full with 16 bytes. print them via asm- I/O simulation.
*/
hex_buf[36] = (char)0x00;
/*: Terminal NULL.
*/
asc_buf[16] = (char)0x0a;
/*: Terminal LF and
*/
asc_buf[17] = (char)0x00;
/*:
NULL
*/
Write(hex_buf);
Write("
");
Write(asc_buf);
/*: Re-initialization. -------------------------------------------------*/
for (wi = (short)0; wi < (short)36; hex_buf[wi++] = (char)0x20);
for (wi = (short)0; wi < (short)16; asc_buf[wi++] = (char)0x20);
hx_p = &hex_buf[0];
put_pos = (short)0;
}
/*: Set 1 byte data. Hex-dump and ASCII image. -------------------------*/
1_char = (char)(log_rec[rec_pos] >> 4);
r_char = (char)(log_rec[rec_pos] & (char)0x0f);
/*: HEX-dump. ----------------------------------------------------------*/
Bin_ascii(&1_char);
Bin_ascii(&r_char);
*hx_p++ = 1_char;
*hx_p++ = r_char;
if ( (put_pos % 4) == 3)
/*: space gap for 4-bytes
*/
{
*hx_p++ = ' ';
}
/*: ASCII image.--------------------------------------------------------*/
if (log_rec[rec_pos] >= 0x7f || log_rec[rec_pos] <= 0xlf)
{
asc_buf[put_pos] = (chart) '.';
}
else
{
asc_buf[put_pos] = log_rec[rec_pos];
}
/*: pointer increment and counter decrement. ---------------------------*/
put_pos++;
rec_pos++;
rec_lng—;
}
/*: Final printf. ------------------------------------------------------*/
hex_buf[36] = (chart)0x00;
asc_buf[16] = (chart)0x0a;
asc_buf[17] = (chart)0x00;
Write(hex_buf);
Write("
");
Write(asc_buf);
/*: Increment the record number for next read. -------------------------*/
1_rec_no++;
rtncd = (short)0;
221
return (rtncd);
}
/*:---------------------------------------------------------------------*/
/*: Name : Read_rec; Read 1 logical record.
*/
/*: Func : Read 1 logical from physical record buffer.
*/
/*:---------------------------------------------------------------------*/
void Read_rec()
{
short wi;
/*: Initial record reading check. --------------------------------------*/
if (phg_pos == -1)
{
Ph_read(phg_rec);
/*: First 256 bytes.
*/
Ph_read(phg_rec+256);
/*: first spare 256 bytes.
*/
phg_pos = (short)0;
/*: Index initialize.
*/
rec_num = (short)0;
/*: physical record number initialize.
*/
}
/*: Top of data. It is the record length. ------------------------------*/
phg_lng = phg_rec[phg_pos + 1];
if (phg_lng < 0)
{
phg_lng += 256;
/*: Adjust to unsigned char.
*/
}
/*: Record extracting loop. --------------------------------------------*/
wi = (short)0;
while (wi <phg_lng)
{
log_rec[wi++] = phg_rec[phg_pos++];
}
/*: physical record buffer arranging. ----------------------------------*/
if (phg_pos > 255)
{
/*: Set spare 256 bytes to normal extracting area. ---------------------*/
for (wi = 0; wi < (short)256; wi++)
{
phg_rec[wi] = phg_rec[wi + 256];
}
/*: Read next spare 256 bytes. -----------------------------------------*/
Ph_read(&phg_rec[256]);
phg_pos -= 256;
rec_num++;
}
}
/*:---------------------------------------------------------------------*/
/*: Name : Bin_ascii; Binary —> ASCII conver.
*/
/*: Func : Convert 4 bit binary data to 1 ASCII character.
*/
/*:---------------------------------------------------------------------*/
void Bin_ascii(p)
char *p;
{
if (*p >= (char)0x0a)
{
222
*p += (char)((char)0x41 - (char)0x0a);
}
else
{
*p += (char)0x30;
}
}
/*: 'A' - 'F'
*/
/*: '0' - '9'
*/
/*:---------------------------------------------------------------------*/
/*: Name : Ph_read; physical 256 bytes read.
*/
/*: Func : Read 256 bytes via ASM I/O simulation subroutine.
*/
/*:---------------------------------------------------------------------*/
void Ph_read(bp)
char *bp;
{
char pb[256], *pp;
short pi, pj, pcl, pcr, f_no ;
/*: Read loop. "F_read" reads 16 bytes data as 1 line INPUT. -----------*/
f_no = (short)0;
if (F_read(0, bp) != 0)
{
/*: Data less than 256 byte block. -------------------------------------*/
if (F_close(0) != 0)
{
Write("ALSO, CLOSE failed.¥n");
}
nxt_f = (short)1;
}
}
223
;************************************************************
;* SAMPLE OF SD38 I/O SIMULATION.
FILE NAME IS PROG.SRC
*
;* THIS PROGRAM IS DESIGNATED FOR SH........................*
;************************************************************
.EXPORT
TRAP
.EXPORT
_Read,_Write
.EXPORT
_F_open,_F_close,_F_read
;-----------------------------------------------------------; 1 LINE READ FROM CONSOLE ................................;-----------------------------------------------------------_Read:
;-----------------------------------------------------------; REGISTER SAVING.
STS.L
PR,@_R15 ; SAVE PR
;-----------------------------------------------------------; PARAMETER BLOCK SETTING.
MOV.L
R4,R0
; INPUT AREA ADDRESS (ARGUMENT_1 =
R4)
MOV.L
PARM_1,R1
; PARAMETER ARER ADRESS
MOV.LP0, @R1
; SET
;-----------------------------------------------------------; GO TRAP.
MOV.L
REQ_CD_1,R0
; REQUEST CODE
MOV.L
TRP_AD_1,R3
; TRAP ADDRESS SET
JSR
@R3
; GO TRAP! (DELAY_BRANCH)
NOP
;--------------------------------------------------------------; RETURN CODE CHECK. IF TOP OF DATA IS 0, NO DATA HAD BEEN READ.
MOV.L
PARM_1,R3
; BUFFER ADDRESS,ADRRESS
MOV.L
@R3,R1
; BUFFER ADDRESS
MOV.B
@R1,R0
; READ CHECK
CMP/EQ
#0,R0
; IF 0X00, NOTHING HAD BEEN READ
BT
R_EXIT
; NORMAL
;-----------------------------------------------------------; RETURN CODE SET. I/O ERROR OR EOF = 1
MOV.L
#1,R0
MOV.L
RTN_AD_1,R3
BRA
R_RTN
; DELAY BRANCH
MOV.L
R0,@R3 ; SET 1
;-----------------------------------------------------------; RETURN CODE SET. NORMAL END = 0.
R_EXIT:
SUB.L
R0,R0
MOV.L
RTN_AD_1,R4
MOV.L
R0,@R4
;-----------------------------------------------------------; RETURNNING SEQUENCE
R_RTN
MOV.L
RTN_AD_1,R2
; RETURN POINTER SET
MONV.L
@R2,R0
; SET RETUTRN CODE
RTS
; DELAY RETURN
LDS.L
@R15+,PR
; LOAD PR
;-----------------------------------------------------------; POINTER AREA
224
;-----------------------------------------------------------.align 4
PARM-_1
.DATA.L PARM
REQ_CD_1
.DATA.L H'01230000
TRP_AD_1
.DATA.L TRAP
RTN_AD_1
.DATA.L RTN_CD
;-----------------------------------------------------------; 1 LINE WRITE TO CONSOLE .................................;-----------------------------------------------------------_Write:
;-----------------------------------------------------------; REGISTER SAVING.
STS.L
PR,@-R15
; SAVE PR
;-----------------------------------------------------------; PARAMETER BLOCK SETTING.
MOV.L
R4,R0
; INPUT AREA ADDRESS (ARGUMENT_1 = R4)
MOV.L
PARM_2,R1
MOV.L
R0,@R1
;-----------------------------------------------------------; GO TRAP.
MOV.L
REQ_CD_2,R0
MOV.L
PARN_2,R1
MOV.L
TRP_AD_2,R3
JSR
@R3
NOP
;-----------------------------------------------------------; RETURNNING SEQUENCE
;-----------------------------------------------------------W_RTN
SUB.L
R0,R0
; SET RETURN CODE
RTS
; DELAY RETURN
LDS.L
@R15+,PR
; LOAD PR
;-----------------------------------------------------------; POINTER AREA
;-----------------------------------------------------------.align 4
PARM_2
.DATA.L PARNM
REQ_CD_2
.DATA.L H'01240000
TRP_AD_2
.DATA.L TRAP
;-----------------------------------------------------------; FILE OPEN
;-----------------------------------------------------------_F_open:
;-----------------------------------------------------------; REGISTER SAVING.
STS.L
PR,@-R15
; SAVE PR
;-----------------------------------------------------------; PARAMETER BLOCK SETTING.
MOV.L
R5,R0
; OPEN MODE (ARGUNMENT_2 = R5)
BSR
CNV_MODE
; CHAR —> MODE-ID
NOP
; (DELAY BRANCH)
MOV.L
FP_ FUNUM_3,R3 ;
SET
MOV.B
R0,@R3
CMP/PZ
R0
BF
FR_ERROR
; -1,MODE-CONVERSION ERROR
MOV.L
R6,R0
; FILR NUMBER (ARGUMENT_3 = R6)
225
MOV.L
FP_FNUM_3,R3
MOV.B
R0,@R3
;
SET
MOV.L
R4,R0
; FILE NAME ADDRESS (ARGUMENT_1 = R4)
MOV.L
FP_FNMA_3,R3
;
SET
MOV.L
R0,@R3
SUB.L
R0,R0
MOV.L
FP_RCOD_3,R3
MOV.B
R0,@R3
; CLEAR RETURN CODE AREA
;---------------------------------------------------------; GO TRAP.
MOV.L
REQ_CD_3,R0
; REQUEST CODE
MOV.L
PARM_FP_3,R1
; PARAM AREA ADDRESS
MOV.L
TRP_AD_3,R3
JSR
@R3
; GO TRAP !
NOP
;---------------------------------------------------------; RETURN CODE SAVING.
SUB.L
R0,R0
; WORK
MOV.L
FP_RCOD_3,R3
; LOAD RETURN CODE
MOV.B
@R3,R0
EXTU.B
R0,R0
MOV.L
RTN_AD_3,R3
BRA
F0_RTN
; GOTO RETURN SEQUENCE
MOV.L
R0,@R3
; SAVE RETURN CODE (DELAY BRANCH)
;---------------------------------------------------------; MODE CONVERSION ERROR. RETURN -2.
FR_ERROR:
MOV.L
#H'FE,R0
MOV.L
RTN_AD_3,R3
MOV.L
R0,@R3
;---------------------------------------------------------; RETURNNING SEQUENCE
F0_RTN:
MOV.L
RTN_AD_3,R8
MOV.L
@r8,R0
; SET RETURN CODE
RTS
; DELAY RETURN
LDS.L
@R15+,PR
; LOAD PR
;---------------------------------------------------------; POINTER AREA
;---------------------------------------------------------.align 4
FP_FUNM_3
.DATA.L FP_FUNM
FP_MODE_3
.DATA.L FP_MODE
FP_FNMA_3
.DATA.L FP_FNMA
FP_RCOD_3
.DATA.L FP_RCOD
REQ_CD_3
.DATA.L H'01250000
PARNM_FP_3
.DATA.L PARM_FP
TRP_AD_3
.DATA.L TRAP
RTN_AD_3
.DATA.L RTN_CD
;---------------------------------------------------------; FILE CLOSE ............................................;---------------------------------------------------------_F_close:
;---------------------------------------------------------; REGISTER SAVING.
STS.L PR,@-R15
; SAVE PR
226
;---------------------------------------------------------; PARAMETER BLOCK SETTING.
MOV.L
R4,R0
; FILE NUMBER (ARGUNMENT_1 = R4)
MOV.L
FP_FNUM_4,R3
;
SET
MOV.B
R0,@R3
;
SUB.L
R0,R0
;
MOV.L
FP_RCOD_4,R3
;
MOV.L
R0,@R3
; CLEAR RETURN CODE AREA
;--------------------------------------------------------; GO TRAP.
MOV.L
REQ_CD_4,R0
; REQUEST CODE
MOV.L
PARM_FR4,R1
; PARAM AREA ADDRESS
MOV.L
TRP_AD_4,R3
; GO TRAP !
JSR
@R3
;--------------------------------------------------------; RETURN CODE SAVING.
SUB.L
0,R0
; WORK
MOV.L
FP_RCOD_4,R3
;
MOV.B
@R3,R0
; LOAD RETURN CODE
EXTU.B
R0,R0
;
MOV.L
RTN_AD_4,R3
; SAVE RETURN CODE
MOV.L
R0,#r3
;
;--------------------------------------------------------; RETURNNING SEQUENCE
C_RTN:
MOV.L
RTN_AD_4,R2
MOV.L
@R2,R0
; SET RETURN CODE
RTS
; DELAY BRANCH
LDS.L
@R15+,PR
; LOAD PR
;--------------------------------------------------------; POINTER AREA
;--------------------------------------------------------.align 4
FP_FNUM_4
.DATA.L FP_FNUM
FP_RCOD_4
.DATA.L FP_RCOD
REQ_CD_4
.DATA.L H'01060000
PARM_FP_4
.DATA.L PARM_FP
TRP_AD_4
.DATA.L TRAP
RTN_AD_4
.DATA.L RTN_CD
;--------------------------------------------------------; 1 LINE READ FROM FILE ................................;--------------------------------------------------------_F_read;
;--------------------------------------------------------; REGISTER SAVING.
STS.L
PR,@-R15 ; SAVE PR
;--------------------------------------------------------; PARAMETER BLOCK SETTING.
MOV.L
R4,R0
; FILE NUMBER (ARGUMENT_1 = R4)
MOV.L
FR_FNUM_5,R3
;
SET
MOV.L
R0,@R3
;
MOV.L
R14,R8
;
ADD
#H'10,R8
; INPUT AREA ADDRESS
MOV.L
@R8,R0
;
SET
MOV.L
FR_BUFP_5,R3
;
227
MOV.L
SUB.L
MOV.L
MOV.B
R0,@R3
R0,R0
FR_RCOD_5,R3
R0,@R3
;
;
;
; CLEAR RETURN CODE AREA
;-----------------------------------------------------------; GO TRAP.
MOV.L
REQ_CD_5,R0
; REQUEST CODE
MOV.L
PARM_FR_5,R1
; PARAM AREA ADDRESS
MOV.L
TRP_AD_5,R4
; GO TRAP!
JSR
@R4
; DELAY BRANCH
NOP
;-----------------------------------------------------------; RETURN CODE SAVING.
SUB.L
R0,R0
; WORK
MOV.L
FR_RCOD5,R4
;
MOV.B
@R4,R0
; LOAD RETURN CODE
EXTU.B
R0R0
;
CMP/EQ
#0,R0
;
BT
FR_SET
; NORMAL
MOV
#H'FF,R0
; EOF
FR_SET:
MOV.L
RTN_AD_5,R3
; SAVE RETURN COD
MOV.L
R0,@R3
;
;-----------------------------------------------------------; RETURNNING SEQUENCE
FR_RTN:
MOV.L
RTN_AD_5,R8
MOV.L
@R8,R0
; SET RETURN CODE
RTS
; DELAY RETURN
LDS.L
@R15+,PR
; LOAD PR
;-----------------------------------------------------------; POINTER AREA
;-----------------------------------------------------------.align 4
FR_FNUM_5
.DATA.L FR_FNUM
FR_BUFP_5
.DATA.L FR_BUFP
FR_RCOD_5
.DATA.L FR_RCOD
REQ_CD_5
.DATA.L H'01290000
PARM_FR5
.DATA.L PARM_FR
TRP_AD_5
.DATA.L TRAP
RTN_AD_5
.DATA.L RTN_CD
;-----------------------------------------------------------; CONVERT MODE STRING TO BE MODE ID NUMBER.
;-----------------------------------------------------------CNV_MODE:
STS.L
PR,@-R15
; PR SAVE
MOV.L
R8,@-R15
; R8 SAVE
MOV.L
SV_R1P,R8
MOV.L
R1,@R8
; R1 SAVE
MOV.L
SV_R2P,R8
MOV.L
R2,@R8
; R2 SAVE
MOV.L
SV_R3P,R8
MOV.L
3,@R8
; R3 SAVE
MOV.L
SV_R4P,R8
MOV.L
R4,@R8
; R4 SAVE
228
MOV.L
SV_R5P,R8
MOV.L
R5,@R8
; R5 SAVE
MOV.L
SV_R6P,R8
MOV.L
R6,@R8
; R6 SAVE
MOV.L
SV_R7P,R8
MOV.L
R7,@R8
; R7 SAVE
;-----------------------------------------------------------; LOAD USER SPECIFICATION AND CONVER TO BE lower CASE STRING.
MOV.L
CNV_STR6,R2
CNV000:
MOV.B
@R0,R1
;---------------+
EXTU.B
R1,R1
; TERMINATOR
+
SUB.L
R4,R4
;
+
CMP/EQ
R1,R4
;
+
BT
CNV100
;
+
MOV
#H'61,R4
;
+
CMP/GT
R1,R4
;
+ -- lower CHANGE LOOP
BF
CNV0101
;
+
ADD
#H'20,R1
;
+
EXTU.B
R1R
; TO BE lower
+
CNV010:
;
+
MOV.B
R1,@R2
; LOCAL SAVE
+
ADD.L
#1,R0
;
+
BRA
CNV000
; DELAY BRANCH +
ADD.L
#1,R2
;---------------+
;-----------------------------------------------------------; COMPARE WITH MODE-STRING.
CNV100:
MOV.L
CNV_TBL6,ER1
; TOP OF COMPARE STRING ADDRESS ARRAY
SUB.L
R2,R2
; LOCAL INDEX
CNV110:
MOV.L
@R1,R3
; DATA ADDRESS
SUB.L
R6,R6
; WORK 0 CLEAR
CMP/EQ
R6,R3
BT
CNV400
; NULL, NO DATA MORE. IT IS AN
ERROR
MOV.L
CNV_STR6,R4
; TOP OF USER STRING
CNV120:
MOV.B
@R4,R5
; LOAD 1 CHAR
MOV.L
#0,R7
;
CMP/EQ
R5,R7
;
BT
CNV300
; NULL-CHAR, NOW COMPLETED
MOV.B
@R3,R6
; SET TO UPPER
CMP/EQ
R5,R6
; SAME?
BF
CNV190
; NO, TRY NEXT
ADD
#1,R3
BRA
CNV120
ADD
#1,R4
;-----------------------------------------------------------; TRY NEXT STRING.
CNV190:
ADD
#4,R1
; NEXT STRING TABLE ENTRY
ADD
#1,R2
; INCREMENT THE INDEX
BRA
CNV110
; TRY NEXT
EXTU.B
R2,R2
;
;------------------------------------------------------------
229
; COMPARE SUCCESSFUL. ER2 HAS THE MODE-ID INDEX.
CNV300:
SUB.L
R0,R0
;
MOV.L
CNV_RC6,R4
; RESET THE RC.
MOV.L
R0,@R4
;
MOV.L
MODE_TBL6,R3
; MODE-ID NUMBER TABLE
SHLL
R2
; INDEX * 2
EXTU.B
R2,R2
;
ADD.L
R2,R3
; TABLE ENTRY
MOV.W
@R3,R0
; R0 NOW THE MODE-ID
ADD.L
#2,R4
; SAVE TEMPORARY
BRA
CNV500
; GO TO RETURN SEQUENCE
MOV.W
R0,@R4
;-----------------------------------------------------------; ERROR RETURN. COMPARE FAILED.
CNV400:
MOV.L
#H'FF,R0
MOV.L
CNV_RC6,R4
MOV.L
R0,@R4
;-----------------------------------------------------------; RETURNNING RESEQUENCE
CNV500:
MOV.L
SV_R1P,R8
; RELOAD REGISTER
MOV.L
@R8,R1
;
MOV.L
SV_R2P,R8
;
MOV.L
@R8,R2
;
MOV.L
SV_R3P,R8
;
MOV.L
@R8,R3
;
MOV.L
SV_R4P,R8
;
MOV.L
@R8,R4
;
MOV.L
SV_R5P,R8
;
MOV.L
@R8,R5
;
MOV.L
SV_R6P,R8
;
MOV.L
@R8,R6
;
MOV.L
SV_R7P,R8
;
MOV.L
@R8,R7
;
MOV.L
CNV_RC6,R8
; LOAD RETURN CODE
MOV.L
@R8,R0
;
MOV.L
@R15+,R8
; LOAD R8 REGISTER
RTS
; DELAY BRANCH
LDS.L
@R15+,PR
; PR LOAD
;-----------------------------------------------------------; POITER AREA
;-----------------------------------------------------------.align 4
SV_R1P
.DATA.L SV_R1
SV_R2P
.DATA.L SV_R2
SV_R3P
.DATA.L SV_R3
SV_R4P
.DATA.L SV_R4
SV_R5P
.DATA.L SV_R5
SV_R6P
.DATA.L SV_R6
SV_R7P
.DATA.L SV_R7
CNV_STR6
.DATA.L CNV_STR
CNV_TBL6
.DATA.L CNV_TBL
CNV_RC6
.DATA.L CNV_RC
MODE_TBL6
.DATA.L MODE_TBL
230
;-----------------------------------------------------------; TRAP ADDRESS. SAY "TRAP_ADDR %PROG!TRAP"
;-----------------------------------------------------------TRAP
NOP
;-----------------------------------------------------------; DATA AREA. PARAMETER BLOCK AND I/O BUFFER.
;-----------------------------------------------------------.section
dt,data
;-----------------------------------------------------------; CONSOLE I/O SIMULATION PARAMETER BLOCK.
;-----------------------------------------------------------PARM
.RES.L
1
; I/O BUFFER ADDRESS
;-----------------------------------------------------------; FILE I/O SIMULATION PARAMETER BLOCK.
;-----------------------------------------------------------PARM_FP:
FP_RCOD
.RES.B
1
; RETURN CODE AREA
FP_FNUM
.RES.B
1
; FILE ID NUMBER
FP_MODE
.RES.B
1
; OPEN MODE
FP_RESV
.RES.B
1
; RESERVED
FP_FNMA
.RES.L
1
; FILE NAME AREA ADDRESS
;-----------------------------------------------------------; FILE I/O SIMULATION /FILE-READ PARAMETER BLOCK.
;-----------------------------------------------------------PARM_FR:
FR_RCOD
.RES.B
1
; RETURN CODE AREA
FR_FNUM
.RES.B
1
; FILE ID NUMBER
.align
4
FR_BUFP
.RES.L
1
; FILE NAME AREA ADDRESS
FR_SIZE
.DATA.W
H'100
; RESERVED
.align
4
;-----------------------------------------------------------RTN_CD
.RES.L
1
; RETURN CODE SAVE AREA
;-----------------------------------------------------------; OPEN MODE CONVERSION TABLE.
;-----------------------------------------------------------CNV_TBL:
.DATA.L
STR_0
.DATA.L
STR_1
.DATA.L
STR_2
.DATA.L
STR_3
.DATA.L
STR_4
.DATA.L
STR_5
.DATA.L
STR_10
.DATA.L
STR_11
.DATA.L
STR_12
.DATA.L
STR_13
.DATA.L
STR_14
.DATA.L
STR_15
STR_0
.SDATAZ
"r"
STR_1
.SDATAZ
"w"
STR_2
.SDATAZ
"a"
STR_3
.SDATAZ
"r+"
STR_4
.SDATAZ
"w+"
STR_5
.SDATAZ
"a+"
STR_10
.SDATAZ
"rb"
231
STR_11
STR_12
STR_13
STR_14
STR_15
MODE_TBL:
.SDATAZ
.SDATAZ
.SDATAZ
.SDATAZ
.SDATAZ
"wb"
"ab"
"r+b"
"w+b"
"a+b"
.DATA.W
H'0000
.DATA.W
H'0001
.DATA.W
H'0002
.DATA.W
H'0003
.DATA.W
H'0004
.DATA.W
H'0005
.DATA.W
H'0010
.DATA.W
H'0011
.DATA.W
H'0012
.DATA.W
H'0013
.DATA.W
H'0014
.DATA.W
H'0015
;-----------------------------------------------------------; MODE CONVERTER REGISTER SAVE AREA
;-----------------------------------------------------------SV_R1
.RES.L
1
SV_R2
.RES.L
1
SV_R3
.RES.L
1
SV_R4
.RES.L
1
SV_R5
.RES.L
1
SV_R6
.RES.L
1
SV_R7
.RES.L
1
CNV_STR
.SRES
16
CNV_RC
.RES.L
1
;-----------------------------------------------------------.END
232
Appendix E Limitations on Debugging Object Programs
The following type of programs cannot be loaded as debugging object programs. An error
message will be displayed on attempts to load such programs.
Condition
1.
Section areas overlap
Coding example 1:
.SECTION SC1,CODE,LOCATE=0
.RES.W 1000
.SECTION SC2,CODE
.DATA
100
Since SC2 is a relocatable section, it will be loaded starting at address H'400. However, this
overlaps SC1, causing an error.
Coding example 2:
.SECTION SC3,CODE
.ORG H'1000
MOV.L R0,R1
.ORG H'2000
MOV.L R0,R2
.SECTION SC4,CODE,LOCATE=H'1500
.DATA
100
.END
The section SC3 extends from address H'400 to address H'2401 due to the use of the .ORG
control statement. As a result, section SC4 overlaps that section and generates an error.
Note that is possible to avoid this overlap by specifying an appropriate start address for the
relocatable section to the H-series linkage editor.
2.
A section with the same name but with a differing attribute (CODE, DATA, STACK, or
COMMON) exists in another unit.
Coding example:
;UNIT1
.SECTION SC,CODE
NOP
.END
;UNIT2
.SECTION SC,DATA
.DATA.W 100
.END
233
Since the attributes of SC in unit 1 and SC in unit 2 differ, an error occurs.
3.
An object module or load module has a section size of 0.
Coding example:
.SECTION SC,CODE
.END
Since SC has a section size of 0, an error occurs.
4.
A section is allocated across the boundary between memory areas with differing attributes, or
an absolute address section is allocated to an invalid area.
Coding example: Assuming an SH 7000 CPU information file.
.SECTION SC,CODE,LOCATE=H'EF00000.
SDATAB H'20000,"0123456789ABCDEF"
.END
Although SC is allocated from addresses H'EF00000 to H'F0FFFFF, an error occurs since the
memory type changes at address H'F000000.The following measures can be used to avoid the
above errors.
Process
1.
Review the starting addresses of absolute sections and the section sizes, and modify the
program so that overlaps do not occur.
2.
Code programs so that sections with the same name have the same attribute.
3.
Specify modules that have actual contents.
4.
Modify the start addresses of absolute section so that section allocation across memory
boundaries does not occur. Alternatively, modify the memory map specified in the CPU
information file so that sections to not cross memory area boundaries.
234
Appendix F Messages
The simulator/debugger outputs the following two types of message.
1.
Information messages
These messages inform the user of the simulator/debugger execution process.
2.
Error messages
These messages inform the user that an error has occurred.
F.1 Information Messages
F.1.1 Information Messages at Instruction Execution Interruption
Table F-1 lists the messages that are displayed when execution is interrupted during instruction
execution initiated by a GO, STEP, STEP_INTO, VECTOR, or CALL command.
Table F-1 Information Messages at Instruction Execution Interruption
Error
No.
Message
Description
1001
BREAK ACCESS
(<first location> - <last location>)
Execution was interrupted due to the occurrence
of a break access condition.
1002
BREAK DATA
(<break location>∆∆<data>)
Execution was interrupted due to the occurrence
of a break data condition.
1003
BREAK POINT
Execution was interrupted due to the occurrence
of a breakpoint condition.
1004
BREAK REGISTER
(<register>∆<data>)
Execution was interrupted due to the occurrence
of a break register condition.
1005
BREAK SEQUENCE
Execution was interrupted due to the occurrence
of a break sequence condition.
1006
MANUAL BREAK
Execution was interrupted due to <CTRL> +
<C>.
1007
SLEEP
Execution was interrupted due to the execution
of a SLEEP instruction.
1008
STEP NORMAL END
Execution due to a STEP or STEP_INTO
command completed normally.
1009
TRACE BUFFER FULL
Execution was interrupted at the point the trace
buffer became full, since the B option was
specified to the TRACE_CONDITION command.
235
F.1.2 Information Messages during Command Analysis
Table F-2 lists the messages displayed by the simulator/debugger during command analysis.
Table F-2 Information Messages during Command Analysis
Error
No.
Message
Description
2001
FIXED UNRESOLVED EXTERNAL
REFERENCE SYMBOL
An address was allocated for an unresolved
external reference symbol.
2002
NO BREAK ACCESS
There is no break access condition set.
2003
NO BREAK DATA
There is no break data condition set.
2004
NO BREAK POINT
There is no breakpoint condition set.
2005
NO BREAK REGISTER
There is no break register condition set.
2006
NO BREAK SEQUENCE
There is no break sequence condition set.
2007
NO FUNCTION CALL
No function was called.
2008
NO MACRO DEFINITION
No macro was defined.
2009
NO STUB POINT
No stub point was set.
2010
NO TRAP ADDRESS
The system call start location trap address
was not set.
236
F.2 Error Messages
F.2.1 Error Messages during Startup or Load Command Execution
Table F-3 lists the error messages displayed by the simulator/debugger during startup and during
execution of the LOAD command.
Table F-3 Error Messages during Startup or Load Command Execution
Error
No.
Message
Error Description and Recovery Procedure
3001
ADDRESS SPACE
DUPLICATED : sect
The section indicated by “sect” overlaps with
another section. Correct the program so that
sections do not overlap.
3002
CAN NOT GET MEMORY SPACE
Memory space required by the simulator/
debugger could not be allocated. Increase
memory or modify the debugging object
program.
3003
CAN NOT GET TABLE AREA
The table memory area required by the
simulator/debugger could not be allocated.
Increase the user memory area on the host
computer.
3004
CAN NOT GET TRACE BUFFER
The required trace buffer memory area could not
be allocated.
Increase the user memory area on the host
computer.
However, commands other than the trace system
commands will operate normally.
3005
CAN NOT OPEN
A file could not be opened.
Specify the correct file name.
3006
CAN NOT OPEN CPU
INFORMATION FILE
The CPU information file could not be opened.
Specify the correct directory and file name.
3007
CAN NOT OPEN OBJECT FILE
The debugging object program file could not be
opened.
Specify the correct file name.
3008
CAN NOT READ
A file could not be read.
Check the contents of the file.
3009
COMMAND LINE SYNTAX
ERROR
There was an error in the command line.
237
Table F-3 Error Messages during Startup or Load Command Execution (cont)
Error
No.
Message
Error Description and Recovery Procedure
3010
DEVICE TYPE IS NOT
CONSISTENT
The debugging object program file identifying
information (the ID that indicates whether the
program is for the SH series) does not
agree with the file identifying information from
the CPU information file (set by the CIA
program).
Check that the object program is actually
an SH-series program.
3011
ILLEGAL BLOCK TYPE
The debugging object program contains one or
more errors.
Correct any errors that occurred in creating the
debugging object program.
3012
INTERNAL ERROR (nnn)
An internal error occurred.
Contact your Hitachi, Ltd. sales representative.
3013
INVALID CPU INFORMATION
There was an error in the CPU information file.
Check and correct the CPU information file.
3014
INVALID OBJECT FORMAT
The input file exceeds the range of debugging
object programs.
Specify the correct file name.
3015
INVALID RELOCATION
EXPRESSION
An invalid relocation expression occurred in
the debugging object program.
Correct any errors that occurred in creating
the debugging object program.
3016
LOADING FAILED : sect
The section specified by “sect” could not be
loaded.
Either modify the CPU information file or modify
the start address of the section.
3017
RELOCATION SIZE
OVERFLOW : sect
The result of relocating the section indicated
by “sect” exceeded the relocation size.
Review both the displacement size of the
section of the corresponding name in the
source program as well as the valid object size.
3018
SECTION NUMBER = 0
There were no executable sections in the
debugging object program.
Add code and data sections to the debugging
object program.
3019
UNDEFINED SYMBOL : symbol
The symbol indicated by “symbol” was not
defined in the debugging object program.
Correct the program to define the corresponding
symbol.
238
F.2.2 Error Messages during Command Execution
Table F-4 lists the error messages displayed during simulator/debugger command execution.
Table F-4 Error Messages during Command Execution
Error
No.
Message
Error Description and Recovery Procedure
4001
ADDRESS EXCEEDS MEMORY
SPACE BOUNDARY
It is not possible to allocate areas that exceed
the boundaries of the internal ROM area, the
external bus area, the internal RAM area,
and internal I/O area.
Divide the area into multiple sections and
allocate each section within the boundaries of
a region.
4002
BREAK ACCESS ADDRESS
CONFLICTS
There is already a condition set for the location
specified with the BREAK_ACCESS command.
Check the current settings and specify the
address correctly.
4003
BREAK DATA ADDRESS
CONFLICTS
There is already a condition set for the location
specified with the BREAK_DATA command.
Check the current settings and specify the
address correctly.
4004
BREAK POINT CONFLICTS
There is already a condition set for the location
specified with the BREAK command.
Check the current settings and specify the
address correctly.
4005
BREAK REGISTER CONFLICTS
There is already a condition set for the register
specified with the BREAK_REGISTER command.
Check the current settings and specify the
register correctly.
4006
BREAK SEQUENCE CONFLICTS
There is already a condition set for the sequence
specified with the BREAK_SEQUENCE
command.
Check the current settings and specify the
address correctly.
4007
CAN NOT ACCESS EXTERNAL
MEMORY
An address not allocated for the memory map
was specified.
Specify a correct address.
4008
CAN NOT CLOSE
The specified file cannot be closed.
If there is inadequate user disk space, increase
the available disk space.
4009
CAN NOT OPEN
The specified file could not be opened.
Specify the correct file name.
239
Table F-4 Error Messages during Command Execution (cont)
Error
No.
Message
Error Description and Recovery Procedure
4010
CAN NOT READ
The specified file cannot be read.
Specify the correct file name.
4011
CAN NOT WRITE
The specified file cannot be written.
The disk may be full, or there may be a disk
hardware error.
Re-execute the write after checking the disk
status.
4012
COMMAND NOT FOUND
A non-existent command name was specified.
Specify the command correctly.
4013
COVERAGE ALREADY STARTED
An attempt was made to start coverage
measurement when coverage measurement had
already been started.
Or, an attempt was made to change the coverage
area setting.
To measure a differing range of locations,
terminate the current measurement, reset the
range, and restart the measurement.
4014
COVERAGE NOT STARTED
Coverage has not been started.
Check the state of the coverage settings.
4015
COVERAGE RANGES EXCEED 16
Up to 16 coverage areas can be specified.
To add another area, first remove any
unnecessary coverage areas.
4016
COVERAGE RANGE NOT
DEFINED
An attempt was made to start coverage
measurement with no coverage areas defined.
Specify the coverage areas before starting
coverage measurement.
4017
DIVIDE BY ZERO
A divisor of 0 appeared in an integer expression.
Modify the divisor to be a value other than 0.
4018
DUPLICATE ADDRESS
The specified address was already specified.
Check the value of the address used.
4019
EXPRESSION TOO COMPLEX
An expression was overly complex.
Expressions are overly complex when there are
8 or more parentheses.
4020
FLOATING POINT DATA
OVERFLOW
A floating point overflow occurred in the specified
precision.
Review the precision or the data values.
4021
FLOATING POINT DATA
UNDERFLOW
A floating point underflow occurred in the
specified precision.
Review the precision or the data values.
240
Table F-4 Error Messages during Command Execution (cont)
Error
No.
Message
Error Description and Recovery Procedure
4022
FUNCTION NOT FOUND
The function specified in a CALL command does
not exist. Check the name of the function.
4023
ILLEGAL EXPRESSION
There was an error in an integer expression.
Re-input the command with a correct expression.
4024
ILLEGAL FLOATING POINT DATA
There was an error in the format of a floating
point data item.
Review the format of the floating point data item.
4025
ILLEGAL MACRO NAME
A name which cannot be specified as a macro
name was specified.
Check the macro name.
4026
ILLEGAL SYMBOL FORMAT
There was a syntax error in a symbol.
Re-input the command with the correct syntax.
4027
INVALID ADDRESS
The value used was invalid as an address value.
Specify a valid value.
4028
INVALID DATA
The value used was invalid as an address value.
Specify a valid value.
4029
INVALID MNEMONIC
An instruction mnemonic specified to the
ASSEMBLE command was incorrect.
Input a correct mnemonic.
4030
INVALID OPERAND
The specified instruction operand was incorrect.
Input a correct operand.
4031
LINE NUMBER NOT FOUND
The specified line number could not be found.
Check the line numbers in the source program.
4032
MACRO BUFFER OVERFLOW
The macro registration buffer overflowed.
Delete any unnecessary macros.
4033
MACRO VARIABLE NOT FOUND
An attempt was made to reference a macro
internal variable whose value had not been set.
Modify the macro to reference the macro internal
variable only after its value has been set.
4034
MEMORY AREA ALREADY EXISTS The specified memory area was already
allocated. (It is also possible that the address
specification was incorrect.)
Check the memory area allocations with the MAP
command and then specify a correct value.
241
Table F-4 Error Messages during Command Execution (cont)
Error
No.
Message
Error Description and Recovery Procedure
4035
MEMORY AREA NOT EXIST
The specified memory area has not been
allocated.
Allocate memory areas with the MAP command
as necessary, and then specify memory areas
that have already been allocated.
4036
NESTING OF COMMAND_CHAIN
EXCEEDS 8
The command chain nesting exceeded 8 levels.
Revise usage of the COMMAND_CHAIN
command so that the nesting level does not
exceed 8 levels.
4037
NOT A COVERAGE FILE
The specified file was not a coverage file.
Check the file.
4038
NO SCOPE SET
A function name could not be found due to an
unusual value in the PC.
After checking the value of the PC, modify the
program to operate normally.
4039
NOT A SAVE_STATUS FILE
The specified file was not a SAVE_STATUS file.
Alternatively, insufficient information.
Check the file.
4040
SAVE_STATUS OPTION CONFLICT The file cannot be loaded since the options used
when saving the file were different.
Check the file.
4041
STUB BUFFER OVERFLOW
The STUB command registration buffer
overflowed.
Delete any unnecessary stubs.
4042
STUB POINTS EXCEED 16
Up to 16 stub points can be specified.
Delete any unnecessary stubs and retry the
command.
4043
SYMBOL NOT FOUND
The specified symbol was not registered.
Specify the correct symbol name.
4044
SYNTAX ERROR
The command parameters were incorrect.
Specify the parameters correctly.
4045
SYSTEM ERROR (<error number>)
An OS error occurred during execution of a “!”
command. The specified OS command was not
executed. Review the system environment.
4046
TOO MANY ARGUMENTS
Too many arguments were specified in a function
call.
Check the function’s specifications.
242
Table F-4 Error Messages during Command Execution (cont)
Error
No.
Message
Error Description and Recovery Procedure
4047
TOO MANY BREAK ACCESS
The number of break access conditions
exceeded the number supported.
Up to 2 break access conditions can be set.
4048
TOO MANY BREAK DATA
The number of break data conditions exceeded
the number supported.
Up to 8 break data conditions can be set.
4049
TOO MANY BREAK POINTS
The number of breakpoints exceeded the number
supported.
Up to 8 breakpoints can be set.
4050
TOO MANY BREAK REGISTERS
The number of break register conditions
exceeded the number supported.
Up to 8 break register conditions can be set.
4051
TOO MANY MACRO DEFINITION
The number of macro definitions exceeded the
number supported.
Up to 64 macros can be defined.
Delete any unnecessary macros and re-input the
macro definition that generated the error.
4052
TOO MANY MACRO VARIABLE
The number of macro variables exceeded the
number supported.
Up to 255 macros variables can be used.
4053
TOO MANY SECTIONS
The number of memory areas allocated with the
MAP command exceeded the number supported.
Up to 10 areas can be allocated.
4054
TOO MANY UNDEFINED SYMBOL
There are too many undefined symbols.
Addresses can not be allocated for any other
undefined symbols.
4055
TRACE COMMAND NOT
AVAILABLE
The trace command cannot be used since a
trace buffer was not allocated.
Expand the user environment so that a trace
buffer can be allocated.
4056
TRAP ADDRESS CONFLICTS
Only 1 system call start address can be specified.
Check the specified address by using the
TRAP_ADDRESS command.
243
Table F-4 Error Messages during Command Execution (cont)
Error
No.
Message
Error Description and Recovery Procedure
4057
MEMORY SPACE
INSUFFICIENCY
The size of the memory area is too small
to display all the functions called.
Check the size of memory available for the
simulator/debugger size.
4058
CAN NOT REFER TO
THE SYMBOL
The specified symbols could not be
referred due to C compiler optimization.
Specify the address or data for the symbols.
4059
ILLEGAL ADDRESS RANGE
SPECIFIED
The specified memory area size is too large.
Divide the memory areas and specify each.
244
F.2.3 Error Messages during Simulation
Table F-5 lists the error messages displayed during simulator/debugger simulation of a debugging
object program.
Table F-5 Error Messages during Simulation
Error
No.
Message
Error Description and Recovery Procedure
5001
GENERAL INVALID
INSTRUCTION
One of the following conditions caused a general
invalid instruction error.
1. The program attempted to execute a code
that is not an instruction.
2. An error occurred during exception
processing of general invalid instructions.
Correct the debugging object program so that the
error does not occur.
5002
INVALID SLOT
INSTRUCTION
One of the following conditions caused an invalid
slot instruction error.
1. The branch instruction to change PC
immediately after the branch instruction was
executed.
2. An error occurred during exception
processing of the invalid slot instruction.
Correct the debugging object program so
that the error does not occur.
5003
ADDRESS ERROR
One of the following conditions caused an
address error.
1. The value of the PC became an odd number.
2. The program attempted to read an instruction
from internal I/O space.
3. An attempt was made to access a long word
data at an address other than 4n.
4. An attempt was made to access a word data
at an address other than 2n.
5. VBR and SP are not in multiples of four.
An error occurred during exception
processing of the address error.
6. Correct the debugging object program so that
the error does not occur.
245
Table F-5 Error Messages during Simulation (cont)
Error
No.
Message
Error Description and Recovery Procedure
5004
EXCEPTION ERROR
An error occurred during exception processing.
Correct the debugging object program so that the
error does not occur.
5005
ILLEGAL OPERATION
Division by zero was caused by a DIV1
instruction.
Correct the debugging object program so that the
error does not occur.
5006
MEMORY ACCESS ERROR
One of the following conditions caused a memory
access error.
1. The program attempted to access a memory
area that was not allocated.
2. The program attempted to write to a memory
area that has the write-protect attribute.
3. The program attempted to read from a
memory area that has the read-protect
attribute.
4. An attempt was made to access an area with
no memory.
Either modify the memory allocation and
attributes, or correct the debugging object
program so that the corresponding memory
access error does not occur.
5007
INVALID SP INSTRUCTION
The program executed the instruction to make
R15 (SP) to point to an address other than 4-byte
boundary.
Correct the debugging object program so that the
error does not occur
5008
SYSTEM CALL ERROR
A system call error occurred.
Correct the error(s) in the contents of the
parameter block and/or registers R0 and R1.
246
F.3 CIA Error Messages
F.3.1 I/O Related Error Messages
Table F-6 shows the CIA error messages related to I/O.
Table F-6 I/O Related Error Messages
Error
No.
Message
Error Description and Recovery Procedure
6001
CAN NOT GET MEMORY SPACE
The memory for CIA use could not be allocated.
Check the OS environment and assure that there
is adequate memory allocated for CIA use.
6002
CAN NOT OPEN INPUT CPU
INFORMATION FILE
The specified existent CPU information file could
not be opened. (See note.)
6003
CAN NOT OPEN OUTPUT CPU
INFORMATION FILE
The specified output CPU information file could
not be opened. (See note.)
6004
CAN NOT READ
A file could not be read. (See note.)
6005
CAN NOT WRITE
Write to a file failed. (See note.)
6006
CAN NOT CLOSE
The output CPU information file could not be
closed. (See note.)
6007
INVALID CPU INFORMATION
Errors were encountered in the CPU information
file.
Check the contents of the file and correct the
errors.
6008
SYNTAX ERROR
There was an error in the file specification
syntax.
Enter the file name correctly.
Note: In these cases, if the file name was correct, the disk may be full, or there may be a disk
hardware error. After checking the disk status, re-execute the CIA program.
247
F.3.2 Keyboard Input Related Error Messages
Table F-7 lists the error messages related to keyboard input.
Table F-7 Keyboard Input Related Error Messages
Error
No.
Message
Error Description and Recovery Procedure
7001
COMMENT LINE TOO LONG
The specified comment line exceeded 127
characters.
The comment line must be 127 chracters or less.
7002
ADDRESS RE-USE
Address ranges overlap.
Check the addresses and re-enter correctly.
7003
ADDRESS SIZE OVERFLOW
An address value exceeding the bit size was
specified.
Enter a correct address value.
7004
INVALID VALUE
A numeric value outside the allowed range was
specified.
Correct the input to specify a value within the
allowed range.
7005
INVALID CHARACTER
A character that cannot be used was input.
Input a character that corresponds to one of the
selection choices.
7006
INVALID END ADDRESS
An end address smaller than the start address
was specified.
Re-enter the end address with the correct value.
248
Appendix G ASCII Code Table
Table G-1 ASCII Code Table
Upper 4 Bits
Lower 4 Bits
0
1
2
3
4
5
6
7
0
NUL
DLE
SP
0
@
P
`
p
1
SOH
DC1
!
1
A
Q
a
q
2
STX
DC2
“
2
B
R
b
r
3
ETX
DC3
#
3
C
S
c
s
4
EOT
DC4
$
4
D
T
d
t
5
ENQ
NAK
%
5
E
U
e
u
6
ACK
SYN
&
6
F
V
f
v
7
BEL
ETB
'
7
G
W
g
w
8
BS
CAN
(
8
H
X
h
x
9
HT
EM
)
9
I
Y
i
y
A
LF
SUB
*
:
J
Z
j
z
B
VT
ESC
+
;
K
[
k
{
C
FF
FS
,
<
L
\
l
|
D
CR
GS
–
=
M
]
m
}
E
SO
RS
.
>
N
^
n
~
F
SI
US
/
?
O
_
o
DEL
249
Appendix H Installation
The following instructions describe how to install the SH-series simulator/debugger in the host
system.
H.1 Contents of the Cartridge Tape
The simulator/debugger is provided with a cartridge tape, which contains the following files.
•
•
file type: archive file
file name
— Simulator/debugger: sdsh
— CPU information analysis program: cia
H.2 How to Install the Simulator/Debbuger in the Host System
To install the simulator/debugger in the host system, follow the instructions below. Underlined
sections should be input by the user.
•
Making a directory
To make a directory for storing simulator/debugger files, enter the command below. The path
name is /usr/tool in this example.
% mkdir∆/usr/tool (RET)
•
(RET): Press the return key
∆: Press the space bar or tab key
Changing the directory
To change the current directory to the directory /usr/tool made above, enter the command
below.
% cd∆/usr/tool (RET)
•
Copying files
To copy the simulator/debugger files from the cartridge tape to the directory made in the
above step, enter the command below. In this example, /dev/rst0 is the name of the cartridge
tape drive.
% tar∆-xvf∆/dev/rst0∆sdsh∆cia (RET)
250
•
Setting the start-up environment
To set the start-up environment for the simulator/debugger, follow the instructions below.
— Add the following command to the file ".login" in the home directory.
% set∆path=(/usr/tool) (RET)
If a path has already been specified, add the path name "/usr/tool"
separated by a space to the path list in parentheses.
— When the Born-shell or Corn-shell is used:
Add the following command to the file ".profile" in the home directory.
% PATH =/usr/tool (RET)
% export∆PATH (RET)
If a path has already been specified, add a colon ( : ) and the path
name "/usr/tool" after the path list.
H.3 Equipment
The following equipment is required when using the simulator/debugger.
•
•
•
•
•
Host computer: SPARC Station
OS: SunOS (release 4.0.3 or later version)
User memory space: 4 Mbytes or over
Hard disk drive
Cartridge tape drive
H.4 Special Keys
Two special keys are used by the simulator/debugger: (CTRL) + (C) and (CTRL) + (\). (CTRL) +
(C) or (CTRL) + (\) indicates pressing C or \ while the control key is being pressed. To use the
simulator/debugger, first make the following settings with the SunOS stty command.
stty
stty
•
intr
quit
(CTRL) + (C)
(CTRL) + (\)
(CTRL) + (C)
When the special key (CTRL) + (C) is entered, command execution stops immediately and the
simulator/debugger returns to the command wait state.
251
(Ex. 1)
During execution of the user program by a CALL, STEP,
STEP_INTO, or VECTOR command, (CTRL) + (C) stops the program
execution are returns the simulator/debugger to the command wait
state.
(Ex. 2)
While the contents of memory or the trace buffer are being
displayed by a DUMP or TRACE command, (CTRL) + (C) stops the
command execution and returns the simulator/debugger to the
command wait state.
(Ex. 3)
During execution of a command file by a COMMAND_CHAIN
command, (CTRL) + (C) stops the command execution and
returns the simulator/debugger to the command wait state.
Note: During interactive command input, (CTRL) + (C)
does not return the simulator/debugger to the command wait state.
To exit the interactive command input state, enter ".".
•
(CTRL) + (\)
The special key (CTRL) + (\) terminates the simulator/debugger and
returns it to the SunOS command wait state.
Note: When (CTRL) + (\) is entered, SunOS creates the core file "core"
on the current directory.
252