1
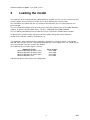
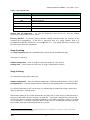
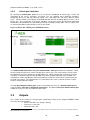
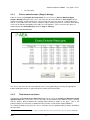
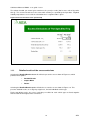
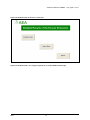
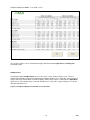
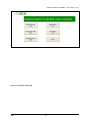
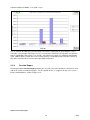
Cold Start Advanced
-user guide
Work commisioned by UK Department for
Environment, Food & Rural Affairs (Defra)
ED 05450-304
Issue Number 1
December 2008
Title
Cold Start Advanced - user guide
Customer
Defra
Customer reference
NAEI Extension 28 Deliverable
Confidentiality,
copyright and
reproduction
Copyright AEA Technology plc
All rights reserved.
Enquiries about copyright and reproduction should be addressed to
the Commercial Manager, AEA Technology plc.
File reference
Reference number
ED05450-304- CSA_UM_Issue 1
AEA Energy & Environment
The Gemini Building
Fermi Avenue
Harwell International Business Centre
Didcot
OX11 0QR
t: 0870 190 6439
[email protected]
AEA Energy & Environment is a business name of
AEA Technology plc
AEA Energy & Environment is certificated to ISO9001
and ISO14001
Author
Name
Approved by
Name
Allan Smith, Yongfu Xu, John Norris, Agnieszka Griffin
and Clare Allen
Signature
Date
rd
3 December 2008
Cold Start Advanced Model - user guide Issue 1
AEA Energy & Environment
iii
Cold Start Advanced Model - user guide Issue 1
Table of contents
1
Introduction ...................................................................................................... 3
2
Loading the model ........................................................................................... 4
3
Using the model ............................................................................................... 4
3.1
3.2
3.3
4
3.1.1
Help ........................................................................................................................ 6
3.1.2
Quit, Return, Print ................................................................................................... 7
Input data ............................................................................................................................ 7
3.2.1
Input fields .............................................................................................................. 8
3.2.2
Vehicle parc definition .......................................................................................... 10
Outputs.............................................................................................................................. 10
3.3.1
Excess emission rates (Stage 3 driving) .............................................................. 11
3.3.2
Total excess emissions ........................................................................................ 11
3.3.3
Detailed results of the excess emissions ............................................................. 12
3.3.4
Session Report ..................................................................................................... 16
Scenarios ........................................................................................................ 18
4.1
4.2
AEA
Main menu .......................................................................................................................... 5
Excess emissions as a function of distance from a car park ............................................ 18
4.1.1
Assessment for fully warmed up vehicles parking................................................ 18
4.1.2
Assessment for non-fully warmed up vehicles parking ........................................ 18
4.1.3
Other parking schemes ........................................................................................ 19
Excess emissions as a function of distance or time ......................................................... 19
1
Cold Start Advanced Model - user guide Issue 1
2
AEA
Cold Start Advanced Model - user guide Issue 1
1
Introduction
Modelling the emissions from vehicles is becoming an increasingly important activity in planning the
environmental impact of future urban developments. This is largely done using emissions factors for
vehicles which give their level of emission when being driven at their normal operating temperatures.
However, in urban environments vehicles are usually started under engine conditions that are different
to the hot operating conditions. The emissions from these vehicles can be very different to those
calculated using the basic emission factors. This model seeks to address this issue and calculates the
extra emissions that are produced when vehicles start from more realistic starting conditions. The
results from this model may be used in conjunction with results from a traffic-based emissions model
that calculates mass emissions on a road network from vehicles with their engines at normal operating
temperature. These may come from models combining traffic based emission factors in g/km,
(available from the National Atmospheric Emissions Inventory,
http://www.aeat.co.uk/netcen/airqual/index.html, and the national emission factor database) with
vehicle kilometres travelled on the road network. Alternatively they may come from other air quality
and emission estimation procedures, for example the Highways Agency DMRB procedure “Design
Manual Roads and Bridges, Volume 11, Section 3, Environmental Assessment Techniques: Part 1 Air
Quality, May 2007”, where the user inputs traffic flows on specified road links to calculate emissions
and air concentrations near the road side. The user can then add the impact of excess emissions from
starting vehicles in an area to the hot exhaust emissions calculated. This might be useful for a scheme
appraisal, for example a car-park or out-of-town shopping complex where many cars will starting their
journeys with cold engines.
The excess emissions calculated by the model are based on two series of measurements which
encompass vehicles of different age ranges (year of manufacture of pre- and post-2000), diesel and
petrol fuelled, and a range of engine sizes. The results from the model are weighted according to the
proportions of the sampled car types in the national fleet in 2006, not in terms of the model types, but
in terms of fuel type (petrol and diesel) and engine capacity. Options exist to alter this mix, either to
reflect the vehicle parc composition between 2002 and 2006, or to use DfT fleet projection data for
years 2007 to 2020. Alternatively, a user defined mix can be input.
Note that no account is taken of excess emissions from non-catalyst gasoline engines. (In the 2006
petrol car vehicle parc, non-catalyst gasoline vehicles made up only 2.0% of the total number of
vehicle-km driven, and this is predicted to fall to around 0.1% by 2010.) By assuming all gasoline
vehicles have catalysts, the model slightly overestimates the total excess emissions - the
overestimate decreasing as the number of non-catalyst vehicles decreases in future years.
It should also be noted that this revised model updates the previous version of the model, EXEMPT,
where only vehicles meeting the Euro 2 emissions standard were included. Changes in emissions
standards have led to large reductions in excess emissions cold starting between Euro 2 and Euro 4
vehicles. Consequently, excess emissions from cold starting are much less that even 5 years ago,
and scope for further reductions are more limited. Therefore it is anticipated that this model can be
used as a “worst case scenario” for future years.
The equations used to model the excess emissions were determined from experimental data as part
of a UK DETR (previous name for DfT) funded project. The summary report of the project has the
following reference: DCW Blaikley, AP smith, EA Feest and AH Reading, UG219 TRAMAQ- Cold start
emissions. Summary report. AEA Technology report no. AEAT/ENV/R/0638 (May 2001), which can be
obtained electronically from http://www.aeat.co.uk/netcen/airqual/research reports.
AEA
3
Cold Start Advanced Model - user guide Issue 1
2
Loading the model
The model has been incorporated into a Microsoft Excel spreadsheet. The user uses a mouse to click
on menu options that run macros to enable access to the different areas of the model.
The calculations are hidden from the user and occur instantly when any user input parameter has
been changed.
The user should either double click on the file name Cold_Start_Advanced(v1.0).XLS within Windows
explorer, or open the file from within Excel. The file is a Microsoft Excel 2000 workbook.
The user will be prompted by Excel to enable the macros. Click on the “Enable Macros” button.
On opening the spreadsheet the appearance of Excel will be changed by macros within the
spreadsheet, removing scroll bars, formula bars, etc.
The workbook is protected from being accidentally corrupted by a set of passwords. Occasionally,
and with some versions of Excel a password prompt appears. If this happens the user should click on
the “Cancel” button each time, to close this window.
The model has been tested using PCs running:
Operating system
Microsoft Windows XP Professional
Microsoft Windows XP Professional
Microsoft Windows XP Professional
Microsoft Windows Vista
Excel version
Excel 2000
Excel 2002
Excel 2003
Excel 2007
and found to operate correctly for each configuration.
4
AEA
Cold Start Advanced Model - user guide Issue 1
3
Using the model
This section will describe the user operation of the model and the results given.
3.1
Main menu
The opening sheet of the model (the main menu) has three options, as per the picture below.
Selecting any of the options will either take the user to a new sheet, or quit from the model.
Figure 3-1 Main Menu Sheet
AEA
5
Cold Start Advanced Model - user guide Issue 1
3.1.1
Help
Selecting the option Help loads a screen that gives a brief description of the model and its purpose.
Figure 3-2 Help screen
Selecting the option Instructions in the Help option loads a brief summary of the steps required to run
the ‘Excess emission modelling’ program.
6
AEA
Cold Start Advanced Model - user guide Issue 1
Figure 3-3 Instructions in the help menu
3.1.2
Quit, Return, Print
Selecting the Quit option from the main menu will close down the model and restore Excel settings to
include the formula bar, scroll bars, etc. The user will be prompted to ensure that they want to quit.
The user returns to the main screen by clicking on the return, main menu buttons on the sheet.
The Print option enables the user to print the results of each chosen output option.
3.2
Input data
Selecting the Input Data & Results button accesses the sheet in which the user enters the
information relevant for the simulation to be performed. The total excess emissions of each pollutant
integrated over all vehicles and all three stages are displayed. The simulation is split into three stages:
1. Driving – initial driving assuming cold start
2. Parking – the time of cooling down the engine
3. Driving – driving following the initial driving and parking, with the engine in a semi-warm initial state.
AEA
7
Cold Start Advanced Model - user guide Issue 1
Figure 3-4 Input Data and Results screen
3.2.1
Input fields
Stage 1 driving – requires four inputs.
In the total number of vehicles field the user enters the number of vehicles taking part in the
modelled simulation. This figure applies also to the Stage 2 (Parking) and Stage 3 (Driving) portions
of the input, too.
The ambient temperature input cell gives the user the option to:
Either
1. enter a temperature ranging from -10°C to 30°C
or
2. choose the region in the UK by entering the regional code to select the annual mean
temperature of the region as the ambient temperature.
The regional codes are presented in the Table 3-1
8
AEA
Cold Start Advanced Model - user guide Issue 1
Table 3-1 The regional codes
Regional code
Region in the UK
100
London and South England
200
Midlands
300
Northern England
400
Scotland
500
Wales
600
Northern Ireland
Vehicle start oil temperature – the start oil temperature must not be less than the ambient
temperature, and must be less than 120°C
Driving distance – the initial driving distance should reflect/describe the distance to the
assumed first stop/parking. If the user is interested only in a single journey, then it is
recommended that this distance be set to 0.001 km (i.e. 1 m) which effectively removes the
first two stages from the calculation.
Stage 2 parking
The stage 2 parking models the cool down of the vehicle after the initial driving stage.
Two inputs are required:
Ambient Temperature – enter an ambient temperature between –10°C to 30°C
Parking Time - enter the time the vehicle has its engine switched off, in minutes
Stage 3 driving
The final driving stage requires two inputs
Ambient Temperature – enter the ambient
temperature, which must be between –10°C to 30°C
Driving Distance – enter the driving distance in kilometres from parking to the assumed destination.
The vehicle temperature at the start of stage 3 is calculated by the model from Stage 1 driving and
Stage 2, parking (i.e. cooling) stages.
Note that the model can be used to calculate the emissions from a single stage by setting the time of
1
Stage 2 to zero and the distance of Stage 1 to 0.001 km . In principal, setting the time of Stage 2 to
zero and the distance of Stage 3 to 0.001 km might be assumed to be equivalent. However, as will be
seen in Section 3.3.1, the Excess Emission Rates results screen is calculated for the Stage 3 driving
only, and this alternative would not generate these results.
1
Because of some logarithmic and reciprocal mathematical relationships used to calculate the excess emissions, a value of 0.0 km would
generate an error, and is therefore not permitted.
AEA
9
Cold Start Advanced Model - user guide Issue 1
3.2.2
Vehicle parc definition
By selecting the Vehicle parc option the user can alter the distribution of vehicle types used in the
calculation of the excess emissions. Passenger cars are grouped into 5 different categories,
comprising diesel cars with two different engine sizes, and petrol cars with three different engine
2
sizes . Vehicles within each category are divided into two emission standards groups, Euro 1 & 2, or
Euro 3 & 4. The percentages of each type should be set to represent the overall vehicle population
distribution to be modelled. The grand total percentage should be exactly 100%. If this is not the case
an error warning will be printed in other areas of the model.
Figure 3-5 Shows
the vehicle parc definition screen
The Predicted UK Vehicle Parc for years between 2002 - 2020 option allows the automatic setting
the percentage of vehicles by vehicle category for a chosen year. These percentages are based on
the national fleet in terms of fuel type (petrol and diesel), engine capacity split and vehicle emission
standards as determined by DfT data for 2006 and earlier, and DfT projections for post-2006. No
anticipation is made regarding the cold start performance of Euro 5 and 6 vehicles (which will be on
the road in the future). Their performance is assumed to be the same as that for the Euro 3 and 4
vehicles already within the model.
The total percentage of vehicle parc can be set manually and saved as a default vehicle parc by
using the option save this as the default vehicle parc. The option select your default vehicle parc
enable the user to use the saved default vehicle parc.
3.3
Outputs
This section of the model has changed quite significantly relative to the original EXEMPT model.
There are four output options:
• Excess emission rates (Stage 3 driving)
• Total excess emissions
• Detailed results, and
2
These passenger car categories have been selected to coicide with the categories for which hot emission factors are provided in the NAEI and
EMEP CORINAIR emissions guidebook.
10
AEA
Cold Start Advanced Model - user guide Issue 1
•
3.3.1
Session report.
Excess emission rates (Stage 3 driving)
From the screen entitled Input data and results the user can access Excess Emission Rates
3
(Stage 3 driving) which gives the excess emission rates for each pollutant, in units of g/m for the
number of vehicles and the vehicle parc selected. Emission rates are given for a range of distances
from 0 – 10 km from where the vehicles start their engines and the total excess emissions from driving
10 km can be found at the bottom of the table, for each pollutant. (These emission rates data are
independent of the driving distance input for Stage 3 - Driving.)
Figure 3-6 Excess emission rates
The excess emission rates for each pollutant can be seen graphically by selecting the appropriate
button showing two arrows >> placed under the column of numerical data.
3.3.2
Total excess emissions
Selecting the option Total excess emissions brings up the screen entitled Excess Emissions of the
Specified Trip where sum of the excess emissions of the pollutants from both the Stage 1 driving,
and the Stage 3 driving, following the parking profile defined in Stage 2, are given. (This is the
principal output screen that was available from the previous version of this model, EXEMPT.)
The column headed ‘per trip’ gives the excess emissions for each pollutant from the traffic specified by
the input data.
3
Note the units – the excess emissions are given in grams per metre rather than the more usual unit for hot emissions of grams per kilometre
AEA
11
Cold Start Advanced Model - user guide Issue 1
The column headed ‘per annum’ gives 365 times the “per trip” results (but in mass units of kg rather
than g). This assumes that there is the same traffic each day as specified by the input data. Regional
monthly temperatures are used in the calculation when a regional code is given.
Figure 3-7 Excess emissions of the specified trip
3.3.3
Detailed results of the excess emissions
Selecting the Detailed Results button this will take you to the screen shown in Figure 3.8, which
provides three options:
•
Detailed Results
•
Graphs Menu
•
Return
Selecting the Detailed Results option will take the user to the screen shown in Figure 3-9. This
presents detailed results, on a stage-by-stage basis, for each individual vehicle type.
For the two driving cycles, the excess emission per vehicle for each vehicle type are listed, together
with the total when integrated over all vehicles.
12
AEA
Cold Start Advanced Model - user guide Issue 1
Figure 3-8 Detailed results of the excess emissions
Figure 3-9 Detailed results, on a stage-by-stage basis, for each individual vehicle type
AEA
13
Cold Start Advanced Model - user guide Issue 1
The results in Figure 3-9 are calculated using the data listed under input data and vehicle parc
described earlier.
Graphs menu
Selecting the option Graphs menu accesses the menu screen shown in Figure 3.10. The five
pollutant chart options generate the appropriate histogram of total excess emission, summed over all
stages and every vehicle within a vehicle category, for the three stages as defined in the Input Data
input screen. An example of one such plot, for NOx excess emission, is given in Figure 3-11 for the
data listed in Figure 3-9.
Figure 3-10 Graphical display of estimated excess emissions
14
AEA
Cold Start Advanced Model - user guide Issue 1
Figure 3-11 Example of the graph
AEA
15
Cold Start Advanced Model - user guide Issue 1
This is useful for identifying the principal groups of vehicles responsible for generating the excess
emissions. For example, from Figure 3-11 it is seen that the small Euro 3 & 4 gasoline cars give the
highest contribution, whilst Euro 1 & 2, and all 1.4 to 2.0 litre passenger cars contribute around 60%
each. Modern (Euro 3 and 4) diesel cars tend to generate a reduction in NOX emissions relative to
their NOx emissions when at their normal operating temperature.
3.3.4
Session Report
Selecting the option Session Report provides the user with a list of the input data, vehicle parc used,
and all the results, including ten graphs. The first portion of this, as it appears on the user’s screen
before scrolling down is shown in Figure 3-12.
Figure 3-12 Session report
16
AEA
Cold Start Advanced Model - user guide Issue 1
AEA
17
Cold Start Advanced Model - user guide Issue 1
4
4.1
Scenarios
Excess emissions as a function of distance from a
car park
The “Cold start – Advanced” model can be used to calculate the distribution of excess emissions as a
function of distance from a car park. These arise because vehicles’ engine temperatures will have
cooled during the parking time.
4.1.1
Assessment for fully warmed up vehicles parking
For example, let us assume that all vehicles arrive in the car park with their engines hot, producing no
excess emission in the surrounding area on the way to the car park. If the car park was attached to a
sports complex, we might assign a parking time of 100 minutes. This time would vary depending on
the car park application. We will also assume a total of 1000 parked vehicles during a cold winter’s
day with an ambient temperature of 0°C.
In order to ensure that the vehicles arrive hot, we set the stage 1 distance to a high value, e.g. 10 km,
with a start temperature of 50°C and ambient temperature of 0°C.
We set the time for parking in Stage 2 as 100 minutes and the ambient temperature is set to 0°C. For
Stage 3 we also set the ambient temperature to 0°C. The distance for the stage 3 driving is not
important to the results given in the “Excess Emissions Rates (Stage 3 Driving)” output screen, but
could be set to 10 km.
The “Excess Emissions Rates (Stage 3 Driving)” gives the excess emission rates, in units of grams
per metre (rather than units of g/km which are usually used for hot emission rates) as a function of
distance from the car park, in ten distance ranges (again expressed in metres) up to 10 km from the
point of start the vehicles’ engines. These rates are independent of the Stage 3 Driving Distance
entered.
The initial stage (stage 1 driving) will produce some excess emissions that are added to the excess
emissions from driving the 10 km away from the car park. This can be calculated and is the difference
between the “Excess Emissions of the Specified Trip” output value, and the total excess emissions
over 10 km from Stage 3 driving values provided on the “Excess Emissions Rates” output screen.
4.1.2
Assessment for non-fully warmed up vehicles parking
The excess emissions generated by vehicles arriving at the car park whose engines are not at their
normal operating temperature can be found in the same way. For example, for vehicles travelling 2
km to the car park, we set the Stage 1 Driving Distance to 2 km, with an engine start temperature of
0°C and the ambient temperature also as 0°C. When the vehicles arrive at the car park their engine
temperatures will be below their normal operating temperature, and they will cool down from this lower
temperature. Consequently, when restarted their engine temperature will be lower, and the excess
emissions rate will be higher, than was the case for the scenario described in Section 4.1.1.
In addition, because the vehicles did not arrive with a fully warmed engine, the excess emissions
generated by vehicles travelling to the car park ought to be included in the calculation. The approach
recommended to quantify this is to create a scenario such that at the start of Stage 3 Driving, the
vehicle is essentially cold, e.g. through having the Stage 1 driving distance 0.001 m, and the Parking
time 120 minutes. Then the “Excess Emissions Rates (Stage 3 Driving)” gives the excess emission
rates as a function of distance driven. If it is adjudged that 10% of the cars reaching the car park have
travelled around 1 km, 30% 1 – 2 km etc, and it is the excess emissions on an access road into the
18
AEA
Cold Start Advanced Model - user guide Issue 1
car park, and within the car park, that are of interest, the “Excess Emissions Rates” screen gives these
excess emission rates (in units of grams per metre) for the appropriate distance range.
4.1.3
Other parking schemes
The model can simulate many different car parking arrangements. For example, the parking time
might be different if the car park is for a shopping centre (a distribution of parking times could be
used).
4.2
Excess emissions as a function of distance or time
The revised “Cold Start – Advanced” model, unlike its predecessor, EXEMPT, does give information
about the spatial distribution of the excess emissions produced from a specified set of conditions,
through the “Excess Emissions Rates” output screen. This removes the need to undertake some of
the more convoluted calculations described in the previous user guide.
In addition, the distance ranges given in the “Excess Emissions Rates” output screen can be
converted into time ranges, see the table below. This conversion is based on the 18.4 km/hr average
speed of the driving cycle used to quantify the excess emissions (the ECE component of the NEDC).
Distance travelled
Time taken to travel this
distance at 18.4 kph
0m
0s
100 m
19.5 s
200 m
300 m
400 m
500 m
1,000 m (1 km)
2,000 m (2 km)
4,000 m (4 km)
6,000 m (6 km)
8,000 m (9 km)
10,000 m (10 km)
39 s
58.5 s
78 s
97.5 s
3.25 min
6.5 min
13.0 min
19.5min
26.0 min
32.5 min
This can be used, in conjunction with the speed related hot emission factors for vehicles, to assess the
excess emissions generated, or saved, by altering journey times.
For example, if the rephrasing of traffic lights were predicted to cause a reduction in journey times of
20% for the first 500 m driving away from a car park, then time taken would become 78 seconds,
rather than 97.5 seconds. In terms of distance, the excess emission rate for the first 19.5 seconds
would now be that distributed over 125 m, rather than 100m. Consequently, the new emission rate
would be 100/125 (i.e. 80%/100%) of that given in the “Excess Emissions Rates” output screen. For
the given example, the total excess emissions over 500 m would become 100 x (sum of first 4
emission rates in the table). This will be greater than 80% of the original excess emissions because of
the non-linearly reducing excess emissions with distance from the starting location or with time
following engine start.
AEA
19