1
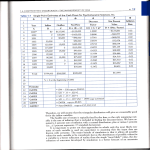
The Friends and Family Test Results
Dashboard User Guide
Version 1.02
The Friends & Family Test
Part of the NHS Patient Revolution
Contents
Introduction.................................................................................................................................................................................. 3
1.Score...................................................................................................................................................................................................... 4
1.1Providers................................................................................................................................................................................... 4
1.2Filters..................................................................................................................................................................................... 5-8
2.Responses........................................................................................................................................................................................ 9
3.Distribution................................................................................................................................................................................ 10
4.Range................................................................................................................................................................................................ 11
5.Benchmarking....................................................................................................................................................................... 12
6.Map..................................................................................................................................................................................................... 13
7.Outliers............................................................................................................................................................................................ 14
8.Trend.................................................................................................................................................................................................. 15
9.Notes.................................................................................................................................................................................................. 16
2
Introduction
Since April 2012 Acute Trusts across NHS Midlands and East have been asking the
Family and Friends Test Question “how likely is it that you would recommend this
service to friends and family?”
The question has been asked at the end of a patients care, e.g. on the day of discharge, ideally away from
bedside or up to 48 hours post discharge. A score is generated by their responses, categorised into one
of three groups; Promoters, Passives and Detractors. To calculate the score the percentage of Detractors is
subtracted from the percentage of Promoters. The score will fall between -100 (everybody is a Detractor)
and +100 (everybody is a Promoter).
The scores for each trust, and an overall score for NHS Midlands and East are currently published each
month through a dashboard accessible to all.
This guide helps you access the dashboard and make the most of this unique insight into patient
experience in the NHS Midlands and East. An insight that helps us identify best practise, improvements
and where we can do better for our customers. Full details of the Friends and Family Test process can be
found in the ‘Implementation Guidance Family and Friends Test’ (Document Ref: SPT/PR/NP1).
This shares the results of how people viewed their overall experience whilst in our care, and maps our
progress towards service excellence. If you notice a Trust that is doing well and might be able to help you,
get in touch. You could also offer help others. The Customer Service Alliance has been set up to share
best practice and members have been integral in helping to design the dashboard. For any information on
the Customer Service Alliance and its work please contact us on [email protected]
The Dashboard has a number of different ways of displaying the results in a simple to use and understand
format. Navigation around the screen is by ‘point and click’, and one click leads to another. There is only
one screen, with a number of ‘selections’ that you can pick from to alter your view of the results.
In each selection there are a number of buttons you can use to filter the information. You can ‘go back’
to the start position for each selection by clicking on Clear Filters .
The opening view of the Dashboard will display the Overall Score for the most current results for
All Providers, showing the total number of Promoters (in green) Passive – not Promoters or Detractors
(in yellow) and Detractors (in red). You may find that when you open the Dashboard it will open at the
last point you viewed it.
*note that all the results shown on the screenshots are test data and are not indicative of any of the actual scores.
3
1.Score: 1.1Providers
Across the top of the screen there is a number of selections:
Clicking on one of the selections changes the view of the results. Within each selection there are a
number of options to filter and view the scores.
Select
Score
. Clicking on All Providers you can view the overall results for NHS Midlands
and East.
Fig 1
Clicking on
By Provider
expands the results to show a list of all providers fig 2.
4
1.Score: 1.1Providers
Fig 2
You can view the weekly scores for each trust by clicking on
Click for Weekly Breakdown
will display the weekly trust scores for the selected month (fig 2a).
5
which
1.Score: 1.1Providers
You can return to the monthly scores by clicking on
Click for Monthly Scores .
Fig 2a
6
1.Score:1.2Filters
Clicking on
View Filters
opens a filter pick list you can use to modify the information displayed
(Fig 3). You can filter by ‘Reporting Period’, ‘PCT Cluster’ and ‘Provider’ by clicking in the tick box. Once
you have made your selections click on the top right hand X to close the filter pick list.
You can revise the filters at any time by clicking on
click on
View Filters
and reselecting. At any time you can
Clear Filters , which will return you to a list of all providers. However, you must always select a
Clear Filters . Once you have selected your filters
reporting period; it will not be cleared by clicking on
you will have a list of the results you wish to view.
Fig 3
7
1.Score:1.2Filters
In fig 2/2a there is a scroll bar on the right hand side if you cannot see the provider you are looking for.
All subsequent screens will now display the information for that Provider(s) unless you unselect by clicking
on
Clear Filters . You can rearrange the information by ‘double clicking’ on a table header. For
example rearrange by Score, by double clicking again the result list will be reversed.
The selection displays the results for each provider. X shows where a trust has not reached the 10%
response rate for the reporting period displayed.
You can export the data table to an Excel file using the following process. Point at the data table and right
click. Select send to Excel and click. The data table will open in Excel and can be saved locally. (If the Excel
file does not automatically open a dialogue box will open with a click here option).
8
2.Responses
. The Responses header reveals the results a table (fig 4), showing details of the
collection of the Data. You can view the Trust results by clicking on By Provider
Select
Responses
•
Footfall (how many inpatients recorded in the monitoring period)
•
Responses (how many of the above answered the F&FT question)
•
Response Rate (the percentage of inpatients responding to the F&FT question)
•
Return (Yes shows a return for the reporting period selected)
You can filter and clear filters in the display in the same way as on the
Score
selection. There
is a scroll bar on the right hand side if you cannot see the provider you are looking for. You can rearrange
the results by ‘double clicking’ on any of the table headers.
Fig 4
9
3.Distribution
Select
Distribution . The Distribution selection displays a bar graph showing how the scores were
distributed across all Trusts. You can filter and clear filters in the display in the same way as on the
Score
selection.
Fig 5
10
4.Range
Select
Range
. The Range selection reveals a summary of the range of scores across the
Providers for each monitoring period (figure 6), showing where the lowest, highest and average scores sit.
The summary also shows the Upper Quartile score threshold. You can filter and clear filters in the display
in the same way as on the
Score
selection. To view the overall result Range you must clear
the filters.
Fig 6
11
5.Benchmarking
Select Benchmarking . The Benchmarking selection reveals the scores and the average (mean) score
across all Providers. The coloured bar graphically shows the range of possible scores (-100 to 100) The grey
area of the score chart shows the mean score, the red area is ‘less than the mean score’ and the green
area is ‘greater than the mean score’. There is a marker showing where each Provider sits within the range
of scores and their relation to the mean score. You can filter and clear filters in the display in the same way
as on the
Score
selection, or rearrange the table by ‘double clicking’ on a header.
Fig 7
12
6.Map
Select
Map
. The Map selection displays a number of circles superimposed on a geographical
map (figure 8); the larger the circle the higher the score. The majority of circles should normally be blue.
Low statistical outliers are shown in red and high statistical outliers are shown in green. Circles outlined
in black show Trusts with a less than 10% response rate. You can click on any of the circles to display the
provider and a close up of the location on a street map. You can filter and clear filters in the display in the
same way as on the
Score
selection.
Fig 8
13
7.Outliers
Select
Outliers
. The Outliers selection displays the results in the form of a funnel graph
mapping the number of responses against the scores. There are two blue horizontal lines showing the
extent of the upper and lower quartile values. The yellow dotted line shows the average (mean) score for
the reporting period. The red and green lines make up the funnel. Scores that sit between the red and
green lines are said to be within the bounds of ‘normal cause variation’. Any score that sits outside these
lines can be considered as an alert or cause for concern. You can filter and clear filters in the display in the
same way as on the
Score
selection.
Fig 9
14
8.Trend
Select
Trend
. The trend selection shows the trend in the results from April 2012 (benchmark
score). You can filter and clear filters in the display in the same way as on the
although all reporting periods will always be displayed.
Fig 10
15
Score
selection,
9.Notes
If at any time, using the above process, it seems that the information you want to display does not appear
it will normally mean that there is a filter in operation. Usually
Clear Filters
will get you back to a
starting point to continue your search. However once you have used the Dashboard a couple of times it
becomes second nature and is easy to navigate and comprehend.
To help us develop the dashboard your feedback is always welcome. If you want further information or
have questions or suggestions on how to use the Dashboard, please either ring the Strategic Projects Team
on helpline number 0800 923 3001 or email us at [email protected].
User guide compiled by the Strategic Projects Team, NHS Midlands and East. Version 1.02
The NHS Midlands & East Friends & Family Dashboard is managed by the Strategic Projects Team in
conjunction with our Quality Observatories. The dashboard can be displayed on all platforms (PC Windows
XP and above, Apple Mac, ipad, iphone and android telephone) through all popular browsers. In some
browser versions you may need to adjust the settings to allow cookies.
September 2012
Our ambitions for the NHS in the Midlands and East
Eliminate avoidable grade
2, 3 and 4 pressure ulcers
Significantly improve quality
and safety in primary care
Create a revolution in patient
and customer experience
Make every contact count using every opportunity to
deliver brief advice to improve health and wellbeing
Ensure radically strengthened partnerships
between the NHS and local government
The Friends and Family test is a central part of the Customer Services Strategy workstream within
NHS Midlands and East’s ‘Patient Revolution’ ambition. The aim of the ambition is to ‘create a patient and
customer services revolution’, ensuring that improvements are systematically and sustainably achieved.
For more information on NHS Midlands and East’s ambitions visit www.midlandsandeast.nhs.uk.
16
Prepared by:
The Strategic Projects Team on behalf of
The Policy and Strategy Directorate
NHS Midlands and East
Victoria House
Capital Park
Cambridge
CB21 5XB
Tel: 01223 597713
www.eoe.nhs.uk/strategicprojects
[email protected]
Ref: ADMPT/10135/140812