1
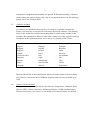
INTERNATIONAL MORTALITY AND
SMOKING STATISTICS SYSTEM
A BRIEF DESCRIPTION AND USER’S GUIDE
Barbara Forey, John Hamling and Peter Lee*
August 2002
*P.N.Lee Statistics and Computing Ltd
17 Cedar Road
Sutton
Surrey
SM2 5DA
UK
Tel:
00 44 (0)20 8642 8265
Fax: 00 44 (0)20 8642 2135
E-mail: [email protected]
INDEX
Text
1.
2.
3.
Page
Description of the system
1
1.1
1.2
1.3
1.4
1.5
1.6
1
1
2
2
3
4
Introduction
Data structure - Age, Period and Cohort
Countries included
Causes of death included
Data sources
Definitions of causes of death
User’s guide
7
2.1
2.2
2.3
2.4
2.5
2.6
2.7
2.8
2.9
7
8
11
12
13
14
15
16
17
Getting started
Using the Mortality Plots sheet
Using the Prevalence Plots sheet and the Lagging or Averaging option
Using the Consumption Plots sheet
Using the Scatter Plots sheet
Using the Combination Plots sheet
Using alternative (retrospective) tobacco data
Printing and saving results
System requirements
References
17
Tables (see file UsersGuide-Tables.pdf)
1
Availability of mortality data (as at June 2002)
2
Availability of sales-based tobacco data
3
Availability of main survey-based tobacco data
4
Availability of data from retrospective survey-based tobacco data
5
Definitions of causes of death
Examples (see file WorkedExample.doc or WorkedExample.pdf)
ABBREVIATIONS
A
CB
COPD
CPP
ICD
IHD
ISS2
MC
PNLSC
TC
WHO
All tobacco products
Chronic bronchitis
Chronic obstructive pulmonary disease
Cigarettes per person per day
International Classification of Diseases
Ischaemic heart disease
International Smoking Statistics, second edition
Manufactured cigarettes
P.N.Lee Statistics and Computing Ltd.
Total cigarettes
World Health Organisation
1
1.
Description of the system
1.1
Introduction
The system is designed to give ready access to international data on tobacco
consumption, smoking prevalence, and mortality from the major smoking-related
diseases. It consists of a set of linked Excel workbooks, containing nationally-based
data for 30 countries on mortality from four major smoking-related diseases and on
tobacco and smoking statistics. Facilities are provided to help the user to explore the
relationships in the data via a variety of standard plots and tabulations.
1.2
Data structure - Age, Period and Cohort
In general, the data are organized in tables where the rows represent 5-year periods,
and the columns 5-year age groups 0-4, 5-9, 10-14, 15-19, 20-24 .... 80-85, and 85+,
for males and females separately – see Example 1T. The diagonals of such a table can
be interpreted as representing the lifetime experience of people born around the same
time, e.g. people aged 0-4 in 1901-1905 would be aged 5-9 in 1906-1910 and aged
10-14 in 1911-1915 etc. Thus the diagonals of the table correspond approximately to
the experience of a birth cohort.
One of the main objectives of this system is to allow mortality from smoking-related
diseases for a group of people to be related to their tobacco consumption history as
recorded at various periods of their life. A cell in the mortality table relates to a group
of people dying at a specified age and period. Their lifetime tobacco history can be
found by starting at the equivalent cell in the corresponding tobacco table and
working backwards up the diagonal of this table. Facilities for this type of analysis
are provided.
In general, and subject to availability, results are presented by 5-year periods, starting
at 1851-1855 and continuing to 1996-2000, and in the 5-year age groups 15-19, 20-24
.... 80-84, and 85+.
Some limitations to this birth cohort approach should be noted. First, people dying
within a 5-year period and a 5-year age group actually include those born in a 10-year
age range. For example, those dying at age 60-64 in 1961-65 include 64-year-olds
dying in 1961, born in 1896, and 60-year-olds dying in 1965, born in 1905. A more
rigorous method taking these overlapping cohorts into account has been used in some
other work1,2 but is not attempted here. Second, the approach ignores the fact that the
data in the different cells of a diagonal do not relate to the exact same people, as
2
immigration, emigration and mortality are ignored. Differential mortality, with more
smokers than non-smokers dying early, may be an important feature for the oldest age
groups, but is not considered here.
1.3
Countries included
30 countries are included as shown below. Coverage is essentially complete for
Europe, but elsewhere is restricted to some major developed countries. One limiting
factor is the availability of sufficient smoking data for useful study, another is that
mortality data submitted to WHO for some other countries are only regional, based on
inadequate death registration and/or cover only a very limited period of time.
Australia
Austria
Belgium
Bulgaria
Canada
Czechoslovakia
Denmark
Finland
France
Germany
Greece
Hungary
Iceland
Ireland
Israel
Italy
Japan
Netherlands
New Zealand
Norway
Poland
Portugal
Romania
Spain
Sweden
Switzerland
UK
USA
USSR
Yugoslavia
Between World War II and reunification, data for Germany relate to West Germany
only. Data for Czechoslovakia, USSR and Yugoslavia data are only included up to
1990.
1.4
Causes of death included
The system currently contains data for four diseases: Lung cancer, Ischaemic Heart
Disease (IHD), Chronic Obstructive Pulmonary Disease (COPD) and Respiratory
Diseases (non-acute). See section 1.6 for details of how these diseases are defined.
3
1.5
Data sources
Age-, sex- and cause-specific mortality data are made available by WHO on the
internet, and commonly start in the 1950s. The WHO data are provided as numbers of
deaths and populations for single years, which are converted to rates (per 100,000) for
the 5-year periods. If data are not available for the full 5 years, the rate is calculated
from the available years. Table 1 shows, for each country, the period of availability of
mortality data (as at June 2002).
For other sources of population data (usually before about 1950), see the second
edition of AInternational Smoking Statistics@ (ISS2)3.
Smoking data are mostly taken from ISS2, and from Supplement 1 to ISS2 (in
preparation). They have been arranged into 5-year periods matching those used for
mortality, but starting earlier if available. Sales-based consumption data have been
entered, so far as they are available, for three product categories:
• manufactured cigarettes (MC),
• total cigarettes (i.e. including hand-rolled) (TC), and
• all tobacco products (A).
They are given as number (or grams, for all tobacco products) per adult per day. They
commonly start around the 1920s, but go back much earlier for a few countries.
Where original sales data are not available for all 5 years an average from the
available years is used. Note that sales-based consumption data are not age- or sexspecific.
Tar data (mg per cigarette) are also available for some countries, commonly starting
around the 1960s. Tar is assumed to be 35 mg/cigarette up to 1955 (except in the very
few instances of actual data before that year), with simple linear interpolation used to
fill in missing years. Tar data are also not age- or sex-specific.
The availability of sales-based tobacco and tar data is shown, for each country, in
Table 2.
The main survey-based data consist of:
$
prevalence, for each of the three product categories, as a percentage, and
$
consumption of manufactured cigarettes and of total cigarettes, as number per
person per day adjusted to total sales.
4
Both these types of data are taken from Supplement 1 to ISS2, which estimated
averages from all the survey data presented in ISS2, by sex H 5-year period H 5-year
age group. These estimates assume that there were no smokers below the age of 15.
Prevalence estimates commonly start around the 1950s, with consumption estimates
commonly starting in the 1960s. Fuller details of the availability of the main surveybased tobacco data are shown, for each country, in Table 3.
The main survey-based data derive from studies in which subjects are asked about
their current-smoking habits. For ten countries, alternative survey-based data sets are
also available. These are based on studies in which subjects are asked about their
lifetime smoking history (see ISS2 Appendix V and Supplement 2 for a description of
this method and a discussion of some of its advantages and disadvantages). These
data commonly relate to birth cohorts born after about 1890 and do not involve the
assumption of no smoking below age 15. They are taken from various published
sources and are not derived on a consistent basis (see Table 4 for fuller details of the
surveys). No attempt has been made to standardize these data. The database simply
includes the data for the nearest relevant standard period and age group, either
duplicating data or leaving gaps as appropriate to the individual case. For instance,
many of the sources are based on 10-year birth cohorts, and these have been entered
by repeating the data for the two relevant age groups. The user will need to consider
how to use these alternative data sets on an individual basis. Their advantage is that
they often allow lifetime tobacco history to be estimated over a longer time period
than is possible based on the main survey-based data.
1.6
Definitions of causes of death
Deaths are coded according to successive revisions of the International Classification
of Diseases (ICD). Countries vary as to when (and if) they introduce the various
revisions (see Table 1). In the 1950s the 6th revision was in use, and the latest 10th
revision, published in 1992, is now in use by 13 of the countries. Except in the case of
the 10th revision, which is used in full, data are provided to WHO according to
various summary coding lists based on the ICD, and some countries use their own
more limited versions.
Changes between the ICD revisions reflect differences in the understanding of the
disease process and changes in terminology. For instance, stroke was a disease of the
nervous system up to the 7th revision and of the vascular system subsequently, while
COPD is a term of only relatively recent origin. These changes can make it difficult
to extract consistently defined series of mortality data. The actual definitions used for
5
the four disease groupings are detailed in Table 5.
As can be seen from Table 5, there is no real difficulty in obtaining a comparable
disease definition from the data available for the various ICD revisions for lung
cancer, the definition used always including cancers of the trachea, lung and
bronchus.
For IHD, the definitions used in the 8th, 9th and 10th revisions are also quite
comparable. However, the definitions used in the 6th and 7th revisions are somewhat
broader. It has been suggested4 that comparability might be obtained by using codes
420 + 422.1 in the 6th and 7th revisions, but data are not available from WHO for such
detailed codes. Examination of 1965 data for England and Wales showed that deaths
for summary code A081 (as used in the database) were about 11% higher for men and
25% higher for women than deaths for 420 + 422.1, so the discontinuity is not a
minor one. Given that the alternative was not to have any IHD data before about
1968 (when the ICD 8th revision came in), it seemed better to include earlier data
using a somewhat different definition, but making it clear that there was a problem of
non-comparability when studying time trends.
For COPD the problem is more complex. Ideally, for comparison with smoking data,
one would have liked a disease definition which included the terms chronic bronchitis
(CB), emphysema and COPD. However, there were a number of problems:
(i)
(ii)
(iii)
(iv)
asthma, as well as bronchitis unqualified as to whether it is acute or chronic, is
combined with CB and emphysema in the same WHO broad summary code in
the 8th and 9th revisions,
COPD is classified with “other respiratory disease” in the 6th, 7th and 8th
revisions, it being a term only commonly used in the last 20 years or so,
emphysema is classified with “other respiratory disease” in the 6th and 7th
revisions, and
asthma is included under allergic disorders (and not as a respiratory disease at
all) in the 6th and 7th revisions and cannot be separately identified from the
available data.
After studying coding systems in some detail it became clear that there was no
entirely satisfactory solution. The definition of COPD finally selected (as detailed in
Table 5) is comparable enough for the 9th and 10th revisions, but will lead to some
discontinuities earlier, which may vary by country. As an alternative, data for
6
respiratory diseases (non-acute) are also included. This broader disease grouping has
fewer continuity problems, but includes various diseases that are not associated with
smoking.
It should also be noted that there are numerous ‘rules’ used when carrying out the
coding, and that these may vary between countries and from time to time. For
instance, the death coded is the underlying cause, but between 1985 and 1992
England and Wales adopted its own version of the rule to determine the underlying
cause, resulting in a substantial drop in the death rate from pneumonia in that period.
A discussion of other aspects of the validity of mortality data is given by Alderson5.
Tables 1-5 are provided for quick reference to the time span for which the different
types of data are available. This information is also given in the Country Details sheet
of each workbook.
7
2.
User’s guide
2.1
Getting started
The system works in Excel 97 or later. Macros must be enabled (some systems
default to disallowing macros for virus protection). The preferred screen resolution is
1024 H 768. Use View then Full screen (or alternatively Zoom 75%) for best effect. See
also section 2.9, System Requirements.
Files are installed with Aread-only@ status to prevent accidental corruption of the data.
If required, the main file can be copied with read/write status, so that settings for
particular analyses can be saved.
The first step is to open the workbook LCMMAIN, either from the Windows Start /
Programs menu, or from within Excel. Next open the workbooks for the countries of
interest, and optionally RatioC. (To open a number of workbooks at once, highlight
their names using ctrl click, then click on Open, but do not do LCMMAIN by this
method, it must be opened first. Only those countries being used in a particular
session need to be opened. RATIOC only needs to be opened if using country ratios.)
Although many workbooks are opened each containing many sheets, the user will
carry out the vast majority of operations using just the first few sheets of LCMMAIN.
These are:
Index
Mortality Plots
Consumption (CPP) Plots, including both sales and survey-based consumption
Prevalence Plots
Scatter Plots, comparison of mortality vs prevalence/consumption
Combination Plots, simultaneous plotting of mortality and either consumption
(sales and/or survey based) or prevalence
Each of the plot sheets holds a succession of pages, each page containing a single
plot. These are reached directly by simply clicking on the relevant button in the Index
sheet, or by scrolling down through the plot sheet.
The user may also want to look at the first sheet, Country Details, of the country
workbooks, where information on the exact range of available years of data is shown.
8
2.2
Using the Mortality Plots sheet
On this sheet, the user can plot (or tabulate) mortality data according to a number of
factors. The mortality data commonly start in the 1950s.
In all plots on this sheet, the mortality rate forms the y-axis. First decide which factor
is to form the x-axis of the plot, choosing from age group, period and birth cohort.
Then decide which factor is to be represented by lines on the plot, choosing from age
group, period, birth cohort, sex and country. Then scroll down within the sheet to the
page labelled with the two chosen factors, or click on the relevant button on the Index
sheet to move there directly. The pages are:
1
Period and Age group
2
Age group and Birth cohort
3
Period and Birth cohort
4
Sex and Age group
5
Sex and Period
6
Sex and Birth cohort
7
Country and Age group
8
Country and Period
9
Country and Birth cohort
Looking at the first page, Period and Age group, with the default settings and the UK
workbook opened, Example 1 will be displayed.
The content and appearance of the plot can be varied in several ways.
By clicking on the X Axis options buttons:
• These buttons allow the two factors in the plot to be swapped. In this Example, if
you click on Period, the appropriate labels will appear on the x-axis (bottom) and
Age group will appear in the legend (side-right).
By using the drop-down menus:
• Data will be for a single country, chosen from the Country menu, with the Country
Ratio (denominator) set to None (Single Country). Or, for a ratio of two countries,
choose the numerator country with the Country menu and the denominator in the
Country Ratio (denominator) menu. You must have opened the workbook RatioC
before choosing this option, and you must also have both country workbooks
open.
• Sex can be set to Males, Females, Males & Females (combined) or Male/Female Ratio.
9
•
Disease can be set to Lung Cancer, Ischaemic Heart Disease, COPD or Respiratory
Disease (non-acute). Definitions of these diseases have been discussed in section
1.6, as has the importance of ICD revision changes – the timing of these can be
seen in Table 1 and in the Country Details sheet of each country.
By clicking on the Plot Settings button:
• By default, the x-axis is scaled to fit all the standard age groups. Use Plot Settings,
then Age groups to show a restricted range, or to choose, e.g. alternate age groups.
Either just click in the individual tick-boxes, or use ctrl click to highlight all the
ones you want to add, then click on the Show Selected Age Groups button. However
you cannot at this point in the program combine age groups.
• All the standard periods are shown in the legend, and all that have data available
appear as a line on the plot. Use Plot Settings, then Periods to show only a restricted
selection. The colours/symbols will not be altered*.
• Click on Mortality Plots to get back to your plot.
• Note that Plot Settings apply to the whole of the Mortality Plots sheet. However, as
we are working in the Age and Period page of the spreadsheet, only those settings
will affect our current plot.
By normal Excel facilities:
• To vary the range of the y-axis, right-click on an axis value and select Format Axis.
The default settings for the y-axis are minimum = 0, maximum = automatic,
crosses at 0. To change these (e.g. if you want to create a series of plots all using
the same fixed range), choose the Scale tab. However, Format Axis should not be
used to alter the range of the x-axis – use only Plot Settings.
• To change the appearance of the axis labels, for instance to change the number of
decimal places on the y-axis labels, use Format Axis then choose the Number tab,
and alter as required. On the x-axis, you can choose the Alignment tab to change
the angle at which the labels are displayed.
• To change the colours or symbols, right-click on a line and choose Format Data
Series, Pattern.
• Changing to a log-scale is described below for Example 2.
• Labels can be typed into any of the blank cells – the Example numbers have been
added in this way.
* There is an Excel problem that if more than 16 colour/symbol definitions are in use (as will be the case for
periods and cohorts, but not for age groups) and if lines are hidden and then the axes are swapped, then the
colours will change. To avoid this, have all periods/cohorts showing when swapping axes.
10
•
Labels on the plot itself can be edited. However some labels are controlled
automatically by the settings in the menus, and this may be disrupted by editing
them directly, so do not save LCMMAIN if you have made any changes.
Click on the Print Plots button to print this plot and its settings. Other options for
printing and saving the results are discussed below.
Click on the Data Table button to display the equivalent data table. Normal Excel
facilities can be used here (e.g. to change the number of decimal places displayed).
Those settings which are controlled by the drop-down menus can be changed here
too, in which case the plot will also be updated. The Print Table button prints the table
(see Example 1T). When finished, click on Go to Mortality Plots which takes you back
to the original position in the plot sheet.
The next two pages of the Mortality Plots sheet work in exactly the same way, and
Example 2 shows a plot generated on page 2, Age and Birth cohort. A restricted age
range has been chosen (via Plot Settings) and a Log Scale set on the y-axis (to do this
right-click on an axis value, choose Format axis, choose the Scale tab and tick
Logarithmic scale. You must make sure to avoid having a minimum of zero, the easiest
way being to fix the Minimum at a low value (e.g. 0.1) and setting Crosses at to the
same value).
The remaining pages (pages 4-9) of the Mortality Plots sheet share many of the features
already described, but there a few differences. To see these scroll down to page 5,
Sex and Period, where Example 3 can be generated:
• For these pages, the x-axis factor is already fixed, since the other factor (i.e. sex
or country) cannot be used on the x-axis and so must appear as the lines.
• Since age, period and birth cohort are interdependent, and since one of these must
be chosen as the x-axis factor, a single drop-down menu is provided to allow one
only of the other two to be chosen. The third is thus implicitly fixed.
• Where sex is chosen as the factor for the lines (as in Example 3), the available
lines include the M/F ratio. In fact, it is unlikely that this will be required
alongside the other Male, Female and Combined lines, since the scale will be
inappropriate. It can be hidden via Plot Settings. A more useful plot of the sex
ratios can be achieved in the Country and Period page, displaying several countries.
(See Example 4 – open the additional country workbooks required and go down
to page 8 on the Mortality Plots sheet. Notice that the Plot Settings were used to
restrict the periods on the x-axis in Example 3, and this remained set for
11
•
•
•
2.3
Example 4).
Where country is chosen as the factor for the lines, all countries will be shown in
the legend, except those hidden via Plot Settings. However a line will only appear
in the plot if the country workbook has been opened, and if appropriate data are
available.*
On pages 5 and 8, Sex and Period and Country and Period, a facility is available to
allow an age-group to be defined as a combination of standard age groups. This
can be weighted either to the actual population (i.e. unweighted), or to a standard
population (WHO-World or European standard populations, or a Custom standard
population can be defined as any country/year). Click on Combined Age Group
Settings to define the combined group, then choose it from the bottom of the Cohort
or Age group drop-down menu. See Example 4.
Also on pages 5 and 8, Sex and Period and Country and Period, a facility is available
to allow the data in all lines to be scaled relative to a chosen period. This has the
effect of forcing all the lines to pass through a single point at value 1, and the
relative changes in the statistic would be more clearly seen. See Example 5. Note
that the whole line will disappear for any line with missing data at the period, as
has happened with Belgium in the Example. Choosing a period in the centre of
the range would avoid this.
Using the Prevalence Plots sheet, and the Lagging or Averaging option
Prevalence data represent the percentage of the population who smoke. The data are
taken from Supplement 1 to ISS2 (in preparation), and are estimates based on all the
sex-specific surveys in ISS2 standardized to 5-year age groups and 5-year periods.
They are structured in the same way as the mortality data and commonly start around
the 1950s.
This sheet is arranged into the same 9 pages as the Mortality plots sheet, and all the
features described above apply. Two new options are available here. Firstly, the
Tobacco Type is chosen as Manufactured cigarettes, Total cigarettes (i.e. including hand
rolled) or All tobacco products. The second special facility added here is Lagging or
Averaging. In Example 6, the Lag or Average Start and End settings (top-right) are both
set to the default values of 0 (Current), so the data relates directly to the period shown,
exactly as for mortality plots.
* If any country workbooks have been closed, it is advisable to press F9 (calculate now) to force Excel to clear
the links to that data. Otherwise the country lines may remain.
12
As described in section 1.2, a simple approximation to the lifetime tobacco history
relevant to a particular cell in the mortality table can be found by starting at the
equivalent current cell in the tobacco table and working backwards up the diagonal of
the table. The Lag or Average Start and End drop-down menus (top-right) allow this to
be carried out. If both are set to the same time, then the tobacco statistic is lagged,
e.g. if both are set to 10 years previous, then the value used is taken from two steps up
the diagonal from the current cell. If set to different times, then the value is calculated
as a simple average, e.g. if the start is set to 15 years previous and the end to
rd
nd
st
5 years previous, then the value is the average of the 3 , 2 and 1 steps up the
diagonal. See Example 7.
Some points to note:
• The result will be set as missing, unless all the values in the range are available,
i.e. are not themselves missing and fall within the subjects= lifetime, e.g.
consumption 20 years ago will automatically be missing for 15-19 year olds.
• For the standard ISS2 survey-based data, it is implicitly assumed that prevalence
and consumption were zero below age 15. So if a lag of 10 years is set, data for
age groups 15-19 and 20-24 will automatically be zero. This assumption is made
even for periods with no data available, so that these zeros are available for
lag/average calculations.
• Consumption during lifetime or adulthood can be calculated by setting the Start
point to Age 0-4 or Age 15-19 respectively, and End to 0 (Current).
• If creating a Combined age-group, or using Sexes-combined, then the simple
average/lag is calculated first on the original single sex/5-year age group, then the
population weighted average is calculated. In other words, only the population at
the current time-point is used.
• Some limitations on the validity of this process have been described in section
1.2. Note also that the 85+ age group is clearly wider than 5 years, so its use in
lagged or averaged calculations is not recommended.
2.4
Using the Consumption Plots sheet
Consumption data are of two types. Sales data are given as number of cigarettes (or
grams, for all tobacco products) per adult per day. They commonly start around the
1920s, but much earlier for a few countries. Tar data (mg per cigarette) are also
available for some countries, commonly starting around the 1960s. Where original
sales data are not available for all 5 years an average from the available years is used,
and for tar data, a value of 35 mg is assumed up to 1955, with a simple linear
interpolate used across any missing period. Survey data are taken from ISS2
13
Supplement 1, and have been estimated in a similar way to the prevalence data. They
are given as number of cigarettes (or grams, for all tobacco products) per person per
day.
This sheet is very similar to the Prevalence Plots sheet, with some additional options:
• The Source of the data must be set to Sales or Survey. Survey data is structured the
same as the prevalence data, so Sex and Age group settings are relevant.
• In Example 8, Sales has been chosen, and since these data are not sex-specific, the
Sex setting is automatically forced as combined. Sales data are also not agespecific, and so when current or lagged data have been chosen (i.e. if Start and End
are set the same) the choice of Age group does not affect the results. However if an
average (e.g. Start = Age 15-19, End = 0 (Current)) has been set, then the Age group
setting will affect the result. Setting a lag for sales data simply shifts the data. It
is possible to choose sales data for e.g. a Sex and Age group plot, but not
particularly appropriate as the data will all be the same.
• Tar Adjustment is chosen as None, Standard (i.e. relative to 35 mg) or
Sq=root Standard – this can be applied to any tobacco type, although its relevance
is primarily to manufactured cigarettes. See Example 9.
Notice that in Examples 8 and 9, a wider range of periods has been set (via Plot
Settings) than in Examples 3-5, because sales data are available earlier than mortality
data. Notice also that, even when there is a gap in the data series (e.g. Bulgaria has no
sales data for the 1940s or 1950s), a continuous line is shown.
2.5
Using the Scatter Plots sheet
In this sheet, there are two pages, with page 1 – Consumption and page 2 – Prevalence
respectively set on the x-axis, and mortality on the y-axis. The countries are shown in
the legend and as single points in the plot. The Age and Period or Cohort settings apply
to both the tobacco statistic and mortality. Sex is chosen separately – in most cases,
you will want to choose the same setting for both. However if you have chosen salesbased consumption, you might wish to choose a particular sex for the mortality. The
other settings, including the Lagging or Averaging, apply only to the tobacco statistic.
See Example 10.
14
Note that for this Example, 16 country workbooks have been opened. This is the
maximum that can be opened in Excel 2002, but in Excel 97 the maximum is 8. See
also section 2.9, System Requirements.
Note also that, as the buttons have had to be positioned over the chart area, it is
necessary to right-click on the chart and choose Edit Chart Object before doing edits
such as Format Axis.
2.6
Using the Combination Plots sheet
This sheet allows plots to be constructed showing lines for both mortality and tobacco
statistics, with each line individually defined. The first three pages have Age, Period
and Cohort on the x-axis respectively. Both Consumption and mortality are available on
the y-axis, with the scale relevant to the tobacco statistics shown on the left, and the
scale relevant to the mortality statistics on the right. The next three pages repeat the
sequence with Prevalence and mortality.
On each plot, up to 3 tobacco lines and 3 mortality lines can be drawn. If less than the
full 6 lines are required, use Plot Settings to hide unwanted ones. See Example 11,
generated on page 5, where the third mortality line has been hidden.
Then for each line in turn, use the drop-down menus to choose:
Age (including combined age group), Period or Cohort (except for the one in use
on the x-axis)
Sex (including combined and ratio) and
Country (including country ratio).
Other options applicable to the tobacco lines are: Tobacco type, Tar adjustment (not
available for prevalence) and Lagging/averaging, and to the mortality lines: Disease.
Note that in the consumption plots, the choice between Sales and Survey based data is
made by the Sex/Sales drop-down, since sales data is not sex-specific.
Unlike other sheets, each change to the drop-down menus is not immediately
reflected in the plot. Instead, a marker is shown alongside the line in question and
over the plot. When all the line definitions are ready, click on the Update Required
button and all the changes to the plot are implemented. If you make any changes to
the drop-down menus from the Data Table part of the sheet, then you will be
transferred back to the plot in order to carry out the update.
15
In the legend, the lines are simply labelled as Mort1, Mort2 etc, but these can be
replaced by more meaningful labels by using Plot settings, then editing in the relevant
sections of column K or N.
If you require a long label split over 2 lines, as in Example 12, the format is
="US sales"&CHAR(10)&"(20 year average)"
On pages 2 and 5 with Period on the x-axis, there is also a scaling option. This applies
to all the lines, causing the data to be scaled relative to a chosen period. In this case, it
will probably be desirable to change the axis settings so that both tobacco and
mortality have the same maximum value (using Edit Chart Object, then Format Axis,
Scale as previously described). See Example 13.
Note that when two x-axis scales are in use, it is not possible to have grid lines. If all
mortality lines are hidden, the mortality scale is hidden. However if all the tobacco
lines are hidden, then the plot border, the background shading and x-axis scale get
hidden as well as the tobacco scale – this appears to be a deficiency in Excel, which
can be got round by a right-click on each line and choosing Format Data Series, Axis,
Primary Axis. Then edit the x-axis label to Mortality.
2.7
Using alternative (retrospective) tobacco data
As described in the introduction, alternative survey-based data sets are available for
10 countries. To choose an alternative data set, go to the country workbook and the
first sheet Country Details. Choose the data set from the Survey Source drop-down menu.
Then return to the LCMMAIN workbook and set up the plots as usual. Whenever the
country in question is used, either by choosing it from the Country menu, or when it
appears in a legend, the name of the data set will also be shown. See Example 14,
using UK [HALS]. Because this data set relates to 10-year birth cohorts, it is appropriate
to show only alternate cohorts.
16
2.8
Printing and saving results
As mentioned earlier, the Print Plots button prints out the current plot with its settings.
Use the normal Excel print facilities to change the printer properties.
When working on drafts for a report, a quick way of saving a sequence of plots and
their settings is to select and copy the relevant area (including one column to the right
of the plot), and then in Word, set the page to Landscape and use Paste Special, Picture
(Enhanced Metafile). Each plot will fill naturally one page. The Worked example was
generated by this method. Alternatively, Alt PrintScreen in Excel and a simple paste
in Word will give a screen image. By these methods, the settings are stored as part of
a graphic, so the format and wording cannot be edited.
For a more polished report, it will be better to type the headings directly into Word
and copy just the plot – right-click on it, Copy, then in Word use Paste Special, Picture
(Enhanced Metafile). The plot can be dragged to size either in Excel or in Word, but any
changes to the headings must be done while still in Excel. Another possibility is to
create a second copy of a plot within Excel, just using simple copy and paste, then
right-click on the new copy of the plot and choose Location, As a new sheet. This has
two purposes:
• When the settings for the plot are altered, headings will be updated only in the
original. Any customized headings you add to the second copy will not be
destroyed each time, only the data will be updated. (But you must be careful not
to leave erroneous headings)
• The size of the second copy can be controlled precisely by using Page Setup,
Margins. This will give more accurate sizing than dragging, and will avoid the
fonts becoming distorted.
A data table can be copied to a Word document or to another spreadsheet. In Word,
the table and its settings can be copied as a graphic with Paste Special, Picture
(Enhanced Metafile), in which case it will not be editable. Alternatively the table only
can be transferred to a Word table by using Paste Special, Formatted text (RTF). A table
can also be copied into another Excel spreadsheet using Paste Special, Values. Any
hidden rows or columns will also be copied.
17
2.9
System Requirements
The preferred system requirement is a 1200 MHz PC with 512 MB RAM running
Excel 2002 (which is supplied with Office XP). The system can be run with a 256
MB Ram system running Excel 97, although the performance will be slow. In
addition, there is a memory management limit in Excel, regardless of RAM size,
which limits the number of workbooks that can be opened:
Excel version Memory limit
Excel 97
Excel 2002
150 MB
300 MB
Maximum number of
country workbooks*
8
16
* in addition to LCMMAIN and RATIOC
The facility to open a larger number of workbooks makes Excel 2002 the preferred
version, particularly if working on plots with country as a factor, or on scatter plots.
Note that there is a loss of performance if many books are open, due to the large
number of background Excel calculations involved.
3.
References
1. Lee PN, Fry JS, Forey BA. Estimating age, sex and period specific constant tar
cigarette consumption in the UK [Letter]. Thorax 1993;48:679.
2. Forey BA, Lee PN, Fry JS. Updating UK estimates of age, sex and period specific
cumulative constant tar cigarette consumption per adult. Thorax 1998;53:875-8.
3. Forey B, Hamling J, Lee P, Wald N, editors. International Smoking Statistics. A
collection of historical data from 30 economically developed countries, 2nd edition.
London and Oxford: Wolfson Institute of Preventive Medicine and Oxford University
Press; 2002.
4. Darby SC, Doll R, Stratton IM. Trends in mortality from smoking-related diseases in
England and Wales. In: Wald N, Froggatt P, editors. Nicotine, smoking, and the low
tar programme, Proceedings of a symposium 'Nicotine, smoking, and the low tar
programme'. London, 18-20 November 1986. Oxford, New York, Tokyo: Oxford
University Press, 1989;70-82.
5. Alderson M. International Mortality Statistics. London: The Macmillan Press; 1981.