1
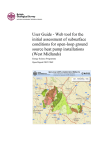
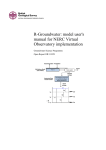
London Earth Topsoil Chemical Results: User Guide Land use planning and development Programme Open Report OR/11/035 BRITISH GEOLOGICAL SURVEY LAND USE PLANNING AND DEVELOPMENT PROGRAMME OPEN REPORT OR/11/035 London Earth Topsoil Chemical Results: User Guide C C Johnson, A Scheib & T R Lister The National Grid and other Ordnance Survey data are used with the permission of the Controller of Her Majesty’s Stationery Office. Licence No: 100017897/2010. Keywords Report; geochemical sampling, chemical analysis, London. Bibliographical reference JOHNSON, C C, SCHEIB, A, LISTER, T R. 2010. London Earth Topsoil Chemical Results: User Guide. British Geological Survey Open Report, OR/11/035. 16pp. Copyright in materials derived from the British Geological Survey’s work is owned by the Natural Environment Research Council (NERC) and/or the authority that commissioned the work. You may not copy or adapt this publication without first obtaining permission. Contact the BGS Intellectual Property Rights Section, British Geological Survey, Keyworth, e-mail [email protected]. You may quote extracts of a reasonable length without prior permission, provided a full acknowledgement is given of the source of the extract. Maps and diagrams in this book use topography based on Ordnance Survey mapping. © NERC 2011. All rights reserved Keyworth, Nottingham British Geological Survey 2011 BRITISH GEOLOGICAL SURVEY The full range of our publications is available from BGS shops at Nottingham, Edinburgh, London and Cardiff (Welsh publications only) see contact details below or shop online at www.geologyshop.com The London Information Office also maintains a reference collection of BGS publications, including maps, for consultation. We publish an annual catalogue of our maps and other publications; this catalogue is available online or from any of the BGS shops. The British Geological Survey carries out the geological survey of Great Britain and Northern Ireland (the latter as an agency service for the government of Northern Ireland), and of the surrounding continental shelf, as well as basic research projects. It also undertakes programmes of technical aid in geology in developing countries. The British Geological Survey is a component body of the Natural Environment Research Council. British Geological Survey offices BGS Central Enquiries Desk Tel 0115 936 3143 email [email protected] Fax 0115 936 3276 Kingsley Dunham Centre, Keyworth, Nottingham NG12 5GG Tel 0115 936 3241 Fax 0115 936 3488 email [email protected] Murchison House, West Mains Road, Edinburgh EH9 3LA Tel 0131 667 1000 email [email protected] Fax 0131 668 2683 Natural History Museum, Cromwell Road, London SW7 5BD Tel 020 7589 4090 Fax 020 7584 8270 Tel 020 7942 5344/45 email [email protected] Columbus House, Greenmeadow Springs, Tongwynlais, Cardiff CF15 7NE Tel 029 2052 1962 Fax 029 2052 1963 Maclean Building, Crowmarsh Gifford, Wallingford OX10 8BB Tel 01491 838800 Fax 01491 692345 Geological Survey of Northern Ireland, Colby House, Stranmillis Court, Belfast BT9 5BF Tel 028 9038 8462 Fax 028 9038 8461 www.bgs.ac.uk/gsni/ Parent Body Natural Environment Research Council, Polaris House, North Star Avenue, Swindon SN2 1EU Tel 01793 411500 Fax 01793 411501 www.nerc.ac.uk Website www.bgs.ac.uk Shop online at www.geologyshop.com OR/11/035; Final 1.0 Last modified: 2011/05/27 08:23 Foreword This report presents a description of the BGS London Earth Topsoil Chemical survey. The purpose of this user guide is to enable those licensing this dataset to have a better appreciation of how the data set has been created and therefore better understand the potential applications and limitations that the dataset may have. Acknowledgements A number of individuals in the Land Use Planning and Development Programmes have contributed to the project and helped compile this report. This assistance has been received at all stages of the study. In addition to the collection and processing of data, many individuals have freely given their advice, and provided local knowledge. Contents Foreword ......................................................................................................................................... i Acknowledgements ......................................................................................................................... i Contents........................................................................................................................................... i Summary ......................................................................................................................................... i 1 Introduction ............................................................................................................................ 2 2 About the London Earth Dataset.......................................................................................... 2 2.1 Sample collection ........................................................................................................... 3 2.2 Sample preparation and analysis .................................................................................... 4 2.3 Results ............................................................................................................................ 4 2.4 Units of Concentration.................................................................................................... 5 2.5 Fields in the results database .......................................................................................... 5 2.6 Data Conditioning........................................................................................................... 6 3 Licensing Information ......................................................................................................... 11 Further Information ................................................................................................................... 12 Summary This report describes the London Earth Dataset, specifically the file: LondonEarth_Topsoil_XRFS_v1.xlsx. It describes how the sample data were collected, prepared and analysed, describes the format of the results, and details how the data was conditioned before delivery. i OR/11/035; Final 1.0 Last modified: 2011/05/27 08:23 1 Introduction Founded in 1835, the British Geological Survey (BGS) is the world's oldest national geological survey and the United Kingdom's premier centre for earth science information and expertise. The BGS provides expert services and impartial advice in all areas of geoscience. Our client base is drawn from the public and private sectors both in the UK and internationally. Our innovative digital data products aim to help describe the ground surface and what's beneath across the whole of Great Britain. These digital products are based on the outputs of the BGS survey and research programmes and our substantial national data holdings. This data coupled with our in-house Geoscientific knowledge are combined to provide products relevant to a wide range of users in central and local government, insurance and housing industry, engineering and environmental business, and the British public. Further information on all the digital data provided by the BGS can be found on our website at http://www.bgs.ac.uk/products or by contacting: Central Enquiries British Geological Survey Kingsley Dunham Centre Keyworth Nottingham NG12 5GG Direct tel. +44(0)115 936 3143 Fax. +44(0)115 9363150 email [email protected] 2 About the London Earth Dataset Data Described: LondonEarth_Topsoil_XRFS_v1.xlsx created 18th May 2011 This guide describes and explains the London Earth topsoil chemical results. The London Earth project is part of a nationwide project to determine the distribution of chemical elements in the surface environment, namely the Geochemical Baseline Survey of the Environment (G-BASE). London Earth focuses on the soil of the capital city, the limits of the survey being defined by the Greater London Authority (GLA) administrative boundary (Figure 1). Chemical elements have been determined by X-ray fluorescence spectrometry (XRFS) at the laboratories of the British Geological Survey (BGS) in Keyworth, Nottingham. These results are presented as a MS Excel file. 2 OR/11/035; Final 1.0 Last modified: 2011/05/27 08:23 Figure 1: A plot of the London Earth topsoil sites in file LondonEarth_Topsoil_XRFS_v1.xlsx within a polygon of the GLA 2.1 SAMPLE COLLECTION Soil samples were collected at a density of four samples from every square kilometre. Each sample is a composite of five subsamples collected at the corners and centre of a 20 m square. The soil was collected using a 1-m stainless steel hand-held soil auger and stored in Kraft paper bags. The topsoil was collected from a standard depth in the soil profile, 5 – 20 cm. A surface soil (0 – 2 cm) and deep soil (35 – 50 cm) were also collected but these samples are not routinely analysed. The surface and deep soils are archived at the National Geoscience Data Centre (NGDC) in Keyworth along with the excess topsoil samples. At each site samplers recorded comprehensive information about the sample and location, including information such as soil texture, land use and observed contamination. This field information is available as the field database and can be made available on request to those who have a licence to use the results. British National Grid coordinates were determined at site using a GPS and recorded to the nearest metre though in reality the spatial error is estimated at ±50 m. Symbol Element/Oxid e Units LLD* Symbol Element/Oxid e Units LLD * Ag silver mg/kg 0.5 Nb niobium mg/kg 1.0 Al2O3 aluminium wt% 0.2 Nd neodymium mg/kg 4.0 As arsenic mg/kg 2.4 Ni nickel mg/kg 1.3 Ba barium mg/kg 1.0 P2O5 phosphorous wt% 0.05 Bi bismuth mg/kg 0.3 Pb lead mg/kg 1.3 Br bromine mg/kg 0.8 Rb rubidium mg/kg 1.0 CaO calcium wt% 0.05 S sulphur Cd cadmium mg/kg 0.5 Sb antimony mg/kg 0.5 Ce cerium mg/kg 1.0 Sc scandium mg/kg 3.0 Co cobalt mg/kg 1.5 Se selenium mg/kg 0.2 3 mg/kg 1000 OR/11/035; Final 1.0 Last modified: 2011/05/27 08:23 Cr chromium mg/kg 3.0 SiO2 silicon wt% 0.1 Cs caesium mg/kg 1.0 Sm samarium mg/kg 3.0 Cu copper mg/kg 1.3 Sn tin mg/kg 0.5 Fe2O3 iron wt% 0.01 Sr strontium mg/kg 1.0 Ga gallium mg/kg 1.0 Ta tantalum mg/kg 1.0 Ge germanium mg/kg 0.5 Th thorium mg/kg 0.7 Hf hafnium mg/kg 1.0 TiO2 titanium wt% 0.01 Hg mercury mg/kg 0.5 Tl thallium mg/kg 0.5 I iodine mg/kg 0.5 U uranium mg/kg 0.5 K2O potassium wt% 0.01 V vanadium mg/kg 3.0 La lanthanum mg/kg 1.0 W tungsten mg/kg 0.6 MgO magnesium wt% 0.03 Y yttrium mg/kg 1.0 MnO manganese wt% 0.005 Yb ytterbium mg/kg 1.5 Mo molybdenum mg/kg 0.2 Zn zinc mg/kg 1.3 Na2O sodium wt% 0.3 Zr zirconium mg/kg 1.0 *LLD = lower limit of detection Table 1: List of elements reported for the London Earth topsoils following determination by XRFS 2.2 SAMPLE PREPARATION AND ANALYSIS Samples were prepared at the BGS laboratories. After drying (~35°) the samples were sieved through a nylon sieve to give a < 2 mm fraction. A 50 g subsample of this fraction was pulverised in an agate ball mill to create a homogeneous sample used to make a pressed powder pellet prior to XRFS analysis. Samples were analysed by XRFS which gives total element concentrations in the soil samples. Several different XRFS instruments were used (wave dispersive and energy dispersive) to determine 53 chemical elements. Fifty of these elements are listed in Table 1, three elements, chlorine (Cl), indium (In) and tellurium (Te) are excluded from the released data set as the majority (>95wt%) of the results for these elements are below the lower limit of detection. Loss on ignition (LOI) (an indicator of the soil’s organic content) and pH has also been determined and this is available as a separate MS Excel spreadsheet LondonEarth_Topsoil_pHLOI_v1 in which there are 6,467 sample results. The loss on ignition is determined by weighting samples before and after heating the soil sample at 450ºC for 24 hrs. The soil pH is determined using a pH meter on a slurry of the sample made using 0.01 M CaCl2. 2.3 RESULTS When the results are received from the laboratory they undergo a series of data conditioning processes to check the quality of the data and to level the results so the will fit seamlessly with other UK soil chemical results when plotted as maps. This data conditioning is described below and uses control samples submitted with the analytical batches and are seen as normal samples by the analyst. Once the data has been conditioning it is loaded to the BGS Oracle Geochemical Database, a repository for all the BGS UK landmass surface chemical results. In the Geochemistry Database every element result is qualified with a qualifier code that identifies any data quality issues relating to that result. Most results have no qualifier code 4 OR/11/035; Final 1.0 Last modified: 2011/05/27 08:23 indicating there are no data quality issues. Results with qualifiers are those generally with results that are below the element’s detection limit. Qualified data is indicated in the Excel file by colour highlights and fonts as shown in Table 2. Colour/ format Signifies User Action 56.7 No Quality issues None 25.4 This result is associated with a qualifier Be aware that the result is qualified Data of dubious quality with significant Pay careful attention to what the quality issue(s) issue is and if necessary don't use results Results <= 0 Be aware that the result could give problems in some statistical or plotting packages <null> value Be aware that no result is present though transferring to some software packages could erroneously reset this to 0 25 Result is at the upper limit of detection 10 Generally a data issue relating to representation of results below limits of 5.0 detection 0.6 Be aware that this result has some quality issue but is unlikely to restrict its use Table 2: Explanation of the colour formatting in the Excel spreadsheet “Results” used to indicate data quality issues 2.4 UNITS OF CONCENTRATION The units of concentration for elements are shown in Table 1. For trace elements these are mg/kg (i.e mg kg-1) and for the major elements these are wt%, i.e. expressed as a percentage weight of the sample. Geochemists also use the old notation of ppm (parts per million which is equivalent to 1 mg/kg) and express the major elements in terms of oxides (e.g. CaO, Na2O, Fe2O3 etc.). 2.5 FIELDS IN THE RESULTS DATABASE The “Results” spreadsheet contains five columns before the element results for the elements in the next 50 columns. The first row of data gives the column names. Descriptive statistics for all the fields are given in Table 3. Column A – Project_Code : Two character code to identify the project collecting the samples. For London Earth two codes are used, namely 64 and 65. The 64 code represents samples collected before the start of the main London Earth project in 2008. Column B – Site_Number : An integer number between 1 and 9999 giving the number assigned to the soil sampling site. A combination of the Project_Code and the Site_Number to give a six character number (e.g. 641304, 650001) provides a unique id for the sample and is a key field. Column C – Date : Date the site was sampled in standard date format (dd/mm/yyyy). Column D – Easting : British National Grid Easting (x) co-ordinate in metres. Column E – Northing : British National Grid Northing (y) co-ordinate in metres. Columns F – BC : Fifty columns of element results with column header as chemical symbol which for the major elements is expressed as an oxide. 5 OR/11/035; Final 1.0 2.6 Last modified: 2011/05/27 08:23 DATA CONDITIONING The results received from the laboratory contain control samples (replicates, duplicates and reference materials) which are used to assess the quality of the results. These control samples are removed from the data set and are not included in the results provided in the Excel data file which this user guide describes. A summary of primary reference materials analysed along with London Earth soil samples is given in Table 4. These are certified reference materials (CRM) for which there is an accepted set of results and can be used to assess the accuracy of the element results. Table 4 shows tabulated certified values versus data values reported by the BGS XRF laboratory for four accredited reference materials (GSD-7, GSS-1, LKSD-1, LKSD-4). Certified data values are indicated in red and represent a mean value derived from approximately 20 analyses of each material. The precision of the results is demonstrated by repeatedly analysing a secondary reference material and an example is given in Figure 2. 6 OR/11/035; Final 1.0 Field Project_Code Site_Number Date Easting Northing Ag Cd Sn Sb I Cs Ba La Ce K2O CaO TiO2 MnO Fe2O3 S Sc V Cr Co Ni Cu Zn Ga Ge As Se Br Rb Sr Y Zr Nb Mo Nd Sm Yb Hf Ta W Hg Tl Pb Bi Th U Na2O MgO Al2O3 SiO2 P2O5 Last modified: 2011/05/27 08:23 Mean 1.053 0.987 25.07 5.232 3.686 3.047 402.6 25.2 50.9 1.396 2.229 0.586 0.063 3.986 1017 8.261 82.9 77.98 12.24 27.99 72.4 221.3 11.06 1.93 17.08 0.667 13.04 59.3 83.71 21.11 288.7 12.88 2.048 22.28 3.558 1.882 7.461 0.213 2.39 0.163 0.306 295.6 0.637 6.867 1.679 0.423 0.856 7.987 65.52 0.364 Median 0.5 0.6 13.9 3 3 3 379.5 24 49 1.31 1.31 0.558 0.055 3.83 960 7.9 76.4 72 11.5 25.4 46.1 154.5 10.5 1.5 15.4 0.6 12 55.7 75.6 20.4 276.9 12.5 1.5 21.4 3.4 1.8 7.2 0.2 2 0 0.2 180.1 0.2 6.6 1.7 0.4 0.8 7.5 65.9 0.32 Std. Dev. Range 4.809181 3.218913 43.43841 12.8729 3.008918 1.311103 147.9445 8.75202 12.88859 0.444684 3.432534 0.150692 0.042119 1.229329 377.93 3.22153 28.56777 48.29469 5.257148 15.80002 142.6825 292.2913 2.791615 1.670454 8.637098 0.604414 5.815867 19.04873 40.54883 7.62795 85.11562 3.020127 8.874716 8.727336 2.044726 0.896897 2.30664 0.595945 6.203868 1.369056 0.640149 430.4443 2.789603 5.896254 0.875289 0.127707 0.42341 2.757696 10.38328 0.226831 Minimum 1 6798 58095 45095 200.8 165.2 1040.6 434.5 64.7 10 3331.6 127 220 3.21 52.55 1.004 0.695 15.22 9925 38.1 286.6 2079.6 84.4 503.3 5322.3 10095 26.6 29.9 159.7 19.7 117.5 139.7 588.9 128.1 1411.1 141.4 561.2 123.4 28.5 10.3 36 11 317.3 37.8 28.1 9989.2 73 456.6 11.6 1.4 3.9 20 95.4 4.45 Maximum 64 1 02/08/2005 503724 155662 0.1 0 0.9 0.1 0.1 1 143.5 3 18 0.12 0.22 0.175 0.002 0.15 75 -4.8 15.7 14.7 0.8 2.3 3.2 0 1 -0.5 1.2 -0.1 1.5 8.9 12.3 4.8 35.3 5.3 0 -0.6 -2.7 -1.5 1.1 -1.5 -0.5 -4 -1.9 10.8 -2.5 -0.1 -5.2 0.2 0.1 0.8 4.6 0.04 Number 65 6799 13/11/2009 561819 200757 200.9 165.2 1041.5 434.6 64.8 11 3475.1 130 238 3.33 52.77 1.179 0.697 15.37 10000 33.3 302.3 2094.3 85.2 505.6 5325.5 10095 27.6 29.4 160.9 19.6 119 148.6 601.2 132.9 1446.4 146.7 561.2 122.8 25.8 8.8 37.1 9.5 316.8 33.8 26.2 10000 70.5 456.5 6.4 1.6 4 20.8 100 4.49 6487 6487 6483 6487 6487 6467 6467 6467 6467 6467 6467 6467 6467 6467 6467 6467 6467 6467 6467 6467 6467 6467 6467 6467 6467 6467 6467 6467 6467 6467 6467 6467 6467 6467 6467 6467 6467 6467 6467 6467 6467 6467 6467 6467 5964 6467 6467 6467 6467 6467 6467 6467 6467 6467 6467 Table 3: Summary statistics of London Earth topsoil results CRM ID Ag Cert Ag Cd Cert Cd In Cert In Sn Cert Sn Sb Cert Sb GSD-7 1.4 1.1 0.9 1.1 not detected no data 4.8 5.4 2.8 2.6 7 OR/11/035; Final 1.0 Last modified: 2011/05/27 08:23 GSS-1 0.4 0.4 4.4 4.3 not detected no data 5.9 6.1 1.0 0.9 LKSD-1 0.5 0.6 1.1 1.2 0.5 no data 15.2 16.0 0.9 1.2 LKSD-4 0.1 0.2 1.9 1.9 not detected no data 4.6 5.0 1.3 1.7 CRM ID I Cert I Cs Cert Cs Ba Cert Ba La Cert La Ce Cert Ce GSD-7 0.9 no data 5 6 740 720 45 45 82 78.0 GSS-1 1.9 1.9 9 9 587 590 34 34 68 70.0 LKSD-1 1.7 no data 1 2 396 430 14 16 25 27.0 LKSD-4 9.5 no data 2 2 262 330 21 26 38 48.0 (Table 4.1 Elements by XRF-ED) CRM ID K2O Cert K2O CaO Cert CaO TiO2 Cert TiO2 MnO Cert MnO Fe2O3 Cert Fe2O3 GSD-7 3.64 3.54 1.65 1.67 0.707 0.747 0.093 0.089 6.50 6.51 GSS-1 2.53 2.59 1.75 1.72 0.766 0.805 0.238 0.227 5.18 5.19 LKSD-1 1.06 1.10 12.14 10.80 0.448 0.500 0.093 0.100 4.03 4.10 LKSD-4 0.76 0.80 1.85 1.80 0.299 0.400 0.068 0.100 4.20 4.10 CRM ID S Cert S Cl Cert Cl Sc Cert Sc V Cert V Cr Cert Cr GSD-7 646 190 83 no data 13.7 14.6 93.4 96.0 119.3 122.0 GSS-1 847 310 114 78 10.4 11.2 80.7 86.0 60.0 62.0 LKSD-1 9306 1570 430 no data 6.5 9.0 47.8 50.0 27.0 31.0 LKSD-4 5952 999 215 no data 7.1 7.0 45.5 49.0 30.1 33.0 CRM ID Co Cert Co Ni Cert Ni Cu Cert Cu Zn Cert Zn Ga Cert Ga GSD-7 20.6 21.0 55.6 53.0 36.1 38.0 246.2 238.0 16.7 17.7 GSS-1 13.9 14.2 20.7 20.4 19.7 21.0 671.6 680.0 17.6 19.3 LKSD-1 11.0 11.0 16.0 16.0 40.6 44.0 322.4 331.0 9.0 no data LKSD-4 11.7 11.0 34.1 31.0 30.1 31.0 194.3 194.0 7.9 no data CRM ID Ge Cert Ge As Cert As Se Cert Se Br Cert Br Rb Cert Rb GSD-7 0.9 1.4 83.7 84.0 0.2 0.3 0.6 no data 146.4 147.0 GSS-1 0.6 1.3 35.8 33.5 0.1 0.1 2.5 2.9 137.9 140.0 LKSD-1 0.1 no data 34.9 40.0 1.0 no data 10.3 11.0 22.7 24.0 LKSD-4 0.5 no data 16.6 16.0 2.3 no data 50.6 49.0 25.0 28.0 CRM ID Sr Cert Sr Y Cert Y Zr Cert Zr Nb Cert Nb Mo Cert Mo GSD-7 222.4 220.0 24.9 24.0 156.9 162.0 15.1 17.0 1.3 1.4 GSS-1 156.6 155.0 24.9 25.0 250.1 245.0 14.7 16.6 1.1 1.4 LKSD-1 259.4 250.0 20.9 19.0 132.8 134.0 4.0 7.0 9.4 10.0 LKSD-4 121.0 110.0 22.2 23.0 101.3 105.0 4.3 9.0 1.3 <5 CRM ID Nd Cert Nd Sm Cert Sm Yb Cert Yb Hf Cert Hf Ta Cert Ta GSD-7 34.1 37.0 4.4 6.1 2.2 2.6 5.0 4.9 0.8 1.4 GSS-1 26.3 28.0 3.9 5.2 2.1 2.7 7.7 6.8 0.5 1.4 LKSD-1 19.4 16.0 2.9 4.0 1.7 2.0 4.1 3.6 -0.2 0.3 LKSD-4 27.1 25.0 4.3 5.0 2.1 2.0 3.1 2.8 -0.1 0.4 CRM ID W Cert W Hg Cert Hg Tl Cert Tl Pb Cert Pb Bi Cert Bi GSD-7 6.5 5.5 -0.3 0.1 0.7 0.9 361.1 350.0 0.6 0.7 GSS-1 4.6 3.1 -0.8 0.0 0.7 1.0 98.2 98.0 0.7 1.2 8 OR/11/035; Final 1.0 Last modified: 2011/05/27 08:23 LKSD-1 1.7 <4 -0.6 0.0 0.1 no data 83.7 82.0 0.6 no data LKSD-4 1.8 <4 -0.5 no data 0.8 no data 97.3 91.0 0.0 no data CRM ID Th Cert Th U Cert U GSD-7 12.6 12.6 3.4 3.5 GSS-1 11.4 11.6 3.7 3.3 LKSD-1 2.1 2.2 9.7 9.7 LKSD-4 5.1 5.1 31.4 31 (Table 4.2 Elements by XRF-WDT) CRM ID Na2O Cert Na2O MgO Cert MgO Al2O3 Cert Al2O3 SiO2 Cert SiO2 P2O5 Cert P2O5 GSD-7 1.2 1.2 4.3 3.1 14.6 13.4 67.3 64.7 0.21 0.19 GSS-1 1.4 1.7 2.1 1.8 14.1 14.2 57.4 62.6 0.18 0.17 LKSD-1 1.6 2.0 1.8 1.7 5.6 7.8 31.5 40.1 0.16 0.20 LKSD-4 0.5 0.7 1.0 0.9 5.2 5.9 45.2 41.6 0.36 0.30 CRM ID SO3 Cert SO3 GSD-7 not detected no data GSS-1 0.1 0.08 LKSD-1 2.6 no data LKSD-4 2.1 no data (Table4.3 Elements by XRF-WDM) Table 4: Summary of primary reference material results for London Earth soil samples XRFS analyses. S13B Chart of Ni UCL=48.002 48 Individual Value 47 46 _ X=45.657 45 44 LCL=43.311 43 1 3 5 7 9 11 13 15 Observation 17 19 21 23 Figure 2: Example of a time-series plot (Shewhart plot) used to indicate the precision and accuracy of elemental analyses between different analytical batches. This chart shows repeated analyses for Ni in reference soil S13B. Green line shows accepted value (x), red lines x ± 2 std. dev. Duplicate samples (i.e. separate samples that have been collected from the same sampling site) and replicate samples (i.e. a sample split into two samples in the laboratory) can be used to indicate within-site and within-sample variability, respectively. Using a statistical technique called nested ANOVA (Analysis of Variance) the duplicates can be used to give an estimate of the between site variability for each element. A variability that represents > 80wt% of between 9 OR/11/035; Final 1.0 Last modified: 2011/05/27 08:23 site total variance shows that the sampling and analytical methodology are satisfactory, though ANOVA analysis is not valid when a large number of samples have element concentrations that are near or below detection. If there is a high percentage of variance within site then the results suggest that the element concerned shows a high variability in the soil over short distances. A high within sample variance indicates a high degree of uncertainty in the analytical determination for the element concerned. Results for the ANOVA analysis of the London Earth soil duplicates and replicates are given in Table 5. This shows the poor “between site” variance for Yb, Hg, Sm, Tl and Ta suggesting that any interpretation of these elements should be done with caution. Element Between Site wt% Between Sample wt% Within Sample wt% Number of sites Nb 93.95 5.27 0.78 150 TiO2 93.76 5.95 0.29 K 2O 92.59 7.11 Rb 92.39 La Element Between Site wt% Between Sample wt% Within Sample wt% Number of sites S 82.38 14.41 3.21 150 150 Mo 81.20 14.81 3.98 150 0.30 150 Co 80.94 12.00 7.06 150 7.27 0.34 150 Cs 80.86 5.95 13.18 149 91.47 6.89 1.64 149 MnO 80.74 17.66 1.60 150 Y 91.14 7.31 1.55 150 Ni 80.60 18.73 0.67 150 Al2O3 90.46 9.08 0.46 149 Ba 80.01 19.09 0.90 149 V 89.84 9.51 0.64 150 Cr 79.98 18.70 1.32 150 Zr 89.63 9.86 0.51 150 Cu 78.42 19.69 1.89 150 Ce 89.41 9.23 1.36 149 Zn 76.53 22.74 0.73 150 MgO 89.39 9.66 0.95 146 Sc 75.95 9.52 14.53 150 Fe2O3 88.97 10.60 0.43 150 Sb 74.50 16.73 8.77 148 Th 88.68 7.20 4.12 150 Sn 71.96 20.18 7.86 149 Ga 88.20 8.98 2.82 150 U 71.41 5.86 22.73 150 CaO 87.78 11.37 0.86 150 W 69.38 10.72 19.90 150 Sr 87.47 11.71 0.82 150 Se 67.60 13.91 18.48 150 Nd 87.26 6.80 5.94 150 Cd 62.19 26.27 11.54 95 Br 86.72 12.10 1.18 150 Ge 61.99 20.95 17.07 150 Hf 86.29 7.78 5.93 150 Ag 58.23 32.13 9.64 27 Na2O 86.23 11.84 1.93 102 Bi 54.49 25.61 19.90 150 I 85.75 9.78 4.48 149 Yb 30.10 -1.83 71.73 150 Pb 84.74 11.64 3.62 150 Hg 29.68 55.22 15.09 150 SiO2 84.37 14.00 1.64 149 Sm 24.31 1.42 74.27 150 As 83.51 14.43 2.06 150 Tl 14.62 -8.82 94.20 150 P2O5 82.77 16.69 0.54 149 Ta 9.80 8.99 81.22 150 Table 5: A table showing the nested ANOVA results for the London Earth soil duplicate and replicate sets. The number of sites indicates the number of locations where duplicate and replicate samples were collected. Those sites where element results were below detection are excluded from the ANOVA analysis. 10 OR/11/035; Final 1.0 Last modified: 2011/05/27 08:23 3 Licensing Information The British Geological Survey does not sell its digital mapping data to external parties. Instead, BGS grants external parties a licence to use this data, subject to certain standard terms and conditions. In general, a licence fee will be payable based on the type of data, the number of users, and the duration (years) of a licence. All recipients of a licence (potential licensees) are required to return a signed digital data licence document to us before authorisation for release of BGS digital data is given. In general terms, a BGS digital data licensee will be permitted to: make internal use of the dataset(s) allow a specified number of internal users to access/use the data (the number of users will be agreed with the licensee and specified in the licence document) for the purposes of their day-to-day internal activities reproduce extracts from the data up to A3 for use in external analogue (paper/hard copy) or non-queryable electronic (e.g. secured .pdf) format: to meet a public task duty; fulfil a statutory requirement; and/or as part of academic or other noncommercial research But will not be permitted to: provide a bureau service for others or incorporate the data in the generation of products or services for commercial purposes sell, assign, sublicense, rent, lend or otherwise transfer (any part of) the dataset(s) or the licence place (any part of) the dataset(s) on the Internet The BGS is committed to ensuring that all the digital data it holds which is released to external parties under licence has been through a robust internal approval process, to ensure that geoscientific standards and corporate quality assurance standards are maintained. This approval process is intended to ensure that all data released: (i) is quality assured; (ii) meets agreed BGS data management standards; (iii) is not in breach of any 3rd party intellectual property rights, or other contractual issues (such as confidentiality issues), that would mean that release of the data is not appropriate. When the BGS digital datasets are revised any upgrades will be automatically supplied to the licensee, at no additional cost. Geological map datasets are revised on a periodic rather than on an annual basis, licensees will therefore not automatically receive a new dataset each year unless changes have been made to the data. These are general comments for guidance only. A licensee of BGS's digital data is provided with full details of the basis on which individual BGS datasets licensed to them are supplied. If you have any doubts about whether your proposed use of the BGS data will be covered by a BGS digital licence, the BGS Intellectual Property Rights (IPR) section will be happy to discuss this with you and can be contacted through the following email address: [email protected]. BGS IPR will usually be able to provide reassurance that the licence will cover individual user requirements and/or to include additional 'special conditions' in the licence documentation, addressing specific requirements within BGS's permitted usage. 11 OR/11/035; Final 1.0 Last modified: 2011/05/27 08:23 Further Information British Geological Survey holds most of the references listed below, and copies may be obtained via the library service subject to copyright legislation (contact [email protected] for details). The library catalogue is available at: http://geolib.bgs.ac.uk. London Earth Project: G-BASE web site – www.gs.ac.uk/gbase/londonearth G-BASE urban soil chemistry data: APPLETON, J.D. 2011. User Guide for British Geological Survey Urban Soil Chemistry dataset. British Geological Survey. 24pp. (IR/11/039). (unpublished). Field sampling manual: JOHNSON, C.C. 2005. 2005 G-BASE field procedures manual. British Geological Survey, 65pp. (IR/05/097) (Unpublished). Data conditioning procedures: LISTER, T.R. AND JOHNSON, C.C. 2005. G-BASE data conditioning procedures for stream sediment and soil chemical analyses. British Geological Survey, 85pp. (IR/05/150) (Unpublished). JOHNSON, C.C. 2011. Understanding the quality of chemical data from the urban environment – Part 1: Quality Control Procedures. In: Johnson, Christopher; Demetriades, Alecos; Locutura, J.; Ottesen, Rolf Tore, (eds.) Mapping the chemical environment of urban areas. John Wiley & Sons, Chapter 5, 61-76. JOHNSON, C.C., ANDER, E.L., LISTER, T.R. AND FLIGHT, D.M.A. 2008. Data conditioning of environmental geochemical data : quality control procedures used in the British Geological Survey's regional geochemical mapping project. In: de Vivo, B.; Belkin, H.E.; Lima, A., (eds.) Environmental geochemistry : site characterization, data analysis and case histories. Amsterdam ; London, Elsevier, 93-118. G-BASE Project: G-BASE web site – http://www.gs.ac.uk/gbase/ JOHNSON, C.C., BREWARD, N., ANDER, E.L. AND AULT, L. 2005. G-BASE: Baseline geochemical mapping of Great Britain and Northern Ireland. Geochemistry : exploration, environment, analysis, 5 (4). 347-357. 10.1144/1467-7873/05-070 G-BASE Urban Geochemical Mapping: FLIGHT, D.M.A. AND SCHEIB, A.J. 2011. Soil geochemical baselines in UK urban centres: The G-BASE Project. In: Johnson, Christopher; Demetriades, Alecos; Locutura, J.; Ottesen, Rolf Tore, (eds.) Mapping the chemical environment of urban areas. John Wiley & Sons, Chapter 13, 186-206. FORDYCE, F.M., BROWN, S.E., ANDER, E.L., RAWLINS, B.G., O'DONNELL, K.E., LISTER, T.R., BREWARD, N. AND JOHNSON, C.C. 2005. GSUE: urban geochemical mapping in Great Britain. Geochemistry: Exploration, Environment, Analysis, 5 (4). 325-336. 10.1144/1467-7873/05-069 JOHNSON, C.C. AND ANDER, E.L. 2008. Urban geochemical mapping studies : how and why we do them. Environmental Geochemistry and Health, 30 (6). 511-530. 10.1007/s10653-008-9189-2 12