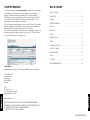
1
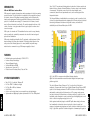
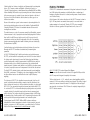
TC SUPPORT INTERACTIVE
The TC Support Interactive website www.tcsupport.tc is designed as an online support
and information center. At the site you can find answers to specific questions
regarding TC software and hardware. All known issues are stored in a database
searchable by product, category, keywords, or phrases. Under the section "My Stuff"
you can login to check the status of your questions, download materials such as
product manuals, software updates and new presets.
This site has been specifically designed to meet the needs of our users. We constantly
update the database and you will find the site to be a huge resource of information.
Browse through Q&A's and discover new aspects of your TC product.
If you can't find an answer online, you have the option of submitting a question to our
technical support staff who will then reply to you by e-mail. The TC Support Team is
on constant alert to help you in any way they can.
TABLE OF CONTENTS
TABLE OF CONTENTS . . . . . . . . . . . . . . . . . . . . . . . . . . . . . . . . . . . . . . . . . . . . . .1
INTRODUCTION . . . . . . . . . . . . . . . . . . . . . . . . . . . . . . . . . . . . . . . . . . . . . . . . . .2
FEATURES
. . . . . . . . . . . . . . . . . . . . . . . . . . . . . . . . . . . . . . . . . . . . . . . . . .2
SYSTEM REQUIREMENTS . . . . . . . . . . . . . . . . . . . . . . . . . . . . . . . . . . . . . . . . . . .2
BASIC USE
. . . . . . . . . . . . . . . . . . . . . . . . . . . . . . . . . . . . . . . . . . . . . . . . . .5
RADAR PAGE
. . . . . . . . . . . . . . . . . . . . . . . . . . . . . . . . . . . . . . . . . . . . . . . . . .6
PPM PAGE
. . . . . . . . . . . . . . . . . . . . . . . . . . . . . . . . . . . . . . . . . . . . . . . . .10
PREFERENCE PAGE . . . . . . . . . . . . . . . . . . . . . . . . . . . . . . . . . . . . . . . . . . . . . . .12
PRESETS
. . . . . . . . . . . . . . . . . . . . . . . . . . . . . . . . . . . . . . . . . . . . . . . . .14
LEVEL VERSUS LOUDNESS . . . . . . . . . . . . . . . . . . . . . . . . . . . . . . . . . . . . . . . . .15
ITU-R BS.1770 PRIMER . . . . . . . . . . . . . . . . . . . . . . . . . . . . . . . . . . . . . . . . . . .17
METER CALIBRATION . . . . . . . . . . . . . . . . . . . . . . . . . . . . . . . . . . . . . . . . . . . . .19
DISPLAY
. . . . . . . . . . . . . . . . . . . . . . . . . . . . . . . . . . . . . . . . . . . . . . . . .19
POST SCRIPT
. . . . . . . . . . . . . . . . . . . . . . . . . . . . . . . . . . . . . . . . . . . . . . . . .20
PRESET MANAGEMENT NOTE . . . . . . . . . . . . . . . . . . . . . . . . . . . . . . . . . . . . . . .20
Contact Details
Alternatively, you may contact the TC Electronic distributor in your area, or write to:
TC ELECTRONIC A/S
Customer Support
Sindalsvej 34
Risskov DK-8240
Denmark
ENGLISH
ENGLISH
USA:
TC Electronic, Inc.
5706 Corsa Avenue, Suite 107
Westlake Village, CA 91362
www.tcelectronic.com
© BY TC ELECTRONIC A/S 2008. ALL PRODUCT AND COMPANY NAMES ARE
TRADEMARKS OF THEIR RESPECTIVE OWNERS. ALL SPECIFICATIONS SUBJECT
TO CHANGE WITHOUT NOTICE.ALL RIGHTS RESERVED.
TC ELECTRONIC IS A TC GROUP COMPANY.
LM5 & LM5D -TDM / 1
INTRODUCTION
LM5 and LM5D Radar Loudness Meter
LM5 represents a quantum leap away from simply measuring audio level to measuring
perceived loudness. The old level method is responsible for unacceptable level jumps
in television, for music CDs getting increasingly distorted, and for different audio
formats and program genres becoming incompatible: Pristine music tracks from the
past don’t co-exist with new recordings, TV commercials don’t fit drama, classical
music or film and broadcast doesn’t match. The most fundamental audio issue of all –
control of loudness – every day makes millions of people adjust the volume control
over and over again.
Since 1998, TC has performed listening tests and evaluation of loudness models; and
therefore holds an extensive, Universal Database of loudness, based on ten thousands
of assessments. The database covers all sorts of broadcast material, music,
commercials, feature film and experimental sounds, and is verified against other
independent studies.
The Universal Database is authoritative from an academic as well as a practical point
of view. It has been indispensable when designing the LM5 meter, because it provided
the missing link between short-term and long-term loudness, and enabled the
statistically founded Universal Descriptors of LM5D.
LM5 is part of a universal and ITU standardized loudness control concept, whereby
audio may easily and consistently be measured and controlled at various stages of
production and distribution.
LM5 works coherently together with other TC equipment, or with equipment of other
brands adhering to the same global standard. Follow the guidelines given to allow
audio produced for different purposes to be mixed, without low dynamic range
material such as commercials or pop CD’s always emerging the loudest.
FEATURES
Realtime loudness meter adhering to ITU-R BS.1770.
Loudness History Radar display.
True-peak Bargraph display.
Universal Descriptors (LM5D)
Supports mono, stereo and 5.1.
Presets for use in Broadcast, Music, Post and Film.
SYSTEM REQUIREMENTS
Mac OS X (10.4 or higher) / Windows XP
Pro Tools TDM 7.2 software (or higher)
Pro Tools HD or HD Accel hardware
iLok USB key
iLok.com account and internet access required for product authorization
System must meet Digidesign’s system requirements for Pro Tools TDM systems!
ENGLISH
•
•
•
•
•
•
Fig 1. Left: DRT for consumers under different listening situations
Right: Peak level normalization means that material targeted low dynamic range
platforms gets loud.
The chart of Dynamic Range Tolerance in Fig 1 is a side-effect of the studies
mentioned: Consumers were found to have a distinct Dynamic Range Tolerance (DRT)
specific to their listening environment. The DRT is defined as a Preferred Average
window with a certain peak level Headroom above it. The average sound pressure
level, which obviously is different from one listening condition to another, has to be
kept within certain boundaries in order to maintain speech intelligibility, and to avoid
music or effects from getting annoyingly loud or soft.
Audio engineers instinctively target a certain DRT profile when mixing, but because
level normalization in broadcast and music production is based on peak level
measures, low dynamic range signatures end up the loudest as shown by the red line
in Fig 1, right. Audio production is therefore trapped in a downwards spiral, going for
2 / LM5 & LM5D -TDM
LM5 & LM5D -TDM / 3
ENGLISH
•
•
•
•
•
•
ever decreasing dynamic range. By now, the pop music industry is “right of” In Flight
Entertainment in the illustration.
BASIC USE
LM5 offers a standardized option: The visualization of loudness history and DRT in
combination with long-term descriptors from production onwards, is a transparent and
well sounding alternative to our current peak level obsession. Not only for music, but
also in production for broadcast or film. The engineer, who may not be an audio
expert, should be able to identify and consciously work with loudness developments
within the limits of a target distribution platform, and with predictable results when
the program is transcoded to another platform.
Press the “Radar” key to bring up the Radar page. This page will probably be used
most of the time. The basic functionality of the Radar page is shown in Fig 3.
LM5 makes use of a unique way of visualizing short-term loudness, loudness history,
and long-term statistical descriptors (LM5D only). It may be used with mono, stereo
and 5.1 material for any type of program material.
LM5 therefore color codes loudness so it’s easy to identify target level (green), below
the noisefloor level (blue), or loud events (yellow), see Fig 2.
Fig 2, Color coding and target
loudness for selected broadcast
platforms based on a consumer’s
Dynamic Range Tolerance, DRT.
The aim is to center dynamic range
restriction around average loudness, in
this case the –20 dB line, thereby
automatically avoiding to wash out
differences between foreground and
background elements of a mix.
Note how different the broadcast
requirements are from those of
Cinema.
ENGLISH
-
Production,
Ingest,
Linking
Master Control Processing
Logging
thereby ensuring better audio quality not only in DTV audio, but across all broadcast
platforms. LM5 and TC processing can co-exist with PPM meters, VU meters or
Dolby’s LM100 meter. LM5 greatly increases the usability of LM100 in production
environments because it provides running status, and gives a standardized indication
of both dialog and non-dialog program.
4 / LM5 & LM5D -TDM
The “Transport Controls”, Auto, Pause and Reset, are used to make the radar and
descriptor measurements run, pause and reset. When “Auto” is pressed, run (green)
and pause (yellow) follows the ProTools transports.
Press the “PPM” key to bring up the PPM page as shown in Fig 6. The PPM display is
used to inspect balance between channels, overload of channels etc.
Press the “Prefs” key to bring up the Preferences display as shown in Fig 8. Note that
you can “zoom” in time or radar resolution, as long as the history is not reset. For
instance, change between 4 min per revolution to 1 hour per revolution, or 6 dB per
division to 10 dB per division.
Presets can be stored specifying target loudness, noise floor, overload conditions etc.
LM5 & LM5D -TDM / 5
ENGLISH
When production engineers realize the boundaries they should generally stay within,
less dynamics processing is automatically needed during distribution, and the
requirement for maintaining time-consuming metadata at a broadcast station is
minimized. In broadcast, the goal is to use the same loudness measure for
Fig 3, Radar page features of LM5D.
Target Loudness is displayed at 12 o’clock of the outer ring, and at the bold,
concentric circle of the radar. The Universal Descriptors, Consistency and Center of
Gravity (LM5D only), are the yellow numbers in the lower part of the display. Press the
“X” key to reset Radar and Descriptors.
RADAR PAGE
LOUDNESS HISTORY: RADAR
Current Loudness: Outer Ring
The Loudness Radar shows a history of loudness over time. The loudness “landscape”
may be used to judge if loudness emphasis is put where you want it to be: If dialog
segments are balanced against action parts, if the chorus of a song has a lift against
the verse, if the audience is too loud in a gameshow, or maybe as a target to aim for
during a live transition etc.
The outer ring of the Radar page displays current loudness. The 0 LU point (i.e. Target
Loudness) is at 12 o’clock, and marked by the border between green and yellow, while
the Low Level point is marked by the border between green and blue. The “0 LU
Equals” and “Low Level Below” parameters are found on Prefs page. For instance, if
0 LU is set at -20 LFS, and Low Level is set at -12 LU, the color coding of Fig 3
applies.
The user should be instructed to keep the outer ring in the green area, and around 12
o’clock on the average. Excursions into the blue or the yellow area should be
balanced, and not only go in one direction.
The numbers associated with the outer ring may be referenced at either maximum
loudness, or have a zero point set somewhere mid-scale. Choose “LFS” or “LU” at the
Loudness Scale selection on the Prefs page depending on your preference. Either way
of looking at loudness is valid. LFS reading is in line with how peak level is typically
measured in a digital system, and with Dolby LM100, while the LU approach calls for
a certain Target Loudness to have been predetermined, like e.g. a VU meter.
Fig 5, Different types of program shown on the Radar.
Left: 5.1 movie:
Pirates of the Caribbean on a 12 minute per revolution Radar: Low Consistency.
Center:
German news broadcast on a 4 minute per revolution Radar: Medium Consistency.
Right:
Madonna’s Hung Up pop on a one minute per resolution Radar: High Consistency.
The duration of one radar revolution may be set between 1 minute and 24 hours. The
Radar has 3, 4, 6, 8, 10 or 12 dB between each concentric circle, while the 0 LU
point is always marked as the border between green and yellow at the bold concentric
circle, see Fig 3. The 0 LU point is set on the Prefs page, typically between -12 and 24 LFS.
Fig 4, Radar page displaying calibration tones.
Left meter: Standard NAB preset. 1 kHz, stereo sine at –20 dBFS.
Right meter: Standard EBU preset. 1 kHz, stereo sine at –18 dBFS.
6 / LM5 & LM5D -TDM
The OBS indicator is lit to show certain inter-channel anomalies. Such conditions may
be defined on the Prefs page. The OBS indicator would typically trigger the operator to
switch to PPM page for a closer look of what’s going on.
The Peak indicator is lit to show that at least one channel is exceeding its true-peak
max. The threshold of the Peak Indicator is defined on the Prefs page, and recalled
with an LM5 preset.
LM5 & LM5D -TDM / 7
ENGLISH
ENGLISH
The “Transport Controls” (lower left on the display) are used to make the Radar run,
pause or reset. Note that these controls in LM5D appear as shown in Fig 3.
Additional to the short-term loudness (outer ring) and loudness history (radar), LM5D
displays long-term statistical descriptors that describe an entire program, film or
music track. Unlike concepts that measure only dialog, LM5D may measure any type
of audio.
Center of Gravity (CoG) indicates the average loudness of a program, and is directly
operational. If, for instance, a broadcast station is operated at an average loudness
level of –22 LFS, and a commercial has its Center of Gravity measured at –19.5 LFS,
the program should be attenuated by 2.5 dB before transmission for a best fit.
Consistency indicates the loudness variations inside a program. At one extreme, a
steady tone displays a Consistency of 0.0 LU. Broadcast programming typically comes
out with a Consistency between –2 and –5 LU, while classical music or a feature film
can show more negative readings, for instance a Consistency of –10 LU or lower. The
number predicts how much loudness correction in LU (cut and boost) is needed to
have a program or music track played without frequent loudness variations.
Center of Gravity ranges from –80 LFS to +12 LFS, while Consistency ranges from
–40 to 0 LU. Examples of typical Consistency / CoG values:
Cinema movie: -6 to -15 LU / -22 to -30 LFS
Classical music on CD: -5 to -12 LU / -15 to -30 LFS
Broadcast: -2 to -5 LU / -18 to -24 LFS
Commercials: -0.5 to -2 LU / -15 to -22 LFS
Pre 1995 pop/rock CD: -1.5 to -5 LU / -14 to -20 LFS
Hyper-compressed pop/rock CD: -1 to -3 LU / -5 to -8 LFS
Note: If you’re involved with music mastering, please observe that you enter red light
district for CoG values closer to zero than –12 LFS, and that you’re well inside that
zone if you pass the –10 LFS mark. Everything you do to make music even louder will
end up getting counteracted in iTunes or at the broadcast station – but the distortion
you add to go higher will remain.
ENGLISH
The same warning may be given for TV commercial production. Don’t aim at max
values, but allow Consistency to go down a bit to let the program breathe. Look at the
radar to put audio focus where you want it to be. When loudness gets normalized,
that’s what will give your message attention.
Universal Descriptors are rooted in Leq(K) as referenced in ITU-R BS.1770, and have
been designed for robustness against moderate gain offsets around normal broadcast
operating levels. If a program exhibits a Consistency of –3.5 LU, and the gain is offset
by 10 dB, its Center of Gravity reading is shifted by 10 dB, while Consistency remains
unchanged. Please find more information about Universal Descriptors in the Tech
Library of the TC website.
Long-term measurements (LM5D only)
not to measure programs of a shorter duration than approximately 10 seconds, while
the maximum duration may be 24 hours or longer.
Before a new measurement, press the “X” (Reset) key. This resets the descriptors, the
radar and the true-peak meters. Run the audio, and watch the radar and descriptor
fields update accordingly. It is normal that the descriptors wait five seconds into the
program before showing the first readings, while the radar updates instantly. The first
five seconds of a program are included in the descriptor calculations, even though
they are not shown instantly.
LM5D incorporates an intelligent gate, which discriminates between foreground and
background material of a program. Consequently, a measure doesn’t start before audio
has been identified. It also pauses the measurement during periods of only
background noise, and in the fade-out of a music track.
Universal Descriptors and Dolby LM100
Unlike methods that measure dialog only, LM5D may be used with any type of audio –
which includes dialog, of course. If you wish to measure dialog, it’s recommended to
do a manual spot check of a program or a film. Find 10-30 seconds of regular dialog
and measure it with LM5D. Where dialog may be soft, regular or loud, and shift by
more than 15 dB inside a film, regular dialog tends to be less ambiguous and more
consistent across a program.
Note: For compatibility with a proprietary measure such as Dolby LM100, only some
of these meters are updated to use ITU-R BS.1770 and Leq(K) while others are
locked at Leq(A). The software version of LM100 should be 1.3.1.5 or higher in order
for it to comply with BS.1770, and to have its average loudness reading be
compatible with Center of Gravity in LM5. Even used just on speech, Leq(A) is not a
precise approximation to perceived loudness, so please update the unit to BS.1770 to
obtain similar readings and predictable results.
To measure dialog with LM5D in ProTools the same way as Dolby LM100 set to dialog,
also solo the Center channel during a spot check to momentarily disable the channel
weighting specified in BS.1770, if you’re working on a 5.1 stem.
Universal Descriptors and AC3 Metadata
The “Dialnorm” parameter in AC3 metadata should indicate the average loudness of a
program.. Basic dynamic range and level control that rely on this parameter may take
place in the consumer’s receiver. Therefore, its value should not be far off target, or
the results become highly unpredictable.
Center of Gravity in LM5 is directly compatible with Dialnorm in AC3. Most broadcast
stations work against a fixed dialnorm setting, for instance –23 LFS. This would then
be the CoG value to aim a program at. If the program isn’t only dialog, the best
consumer listening results are achieved if you aim Center of Gravity somewhat higher
than the actual goal. For a music program, for instance, the aim should be
approximately 3 LU higher.
Universal descriptors may be used to make program-duration measurements, or you
may “spot-check” regular dialog or individual scenes as required. It is recommended
8 / LM5 & LM5D -TDM
LM5 & LM5D -TDM / 9
ENGLISH
Universal Descriptors (LM5D only)
PPM PAGE
Press the “PPM” key to bring up the PPM display, Fig 6. The PPM page is used to
inspect balance between channels, headroom, overload of channels etc.
Fig 6, PPM True-peak meter features.
Bargraph PPM meters are shown next to the round Current Loudness display, which is
identical to the Outer Ring of the Radar page. The True-peak meters operate
regardless of the status of the Run/Stop/Pause controls. Click on the bargraphs to
reset the peak history.
The peak meters of LM5 display true-peak as specified in ITU-R BS.1770. True-peak
meters give a better indication of headroom and risk of distortion in downstream
equipment such as sample rate converters, data reduction systems and consumer
electronics than digital sample meters used e.g. in CD mastering.
Fig 7, PPM True-peak meter example showing Madonna’s Hung Up.
ENGLISH
Note that the meter scale is extended above 0 dBFS. Most consumer equipment
distorts if you see readings above 0. With data reduced delivery, -3 dBFS should be
regarded as max level without too much distortion. To be on the safe side with regard
to broadcast linking and transmission, -6 dBFS should not be exceeded often. Please
remember that excessive peak level may generate noticeable distortion and listener
fatigue.
When you enter the PPM page, the bargraph meters show the highest peak level
registered since the Radar or Peak Level history was reset.
10 / LM5 & LM5D -TDM
LM5 & LM5D -TDM / 11
ENGLISH
Note the extreme peak level way above 0 dBFS, which is typical of hyper-compressed
program. This track will distort heavily when played on a consumer CD player or if it’s
data reduced.
PREFERENCES PAGE
Time Reference can take two values: “Actual Computer Time” or “Program Time”. The
first is synchronized to the realtime clock of the computer, the latter to when a new
measure was started, i.e. when the “run” key was pressed. Note: The meter history
resets when you switch between Time Reference settings.
Radar Speed controls how long time each radar revolution takes. Select from 1 minute
to 24 hours. You may “zoom” between the settings, as long as the history isn’t reset.
Pressing the “X” key, or changing the Time Reference, resets the meter and descriptor
history.
Radar Resolution sets the difference in loudness between each concentric circle in the
Radar between 3 and 12 dB. Choose low numbers when targeting a platform with a
low dynamic range tolerance. You may “zoom” between the settings, as long as the
history isn’t reset. Pressing the “X” key, or changing the Time Reference, resets the
meter and descriptor history.
Fig 8, LM5 Prefs page.
Preferences may be stored as Presets, thereby having suitable settings for different
conditions easily at hand.
Loudness Scale can be set to either “Loudness Units, LU” or “Loudness Full Scale,
LFS”. Because LM5 uses the BS.1770 loudness model, LFS is the same as LKFS.
When “LFS” is selected, the numbers of the outer ring of the Radar page shown in Fig
3 apply. When “LU” is selected, the outer ring “hours” are marked in LU units
instead.
Low Level Below determines where the shift between green and blue happens in the
outer ring. It indicates to the engineer that level is now at risk of being below the
noise floor.
ENGLISH
ENGLISH
0 LU Equals sets the loudness required to obtain a 12 o’clock reading on the outer
ring, which is the same as the border between green and yellow on the Radar page. 0
LU is the reference to aim at.
True Peak Indicator sets the level at which the Peak indicator lights up.
OBS Indicator sets the conditions for the OBS indicator to light up. Turn it off, if you
don’t want warnings.
12 / LM5 & LM5D -TDM
LM5 & LM5D -TDM / 13
PRESETS
The following presets have been loaded as factory defaults. Factory presets all use the
LFS scale, Program time and 4 minutes per Radar Revolution. You may store new
presets with a ProTools session based on your own preferences.
You may switch between presets on the fly without resetting the Radar,
thereby easily changing scale, zoom etc.
Broadcast HD
0 LU Equals: -22 LFS
Low Level Below: -18 LU (Equals –40 LFS in this case).
Radar Resolution: 6 dB per division
True-peak Indicator: -6 dBFS
Broadcast SD
0 LU Equals: -20 LFS
Low Level Below: -12 LU (Equals –32 LFS in this case).
Radar Resolution: 6 dB per division
True-peak Indicator: -6 dBFS
Mastering Pop
0 LU Equals: -12 LFS
Low Level Below: -12 LU (Equals –24 LFS in this case).
Radar Resolution: 4 dB per division
True-peak Indicator: 0 dBFS
Mastering Wide
0 LU Equals: -20 LFS
Low Level Below: -24 LU (Equals –44 LFS in this case).
Radar Resolution: 10 dB per division
True-peak Indicator: 0 dBFS
ENGLISH
Standard EBU
0 LU Equals: -18 LFS
Low Level Below: -9 LU (Equals –27 LFS in this case).
Radar Resolution: 4 dB per division
True-peak Indicator: -6 dBFS
Standard NAB
0 LU Equals: -20 LFS
Low Level Below: -9 LU (Equals –29 LFS in this case).
Radar Resolution: 4 dB per division
True-peak Indicator: -6 dBFS
14 / LM5 & LM5D -TDM
Fig 9, Examples of 5.1 movie left (Matrix) and stereo, classical music right (Bolero).
Both examples are shown on a 12 minute per revolution Radar with 10 dB between
divisions.
Level versus Loudness
When level normalization in audio distribution is based on a peak level measure, it
favors low dynamic range signatures as shown in Fig 1. This is what has happened to
CD.
Quasi-peak level meters have this effect. They tell little about loudness, and also
require a headroom in order to stay clear of distortion. Using IEC 268-18 meters, the
headroom needed is typically 8-9 dB.
Sample based meters are also widely used, but tell even less about loudness. Max
sample detection is the general rule in digital mixers and DAWs. The side effect of
using such a simplistic measure has become clear over the last decade, and CD music
production stands as a monument over its deficiency. In numerous TC papers, it has
been demonstrated how sample based peak meters require a headroom of at least 3
dB in order to prevent distortion and listener fatigue.
The only type of standard level instrument that does not display some sort of peak
level is the VU meter. Though developed for another era, this kind of meter is arguably
better at presenting an audio segment’s center of gravity. However, a VU meter is not
perceptually optimized, or ideal for looking at audio with markedly different dynamic
range signatures.
LM5 & LM5D -TDM / 15
ENGLISH
Film Mix
0 LU Equals: -24 LFS
Low Level Below: -24 LU (Equals –48 LFS in this case).
Radar Resolution: 10 dB per division
True-peak Indicator: -3 dBFS
Unlike electrical level, loudness is subjective, and listeners weigh its most important
factors - SPL, Frequency contents and Duration - differently. In search of an
“objective” loudness measure, a certain Between Listener Variability (BLV) and Within
Listener Variability (WLV) must be accepted, meaning that even loudness assessments
by the same person are only consistent to some extent, and depends on the time of
day, her mood etc. BLV adds further to the blur, when sex, culture, age etc. are
introduced as variables.
Because of the variations, a generic loudness measure is only meaningful when it is
based on large subjective reference tests and solid statistics. Together with McGill
University in Montreal, TC Electronic has undertaken extensive loudness model
investigation and evaluation.
ITU-R BS.1770 PRIMER
ITU-R BS.1770 standardizes the measurement of long-term loudness and of true-peak
level. LM5 displays both parameters, and additionally offers a consistent way of
breaking up long-term loudness into a coherent, running measure of instant loudness
and of loudness history.
A block diagram of the loudness detection part of the BS.1770 measure is shown in
Fig 10. The way channels are summed (means square), to some extent mimic s
speaker summing in a the real world. Therefore, BS.1770 gives a meaningful
indication of loudness, regardless if the input format is mono, stereo or 5.1.
The results denounce a couple of Leq measures, namely A and M weighted, as generic
loudness measures. In fact, a quasi-peak meter showed better judgement of loudness
than Leq(A) or Leq(M). Even used just for speech, Leq(A) is a poor pick, and it
performs worse on music and effects. An appropriate choice for a low complexity,
generic measurement algorithm, which works for listening levels used domestically,
has been known as Leq(RLB).
Combined loudness and peak level meters exist already, for instance the ones from
Dorroughs, but BS.1770 now offers a standardized way of measuring these
parameters.
The other aspect of BS.1770, the algorithm to measure true-peak, is built on solid
ground. Inconsistent peak meter readings, unexpected overloads, distortion in data
reduced delivery and conversion etc. has been extensively described, so in liaison with
AES SC-02-01, an over-sampled true-peak level measure was included with BS.1770.
In conclusion, BS.1770 is an honorable attempt at specifying loudness and peak level
separately, instead of the simplistic (sample peak) and mixed up measures (quasipeak) in use today. The loudness and peak level measurement engine of LM5 follows
the standard precisely. Possible updates to the ITU standard may be released as LM5
updates, provided that processing requirements doesn’t exhaust the system.
Technical papers from AES, SMPTE, NAB and DAFX conferences with more
information about loudness measurement, evaluation of loudness models, true-peak
detection, consequences of 0 dBFS+ signals etc., are available from the TC website.
Visit the Tech Library at www.tcelectronic.com/techlibrary.asp for details.
16 / LM5 & LM5D -TDM
Fig 10, ITU-R BS.1770 Loudness Measure Block Diagram.
Note how an extra filter has been added in front of the original RLB filter, and that
the LFE component is disregarded completely in the measure.
The three front channels - L, C, R - employ the same channel weighting, while the
measure is 1.5 dB more sensitive to surround channel signals. The reading of a signal
entered into a surround channel is therefore 1.5 dB higher than if the same signal
was entered into a front channel. The LFE channel is completely disregarded by the
BS.1770 loudness measure.
ENGLISH
ENGLISH
In 2006, ITU-R Working Party 6J drafted a new loudness and peak level measure,
BS.1770, and the standard has subsequently come into effect. It has been debated if
the loudness part is robust enough, because it will obviously get exploited where
possible. However, with a variety of program material, Leq(RLB) has been verified in
independent studies to be a relatively accurate measure, and correlate well with
human test panels. It therefore seems justified to use Leq(RLB) as a baseline measure
for loudness, especially because room for improvement is also built into the standard.
The final BS.1770 standard included a multichannel annex with a revised weighting
filter, R2LB – now known as “K” weighting - and a channel weighting scheme. These
two later additions have been less verified than the basic Leq(RLB) frequency
weighting.
LM5 & LM5D -TDM / 17
METER CALIBRATION
Because of the frequency and channel weighting, and of the way channels sum, only
specific tones and input channels should be used for calibration.
The most transparent results are obtained using a 1 kHz sine tone for calibration.
Other frequencies or types of signal may be used (square wave, noise etc.), but don’t
expect similar results. The beauty of the system lies in its RMS foundation, so this is
a feature, not an error. The same feature enables the loudness measure to identify
overly hot CDs or commercials, and to take out of phase signals into account just as
much as signals that are in phase.
If we stick to standard methods for measuring peak audio level in a digital system,
where a sine wave (asynchronous of the sample rate) with digital peaks at 0 dBFS, is
regarded a 0 dBFS tone, BS.1770 and LM5 output these results:
One front channel fed with a –20 dBFS, 1 kHz sine tone => Reading of –23,0 LFS.
Two front channels fed with a –20 dBFS, 1 kHz sine tone => Reading of –20,0 LFS.
All 5.1 channels fed with a –20 dBFS, 1 kHz sine tone => Reading of –15,4 LFS.
See Fig 4 as examples of calibration tone Radar displays.
DISPLAY
Red curve: A weighting.
Green curve: RLB weighting.
Blue curve: R2LB weighting, AKA “K” weighting.
The frequency weighting employed in the loudness part of BS.1770 is shown in
fig 11. It means that you cannot perform a calibration tone sweep and expect the
reading to stay the same, see below.
The effectiveness of any loudness meter depends on both the graphical appearance
and dynamic behavior of its display, as well as on its underlying measurement
algorithms. A short-term loudness meter also relies on the measurement algorithm’s
ability to output pertinent loudness information using different analysis windows, for
instance, 200-800 ms for running realtime updates. It should be noted how the
optimum size of this window varies from study to study, possibly because the objective
of a running display hasn’t been fully agreed upon.
ENGLISH
Formal evaluation of a visualization system is challenging: First of all, one or more
metrics must be defined by which the display should be evaluated. The
correspondence between the sound heard and the picture seen is one aspect to be
evaluated. Another metric could characterize the speed of reading the meter reliably.
In LM5, short-term, mid-term and long-term of loudness measurements are tied
together coherently, and displayed in novel ways (angular reading and radar) that were
preferred in its development and test phases. However, we remain open to suggestions
for further improvement of the visualization of loudness.
18 / LM5 & LM5D -TDM
LM5 & LM5D -TDM / 19
ENGLISH
Fig 11, Frequency weighting used with selected Leq measures.
LM5 may use either the measurement unit of LU (Loudness Units) or LFS (Loudness
Full Scale). LU and LFS are measurements in dB, reflecting the estimated gain offset
to arrive at a certain Reference Loudness (LU) or Maximum Loudness (LFS) as defined
in BS.1770. Since a common reference point for LU has not been agreed on at the
time of writing (February, 2008), LFS (or “LKFS”, pointing specifically to the
Leq(R2LB) weighting of BS.1770), might be favored initially to avoid ambiguous use
of the term LU.
POST SCRIPT
Control of loudness is the only audio issue that has made It to the political agenda.
Political regulation is currently being put into effect in Europe to prevent hearing
damage and disturbances from PA systems, and to avoid annoying level jumps during
commercial breaks in television. In Australia, something similar may happen.
Many years of research into loudness of not only dialog, but also of loudness relating
to any type of audio programming, has brought TC to the forefront of companies in the
world to perform realtime loudness measurement and control. Therefore, TC has taken
active part in loudness standardization efforts in Japan, the United States, Europe and
other areas.
In broadcast, digitization is driving the number of AV channels and platforms up,
while the total number of viewers remains roughly the same. On the sound production
side, it is therefore important that delivery criteria can be easily specified and met,
even by people not primarily concerned with audio: Journalists, musicians, video
editors, marketing professionals etc.
Using only dialog based audio measurements in digital broadcast, has led to
ambiguous level management, more level jumps between programs, and extra time
spent on audio production and management in general. Non-dialog based level jumps
are currently creating havoc in digital TV, and LM5 helps correct that situation. The
LM5 Loudness Meter can be used to control level and improve sound, not only in
Dolby AC3 based transmissions, but also on other broadcast platforms, such as analog
TV, mobile TV and IPTV.
To summarize: LM5 is part of a holistic and universal approach to loudness control,
starting at the production or live engineer. When she realizes the dynamic range at her
disposal, less processing is needed at later stages of a distribution chain. The chain
ends with the capability of quality controlling everything upstream by applying the
same loudness measure for logging purposes: A closed loop.
Welcome to a new, standardized world of audio leveling. Across genres, across
formats, across the globe.
PRESET MANAGEMENT NOTE
ENGLISH
LM5 and LM5D uses the standard Pro Tools preset handling.
20 / LM5 & LM5D -TDM