1
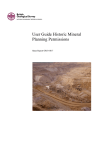
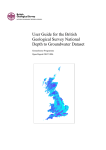
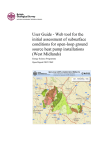
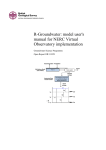
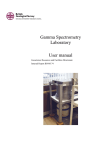
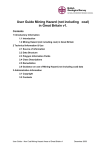
User Guide: Groundwater Vulnerability (Scotland) GIS dataset, Version 2 Groundwater Science Programme Open Report OR/11/064 BRITISH GEOLOGICAL SURVEY GROUNDWATER SCIENCE PROGRAMME OPEN REPORT OR/11/064 User Guide: Groundwater Vulnerability (Scotland) GIS dataset, Version 2 The National Grid and other Ordnance Survey data are used with the permission of the Controller of Her Majesty’s Stationery Office. Licence No: 100017897/2011. B É Ó Dochartaigh, D D Doce, H K Rutter and A M MacDonald Keywords Groundwater vulnerability, Scotland, GIS. Front cover Groundwater vulnerability (Scotland) mao.. Bibliographical reference Ó DOCHARTAIGH B É, DOCE D D, RUTTER H K AND MACDONALD A M. 2011. User Guide: Groundwater Vulnerability (Scotland) GIS dataset, Version 2. British Geological Survey Open Report, OR/11/064. 25pp. Copyright in materials derived from the British Geological Survey’s work is owned by the Natural Environment Research Council (NERC) and/or the authority that commissioned the work. You may not copy or adapt this publication without first obtaining permission. Contact the BGS Intellectual Property Rights Section, British Geological Survey, Keyworth, e-mail [email protected]. You may quote extracts of a reasonable length without prior permission, provided a full acknowledgement is given of the source of the extract. Maps and diagrams in this book use topography based on Ordnance Survey mapping. © NERC 2011. All rights reserved Keyworth, Nottingham British Geological Survey 2011 BRITISH GEOLOGICAL SURVEY The full range of our publications is available from BGS shops at Nottingham, Edinburgh, London and Cardiff (Welsh publications only) see contact details below or shop online at www.geologyshop.com The London Information Office also maintains a reference collection of BGS publications, including maps, for consultation. We publish an annual catalogue of our maps and other publications; this catalogue is available online or from any of the BGS shops. The British Geological Survey carries out the geological survey of Great Britain and Northern Ireland (the latter as an agency service for the government of Northern Ireland), and of the surrounding continental shelf, as well as basic research projects. It also undertakes programmes of technical aid in geology in developing countries. The British Geological Survey is a component body of the Natural Environment Research Council. British Geological Survey offices BGS Central Enquiries Desk Tel 0115 936 3143 email [email protected] Fax 0115 936 3276 Kingsley Dunham Centre, Keyworth, Nottingham NG12 5GG Tel 0115 936 3241 Fax 0115 936 3488 email [email protected] Murchison House, West Mains Road, Edinburgh EH9 3LA Tel 0131 667 1000 email [email protected] Fax 0131 668 2683 Natural History Museum, Cromwell Road, London SW7 5BD Tel 020 7589 4090 Fax 020 7584 8270 Tel 020 7942 5344/45 email [email protected] Columbus House, Greenmeadow Springs, Tongwynlais, Cardiff CF15 7NE Tel 029 2052 1962 Fax 029 2052 1963 Maclean Building, Crowmarsh Gifford, Wallingford OX10 8BB Tel 01491 838800 Fax 01491 692345 Geological Survey of Northern Ireland, Colby House, Stranmillis Court, Belfast BT9 5BF Tel 028 9038 8462 Fax 028 9038 8461 www.bgs.ac.uk/gsni/ Parent Body Natural Environment Research Council, Polaris House, North Star Avenue, Swindon SN2 1EU Tel 01793 411500 Fax 01793 411501 www.nerc.ac.uk Website www.bgs.ac.uk Shop online at www.geologyshop.com OR/11/064 Contents Contents........................................................................................................................................... i Summary ........................................................................................................................................ ii 1 Introduction ............................................................................................................................ 1 2 The Groundwater Vulnerability (Scotland) Dataset, Version 2 ........................................ 1 2.1 Background ..................................................................................................................... 1 2.2 What the dataset shows................................................................................................... 1 2.3 How can the dataset be used? ......................................................................................... 2 2.4 Limitations ...................................................................................................................... 2 2.5 Who might benefit from using the dataset? .................................................................... 3 3 Technical Information ........................................................................................................... 5 3.1 Definitions ...................................................................................................................... 5 3.2 Scale................................................................................................................................ 5 3.3 Methodology used to create Dataset ............................................................................... 5 3.4 Input Datasets ................................................................................................................. 6 3.5 Dataset History ............................................................................................................... 7 3.6 Coverage ......................................................................................................................... 7 3.7 Data Format .................................................................................................................... 8 4 Licensing Information ........................................................................................................... 8 References ...................................................................................................................................... 9 Appendix 1 Detail of amendments to input datasets compared to Version 1 .................. 11 Appendix 2 Methodology used to create vulnerability dataset ......................................... 14 Appendix 3 Tables for vulnerability classification ............................................................. 16 FIGURES Figure 1 The groundwater vulnerability (Scotland) map, Version 2 ......................................... 4 Figure 2 The coverage of the groundwater vulnerability (Scotland) dataset............................. 8 TABLES Table 1 Groundwater vulnerability classifications and their interpretation ................................ 5 Table 2 Data fields and parameter values used in the creation of the groundwater vulnerability (Scotland) Version 2 map: input datasets and final groundwater vulnerability class..... 6 Table 3 Data fields and parameter values in the aquifer productivity datasets ........................... 8 i OR/11/064 Summary This report describes a revised version (Version 2) of the groundwater vulnerability (Scotland) digital dataset produced by the British Geological Survey (BGS). Version 1 of the dataset was produced in 2004 by the British Geological Survey (BGS) and the Macaulay Institute (now the James Hutton Institute) on behalf of the Scottish Environment Protection Agency (SEPA), funded by the Scotland and Northern Ireland Forum for Environmental Research (SNIFFER). Version 2 uses updated input data and a slightly modified methodology. The map shows the relative vulnerability of groundwater to contamination across Scotland. Groundwater vulnerability is the tendency and likelihood for general contaminants to move vertically through the unsaturated zone and reach the water table after introduction at the ground surface. On this map, groundwater vulnerability is described by one of five relative classes ranging from 1 (lowest vulnerability) to 5 (highest vulnerability). The groundwater vulnerability map is a screening tool that can be used to show the relative threat to groundwater quality from contamination across Scotland. It can provide guidance on the vulnerability of groundwater at a regional scale, highlighting areas at comparatively higher risk of groundwater contamination, and can help indicate the degree of specific site investigation required for a new development or activity. It is designed to be used at a scale of 1:100,000 and should be regarded as a tool to aid groundwater risk assessment rather than a complete solution. ii OR/11/064 1 Introduction Founded in 1835, the British Geological Survey (BGS) is the world's oldest national geological survey and the United Kingdom's premier centre for earth science information and expertise. The BGS provides expert services and impartial advice in all areas of geoscience. Our client base is drawn from the public and private sectors both in the UK and internationally. Our innovative digital data products aim to help describe the ground surface and what's beneath across the whole of Great Britain. These digital products are based on the outputs of the BGS survey and research programmes and our substantial national data holdings. This data coupled with our in-house Geoscientific knowledge are combined to provide products relevant to a wide range of users in central and local government, insurance and housing industry, engineering and environmental business, and the British public. Further information on all the digital data provided by the BGS can be found on our website or by contacting one of our offices or [email protected]. 2 The Groundwater Vulnerability (Scotland) Dataset, Version 2 2.1 BACKGROUND The groundwater vulnerability (Scotland) dataset, Version 1, was produced in 2004 by the British Geological Survey (BGS) and the Macaulay Institute (now the James Hutton Institute) on behalf of the Scottish Environment Protection Agency (SEPA), funded by the Scotland and Northern Ireland Forum for Environmental Research (SNIFFER). The dataset comprised a GISbased groundwater vulnerability screening tool and an associated report describing the groundwater vulnerability screening methodology (Ball et al. 2004, Ó Dochartaigh et al. 2005). This revised version (Version 2) uses updated input data and a slightly modified methodology to develop new GIS-based maps. Related BGS datasets that the user may also be interested in are maps of bedrock and superficial deposits aquifer productivity for Scotland (Ó Dochartaigh et al. 2011, MacDonald et al. 2004); permeability index datasets (British Geological Survey 2010); superficial deposits thickness datasets (Lawley and Garcia-Bajo 2009); and DiGMapGB-50 (the Digital Geological Map of Great Britain at 1:50 000). A related external dataset is the Hydrology of Soil Types (HOST), available through the James Hutton Institute (Boorman et al 1995; http://www.macaulay.ac.uk/host/). 2.2 WHAT THE DATASET SHOWS The groundwater vulnerability dataset is a screening tool that shows the relative threat to groundwater quality across Scotland from contamination. Groundwater vulnerability is a term that has been in use for more than 30 years and has been interpreted in different ways. The accepted definition of groundwater vulnerability in the UK and other European countries is ‘the tendency and likelihood for general contaminants to reach the water table within the uppermost aquifer after introduction at the ground surface’ (Ó Dochartaigh et al 2005). Groundwater vulnerability therefore accounts for intrinsic properties of the vertical pathway in the unsaturated zone (above the water table), whether within an aquifer or its 1 OR/11/064 overburden. All groundwater is to some extent vulnerable to contamination from surface or subsurface sources (Foster 1998), and one of the objectives of vulnerability maps is to integrate geological and hydraulic charactersistics of aquifers and overlying material to indicate the relative risk to groundwater from contamination. The groundwater vulnerability dataset does not account for the movement of contaminants through the saturated zone of an aquifer after reaching the water table. Separate aquifer productivity maps have been developed to help characterise this pathway (Ó Dochartaigh et al. 2011). The groundwater vulnerability map (Scotland) is shown in Figure 1. Groundwater vulnerability is described by one of five relative classes ranging from 1 (lowest vulnerability) to 5 (highest vulnerability) (Table 1). 2.3 HOW CAN THE DATASET BE USED? The groundwater vulnerability dataset is a screening tool that provides specific information on the vertical pathway to the water table. It is not a complete solution to groundwater risk assessment and site suitability studies. It can provide guidance on the vulnerability of groundwater at a regional scale, highlighting areas at comparatively higher risk of groundwater contamination, and can help indicate the level of specific site investigation required for a new development or activity. Groundwater vulnerability maps provide information on the pathway followed by pollutants resulting from human activities – e.g. related to industrial, urban, agricultural or domestic practices – to the water table. They are used, along with an assessment of the hazard and of the consequences of pollution occurring, to help calculate the degree of risk of contamination caused by such activities. The dataset allows for regional assessment of groundwater vulnerability as one stage in the process of assessing overall risk to groundwater, for example when combined with land use and aquifer maps. The dataset may have several uses, including: In policy analysis and development To prioritise aquifer and site investigations To inform planning decisions To improve awareness of groundwater in general. 2.4 LIMITATIONS The groundwater vulnerability (Scotland) Version 2 dataset has been developed at 1:100 000 scale and must not be used at larger scales. It is not designed to assess groundwater vulnerability at a single point. All spatial searches against the data should therefore be conducted using a minimum 100 m buffer. The groundwater vulnerability (Scotland) Version 2 dataset is based on, and limited to, an interpretation of the records in the possession of the British Geological Survey at the time the dataset was created. Groundwater vulnerability maps provide approximate descriptions of ground conditions. Use of them must therefore be pragmatic. The US National Research Council (1993) quotes three ‘laws’ of groundwater vulnerability which are instructive when using any groundwater vulnerability map: 1. All groundwater is to some degree vulnerable 2. Uncertainty is inherent in all vulnerability assessments 3. There is a risk that the obvious may be obscured and the subtle indistinguishable. 2 OR/11/064 2.5 WHO MIGHT BENEFIT FROM USING THE DATASET? The groundwater vulnerability dataset was originally developed for use by the Scottish Environment Protection Agency (SEPA) for protecting and managing groundwater and informing their response to land use planning applications. Other potential users of the dataset are regional planners and managers in Local Authorities and national government. Identifying areas where groundwater is vulnerable to contamination is a key stage in effective environmental management, for example related to sustainable agricultural and industrial practices and land use planning applications. Any individuals or bodies involved in the activities listed in Section 2.3 are likely to find the groundwater vulnerability dataset useful. 3 OR/11/064 Figure 1 The groundwater vulnerability (Scotland) map, Version 2 4 OR/11/064 Table 1 Groundwater vulnerability classifications and their interpretation Vulnerability class Description 5 Vulnerable to most pollutants, with rapid impact in many scenarios 4 Vulnerable to those pollutants not readily adsorbed or transformed 4a May have low permeability soil; less likely to have clay present in superficial deposits Frequency of activity Travel time Vulnerable to individual events Rapid 4b More likely to have clay present in superficial deposits 3 Vulnerable to some pollutants; many others significantly attenuated 2 Vulnerable to some pollutants, but only when they are continuously discharged/leached Only vulnerable to conservative pollutants in the long term when continuously and widely discharged/leached Vulnerable only to persistent activity 1 0 Very slow Not sufficient data to classify vulnerability: e.g. below lochs; in urban areas where geological and/or soils data are missing; where superficial deposits are mapped but not classified; or in mined (including opencast) and quarried areas 3 Technical Information 3.1 DEFINITIONS Groundwater vulnerability is the tendency and likelihood for general contaminants to move vertically through the unsaturated zone and reach the water table after introduction at the ground surface. It therefore accounts for intrinsic properties of the vertical pathway in the unsaturated zone (above the water table), whether within an aquifer or its overburden (superficial deposits and/or soil). It does not account for the movement of contaminants through the saturated zone of an aquifer after reaching the water table. 3.2 SCALE The groundwater vulnerability (Scotland) Version 2 dataset is produced for use at 1:100 000 scale. The dataset is not designed to be used to assess groundwater vulnerability at a single point. All spatial searches of the map/dataset should be conducted using a minimum 100 m buffer. 3.3 METHODOLOGY USED TO CREATE DATASET The groundwater vulnerability dataset was produced in ArcGIS by combining a range of environmental datasets (Table 2). A detailed description of the methodology for developing the groundwater vulnerability Version 1 dataset is given in Ball et al. (2004). This new dataset, Version 2, was produced along largely the same lines, with some small methodological changes to simplify the assessment procedure, but using updated input datasets. 5 OR/11/064 A rule-based method for combining the various input datasets to define a vulnerability classification has been used, which has been modified only slightly from that used for Version 1. The method is described in detail in Appendices 2 and 3. 3.4 INPUT DATASETS The input datasets used to produce Version 2 of the dataset are listed and described briefly in Table 2. More detail on how they have been amended from Version 1 is given in Appendix 1 Table 2 Data fields and parameter values used in the creation of the groundwater vulnerability (Scotland) Version 2 map: input datasets and final groundwater vulnerability class Parameter name Description Dataset derivation BR_FLOWTYPE Flow type (flow mechanism) in bedrock aquifers: Significantly Intergranular; mixed Intergranular/Fracture; or Fracture. From BGS’s Bedrock Aquifer Productivity (Scotland) map (Ó Dochartaigh et al. 2011) BR_MAXPERM Maximum permeability of bedrock: Very High; High; Moderate; Low; or Very Low. From BGS’s Permeability Dataset for Great Britain (Bedrock) (British Geological Survey 2010) SD_MAXPERM Maximum permeability of superficial deposits: Very High; High; Moderate; Low; or Very Low. From BGS’s Permeability Dataset for Great Britain (Superficial Deposits) (British Geological Survey 2010) SD_THICK Superficial deposits are only mapped where >1m thick. Thickness of superficial deposits was coded as follows: 1 (1-3m), 2 (3-10m), 3 (10-30m), 4 (>30m). Based on the first version of BGS’s superficial deposits thickness map (which was interpolated from borehole records) but modified applying expert knowledge to particular areas. For more information see Ball et al. (2004). CLAY Delineating those areas known to contain at least 5m thickness of clay within the superficial deposits sequence, either as a single unit or the sum of more than one unit. Derived from lithological log data held in BGS’s Single Onshore Borehole Index (SOBI) database. For more information see Ball et al. (2004). SD_DTW Depth to groundwater level in superficial deposits aquifers. This dataset is based primarily on a surface representing the depth from ground level to the river base level, which is modelled based on a digital terrain model (DTM) and the locations of major rivers, combined with HOST data showing areas where the water table is <2m. Four classes of depth to groundwater level are defined: 1 (< 3m), 2 (3 – 10m), 3 (10 - 30m), and 4 (> 30m). Developed by BGS for the purposes of the groundwater vulnerability map. For more information see Appendix 1 and Ball et al. (2004). BR_DTW Depth to groundwater level in bedrock aquifers. This is defined only for aquifers with significant intergranular flow. Four classes of depth to groundwater level are defined: 1 (< 3m), 2 (3 – 10m), 3 (10-30m) and 4 (>30m). Developed by BGS for the purposes of the groundwater vulnerability map. 6 OR/11/064 Parameter name Description Dataset derivation HOST_CLASS HOST (Hydrology of Soil Types) Class. Digital soils data at 1:250 000 scale. From the James Hutton Institute (formerly the Macaulay Institute) (Boorman et al 1995; http://www.macaulay.ac.uk/ host/). The following groups of HOST classes were used at different stages of creating the groundwater vulnerability map: HOST class = 9, 16, 18, 24, 26, 28 or 29, to define low permeability soils HOST class = 22 or 27, to define thin soils HOST class = 10 or 12, to define areas where groundwater is present within 2m of ground level (see also below, ‘Depth to groundwater level in superficial deposits’) Code representing relative groundwater vulnerability, from 1 (very low vulnerability) to 5 (very high vulnerability). See Table 1 for how to interpret the codes. VULN 3.5 DATASET HISTORY The groundwater vulnerability (Scotland) dataset, Version 1, was produced in 2004 by the British Geological Survey (BGS) and the Macaulay Institute (now the James Hutton Institute) on behalf of the Scottish Environment Protection Agency (SEPA), funded by the Scotland and Northern Ireland Forum for Environmental Research (SNIFFER). The dataset comprised a GISbased groundwater vulnerability screening tool and an associated report describing the groundwater vulnerability screening methodology (Ball et al. 2004). This revised version (Version 2) uses updated input data and a slightly modified methodology to develop new GIS-based maps. 3.6 COVERAGE The dataset covers all of Scotland (Figure 2). 7 OR/11/064 Figure 2 3.7 The coverage of the groundwater vulnerability (Scotland) dataset DATA FORMAT The groundwater vulnerability (Scotland) Version 2 dataset is available as both a vector dataset and a raster dataset. Both datasets contain only the final groundwater vulnerability classification and none of the input parameter information (Table 3, Table 1). The raster dataset has a 50 m grid cell size with the grid value equal to the groundwater vulnerability classification (Table 1). Table 3 Data fields and parameter values in the aquifer productivity datasets Field Description Values Vuln Groundwater vulnerability As Table 1 4 Licensing Information The British Geological Survey does not sell its digital mapping data to external parties. Instead, BGS grants external parties a licence to use this data, subject to certain standard terms and conditions. In general, a licence fee will be payable based on the type of data, the number of users, and the duration (years) of a licence. 8 OR/11/064 All recipients of a licence (potential licensees) are required to return a signed digital data licence document to us before authorisation for release of BGS digital data is given. In general terms, a BGS digital data licensee will be permitted to: make internal use of the dataset(s) allow a specified number of internal users to access/use the data (the number of users will be agreed with the licensee and specified in the licence document) for the purposes of their day-to-day internal activities reproduce extracts from the data up to A3 for use in external analogue (paper/hard copy) or non-queryable electronic (e.g. secured .pdf) format: to meet a public task duty; fulfil a statutory requirement; and/or as part of academic or other noncommercial research But will not be permitted to: provide a bureau service for others or incorporate the data in the generation of products or services for commercial purposes sell, assign, sublicense, rent, lend or otherwise transfer (any part of) the dataset(s) or the licence place (any part of) the dataset(s) on the Internet The BGS is committed to ensuring that all the digital data it holds which is released to external parties under licence has been through a robust internal approval process, to ensure that geoscientific standards and corporate quality assurance standards are maintained. This approval process is intended to ensure that all data released: (i) is quality assured; (ii) meets agreed BGS data management standards; (iii) is not in breach of any 3rd party intellectual property rights, or other contractual issues (such as confidentiality issues), that would mean that release of the data is not appropriate. When the BGS digital datasets are revised any upgrades will be automatically supplied to the licensee, at no additional cost. Geological map datasets are revised on a periodic rather than on an annual basis, licensees will therefore not automatically receive a new dataset each year unless changes have been made to the data. These are general comments for guidance only. A licensee of BGS's digital data is provided with full details of the basis on which individual BGS datasets licensed to them are supplied. If you have any doubts about whether your proposed use of the BGS data will be covered by a BGS digital licence, the BGS Intellectual Property Rights (IPR) section will be happy to discuss this with you and can be contacted through the following email address: [email protected]. BGS IPR will usually be able to provide reassurance that the licence will cover individual user requirements and/or to include additional 'special conditions' in the licence documentation, addressing specific requirements within BGS's permitted usage. References Ball D, MacDonald A, Ó Dochartaigh B, del Rio M, FitzSimons V, Auton C and Lilly A. 2004. Development of a groundwater vulnerability screening methodology for the Water Framework Directive. SNIFFER Report Project WFD28 / BGS Commissioned Report CR/03/294C. Bloomfield J P, McKenzie A A, Rutter H K and Hulbert A. 2007. Methodology for mapping geological controls on susceptibility to groundwater flooding. British Geological Survey Internal Report IR/07/72, 55pp. 9 OR/11/064 Boorman D B, Hollis J M and Lilly A. 1995. Hydrology of soil types: a hydrologically-based classification of the soils of the United Kingdom. Institute of Hydrology Report No.126. Institute of Hydrology, Wallingford. British Geological Survey. 2010. Permeability Indices (PI) data: Information Note, 2010: Permeability Index – Version 6.0. British Geological Survey Information Note. Accessed from http://www.bgs.ac.uk/products/hydrogeology/permeability.html, 11 October 2011. Foster S S D. 1998. Groundwater recharge and pollution vulnerabiloity of British aquifers: a critical review. In Robins N S (ed.) Groundwater Pollution, Aquifer Recharge and Vulnerability. Special Publications, 130, Geological Society, London, 7-22. Lawley R and Garcia-Bajo M. 2009. The National Superficial Deposit Thickness Model (version 5). British Geological Survey Internal Report OR/09/049. MacDonald A M, Ball D F and Ó Dochartaigh B É, 2004. A GIS of aquifer productivity in Scotland: explanatory notes. BGS Commissioned Report CR/04/047N. Ó Dochartaigh B É, Ball D F, MacDonald A M, Lilly A, Fitzsimons V, del Rio M and Auton C A. 2005. Mapping groundwater vulnerability in Scotland: a new approach for the Water Framework Directive. Scottish Journal of Geology 41 (1), 21-30. Ó Dochartaigh B É, Doce D D, Rutter H K and MacDonald A M. 2011. User Guide: British Geological Survey Aquifer Productivity (Scotland) GIS datasets, Version 2. BGS Internal Report OR/11/065. US National Research Council. 1993. Groundwater vulnerability assessment: predicting relative contamination under conditions of uncertainty. National Research Council (US) Committee on Techniques for Assessing Groundwater Vulnerability, National Academy Press. 10 OR/11/064 Appendix 1 Detail of amendments to input datasets compared to Version 1 The input datasets used to produce Version 2 of the groundwater vulnerability dataset are listed and described briefly in Table 2. More detail on how they have been amended from Version 1 of the groundwater vulnerability dataset is given here. The derivation/ownership of the input datasets is given in brackets after the name of each dataset. For more detail on the original derivation of these datasets for Version 1, see Ball et al. (2004). DiGMapGB-50 (BGS) o DiGMapGB-50, the Digital Geological Map of Great Britain at 1:50 000 scale, for bedrock and superficial deposits, are the key input datasets. These have been significantly revised since Version 1 of the groundwater vulnerability dataset was produced. Version 5.18 was used during the creation of the vulnerability map. For a few parts of Scotland, DiGMapGB-50 is not available for superficial deposits, and in these cases, superficial geology data at 1:625 000 scale has been merged in. Permeability of bedrock and superficial geological units (BGS) o This has been taken from the latest versions of BGS’s Permeability Datasets for Great Britain, Version 6 (2010) for bedrock and superficial deposits, which have been revised since Version 1. These datasets define both a minimum and a maximum permeability for each geological formation to encompass the likely range of permeability for any one formation, both because of the natural heterogeneity of geological formations (e.g., the presence of siltstone or mudstone bands within a dominantly sandstone sequence), and because of the lack of measured permeability data available for most formations, and therefore the uncertainty in ascribing a single permeability value. For the purposes of the vulnerability assessment, a cautionary approach was taken in that the maximum possible permeability is the most relevant, since this defines the worst case scenario in terms of groundwater vulnerability. o For the purposes of the vulnerability map, a small number of changes were made to the bedrock permeability classifications in the latest version of BGS’s Permeability Dataset for Great Britain, in those cases where new information (e.g. from test pumping) has become available since the dataset was last revised, or where errors were noted. o The superficial deposits permeability classifications in the latest version of BGS’s Permeability Dataset for Great Britain have been used directly in the production of the groundwater vulnerability dataset, with no changes. A number of classifications in this dataset are recognised as being potentially wrong on a local scale, either because of the level of available detail and accuracy in the geological mapping, or because of the natural heterogeneity of geological formations, in particular superficial deposits. As has been discussed in the user notes for the associated aquifer productivity maps (Scotland) (Ó Dochartaigh et al. 2011), classifying superficial deposits aquifers on a national scale is subject to much uncertainty, and must of necessity involve simplification, generalisation and therefore the masking of local variations. Because this groundwater vulnerability dataset is also made on a national scale, it is accepted that the same approach of simplification must be made. These points in particular, however, are made: The permeability of superficial deposits refers only to the superficial deposits mapped at the ground surface. The permeability of any different superficial deposits at depth in the superficial deposits sequence has not been taken into 11 OR/11/064 account, EXCEPT where it is known that at least 5m thickness of clay exists within the sequence. The permeability of superficial deposits has been used both to help define the productivity of superficial deposits aquifers, and as an input into the groundwater vulnerability map in its own right. However, aquifer permeability and productivity are different things, so that, for example, geological formations may have high permeability but do not form productive aquifers (perhaps because they are too thin or of too small a lateral extent). There is not necessarily a direct relationship between high permeability and high aquifer productivity. For Version 1 of the groundwater vulnerability dataset, much focus was put into the subdividing of till deposits according to their likely permeability. This approach has been simplified for Version 2. For Version 1, the permeability of till deposits was subdivided using HOST and supporting soil parent material data to define three till subclasses: highly permeable tills (derived from Precambrian rocks and classed as local aquifers); moderately permeable tills (derived largely from Devonian sandstones in Strathmore); and low permeability tills (largely derived from Carboniferous sedimentary rocks in central Scotland) (Ball et al. 2004). This approach has been revised partly because it is no longer thought that any tills are highly permeable, and partly because of the level of available detail and accuracy in superficial deposits mapping. Superficial deposits were historically often mapped in less detail and/or with less precision than bedrock formations. The level of detail and accuracy in the current maps of glacial deposits mean it is not possible to accurately distinguish between till, moraine, and hummocky/moundy glacial deposits, although recent evidence suggests that moraine is typically significantly more permeable than till. The lithology of most of these glacial deposits is described interchangeably as diamicton or some mix of diamicton, silt, clay, sand and gravel. Because of this, the permeability of all has been classed as ranging from low (minimum) to moderate (maximum). Only in areas which have been remapped using modern techniques are the lithologies of these deposits described in more detail, for example where hummocky/moundy glacial deposits are described as comprising gravel and sand only, and these deposits are classed as having high permeability. In Version 1, till was treated separately from moraine and hummocky/moundy deposits, but this set up a false division between mapped ‘till’ and ‘moraine’, which in reality cannot be distinguished. It therefore also gave a false impression of the accuracy of the map. To promote consistency as well as transparency, and given this available level of detail and accuracy in the available geological mapping, for Version 2 of the groundwater vulnerability dataset the permeability of all glacial deposits, as for all other superficial deposits, has been taken directly from the latest version of the BGS Permeability Dataset of Great Britain (Version 6, 2010). Soil permeability (James Hutton Institute (formerly the Macaulay Institute)) o Soil permeability derived from HOST data was used to refine the vulnerability classification for areas where BGS maps show no superficial deposits. Where no superficial deposits are mapped and the HOST classes is one of 9, 16, 18, 24, 26, 28 or 29, which all refer to low permeability soils, the vulnerability classification is reduced. 12 OR/11/064 Soil thickness (James Hutton Institute (formerly the Macaulay Institute), BGS) o Soil thickness, derived from HOST data in combination with superficial deposits mapping, was used to distinguish areas where essentially bare rock is exposed at the ground surface. Where the HOST class is either 22 or 27, which both refer to very thin soils, the vulnerability classification is increased. Depth to groundwater level in superficial deposits (BGS) o An updated map of depth to groundwater in superficial maps has been produced for Version 2 of the groundwater vulnerability map, using updated input data. This map is based primarily on a surface representing the depth from ground level to the river base level, which is modelled based on a digital terrain model (DTM) and the locations of major rivers. This surface is termed the River Head Space (Bloomfield et al. 2007). It was recreated for Version 2 using the NextMap DTM (instead of the Ordnance Survey DTM used for Version 1). The same digital river network, from SEPA, was used as for Version 1. The River Head Space surface was converted to a vector file with four depth to groundwater classes: <3m; 3-10m; 10-30m and >30m. o This was then combined with HOST soils data which show soils where the groundwater table is <2m (taken as HOST classes 10 and 12), including these areas in the River Head Space <3m category. Where the HOST data show the water table is <2m and the River Head Space data show it is >3m, the HOST data takes precedence and the final classification is <3m, as the HOST data are based on real observations, while the River Head Space map is based on an unverified model. Depth to groundwater level in bedrock aquifers (BGS) o Depth to groundwater in bedrock aquifers is defined only for aquifers with significant intergranular flow. This has been changed slightly from Version 1 because the bedrock aquifer flow type classifications in the bedrock aquifer productivity map (Ó Dochartaigh et al. 2011) have been updated. Depth to groundwater has been added for one other bedrock aquifer unit, the Glenvale Sandstone Formation west of Dundee, which was previously classed as having mixed intergranular/fracture groundwater flow but has been reclassified as having significantly intergranular flow. Where no groundwater level data are available for a bedrock unit with significantly intergranular flow, the depth to groundwater map defaults to the shallowest category, <3 m, as the conservative scenario (i.e. worst case in terms of groundwater vulnerability). Superficial deposits thickness (BGS) o This dataset is unchanged from Version 1: a version of BGS’s Geohazard interpolated model based on borehole data, which has been manually corrected by Quaternary geologists in those areas where no borehole data exist. This combination of modelling and geological knowledge has provide the most realistic superficial deposits thickness model for Scotland at 1:50 000 scale. Presence of thick clays in the superficial deposits sequence (BGS) o This dataset is unchanged from Version 1. 13 OR/11/064 Appendix 2 Methodology used to create vulnerability dataset The groundwater vulnerability dataset was produced in ArcGIS by combining a range of environmental datasets (Table 2). A detailed description of the methodology for developing the groundwater vulnerability Version 1 dataset is given in Ball et al. (2004). This new dataset, Version 2, was produced along largely the same lines, with some small methodological changes to simplify the assessment procedure, but using updated input datasets. The input datasets used to produce Version 2 of the dataset are listed and described briefly in Table 2. More detail on how they have been amended from Version 1 is given in Appendix 1. A rule-based method for combining the various input datasets to define a vulnerability classification has been used, which has been modified only slightly from that used for Version 1. The method is described by a set of scenarios, and a corresponding set of rules (or criteria), which are implemented on the input datasets in turn, depending on whether a particular scenario is true. As each rule is implemented, parts of the map (i.e., polygons in the GIS file) are selected, and these selected polygons are attributed with the relevant vulnerability classification, as shown in a set of tables, which are shown in Appendix 2. Once each rule has been implemented, the polygons already attributed are excluded, and the next rule is implemented. The scenarios considered, and the rules implemented, in order, with the input datasets used for each, are as follows: 1. Superficial deposits at the ground surface are highly permeable, and water table is in the superficial deposits Selection: Polygons where Superficial Deposits Permeability = High or Very High and Superficial Deposits Thickness >= Depth to Water in Superficial Deposits Vulnerability: Attributed according to the values in Table A5 (using the datasets Superficial Deposits Permeability and Depth to Water in Superficial Deposits) 2. Fractured bedrock - superficial cover Selection: (Remaining polygons with) Bedrock Flow type = Fractured, AND superficial deposits are mapped. Vulnerability: If Clay Thickness >= 5m then Vulnerability = 1 (from Table A4) If Clay Thickness < 5m then Vulnerability is attributed according to Table A3 (using Superficial Deposits Permeability and Superficial Deposits Thickness). 3. Fractured bedrock - no cover (no superficial deposits mapped and soil is effectively absent) Selection: (Remaining polygons where) HOST Class = 22 OR 27 AND Bedrock Flow type = Fractured Vulnerability: Vulnerability = 5 (from Table A1) 4. Fractured bedrock - soil cover (no superficial deposits mapped. Subdivided according to soil permeability: low permeability soils reduce vulnerability from 5 to 4a) Selection: (Remaining polygons where) HOST Class IS NOT 22 OR 27, AND Bedrock Flow type = Fractured 14 OR/11/064 Vulnerability: If HOST Class = Group A (Class = 9, 16, 18, 24, 26, 28, or 29) (low permeability soil) then Vulnerability = 4a (from Table A2) Otherwise Vulnerability = 5 5. Intergranular bedrock - superficial cover Selection: (Remaining polygons with) Bedrock Flow type = Intergranular or Mixed, AND superficial deposits are mapped. Vulnerability: If Clay Thickness >= 5m then Vulnerability = 1 (Tables A9, A10 and A11) If Clay Thickness < 5m AND Superficial Deposits Permeability = Very High or High, then Vulnerability is attributed according to Table A9 (using Depth to Water in Bedrock, Bedrock Permeability, and Superficial Deposits Thickness). If Clay Thickness < 5m AND superficial permeability = Moderate, then Vulnerability is attributed according to Table A109 (using Depth to Water in Bedrock, Bedrock Permeability, and Superficial Deposits Thickness). If Clay Thickness < 5m AND Superficial Deposits Permeability = Low or Very Low, then Vulnerability is attributed according to Table A11 (using Depth to Water in Bedrock, Bedrock Permeability, and Superficial Deposits Thickness). 6. Intergranular bedrock with no cover (no superficial deposits mapped and soil is effectively absent) Selection: (Remaining polygons where) HOST Class = 22 OR 27, AND Bedrock Flow type = Intergranular or Mixed Vulnerability: Attributed according to Table A6 (using Bedrock Permeability and Depth to Water in Bedrock) 7. Intergranular bedrock with soil cover; no superficial deposits mapped. Selection: (Remaining polygons where) HOST CLASS IS NOT 22 OR 27, AND Bedrock Flow type = Intergranular or Mixed Vulnerability: If HOST Class = Group A (Class = 9, 16, 18, 24, 26, 28, or 29) (low permeability soil) then Vulnerability is attributed according to Table A8 (using Bedrock Permeability and Depth to Water in Bedrock) Otherwise if HOST Class = Group B (all other HOST classes) (high or moderate permeability soil) then Vulnerability is attributed according to Table A7 (using Bedrock Permeability and Depth to Water in Bedrock) 15 OR/11/064 Appendix 3 Tables for vulnerability classification These tables are used, with the rules in Section 3, to define the assigned vulnerability class for each given combination of input parameters. They have been slightly modified from the tables used to derive Version 1 of the groundwater vulnerability dataset (Ball et al. 2004), as follows: Vulnerability Class 4 has been subdivided throughout into two sub-classes, Class 4a and Class 4b. Class 4a includes areas where superficial deposits have low permeability; Class 4b includes areas where superficial deposits have moderate or high permeability. The tables have been amended to reflect this. Because of this change, one table (the original Table 2) has been removed as no longer needed. The following abbreviations and legend are used in the tables: VH = Very High permeability H = High permeability M = Moderate permeability L = Low permeability n/a = not applicable Vulnerability class: Highest Lowest 5 4a 4b 3 2 1 Table A1 Bedrock Flow Type = Fractured; no soil or superficial deposits mapped (Rule 3) Fractured bedrock, no soil or superficial deposits Fractured bedrock, no soil or superficial deposits 5 Table A2 Bedrock Flow Type = Fractured; soil present; no superficial deposits mapped (Rule 4) Superficial deposits thickness (m) <1 H Soil permeability M L 16 5 5 4a OR/11/064 Table A3 Bedrock Flow Type = Fractured; superficial deposits are mapped, Clay Thickness <5m (Rule 2) Superficial deposits thickness (m) VH or H Superficial deposits permeability at surface M L 1-3 3-10 10-30 > 30 4a 4a 3 2 4a 3 2 1 4b 2 1 1 Table A4 Bedrock Flow Type = Fractured; superficial deposits are mapped; Clay Thickness => 5 m (Rule 2) Superficial deposits thickness (m) Superficial deposits permeability at surface <3 3-10 10-30 > 30 VH or H n/a 1 1 1 M n/a 1 1 1 L n/a 1 1 1 Table A5 Superficial Deposits Permeability at surface = High or Very High; there is a water table in superficial deposits (Superficial Deposits Thickness > Depth to Water in Superficial Deposits) (Rule 1) Depth to Water in Superficial Deposits (m) Superficial deposits permeability at surface VH or H <3 3-10 10-30 > 30 4a 4a 3 2 Table A6 Bedrock Flow Type = Significantly Intergranular fracture/intergranular); no soil or superficial deposits (Rule 6) (including mixed Depth to Water in Bedrock (m) Bedrock permeability 0-3 3-10 10-30 30+ VH or H 5 5 4a 3 M 5 4a 3 3 L 5 4a 3 3 17 OR/11/064 Table A7 Bedrock Flow Type = Significantly Intergranular (including mixed fracture/intergranular); no superficial deposits; high or moderate soils (HOST classes in Group B – see Rule 7) Depth to Water in Bedrock (m) Bedrock permeability 0-3 3-10 10-30 30+ VH or H 5 5 4a 3 M 5 4a 3 3 L 5 4a 3 3 Table A8 Bedrock Flow Type = Significantly Intergranular (including mixed fracture/intergranular); no superficial deposits; low permeability soils (HOST classes in Group A – see Rule 7) Depth to Water in Bedrock (m) 0-3 3-10 10-30 30+ VH or H 4a 4a 3 3 M 4a 3 3 3 L 4a 3 3 3 Bedrock permeability Table A9 Bedrock Flow Type = Significantly Intergranular (including mixed fracture/intergranular); Superficial Deposits Permeability at surface = Very High or High (Rule 5) Depth to Water in Bedrock (m) <10 m 10-30 m >30 m Bedrock permeability High permeability superficial deposits thickness (m) <3 3-10 10-30 >30 =>5m clay in sequence VH or H 4a 4a 3 2 1 M 4a 3 3 2 1 L 4a 3 2 2 1 VH or H 4a 3 3 2 1 M 3 2 2 2 1 L 3 2 2 1 1 VH or H 3 3 2 2 1 M 3 2 2 1 1 L 3 2 1 1 1 18 OR/11/064 Table A10 Bedrock Flow Type = Significantly Intergranular (including mixed fracture/intergranular); Superficial Deposits Permeability at surface = Moderate (Rule 5) Depth to Water in Bedrock (m) <10 m 10-30 m >30 m Bedrock permeability Moderate permeability superficial deposits thickness (m) <3 3-10 10-30 >30 =>5m clay in sequence VH or H 4a 3 2 2 1 M 4a 3 2 2 1 L 3 2 2 1 1 VH or H 4a 3 2 2 1 M 3 2 2 2 1 L 3 2 1 1 1 VH or H 3 2 2 2 1 M 3 2 2 1 1 L 3 1 1 1 1 Table A11 Bedrock Flow Type = Significantly Intergranular (including mixed fracture/intergranular); Superficial Deposits Permeability at surface = Low (Rule 5) Depth to Water in Bedrock (m) <10 m 10-30 m >30 m Bedrock permeability Low permeability superficial deposits thickness (m) <3 3-10 10-30 >30 =>5m clay in sequence VH or H 4b 2 1 1 1 M 4b 2 1 1 1 L 3 2 1 1 1 VH or H 3 2 1 1 1 M 3 2 1 1 1 L 3 1 1 1 1 VH or H 3 2 1 1 1 M 3 1 1 1 1 L 3 1 1 1 1 19