1
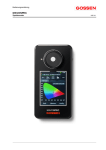
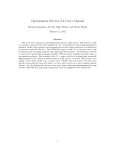
Leading suppliers of innovative
analytical instrumentation to the
UK and Ireland
World leading providers of
innovative and reliable spectral
light measurement solutions
GL OPTIC SPECTIS 1.0 TOUCH:
QUICK START USER GUIDE
Thank you for choosing the GL Optic SPECTIS 1.0 touch.
The GL SPECTIS 1.0 touch is an easy-to-use tool for fast and accurate photometric characterisation of next
generation and conventional light sources.
To help you get started, we have put together this quick start user guide to present the light measurement
functions of the SPECTIS 1.0 touch.
Contents
1. Why choose the SPECTIS 1.0 touch? ……………………………………………………………………………………………………………..2
2. SPECTIS 1.0 touch modular system ................................................................................................................. 2
3. Measuring light with the SPECTIS 1.0 touch .................................................................................................... 2
4. SPECTIS 1.0 touch equipment ......................................................................................................................... 3
5. Out of the Box ................................................................................................................................................ 4
5.1 Background Calibration and Taking a Reading ........................................................................................... 4
6. Spectrum screen ............................................................................................................................................. 5
7. Results screen ................................................................................................................................................. 5
8. CIE Chart screen.............................................................................................................................................. 6
9. Data screen..................................................................................................................................................... 7
10. Manage multiple readings ............................................................................................................................ 7
10.1 Record another SPD measurement ......................................................................................................... 7
10.2 Viewing SPD measurements ................................................................................................................... 8
10.3 SPD measurement data file format ......................................................................................................... 8
10.4 Accessing past readings .......................................................................................................................... 9
11. Settings screen ............................................................................................................................................. 9
12. Appendix 1: How is the SPECTIS 1.0 touch different to a lux meter? ........................................................... 10
13. Appendix 2: Technical specifications ........................................................................................................... 11
Page 1 of 11
© Analytik Ltd/GL Optic – all rights reserved
www.analytik.co.uk
www.gloptic.com
GL SPECTIS 1.0 touch - Quick Start User Guide
1. WHY CHOOSE THE SPECTIS 1.0 TOUCH?
Recent leaps in lighting technology innovation have brought a new generation of LED-based luminaire to
market for homes, offices, factories, vehicles, roadways, communications and more. LED lighting is now more
available and cost effective than ever before, with regular technological developments driving innovation in
old and new markets. The SPECTIS 1.0 touch is a result of these market shifts and technological innovations, an
answer to the need for a new level of sophistication in design and manufacture workflows.
Getting the best performance from your LED product is the ultimate aim of luminaire design; choosing the
right office lighting can save energy, create a pleasant work environment and help comply with health and
safety legislation; and quickly mapping designed light environments can speed up project delivery and make
choosing the right light source fast and easy. All of these tasks and more are covered by the SPECTIS 1.0 touch.
Lighting professionals need to know that the light output, colour quality and lifetime performance of their light
sources meet expectations for the intended use. Meeting those standards is achieved through simple quality
assurance and testing routines. GL Optic’s SPECTIS 1.0 touch is designed to make light testing fast, easy and
flexible, with laboratory-grade standards for accuracy, precision and consistency.
2. SPECTIS 1.0 TOUCH MODULAR SYSTEM
The SPECTIS 1.0 touch aims to combine lab-grade photometry with an intuitive user interface design.
You have a portable light laboratory in the palm of your hand – an efficiently packed configuration with
miniaturised nano-imprint diffraction grating, collimating mirrors, stray light baffles, temperature sensors,
CMOS detector, on-board computation, 4Gb flash memory, wireless communication and touch-screen display.
Each unit, accessory and sphere receives factory calibration to international laboratory standards for absolute
accuracy and the rugged metal casing protects it during everyday use in production environments, lighting labs
and in the field. Regular check-up and re-calibration services extend the GL Optic warranty up to 5 years after
purchase, so you can always be sure that your data is accurate and reliable .
Hot-swap attachments – GL OPTI PROBE and GL OPTI SPHERES – are available to measure luminance (cd/m2 or
nits) and luminous flux (lumens) for light sources of any size. Quickly change measurement heads by unscrewing the standard diffusor head from the SPECTIS 1.0 touch and re-attaching a new one or combine the
SPECTIS 1.0 touch with an integrating sphere of any size. The SPECTIS 1.0 touch automatically detects the type
of measurement accessory attached and loads the correct calibration file.
Light source and luminaire testing with the SPECTIS 1.0 touch and GL SPECTROSOFT Pro software can deliver
fully comprehensive, modular photometric testing capabilities to any company. GL Optic have a wide range of
probe attachments, integrating spheres, gonio-systems, TEC chip temperature controllers and power
supply/monitoring equipment available.
3. MEASURING LIGHT WITH THE SPECTIS 1.0 TOUCH
The standard measurement attachment head included with the SPECTIS 1.0 touch is the standard diffusor, a
class B cosine corrected light collector according to German DIN 5032-7 standards. Light is collected from a
180⁰ (2π) hemisphere above the sensor and delivered through an aperture to the diffraction grating, mirrors
and sensor. The 256 pixel CMOS image sensor records the light power in mW at ~1.7nm intervals along the
Page 2 of 11
© Analytik Ltd/GL Optic – all rights reserved
www.analytik.co.uk
www.gloptic.com
GL SPECTIS 1.0 touch - Quick Start User Guide
light spectrum from 340nm to 750nm, spanning our whole perceptual range (~400-700nm) and extending
either side into the ultraviolet and infrared portions of the spectrum.
The known collection area of the measuring head (1cm diameter white disc) allows the SPECTIS 1.0 touch to
calculate the light power per wavelength per unit area. From the human light sensitivity curve (photopic Vlambda curve), we know the exact perceptual sensitivity of the human eye at each point along the recorded
spectrum. Knowing the light power per area at each wavelength and the human light sensitivity curve gives us
the illuminance lux value at the surface of the measuring head.
We can calculate an exact lux value using established CIE (International Commission on Illumination)
calculation algorithms and the recorded high-resolution spectral power distribution (SPD) sensor data. This
‘radiometric’ data is also used to exactly calculate other photometric the colour correlated colour temperature
(CCT), colour rendering indices (CRI, R1-R14), metamerism indices, co-ordinates of the light, colour peak and
more. All available photometric parameters can be calculated in GL SPECTROSOFT v3.0 using radiometric data
recorded with the SPECTIS 1.0 touch. Spectral analysis for binning, pass/fail testing, colour quantification and
reporting is fast, easy and intuitive.
4. SPECTIS 1.0 TOUCH EQUIPMENT
The SPECTIS 1.0 touch includes
•
•
•
GL Optic SPECTIS 1.0 touch unit
1.
Diffusor measuring head
The SPECTIS 1.0 touch comes with a cosine-correcting diffusor measurement head to collect light
from a 180⁰ hemisphere in front of the sensor.
2.
Power / Measure / Back button
This button has three functions:
Cosine correcting light diffusor measuring head for lux / CCT / CRI / R1-R14 / colour coordinates
4Gb SD card for auto-saving spectral power distribution (SPD) readings
•
•
•
Initiates a measurement reading when pressed once
Functions as the ‘Back’ button for the Android operating system when navigating menus
Powers on/off the unit by holding it for three seconds
3.
Display
Pressure-sensitive, 3.2” colour LCD screen for data display and navigation. At the top of the screen
you can see the time, battery power and Wi-Fi connection status. Dragging down from the top of the
screen will reveal the accessory code of the current attachment and the date.
4.
4GB SD card slot
4Gb micro SD card for data storage. Every measurement is auto-saved to the SD card for later analysis
or export.
Page 3 of 11
© Analytik Ltd/GL Optic – all rights reserved
www.analytik.co.uk
www.gloptic.com
GL SPECTIS 1.0 touch - Quick Start User Guide
5.
Mini USB port
Mini USB connection for data transfer, battery charging and direct control of the unit through
SPECTROSOFT.
5. OUT OF THE BOX
The GL Optic SPECTIS 1.0 touch is ready to go out of the box. To turn on the unit, press and hold the Power /
Measure / Back button.
The unit will power up and the Android-based SPECTROSOFT operating system will boot up and display the
home screen (Figure 1).
Figure 1: Home screen – Access data, results,
file library and configuration settings
5.1 BACKGROUND CALIBRATION AND TAKING A READING
The SPECTIS 1.0 touch is factory-calibrated to a NIST-traceable light source, ensuring absolute accuracy in
every reading. The on-board temperature noise compensation adds extra accuracy to your readings and
requires calibration before use to establish the zero baseline.
Press the Config button at the bottom right of the home-screen. Here you also have options to adjust the
integration time, set multiple repeat readings or input the flicker frequency of your light source. Ticking the
‘Auto’ box lets the SPECTIS 1.0 touch set these levels automatically (recommended).
Take a background calibration reading by pressing the Background calibration button and following the
instructions; place the cap on the cosine corrector attachment and press ‘Accept’. The unit will run through its
calibration procedure and ask if you would like to apply the background calibration.
Once your SPECTIS 1.0 touch is calibrated, take a spectral power distribution (SPD) reading, press the button at
the side of the unit or press the Measure button at the bottom of the screen. Data is saved automatically to
the SD card with a filename based on the date and time of the reading (prefix m, then yymmdd-hhmmss).
Press the button again to take another reading. SPD readings taken on the same day are automatically saved in
the same directory folder (see “Manage multiple readings” section below). Switch between readings in the
Page 4 of 11
© Analytik Ltd/GL Optic – all rights reserved
www.analytik.co.uk
www.gloptic.com
GL SPECTIS 1.0 touch - Quick Start User Guide
same directory folder (taken on the same day) by pressing the left and right arrow icons at the top of the
screen.
6. SPECTRUM SCREEN
Once you take a reading, you see a graph of your recorded spectral power distribution, with the wavelength in
nm on the x-axis and power in mW/m2 on the y-axis.
At the top of the chart you can see the calculated values for lux (Y), correlated colour temperature (CCT) and
colour rendering index average (Ra) of your light source.
Figure 2: Spectrum screen – View the SPD plot
for your light source.
x-axis = wavelength nm, y-axis = power mW/m2
Lux, colour temperature and colour rendering
index are displayed above the graph. Filename
is at the top of the screen.
7. RESULTS SCREEN
Photometric calculations derived from your recorded SPD are shown on the Results screen (Figure 3).
Access the Results screen by pressing the middle icon at the top of the screen or pressing the Results button
on the Home Screen.
The photometric parameters calculated by the SPECTIS 1.0 touch are:
•
•
•
•
•
•
CIE 1931 2⁰ x y chromaticity coordinates
Lux level Y
Correlated colour temperature CCT
Colour peak wavelength
Colour rendering index average Ra
Colour rendering indices R1-R14
You can choose which parameters are displayed and the font size by long-pressing on any value to access the
configuration menu.
Page 5 of 11
© Analytik Ltd/GL Optic – all rights reserved
www.analytik.co.uk
www.gloptic.com
GL SPECTIS 1.0 touch - Quick Start User Guide
Complete photometric parameter calculation requires the GL Optic SPECTROSOFT v3.0 PC software.
SPECTROSOFT can calculate all relevant photometric parameters, compare and explore SPD readings, bin LEDs,
output customisable reports and more.
Figure 3: Results screen – View critical
photometric results for you light source.
Change what values are shown and the font
size by long-pressing on any value.
8. CIE CHART SCREEN
The CIE 1931 xy, CIE 1960 uv and CIE 1976 u’v’ colour space charts are viewed by pressing the colour space
icon at the top of the screen or the CIE Chart button on the Home screen (Figure 1). There is a tab for each
separate CIE colour space.
The chromaticity coordinates of your light source are displayed, along with a cross showing where in the
colour space those coordinates lie. The faint curved line across the middle of the colour charts is the Planckian
/ black body locus of white light at different colour temperatures.
Figure 4: CIE 1931 Colour chart – The colour
position of the light source is plotted on each
chart.
Page 6 of 11
© Analytik Ltd/GL Optic – all rights reserved
www.analytik.co.uk
www.gloptic.com
GL SPECTIS 1.0 touch - Quick Start User Guide
9. DATA SCREEN
The individual radiometric data points of your spectral power distribution can be viewed by pressing the Data
button on the Home screen (Figure 1).
The wavelength column (Waves) gives the recorded wavelength of light in nm. The data points presented are
native, not interpolated, hence the exact wavelengths measured depends on the physical geometry of the
SPECTIS 1.0 touch design and cannot be altered. Interpolation to give 1nm, 2nm and 5nm data point SPDs is
available in GL SPECTROSOFT v3.0.
The value column (Values) gives the radiometric power per unit area (mW/m2) at each wavelength the diffusor
attachment for lux measurement attached.
The SI-derived radiometric unit of the value column depends on the type of measurement accessory head
attachment:
•
•
•
The diffusor attachment for lux measurement (illuminance) records data in mW/m2/nm.
(Radiometric irradiance)
2
The GL OPTI PROBE attachment for nits measurement (luminance) records data in cd/m /nm.
(Radiometric radiance)
The GL OPTI SPHERE 48 for single-LED lumen output measurement (luminous flux) records data in
mW/nm. (Radiometric radiant flux)
Integrating sphere-based luminaire testing for lumen output records data in mW/nm. (GL OPTI SPHERE 205,
GL OPTI SPHERE 500, GL OPTI SPHERE 1100 and GL OPTI SPHERE 2000).
Figure 5: Data screen – view individual
radiometric data point values
10. MANAGE MULTIPLE READINGS
10.1 RECORD ANOTHER SPD MEASUREMENT
To take another reading, press the side-button or the on-screen Measure button. Your new SPD measurement
will be saved to the memory card.
Page 7 of 11
© Analytik Ltd/GL Optic – all rights reserved
www.analytik.co.uk
www.gloptic.com
GL SPECTIS 1.0 touch - Quick Start User Guide
You can access all readings stored on the memory card by pressing the Library button on the Home screen
(Figure 1). You will first see a list of all the readings taken on the same day. Press the Directories folder at the
top of the list to navigate up a level and see all available directory folders on the memory card.
All readings taken on the same day are grouped together in the same directory folder, named with the current
date as yyyy-mm-dd. Data files are auto-saved with a filename based on the time and date that the reading
was taken: prefix m for measurement, followed by the date and time as yymmdd-hhmmss.
Figure 6: Library screen – Each folder
contains readings taken on one day
10.2 VIEWING SPD MEASUREMENTS
Pressing once on a measurement file opens the Spectrum SPD chart for that reading.
From the Spectrum screen (Figure 2) you can press the Results and CIE Chart icons at the top to see the
photometric results (Figure 3) and chromaticity charts (Figure 4) for that reading.
Cycle between readings taken on the same day (all in the same directory folder) by pressing the left and right
arrow icons at the top of the screen.
Pressing the Back button takes you back to the list of that day’s measurements.
Long-pressing on a measurement filename opens a pop-up menu to access any of the measurement
information screens (Spectrum, Results, CIE Chart, and Data) and also to Rename or Delete the file. [Tip: press
the measurement button on the side to exit the menu]
10.3 MEASUREMENT DATA FILE FORMAT
Files are stored on the SD card in a .mmg format, designed to be opened in GL SPECTROSOFT PC software for
further photometric analysis.
Each .mmg file contains recorded native data points (accessible on the Data screen) and photometric
calculations (available on the Results screen), along with status information relevant to the measurement, for
example the time and date, background temperature, hardware serial numbers and configuration settings.
Page 8 of 11
© Analytik Ltd/GL Optic – all rights reserved
www.analytik.co.uk
www.gloptic.com
GL SPECTIS 1.0 touch - Quick Start User Guide
Though .mmg files are designed to be opened and interpreted by GL SPECTROSOFT, they follow the XML
markup language format and can be opened in any XML-compatible program, for example Microsoft Excel. The
raw data is there, along with meta-data on the status on the unit itself.
You can access the SPECTIS 1.0 touch memory card by connecting the unit to a PC via USB cable. You must
activate USB storage mode on the SPECTIS touch to make the SD card appear as an external drive on your PC.
To activate USB storage mode, drag down from the top of the screen where the battery icon and time are
located. Press ‘USB Connected’ and then ‘Turn on USB storage’ to make the SD card appear as an external
drive. Data files are located in the ‘measurements’ folder.
10.4 A CCESSING PAST READINGS
To access past days’ readings press the Directories button at the top of the screen above the list of
measurement files.
Each directory folder contains all the measurement files recorded in one day and is labelled with the date in
yyyy-mm-dd format. The number in brackets is the number of measurement files in that folder.
Long-pressing on a directory filename opens a pop-up menu to rename the directory folder, delete the
directory folder, or create a new directory folder.
11. SETTINGS SCREEN
The settings screen has options to access internal information and settings for the SPECTIS 1.0 touch. When
navigating settings sub-menus, press the measurement button on the side to go back to the main settings
screen.
•
Battery shows the remaining battery level and gives the percentage charge left. On all screens you
can gauge the battery charge level by the thin yellow line near the top of the screen.
•
Wi-Fi accesses the Android OS Wi-Fi settings for the SPECTIS 1.0 touch. Here you can turn the Wi-Fi on
and off and connect to any local Wi-Fi networks (you may be prompted for a password).
Wi-Fi connection allows remote data transfer and trigger control when a PC running GL SPECTROSOFT
is connected to the same Wi-Fi network.
•
Idle time lets you set a no-activity time limit before the SPECTIS 1.0 touch automatically turns itself
off to save power. You can set the timer to 5, 10, 15 or 30 mins.
•
Date/Time lets you set the date and time information on the SPECTIS 1.0 touch, or allow it to auto-set
those values using Wi-Fi network provided values.
•
Status displays relevant information about the SPD measurement you last viewed, for example the
time and date, background temperature, hardware serial numbers and configuration settings. Status
information is saved in XML format in the SPD data file on the SD card.
•
Power off turns the SPECTIS 1.0 touch off.
Page 9 of 11
© Analytik Ltd/GL Optic – all rights reserved
www.analytik.co.uk
www.gloptic.com
GL SPECTIS 1.0 touch - Quick Start User Guide
12. APPENDIX 1: HOW IS THE SPECTIS 1.0 TOUCH DIFFERENT TO A LUX METER?
First, we should answer what is a lux meter and what information does it provide?
Traditionally, going back to Edison’s light bulb, artificial lighting was produced by heating something to very
high temperatures. Blackbody-like radiation, such as from the white-hot filament of a light bulb, has a
characteristic emission of light wavelengths that our eye perceives as ‘white’ light. Some blue light is emitted
and emission power rises up through yellow, green, orange, red and on to infra-red beyond our perception.
The combination of how much light at each wavelength is emitted is interpreted by our visual system as
‘white’.
The brightness and colour quality of this incandescent light depends on how hot you heat a given material,
shifting the emission toward blue and changing the emission profile. This produces the warm-white orange
glow of a 100W Edison light bulb (~3500K), or the cool blue-white crispness of a xenon halogen bulb (~6000K).
The xenon bulb emits more blue light than the Edison light bulb and our eyes perceive that difference as a
change in light quality.
Lux meters and colorimeters tell us how bright or what colour we would perceive a light to be. Human light
perception sensitivity varies across the spectrum from 300nm blue light up to 700nm red light, based on the
retina’s blue-, green- and red-sensitive cone cells. We are most sensitive to 555nm green light, for example.
Lux meters and colorimeters calculate a perceptual photometric value that reflects this fact, rather than simply
the physical light energy radiometric value. We get a more accurate idea of our actual perception of a light
source, not just the physical spectral properties.
They come in various designs and underlying technologies – photodiodes, bandpass filters and selenium cells,
for example – but generally are designed for and calibrated with hot, incandescent, blackbody light sources. To
account for the difference in wavelength sensitivity between the human eye and the lux meter’s light sensor
components, a correction factor or algorithm is often applied to the sensor’s raw radiometric data to adjust for
the correct perceptual brightness or lux level.
The correction factor converts the light power signal received from the sensor to a close approximation of how
our eyes would perceive the same light power spectrum. The sophistication in design, calibration and data
correction factors involved can all vary and impact on the cost, accuracy of the lux meter. Some models of lux
meter have a switch to choose between the type of incandescent light source you’re measuring, which applies
different calibrated correction factors to the sensor data. Manufacturers usually give an f1’ percentage value in
the tech specs of a lux meter to indicate the uncertainty from the true lux value, as the correction factor is
never perfect.
LEDs work differently, though, as LEDs are not incandescent light sources. They operate on fundamentally
different principles and the equipment needed to accurately measure their photometric properties is
fundamentally different too. Using conventional lux meters and colorimeters with LED lighting can lead to
errors of up to 25%, making proper design testing and quality assurance impossible. Lux meters assume you
are testing an incandescent source of some sort, so the correction factors will be inaccurate.
Even worse, LEDs are particularly ‘peaky’ light sources, with strong blue components driving green-red
emission from phosphors, compared to incandescent sources which emit little blue light at all then increasingly
more light power as the wavelength increases. Conventional lux meters just can’t measure these types of light
sources accurately as the spectrum of light emitted from an LED looks totally different from an incandescent
source, even if they appear the same to our eyes.
Page 10 of 11
© Analytik Ltd/GL Optic – all rights reserved
www.analytik.co.uk
www.gloptic.com
GL SPECTIS 1.0 touch - Quick Start User Guide
A spectroradiometer is the best equipment to quickly and accurately record and manipulate light power data
to derive photometric information, for both next generation LED lighting and traditional lighting technologies
too. Rather than applying a correction factor to one number (the signal from a lux meter sensor), we can
accurately measure the light power at many points through the spectrum from blue to red. Using established
CIE photometric definitions and algorithms, we can use the light power data – the spectral power distribution
– to calculate exact values for any photometric parameter, such as lux, colour temperature, metamerism
indices and rendering indices.
At its heart the SPECTIS 1.0 touch is a calibrated spectroradiometer, the sort of equipment that only large light
testing laboratories could afford and operate ten years ago, with design and calibration standards traceable to
Russia’s VNOIFFI physical standards institute. Taking advantage of innovations in optical component
miniaturisation, intelligent hardware design and modern software principles, GL Optic made the SPECTIS range
of light instrumentation to cater to the large and growing market of lighting professionals.
The accuracy and reliability of real spectrometers far exceed even the best conventional lux meter and
colorimeter instrumentation. Until now, these capabilities were only available to the largest light testing
laboratories, lighting manufacturers and optical scientists. Now they’re available to all lighting professionals at
a fraction of the cost, at just the right time to take advantage of an explosion in LED uptake and application
development.
13. APPENDIX 2: TECHNICAL SPECIFICATIONS
Technical data
Spectral range
340-750nm / 640-1100nm
Detector
CMOS image sensor
Number of pixels
256
Physical resolution
~ 1.7nm / ~ 1.8nm
Wavelength reproducibility
0.5nm
Integration time
5ms to 100s
A/D conversion
16 bits
Signal to noise ratio
1000:1
Stray light
2*10E-3
Spectroradiometric accuracy
4%
Measurement uncertainty of colour coordinates (x.y)
0.0015
Page 11 of 11
© Analytik Ltd/GL Optic – all rights reserved
www.analytik.co.uk
www.gloptic.com