1
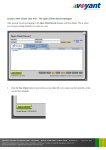
Technical User Guide for Advisers Guide published @ 09/2011 Table of Contents Introduction................................................................................................................................................................. 4 Part 1 – How Market Assumptions work in The Tool ................................................................................................ 5 Asset Classes ............................................................................................................................................................ 5 What is the eValue FE CAP:LinkTM model? ........................................................................................................... 5 eValue FE Market Assumptions .............................................................................................................................. 6 Taxes and Charges Assumptions.............................................................................................................................. 7 Alternative Market Assumptions.............................................................................................................................. 7 Asset Allocation ....................................................................................................................................................... 8 Performance Slider ................................................................................................................................................. 12 Efficient Frontier and Optimised Potfolios ............................................................................................................ 14 Monte Carlo Probability Simulation ...................................................................................................................... 15 Part 2 – Important considerations when using The Tool .......................................................................................... 17 eValue FE market assumptions – 15 year term ...................................................................................................... 17 Charges................................................................................................................................................................... 17 Tax ......................................................................................................................................................................... 17 Market Assumption ranges..................................................................................................................................... 17 Part 3 – Importing Alternative Market Assumptions into The Tool ......................................................................... 19 Features Disabled when Using Alternative Market Assumptions .......................................................................... 19 Two Options for Adding Alternative Market Assumptions to the tool .................................................................. 20 Two Options for Adding Alternative Market Assumptions to the tool .................................................................. 21 Define Asset Classes and Returns in a Market Assumptions File .......................................................................... 21 How to Format a Market Assumptions File ........................................................................................................... 22 How to Manually Load a Set of Customised Market Assumptions into the tool ................................................... 23 How to Provide a Preferred Set of Market Assumptions to Voyant for Inclusion in a White Labelled/Rebranded Version of the Software ........................................................................................................ 29 Part 4 – Adding Asset Allocations to The Tool ........................................................................................................ 30 How to Create and Load Asset Allocations into the tool Manually ....................................................................... 30 How to Provide Asset Allocation to Voyant for Inclusion in a White Labelled/Rebranded Version of the Software ........................................................................................................................................................... 32 Part 5 – Updates to Market Assumptions and Asset Allocations .............................................................................. 33 Updates to eValue FE data ..................................................................................................................................... 33 TECHNICAL USER GUIDE correct @ 10/2010 Voyant, Inc. proprietary information which is privileged, confidential, or subject to copyright belonging to Voyant, Inc. Use of this information is solely for the recipient of this document. Voyant, Inc. 2010 2 Updates to Alternative Market Assumptions ......................................................................................................... 33 Updates to Asset Allocations (including the eValue FE Optimised Portfolios) ..................................................... 33 Part 6 – Further Information ..................................................................................................................................... 35 Annuity rates: ......................................................................................................................................................... 35 Interest and Dividends: .......................................................................................................................................... 35 Contributions and Expenses: .................................................................................................................................. 35 Tax and NI: ............................................................................................................................................................ 36 IHT and Trusts: ...................................................................................................................................................... 36 Monte Carlo Simulation: ........................................................................................................................................ 36 Preferences > Default Inflation / Growth Rates: .................................................................................................... 37 Part 7 – Glossary ....................................................................................................................................................... 38 Monte Carlo Probability: ........................................................................................................................................ 38 Optimised Portfolio: ............................................................................................................................................... 38 Standard Deviation: ................................................................................................................................................ 38 TECHNICAL USER GUIDE correct @ 10/2010 Voyant, Inc. proprietary information which is privileged, confidential, or subject to copyright belonging to Voyant, Inc. Use of this information is solely for the recipient of this document. Voyant, Inc. 2010 3 Introduction The purpose of this guide is to provide a technical overview of the Voyant cash flow tool highlighting the differences from the standard Voyant tool and the Voyant tool where access is supplied by Elevate. It also highlights particular features that may be useful when using the tool. Within this guide all references to the tool are to the version of the Voyant cash flow tool where access is provided by Elevate, unless otherwise indicated. Neither AXA nor Elevate is responsible for the tool, its availability or its performance. You should ensure that you have read and understood this guide before using the tool, especially Part 2 – Important considerations when using Voyant cash flow tool. The tool is designed to enhance your client’s understanding of and engagement with financial decision-making through a collaborative approach. It will provide Elevate users with cash flow modelling, needs analysis and goal planning combined in one interactive tool. It also has the ability to build 'what if' scenarios and demonstrate the impact of life events. The tool has been customised to include market assumptions provided by eValue FE which are consistent with the optimised portfolios suggested on the Elevate platform. You do, however, have the option to put your own market assumptions in the tool. eValue FE is a global professional services firm with expertise in the areas of risk and capital management with offices around the world. They are a global leader in risk technology for the insurance industry and their Global CAP:LinkTM model has been used by several hundred institutions for over 15 years. TECHNICAL USER GUIDE correct @ 10/2010 Voyant, Inc. proprietary information which is privileged, confidential, or subject to copyright belonging to Voyant, Inc. Use of this information is solely for the recipient of this document. Voyant, Inc. 2010 4 Part 1 – How Market Assumptions work in the Tool This section details how market assumptions work in the tool. Market assumptions are assumptions for investment returns for specific asset classes. Asset Classes The tool defaults to the following six asset classes. It is these asset classes for which eValue FE provide market assumptions and are used in the optimised portfolios suggested on the Elevate platform. Cash Property Fixed Interest UK Equity Developed Markets Equities Emerging Markets Equities Deposit based investments that pay interest held with institutions such as banks and building societies. Commercial property being offices, warehouses and shops. Investments that pay a fixed income such as bonds offered by the government or corporations. Shares in companies listed on the UK Stock Exchange. Shares in companies on stock exchanges outside the UK. The countries involved will have high standards of control and regulation such as the US, Europe and Australia. Shares in companies listed on stock exchanges outside the UK. The countries involved will generally be fast growing and may have a less mature market structure for trading of stocks and shares. The market assumptions are used in the eValue FE CAP:LinkTM model. You are also able to create your own market assumptions for the asset classes above and add further asset classes for use in the tool. If you do this then the tool will not be consistent with the eValue FE CAP:LinkTM model. What is the eValue FE CAP:LinkTM model? eValue FE run and maintain a model called CAP:LinkTM which is used to project multiple simulations of equally likely future economic market projections. The model is “stochastic” because it produces lots of equally likely scenarios rather than a single “deterministic” forecast. The model is driven by many assumptions which are set by eValue FE and are revised at least quarterly. Each simulation of the CAP:LinkTM model is a potential economic scenario. For each scenario, the projected investment returns for the next 50 years are produced for each of the six asset classes. eValue FE run the CAP:LinkTM model to give 1000 equally likely simulations of the projected returns for each asset class. TECHNICAL USER GUIDE correct @ 10/2010 Voyant, Inc. proprietary information which is privileged, confidential, or subject to copyright belonging to Voyant, Inc. Use of this information is solely for the recipient of this document. Voyant, Inc. 2010 5 It is this “stochastic” data that is used in the Monte Carlo probability simulation. eValue FE Market Assumptions Whilst the CAP:LinkTM model is stochastic, the outputs from the CAP:LinkTM model are also used in other areas of the tool; in setting the assumptions for some of the deterministic projections throughout the tool, the Performance Slider and in places where a high, central and low estimate of investment returns is shown. Investment return assumptions can be defined in Voyant using a fixed growth rate or by specifying an underlying asset allocation. Where an underlying asset allocation is used, the tool will show you a range of potential total investment returns from high to low. These returns are derived from the CAP:LinkTM model outputs. The same high, central, low data is used in the Performance slider. The data can be seen in the Preferences -> Market Assumptions screen. You should be clear that the approach adopted is intended to give you and your clients a feel for the potential variability of investment returns. The figures are in no way intended to represent minimum or expected returns. You should be comfortable with the range of total return values for each asset class before using the tool with eValue FE market assumptions. A summary of the derivation of the high, central and low total return values for the six Elevate asset classes are as follows: TECHNICAL USER GUIDE correct @ 10/2010 Voyant, Inc. proprietary information which is privileged, confidential, or subject to copyright belonging to Voyant, Inc. Use of this information is solely for the recipient of this document. Voyant, Inc. 2010 6 For each asset class, the total returns for the first 15 years of each of the 1000 projections are averaged. The returns in each year are equally weighted in this average calculation. For each asset class, the 1000 simulations of the 15 year average returns are arranged in order of magnitude and the 950th (High) and 50th (Low) values are selected. The Central value is the mean of this 15 year averaged data. It is these values that you can see in the Preferences -> Market Assumptions screen and are used throughout the tool. Due to the simplifications made, the high and low values are not percentile returns from the eValue FE CAP:LinkTM model. With the exception of Cash, for each asset class, an additional assumption is required for how much of the total return is income (dividend yield or interest yield depending on the asset class). This is needed for the purpose of Voyant’s tax calculations only (this income return is assumed to be already included within the high, central and low returns) A cash income return is not required because the total returns are assumed to be 100% income. For the other asset classes, the assumption is the mean of the 15 year average income return data from the CAP:LinkTM model. Whilst these parameters are derived from the CAP:LinkTM model, they are used in “deterministic” projections in the tool, assuming the same investment return for each asset class in each year of the forecast. The approach taken is simplified and as such it is only intended to give an idea of the potential variability of investment returns by asset class. Taxes and Charges Assumptions You should note that all of the input returns are gross of taxes and charges. This is covered in more detail here. Alternative Market Assumptions The tool comes configured with market assumptions from eValue FE. However, you can choose to use your own market assumptions, including adding your own asset classes. Where you do this the high, central and low data you have entered will be used throughout the tool, including in the Performance slider. Please note that the high, central and low data that you enter by asset class should be total return data gross of tax and charges. For all asset classes other than Cash you will be required to enter a single dividend and/or interest yield value for the purpose of Voyant’s tax calculations. You must have an asset class called “Cash”, the returns for which are treated as 100% income. TECHNICAL USER GUIDE correct @ 10/2010 Voyant, Inc. proprietary information which is privileged, confidential, or subject to copyright belonging to Voyant, Inc. Use of this information is solely for the recipient of this document. Voyant, Inc. 2010 7 Asset Allocation When we refer to “asset allocation” we mean how an investment is split by underlying asset classes. For example, we could define an investment as being made up of 70% UK Equity and 30% Fixed Interest. The high, central, low values shown against an asset allocation are a weighted average of the high, central and low values for the underlying asset classes. eValue FE have created a range of suggested optimised portfolios which are available on the Elevate platform. These portfolios are created using the CAP:LinkTM model and each one is designed to maximise returns for a given tolerated level of risk (volatility of investment returns). The optimised portfolios are still available if you enter your own market assumptions, however in this situation, as the high, central and low values shown will be calculated from your own assumptions, they will not be consistent with the CAP:LinkTM model used to create the optimised portfolios. The optimised portfolios are explained further in the section “Efficient Frontier and Optimised Portfolios”, read more.... TECHNICAL USER GUIDE correct @ 10/2010 Voyant, Inc. proprietary information which is privileged, confidential, or subject to copyright belonging to Voyant, Inc. Use of this information is solely for the recipient of this document. Voyant, Inc. 2010 8 Default Inflation / Growth Rates The following inputs are configured with mean data from the eValue FE CAP:LinkTM model: • Inflation Rate % is used to inflate expenses in Voyant. In the tool, this is configured with the annualised 15 year mean RPI value from eValue FE. • Annualised Average Weekly Earnings (AWE) %, currently shown as National Average Earnings % on screen, is used as the default salary growth assumption in Voyant. In the tool, this is configured with the annualised 15 year mean salary inflation value from eValue FE. • Consumer Prices Index (CPI) / Retail Prices Index (RPI) % is used to inflate items such as escalating annuity payouts and to express a plan in today’s money in Voyant. In the tool, this is configured with the annualised 15 year mean RPI value from eValue FE. The other assumptions shown here are Voyant’s standard assumptions (and so are not derived from the eValue FE CAP:LinkTM model). All of these values can be overwritten with your own assumptions, however changing the assumptions for Inflation and CPI/RPI whilst using the eValue FE market assumptions would mean that the assumptions underlying your plans would not be consistent. TECHNICAL USER GUIDE correct @ 10/2010 Voyant, Inc. proprietary information which is privileged, confidential, or subject to copyright belonging to Voyant, Inc. Use of this information is solely for the recipient of this document. Voyant, Inc. 2010 9 Deterministic Cash Flow Analysis Investment return assumptions can be defined in Voyant using a fixed growth rate or by specifying an underlying asset allocation. If an asset allocation is used the software calculates a growth rate from the central market assumptions as specified in Preferences -> Market Assumptions. To set the software to compute investment returns from market assumptions, select the “Use Asset Allocation” option, as shown right. In this situation, the fields for Growth Rate, Dividend Yield and Interest Yield are disabled because this information has been defined in Preferences. NOTE: The high, central and low investment returns entered in Preferences are total return data, i.e. income + capital returns. Where “Use Asset Allocation” is not selected in the Growth and Yield screen the Growth Rate required is capital growth as opposed to total returns. Dividend and Interest Yields are then entered separately on this screen and will be added to the input Growth Rate in Voyant’s calculations. The Asset Allocation panel, shown right, can then be used to specify the underlying asset allocation for your investment. TECHNICAL USER GUIDE correct @ 10/2010 Voyant, Inc. proprietary information which is privileged, confidential, or subject to copyright belonging to Voyant, Inc. Use of this information is solely for the recipient of this document. Voyant, Inc. 2010 10 The tool calculates deterministic cash flow projections using a weighted average return for the asset allocation using the “central” return estimates for each asset class. The central return value for the asset allocation is displayed on the asset allocation selection screen (shown right) and can also be seen in the annual details for each investment. Deterministic cash flow projections are shown in the Let’s See charts, where growth rates can be viewed by clicking on the chart legend “Detailed” view link. TECHNICAL USER GUIDE correct @ 10/2010 Voyant, Inc. proprietary information which is privileged, confidential, or subject to copyright belonging to Voyant, Inc. Use of this information is solely for the recipient of this document. Voyant, Inc. 2010 11 Asset allocation based growth rates can be viewed on the Investments and Pensions tabs of the chart’s details panel, as shown below. Note: The annual details panel displays the growth/return rate net of fees entered for the investment. Performance Slider The Performance slider is used to illustrate whether planning goals could potentially be met when investment performance is adjusted upwards or downwards. The range of the slider is intended to show a reasonable range of investment returns. The figures are in no way intended to represent minimum or expected returns. Results are shown in the Let’s See charts. To use the Performance slider, click the Performance button on the Let’s See charts panel. A slider bar will display to the right of the chart. TECHNICAL USER GUIDE correct @ 10/2010 Voyant, Inc. proprietary information which is privileged, confidential, or subject to copyright belonging to Voyant, Inc. Use of this information is solely for the recipient of this document. Voyant, Inc. 2010 12 When the Performance button is selected, the slider shown on the right of the chart will allow a user to scroll between the low and high estimates for returns. The tool uses the high, central and low estimates for each asset class and the position of the slider to calculate a weighted growth rate for each investment with an applied asset allocation. For savings and investments that do not use asset allocation the tool varies the fixed growth rate for each account by +/- 6% at either extreme of the performance slider. Savings and current accounts are limited to a low estimate of 0%. This is standard Voyant functionality. The actual return applied to each account when using the Performance slider can be found on the Let’s See chart details screen, as shown above. The overall return can vary in each year of the forecast as the relative proportion of total assets in each account changes over time. TECHNICAL USER GUIDE correct @ 10/2010 Voyant, Inc. proprietary information which is privileged, confidential, or subject to copyright belonging to Voyant, Inc. Use of this information is solely for the recipient of this document. Voyant, Inc. 2010 13 Efficient Frontier and Optimised Portfolios The Efficient Frontier view is only available when using the market assumptions from eValue FE. However, the optimised portfolios provided by eValue FE will always be available to load even if you choose to enter your own market assumptions. The Efficient Frontier shows the risk and return characteristics of the optimised portfolios supplied by eValue FE. This is the expected mean and standard deviations of returns for each of the portfolios over a 15 year time horizon as defined by the CAP:LinkTM model. The mean and standard deviations assume that the optimised portfolios are continuously rebalanced over the 15 year time horizon. Because the optimised portfolios are designed to offer the best potential return for a given level of risk using the eValue FE CAP:LinkTM model, they are deemed to be efficient and so form what we call the Efficient Frontier. If you are using the eValue FE market assumptions, the Efficient Frontier and optimised portfolios can be accessed from either of the Asset Allocation panels (in Investments or Preferences), by clicking the Select Optimal button. TECHNICAL USER GUIDE correct @ 10/2010 Voyant, Inc. proprietary information which is privileged, confidential, or subject to copyright belonging to Voyant, Inc. Use of this information is solely for the recipient of this document. Voyant, Inc. 2010 14 Monte Carlo Probability Simulation Voyant’s Monte Carlo simulation has been customised in the tool by utilising stochastic outputs from eValue FE’s CAP:LinkTM model. If you choose to use your own market assumptions, this feature is not available. As described in the introduction to this guide, the output of one simulation of the CAP:LinkTM model is the projected investment returns over a 50 year period for each asset class. 1000 such simulations are run to give the stochastic investment returns for each asset class as follows (figures for illustration only). Simulation 1 Simulation 2 Simulation 3 Year 1 5.07% 0.72% 5.70% Year 2 4.56% -1.80% 4.97% Year 3 4.20% 0.65% 2.55% I I I I I I I I I I I I I I I I I I I I I I I I 2.78% 4.01% 3.78% I I I I I I I I Simulation 1000 ----------------------------------------------------------------------------------------------------------------------------------------------------------------------------------------------------------------------------------------------------------- Year 50 5.12% 3.67% 0.89% I I I I I I I I 4.11% Voyant uses these projected investment returns, in conjunction with the information you’ve entered about your client, to determine for each simulation whether the plan would meet its goals. This calculation is repeated 1000 times to determine the probability of success as described below. The stochastic data from eValue FE runs for 50 years. Therefore, the overall probability of success is the probability of hitting any goals you have specified within that 50 year period. The Monte Carlo simulation will run where at least one account has been specified with reference to an underlying asset allocation, rather than using a fixed growth rate. The forecast of any accounts using a specified growth rate is not stochastic. Therefore, if a large proportion of a plan’s accounts are defined using a fixed growth rate, the output from the Monte Carlo simulation will tend to be either close to 0% or close to 100% depending on whether your client’s goals were met at the specified growth rate. The Monte Carlo simulation is intended for use where the majority of a plan’s accounts are specified using asset allocations. TECHNICAL USER GUIDE correct @ 10/2010 Voyant, Inc. proprietary information which is privileged, confidential, or subject to copyright belonging to Voyant, Inc. Use of this information is solely for the recipient of this document. Voyant, Inc. 2010 15 The upper chart of the Monte Carlo simulation illustrates the basic deterministic cash flow using the default “central” return estimates. This forecast will run until mortality as input by the user rather than for a maximum of 50 years as in the lower chart. The lower chart represents the probability of success in each year. Probability of success is derived from the percentage of the 1000 simulations that result in no expense shortfalls in the year. The overall probability of success, shown in the bottom right section of the screen, displays the proportion of the 1000 scenario simulations that recorded no expense shortfalls in any year of the plan. Note: For plans lasting longer than 50 years, the Monte Carlo simulation will only include the first 50 years of the plan. This is because the 1000 scenario return files project forward 50 years. Probabilities then are representative of analysis for only the first 50 years of the plan. TECHNICAL USER GUIDE correct @ 10/2010 Voyant, Inc. proprietary information which is privileged, confidential, or subject to copyright belonging to Voyant, Inc. Use of this information is solely for the recipient of this document. Voyant, Inc. 2010 16 Part 2 – Important considerations when using the Tool The following important points should be understood and carefully considered when using the tool. The primary function of the tool is to engage the client in the financial planning process. As with any tool, for reasons of simplicity and usability, there will be limitations. Also many assumptions are made – both within the Voyant tool and by eValue FE in running their CAP:LinkTM model. You are responsible for understanding Voyant’s limitations, how the tool works and ensuring that the key assumptions used are appropriate when choosing how and when to use the tool with your clients. PLEASE NOTE: The cashflow projections and simulations in the tool are not FSA Key Features Illustrations. Please note the following important considerations: eValue FE market assumptions – 15 year term The eValue FE market assumptions are derived from data over a 15 year time horizon. You should be aware that the shorter the plan term, the more volatile the expected investment return. Therefore, you may wish to consider using a different range to the default values in the tool. Charges The eValue FE market assumptions are gross of charges. An annual charge assumption is entered separately in Voyant and it is your responsibility to ensure these charges are appropriate to your client’s plan. It does not take any direct account of Initial Charges. If you are using your own market assumptions, these should be entered gross of charges, with charges being entered separately as above. Tax The eValue FE market assumptions are gross of tax. There are various tax calculations made throughout the Voyant tool as defined by Voyant’s standard functionality. If you are using your own market assumptions, these should also be gross of tax. Market Assumption ranges Whether you are using the eValue FE or your own market assumptions, you should be comfortable that the range shown for each asset class is appropriate. TECHNICAL USER GUIDE correct @ 10/2010 Voyant, Inc. proprietary information which is privileged, confidential, or subject to copyright belonging to Voyant, Inc. Use of this information is solely for the recipient of this document. Voyant, Inc. 2010 17 As the high to low range is specified at an asset class level, it will not take account of correlations between the returns over different asset classes when a weighted average range is calculated for an asset allocation. The impact of this is that the weighted average ranges will be wider than if these correlations were accounted for – both for the low return values and the high return values. You should be particularly aware of this in considering whether the high value calculated is appropriate for a particular client’s asset allocation. Please also refer to the section on Further Information TECHNICAL USER GUIDE correct @ 10/2010 Voyant, Inc. proprietary information which is privileged, confidential, or subject to copyright belonging to Voyant, Inc. Use of this information is solely for the recipient of this document. Voyant, Inc. 2010 18 Part 3 – Importing Alternative Market Assumptions into the Tool The tool has been customised to include market assumptions provided by eValue FE which are consistent with the optimised portfolios suggested on the Elevate platform. Although these are the default market assumptions, the software retains the flexibility to allow advisers to create or import their own proprietary or preferred sets of market assumptions; however certain restrictions will apply. Some advanced features will be disabled when alternative market assumptions are used and imported market assumptions must meet certain formatting standards. In this section of the guide we will identify what these restrictions are, the formatting requirements for custom market assumption files, and outline the steps to import market assumptions into the tool. Features Disabled when Using Alternative Market Assumptions Two features will be disabled automatically when the tool is set to use an alternative set of market assumptions instead of the default set provided by eValue FE. - Monte Carlo Simulation - The Monte Carlo analysis in the tool uses returns for each asset class provided by eValue FE projected over 50 years and 1000 scenarios. Simulations can be run in the tool only when the software is using market assumptions from eValue FE. This simulation will be disabled whenever the software is set to use alternative market assumptions. TECHNICAL USER GUIDE correct @ 10/2010 Voyant, Inc. proprietary information which is privileged, confidential, or subject to copyright belonging to Voyant, Inc. Use of this information is solely for the recipient of this document. Voyant, Inc. 2010 19 - Optimised Portfolios – The Efficient Frontier and Optimised Portfolio screen is only shown in the tool when using market assumptions from eValue FE. This panel will be deactivated when the software is set to use alternative assumptions. TECHNICAL USER GUIDE correct @ 10/2010 Voyant, Inc. proprietary information which is privileged, confidential, or subject to copyright belonging to Voyant, Inc. Use of this information is solely for the recipient of this document. Voyant, Inc. 2010 20 Two Options for Adding Alternative Market Assumptions to the Tool Two options are available for adding alternative sets of market assumptions and asset classes into the software. - Load or create market assumptions in the software manually. Advisers can load their own market assumptions into the tool. Initially these assumptions will be available only on the locally installed instance of Voyant. However, once a plan is created using customised market assumptions, these assumptions will become associated with the plan, following the client file wherever it goes, and they will continue to be used whenever the plan is accessed from another computer or if shared with clients or colleagues. Read more... - Have market assumptions included in a white labelled / rebranded version of the software. Firms that subscribe to Voyant’s optional white labelling service (i.e. rebranding) may provide Voyant their own proprietary or preferred sets of market assumptions, asset classes and model portfolios, which can be made a permanent addition to their white labelled versions of the software. White labelling has the advantage of easily and uniformly distributing assumptions and portfolios, as well as any updates made to them, to the firm’s entire user base including advisers and their clients. Read more... Define Asset Classes and Returns in a Market Assumptions File A market assumptions file is required to define asset classes together with central, high and low total annual returns, and for all asset classes other than Cash, a dividend yield and/or interest yield. The income assumptions are not needed for Cash because 100% of the return is assumed to be income. The central returns for each asset class/sector should be those that you wish to be used in projections in Voyant where investments are defined by an underlying asset allocation. The high, central, low annual returns entered should be those that you wish to be used whenever a high, central, low summary is shown and that will be used to define the range for the Performance Slider. It is this file that the adviser will either import manually into the tool or send to Voyant to be included in a white labelled/rebranded version of the software. This file must be in a comma-separated value (.csv) format, a common “save as” format option in Microsoft Excel and other programs. Asset classes are defined as column headings in the market assumptions file. Each class must be formatted in all caps with an underscore used to represent spaces, e.g. SUB-INVESTMENT_GRADE_BONDS. Voyant will parse these column names smartly, for example: The column heading and asset class UK_LARGE_CAP_STOCKS will be parsed and displayed in Voyant as “UK Large Cap Stocks”. Similarly, the column heading SUB-INVESTMENT_GRADE_BONDS will be parsed and displayed in Voyant as “Sub-investment Grade Bonds” One asset class, CASH, is required. There is no limit on the number of asset classes; however, 15 is the recommended maximum. Introducing more than 15 classes may affect their display in the software’s user interface. The market assumptions file should be similar in format to the example shown on the following page. TECHNICAL USER GUIDE correct @ 10/2010 Voyant, Inc. proprietary information which is privileged, confidential, or subject to copyright belonging to Voyant, Inc. Use of this information is solely for the recipient of this document. Voyant, Inc. 2010 21 How to Format a Market Assumptions File • The market assumptions file must be in a comma-separated value (.csv) format. • Returns must be in decimal format, not a percentage format - e.g. 6.2% must be entered as .062 in this file, not as 6.2 or 6.2%. • Asset classes, which serve as the column headings, must be formatted in all caps with underscores used to represent spaces. • CASH is a required asset class with all others being adviser defined. • There is no maximum limit on the number of asset classes; however, over fifteen classes may affect their display in the Voyant user interface. Note: The values shown are test data, used only for purposes of example. ROW_NAME_ CASH COLUMN FIXED_INCOME PROPERTY UK_EQUITY DEVELOPED_ EMERGING_ MARKETS_EQUITIES MARKETS_EQUITIES mean 0.029477521 0.04520735 0.078903496 0.082139385 0.08487256 0.111920878 upside 0.049529741 0.065939134 0.123173183 0.136978392 0.132263591 0.20786309 downside 0.014946791 0.026817661 0.035849652 0.026234078 0.036634051 0.021126515 Interest_yield 0 0.05449978 0.054016426 0 0 0 dividend_yield 0 0 0 0.030093791 0.025657627 0.032197799 N.B. The mean, upside and downside labels equate to central, high and low return values. TECHNICAL USER GUIDE correct @ 10/2010 Voyant, Inc. proprietary information which is privileged, confidential, or subject to copyright belonging to Voyant, Inc. Use of this information is solely for the recipient of this document. Voyant, Inc. 2010 22 How to Manually Load a Set of Customised Market Assumptions into the Tool Advisers have the option to manually load their own preferred set of market assumptions into the tool. These market assumptions will only be saved locally. Users running Voyant on multiple computers would need to install the assumptions on each computer if they are to be used as a system default. Once a plan is created using customised market assumptions, these assumptions become associated with the plan and will continue to be used even when the plan is shared with clients or colleagues. Any number of customised market assumption sets can be offered through Voyant. Accessed through Preferences, assumptions can be easily loaded into Voyant where they can be applied to plans individually, applied to all of the plans within a client record, or used as the software’s default market assumptions set whenever a new client record is created. TECHNICAL USER GUIDE correct @ 10/2010 Voyant, Inc. proprietary information which is privileged, confidential, or subject to copyright belonging to Voyant, Inc. Use of this information is solely for the recipient of this document. Voyant, Inc. 2010 23 Step 1: Add a new Set of Market Assumptions to Voyant To load a customised set of market assumptions into Voyant, first open and log into the software. You may select and open an existing client record or choose to create a new one. 1. Click the Preferences link, located in the bottom-left corner of the screen. The Preferences screen is divided into two sections: - System Preferences, on the left, control the general settings for the software. These global settings are used as defaults whenever a new client record is created in Voyant. - Plan Preferences, on the right, control the default settings for the individual plan currently open in Voyant. These plan specific preferences can be quite different from the software’s system preferences, which are only initial defaults. Plan preferences are applied to plans individually but can be copied to all of the plans within a client record by clicking the Copy to All Plans button. Using these two sections of the Preferences screen, market assumptions can be applied to the individual plan currently viewed, copied to every plan within the client record and used by default whenever a future client record is created. 2. Expand the Market Assumptions panel located beneath either Plan Preferences or System Preferences. 3. Click the Create button. TECHNICAL USER GUIDE correct @ 10/2010 Voyant, Inc. proprietary information which is privileged, confidential, or subject to copyright belonging to Voyant, Inc. Use of this information is solely for the recipient of this document. Voyant, Inc. 2010 24 The Save Market Assumptions dialogue will display. On this dialogue you can either: - Edit the default eValue FE Market Assumptions and click the Create button to save these edited assumptions as a new market assumptions set; - Load an entirely new set of market assumptions and asset classes defined in a market assumptions file. 4. Click the Load from File button to load an entirely new set of market assumptions and asset classes defined in a market assumptions file. 5. The Install Market Assumption dialogue will display. Click the browse button to locate and select the Market Assumptions file. The new set of market assumptions and its related asset classes will be displayed in the Install Market Assumptions dialogue. Confirm that these are the expected set of asset classes and market assumptions. TECHNICAL USER GUIDE correct @ 10/2010 Voyant, Inc. proprietary information which is privileged, confidential, or subject to copyright belonging to Voyant, Inc. Use of this information is solely for the recipient of this document. Voyant, Inc. 2010 25 6. Click the OK button to continue. The Save Market Assumptions dialogue will again display. 7. Enter a Name for this new set of market assumptions. The name chosen must be unique among those in already saved in the market assumptions library. 8. Click the Create button to load the new set of market assumptions into Voyant. The new set of market assumptions are now loaded and available for use in the software. Continue to step 2 of these instructions to apply market assumptions to a plan, to all plans, or use them as a system default. TECHNICAL USER GUIDE correct @ 10/2010 Voyant, Inc. proprietary information which is privileged, confidential, or subject to copyright belonging to Voyant, Inc. Use of this information is solely for the recipient of this document. Voyant, Inc. 2010 26 Step 2: Apply Market Assumptions to a Plan, to All Plans, or Use as a System Default The new set of market assumptions has been saved into the software’s library of market assumptions. From this library the assumptions are now available to be applied to plans individually or to all of the plans within a client record and to be used as the software’s system default whenever a new client record is created. 1. Go first to the Preferences screen. 2. Decide whether the market assumptions will be applied to an individual plan or used as a new system default for new client records as you create them. These options are not mutually exclusive. - To load the market assumptions into an individual plan, expand the Market Assumptions panel in the Plan Preferences section of the screen. - To use the market assumptions as a default for any future client records created in Voyant, expand the Market Assumptions panel in the System Preferences section of the screen. 3. Click the Select button on the Market Assumptions panel (shown right). The Load Market Assumptions dialogue (shown below) will display. A library of market assumptions will be listed along the left side of the dialogue including the set loaded previously in step 1 of these instructions. TECHNICAL USER GUIDE correct @ 10/2010 Voyant, Inc. proprietary information which is privileged, confidential, or subject to copyright belonging to Voyant, Inc. Use of this information is solely for the recipient of this document. Voyant, Inc. 2010 27 4. Select a set of market assumptions from the library. When a set of market assumptions is selected, details about these assumptions will be shown in the dialogue. Market assumptions are comprised of asset classes together with the assumed central, high and low growth rates and interest / dividend yields for each, with the exception of Cash where the total return is the interest yield. 5. Click the Load button. The selected market assumptions will be loaded into the plan or used as a system default, depending on which section of the Preferences screen was chosen earlier – Plan Preferences or System Preferences. These assumptions will now appear in the Market Assumptions panel. The same set of market assumptions can also be loaded into the plan or used as a system default by repeating the previous steps in the Plan Preferences or System Preferences. Once loaded, these assumptions can be applied to all plans within a client file by clicking the Copy to All Plans button. 6. After these updates are complete, finish by clicking the Apply button in the lower right corner of the Preferences screen. The updated market assumptions will be saved. These market assumptions are then used in the tool; in the deterministic projections throughout the tool, the Performance Slider and in places where a high, central and low estimate of investment returns is shown. TECHNICAL USER GUIDE correct @ 10/2010 Voyant, Inc. proprietary information which is privileged, confidential, or subject to copyright belonging to Voyant, Inc. Use of this information is solely for the recipient of this document. Voyant, Inc. 2010 28 How to Provide a Preferred Set of Market Assumptions to Voyant for Inclusion in a White Labelled/Rebranded Version of the Software Firms that subscribe to Voyant’s optional white labelling service may choose to have their preferred market assumptions added to their rebranded versions of the software. White labelling has the added advantage of easily and uniformly distributing market assumptions and model portfolios, as well as any future updates made to them, to the firm’s entire user base including advisers and their clients. To have a preferred set of market assumptions added to a rebranded version of software, first create a market assumptions file, formatted as detailed in this guide, and then e-mail this file to Voyant Support ([email protected]). Any future changes to Market Assumptions or Asset Allocations will be covered under Voyant’s monthly rebranding maintenance fee. TECHNICAL USER GUIDE correct @ 10/2010 Voyant, Inc. proprietary information which is privileged, confidential, or subject to copyright belonging to Voyant, Inc. Use of this information is solely for the recipient of this document. Voyant, Inc. 2010 29 Part 4 – Adding Asset Allocations to the Tool Once market assumptions are defined, asset allocations can be built and saved into the software where they can be applied to individual investments or used as a plan’s default portfolio. As with market assumptions, there are two ways to add asset allocations to the tool. - Create asset allocations in the software manually. Advisers can create their own asset allocations within the software. These will be available only on the local instance of Voyant. However, once an asset allocation is used in a client file it will continue to be used whenever the plan is accessed from a different computer or if shared with clients or colleagues. - Have assumptions and asset allocations included in a white labelled / rebranded version of the software. Firms subscribing to Voyant’s optional white labelling service can have asset allocations added to their rebranded versions of the software. White labelling has the advantage of easily and uniformly distributing market assumptions and asset allocations and any updates made to them to the firm’s entire user base including advisers and possibly their clients. Read more. How to Create and Load Asset Allocations into the Tool Manually Any number of asset allocations can be created and saved into the software’s asset allocation library. Once stored in this library, portfolios can be: - Applied to accounts individually on the Investments and Pensions > Money Purchase screens; - Used during particular stages of the plan on the Time screen; - Set as the default asset allocation for the software or for a plan on the Preferences screen. 1. To create a new asset allocation, go to any of these four screens. 2. Expand the Asset Allocation panel. 3. Enter percentages beside each applicable asset class. The portfolio must be 100% allocated. 4. Click the Save button. TECHNICAL USER GUIDE correct @ 10/2010 Voyant, Inc. proprietary information which is privileged, confidential, or subject to copyright belonging to Voyant, Inc. Use of this information is solely for the recipient of this document. Voyant, Inc. 2010 30 5. The Save Asset Allocation dialogue will display. Enter a name for the asset allocation and click Save. The new asset allocation will be added to the software’s asset allocation library. To later use the asset allocation to set growth for an investment or pension or as a plan or stage default, simply load it from the asset allocation library. Go to the appropriate screen depending on how you want to use the portfolio: - Preferences, - Investments, - Pensions > Money Purchase, - Time. Expand the Asset Allocation panel and click the Load button. From this library you may select and load the asset allocation. TECHNICAL USER GUIDE correct @ 10/2010 Voyant, Inc. proprietary information which is privileged, confidential, or subject to copyright belonging to Voyant, Inc. Use of this information is solely for the recipient of this document. Voyant, Inc. 2010 31 How to Provide Asset Allocation to Voyant for Inclusion in a White Labelled/Rebranded Version of the Software Firms subscribing to Voyant’s optional white labelling service can have asset allocations added to their rebranded versions of the software. White labelling has the advantage of easily and uniformly distributing market assumptions and asset allocations, as well as any updates made to them, to the firm’s entire user base including advisers and their clients. For example, if a firm wishes to offer its advisers the option to choose a preconfigured “Low Risk Income” asset allocation, this could be provided to Voyant for addition to its rebranded version of the software. Once added, this asset allocation will become available to the firm’s entire user base. Firms can provide any number of asset allocation portfolios to Voyant for addition to their rebranded software. Voyant requires only the name of the each asset allocation and the percentage allocated to each asset class within them. Example Asset Allocation ___________________________ “Low Risk Income” 30% Sub-investment Grade Bonds 30% Cash 40% Investment Grade Bonds ___________________________ The total of the asset class percentages must equal 100%. The asset classes used in an asset allocation must exist in the market assumptions set. Unlike the market assumption files discussed earlier in this guide, there are no special file formatting requirements for asset allocations. Details can be sent to Voyant in a variety of file formats – e.g. e-mail, Word document, text file, Excel spreadsheet. TECHNICAL USER GUIDE correct @ 10/2010 Voyant, Inc. proprietary information which is privileged, confidential, or subject to copyright belonging to Voyant, Inc. Use of this information is solely for the recipient of this document. Voyant, Inc. 2010 32 Part 5 – Updates to Market Assumptions and Asset Allocations Updates to eValue FE data To ensure the tool remains current quarterly updates are made by eValue FE to their CAP:LinkTM model. Therefore, the outputs from this model used in the tool, including the suggested optimised portfolios, may change on a quarterly basis. Following such an update, the market assumptions and stochastic data for the Monte Carlo simulation will be updated in the tool. The new data will apply to all plans – existing and new. You should note however, that the inflationary assumptions as input on the Default Inflation / Growth Rate screen will not automatically update for old plans. Therefore, you should update these yourself when opening an existing plan to ensure that they remain consistent with the eValue FE market assumptions. Updates to Alternative Market Assumptions If you are choosing to use your own market assumptions and you make updates to these assumptions, the new data will apply to all plans – existing and new. If you wish, you can apply revised market assumptions to new plans only by creating a new named market assumption set rather than updating an old set. Updates to Asset Allocations (including the eValue FE Optimised Portfolios) When a client record is opened, which contains a plan or plans that use an Asset Allocation that has been modified since the client record was last saved; the Update Asset Allocation screen is displayed. TECHNICAL USER GUIDE correct @ 10/2010 Voyant, Inc. proprietary information which is privileged, confidential, or subject to copyright belonging to Voyant, Inc. Use of this information is solely for the recipient of this document. Voyant, Inc. 2010 33 The revised Asset Allocation may be a eValue FE Optimised Portfolio following a quarterly update or an Asset Allocation that an adviser has created and subsequently changed. There is the option to update the plan or plans to use the modified asset allocation, or keep the plan(s) with the previous version of the asset allocation. All new plans created will use the updated asset allocation. TECHNICAL USER GUIDE correct @ 10/2010 Voyant, Inc. proprietary information which is privileged, confidential, or subject to copyright belonging to Voyant, Inc. Use of this information is solely for the recipient of this document. Voyant, Inc. 2010 34 Part 6 – Further Information This section outlines some current technical facts about Voyant. Annuity rates: The annuity calculated at retirement is based on US mortality tables. It is based on an interest rate entered by the user. This interest rate is combined with the mortality tables to produce an annuity rate. Interest and Dividends: Bank and Building Society interest is included in the income tax calculation. However, they are not shown in the tool as income unless the user specifically sets this income up as a withdrawal. If assets yielding dividends and interest are assigned to specific life stages, this can impact their payment. The Cash Flow chart attempts to show a full picture of the source of funds which are used to pay expenses, it is not intended to be a full account of every debit and credit. Bearing this in mind when you view the Cashflow tab under the detailed information view, if you have any tax on interest that is deducted at source it will be listed as a positive cash flow. For dividends on the cash flow chart the display shows the gross percentage growth rate along with the net monetary value of the dividend. Contributions and Expenses: Any contributions entered within the tool are annualised and applied at the end of each year after growth or interest has been applied. Any expenses or charges are annualised and applied at the start of each year. The only exception to this rule is where an expense forces the liquidation of an asset at the end of a year. Employer one-off pension contributions are not directly modelled at the present time. Indirectly, they can be modelled by setting up a separate pension for the contribution. Improvements to contribution handling are on the development queue at Voyant. It is possible to enter any level of ISA contribution, but the tool applies contribution limits when constructing the cash flow analysis. These limits are currently assumed to increase by £500 every two years for the Stocks and Shares ISA and by £300 every two years for the cash ISA. TECHNICAL USER GUIDE correct @ 10/2010 Voyant, Inc. proprietary information which is privileged, confidential, or subject to copyright belonging to Voyant, Inc. Use of this information is solely for the recipient of this document. Voyant, Inc. 2010 35 Tax and NI: Tax on Bank and Building Society interest is displayed as a withdrawal. Reinvested dividends are included in income tax calculations, even though they are not actually received. Income tax allowance bands are assumed to escalate at 4% p.a. When a client moves from one tax band to another part way through a year, Voyant estimate when this occurs and adjusts the tax paid accordingly. The temporary anti-forestalling rules to restrict pension tax relief for high income individuals, due to end in 04/2011, have not been built into the tool. National Insurance contributions are always calculated on an employed basis. The National Insurance upper and lower limits are assumed to increase in line with the Personal Allowances Increase @ 4% per annum. IHT and Trusts: A breakdown of the assets used in calculating inheritance tax is shown in the Legacy Overview. The following are not allowed for when calculating inheritance tax: Business property relief Previous gifts DGT and loan trusts. Pension lump sum on death is always paid to the spouse irrespective of bypass trust. Monte Carlo Simulation: The Monte Carlo simulation will run where at least one account has been specified with reference to an underlying asset allocation (rather than using a fixed growth rate). The forecast of any accounts using a specified growth rate is not stochastic. Therefore, if a large proportion of a plan’s accounts are defined using a fixed growth rate, the output from the Monte Carlo simulation will tend to be either close to 0% or close to 100% depending on whether your client’s goals were met at the specified growth rate. The Monte Carlo simulation is intended for use where the majority of a plan’s assets are specified using asset allocations. TECHNICAL USER GUIDE correct @ 10/2010 Voyant, Inc. proprietary information which is privileged, confidential, or subject to copyright belonging to Voyant, Inc. Use of this information is solely for the recipient of this document. Voyant, Inc. 2010 36 Preferences > Default Inflation / Growth Rates: This section gives examples of where the inputs in this screen are used in Voyant: • Inflation Rate: Used to inflate expenses in Voyant. • Investment Growth Rate: Used as the fixed growth rate that is the default when Use Asset Allocation is not selected for an investment. • Annualised Average Weekly Earnings: Used as the default rate of salary inflation, shown in the tool as National Average Earnings. • Assumed Annuity Interest Rate: Used as the default annuity interest rate used to convert an accumulated pension fund into an annuity at retirement. • CPI / RPI: Used to inflate items such as escalating annuity payouts and to express a plan in today’s money in Voyant. Questions and Further Information: Additional information and assistance on using the tool can be found in the user guides, on the Voyant website and in the integrated help system on the tool itself. Voyant can be contacted using links built into the tool for contacting customer services, or by directly emailing [email protected]. TECHNICAL USER GUIDE correct @ 10/2010 Voyant, Inc. proprietary information which is privileged, confidential, or subject to copyright belonging to Voyant, Inc. Use of this information is solely for the recipient of this document. Voyant, Inc. 2010 37 Part 7 – Glossary Glossary of technical terms used in this guide: Monte Carlo Probability Simulation: A Monte Carlo model is a model which is used to project multiple simulations of equally likely future events. From these scenarios, the probability of certain scenarios being achieved can be estimated. The eValue FE CAP:LinkTM model is a Monte Carlo model and is used in Voyant to estimate the probability of a client’s goals being achieved. Optimised Portfolio: Asset allocation designed to offer the best potential return for a given level of risk, where the risk is defined as a Standard Deviation of return. Standard Deviation: A measure of the expected variability of investment returns and hence of risk. TECHNICAL USER GUIDE correct @ 10/2010 Voyant, Inc. proprietary information which is privileged, confidential, or subject to copyright belonging to Voyant, Inc. Use of this information is solely for the recipient of this document. Voyant, Inc. 2010 38


![Mercury Phase 2 Modeller - User guide v8.8.ppt [Compatibility Mode]](http://vs1.manualzilla.com/store/data/006892540_1-e3f28b1bf2a388b24cd40307f49b3ac3-150x150.png)