1
English
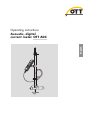
Operating instructions
Acoustic, digital
current meter OTT ADC
We reserve the right to make technical changes and improvements without notice.
Table of contents
1 Scope of supply
5
2 Safety information
6
3 Introduction
3.1 Measurement principle
3.2 Measurement process
7
7
7
4
8
System components
4.1 Sensor
4.2 Handheld unit
9
5 Starting up the OTT ADC
5.1 Ensuring power supply
5.2 Starting up the handheld unit
5.3 Starting up the sensor
5.4 Connecting the sensor to the handheld unit
14
14
15
17
21
6 Preparing and carrying out discharge measurement
6.1 Preparing for measurement
6.2 Carrying out measurement
6.3 Transferring data to the PC
22
22
23
26
7 Menu functions on the handheld unit
7.1 Main menu
7.2 Discharge measuring menu
7.3 Depth calibration menu
7.4 View data menu
7.5 Delete files menu
7.6 System status menu
7.7 System settings menu
7.8 Advanced menu
27
27
28
38
39
39
40
40
42
8 Ensuring data quality
8.1 Angle of flow
8.2 Temperature compensation
8.3 Depth calibration
8.4 Internal quality check
43
43
44
44
44
9 Processing data with OTT QReview
9.1 System requirements
9.2 Installing USB device drivers and software
9.3 Transferring data to the PC
9.4 Processing and exporting data
9.5 Menu functions in OTT QReview
46
46
46
48
48
49
10 Maintenance work
10.1 Handheld unit
10.2 Sensor 50
50
50
11 Warnings and error messages
11.1 Warnings
11.2 Critical error messages
51
51
52
12 Troubleshooting
53
13 Technical Data
54
14 Order numbers and accessories
56
3
4
Appendix A – Theory and practical suggestions for discharge measuring
with the OTT ADC
A.1 Overview: Methods for velocity measurement
A.2 Overview: Methods of discharge calculation
58
58
61
Appendix B – Flow velocity measurement with the OTT ADC
(functional principle)
64
Appendix C – Firmware upgrade
65
Appendix D – Standard settings
67
Appendix E – Repair
68
Appendix F – Note on the disposal of old units
69
Appendix G – Declaration of conformity
70
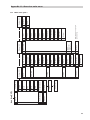
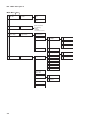
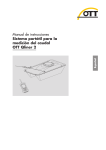
Appendix H – Overview main menu
H.1 Main menu part 1
H.2 Main menu part 2
71
71
72
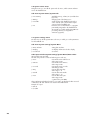
1 Scope of supply
OTT ADC
1 acoustic, digital current meter, consisting of:
– sensor with sensor connection cable and mechanical adapter to attach the
sensor to the measuring rod
– handheld unit with integrated battery and charging unit
– rod bracket for attaching the handheld unit to measuring rods (universal
attachment)
– power supply with AC/DC converter and connection for charging cable
– charging cable
– power cable for power supply
– USB cable for connecting the handheld unit to the PC
– OTT ADC brief instructions
– transport case
– factory acceptance test certificate (FAT)
Optional:
Optional:
CD ROM
– universal power adapter set for power supply (travel plug)
– adapter for 12 V (vehicle connection)
1 CD-ROM with the following elements:
–
–
–
–
–
–
user firmware for the handheld unit
processing software OTT QReview incl. operating manual available online
USB driver for the connection between the handheld unit and the PC
brief instructions for OTT ADC as PDF file
operating instructions for OTT ADC as PDF file
Acrobat Reader
5
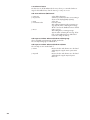
2 Safety information
Read these operating instructions through before using the OTT ADC for the
first time. Make sure you are familiar with the initial startup and operation of
the device. Retain these operating instructions for later reference.
The OTT ADC is used for discharge measuring in open waterways. Only use
the OTT ADC as described in these operating instructions!
During discharge measuring, observe the accident prevention regulations
applicable in your country!
Keep to the electrical and measurement specifications described in the technical
data (see Chapter 13 "Technical Data")!
Do not make any technical changes to the sensor or handheld unit of the OTT
ADC and do not open the devices! Otherwise you will lose all guarantee
rights!
Carry out maintenance work as recommended and at regular intervals (see
Chapter 10 "Maintenance work").
Have a defective device inspected and repaired by the OTT repair center.
Never carry out repairs yourself. This also applies to replacing batteries and
the sensor connection cable.
The handheld unit and sensor must have the same serial number in order to
function correctly. Therefore, never use devices with differing serial numbers.
Only attach the power supply to the handheld unit of the OTT ADC. Never use
for other USB standard devices, as differences in the output voltage will cause
damage to the device!
Dispose of the OTT ADC properly after taking out of service. Never dispose of
the device in the normal household waste (see Appendix F "Note on the disposal of old units").
6
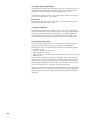
3 Introduction
The OTT ADC is a mobile, acoustic current meter for measuring point velocities in
open waterways. It is used for discharge measuring with the classic verticals
process with conventional rods.
During a discharge measurement, the OTT ADC measures not only the vertical
velocity distribution at the verticals but also the water depth and the respective
depth of the sensor. It calculates the average speed at the verticals from the measurements and also the partial flow in a flow segment in accordance with European standard EN ISO 748. Finally, it calculates the sum of all partial flows to
determine the complete discharge.
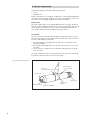
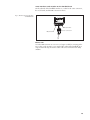
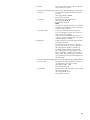
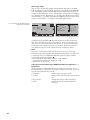
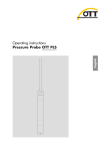
Fig. 1 OTT ADC with sensor and
handheld unit to control the measurement
and to receive the measurement results
3.1 Measurement principle
There are two ultrasonic transducers in the sensor head of the OTT ADC. While
measuring the flow velocity, these transmit ultrasonic signals, which are reflected
by the waterway particles and return as echo signals. The echo signals are
received by the transducers and digitalized by a digital signal processor (DSP) as
an echo pattern. After a short pause the process is repeated so that there is a second echo pattern. The DSP checks both echo patterns for similarity using a mathematical procedure and calculates their time difference. The difference is then used
to calculate the flow velocity.
3.2 Measurement process
Before beginning the measurement, the user enters the relevant parameters for the
specific station and the required measuring and calculation methods via the handheld unit.
During the measurement the graphical user interface on the handheld unit leads
the user step by step from the first to the last measure point. In the process, the
communication between the handheld unit and the sensor is via the sensor connection cable. Relevant parameters and measurement results for a station are
saved in a specific file in the handheld unit.
After the measurement, the user can load the data onto the PC, prepare and
process it using the processing software OTT QReview.
7
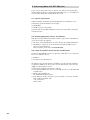
4 System components
The OTT ADC mainly consists of the following components:
Sensor
Handheld unit
Further components are, for example, an adapter for connecting the handheld unit
and sensor to the measuring rod, the power supply, a charging cable and connection cables for connecting the handheld unit to the sensor and PC.
Please note
The serial numbers of the sensor and handheld unit must correspond. The handheld unit contains calibration data for the temperature sensor and the pressure cell
of the relevant sensor. Therefore, only use a sensor and handheld unit with the
same serial number and never exchange them between devices!
4.1 Sensor
The sensor is the base element of the OTT ADC. The important necessary assemblies for measuring speed, water depth and water temperature can be found in it.
It consists of the following components:
Sensor head with two integrated ultrasonic transducers, temperature sensor
and other assemblies
Sensor body with integrated pressure cell and connector for the sensor connec-
tion cable
Sensor end piece as adapter for the rod bracket with fixing sleeve for attach-
ment to the rods
The serial number of the sensor is engraved into the rear part of the sensor body,
beneath the connection for the sensor connection cable.
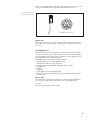
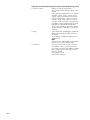
Fig. 2: Components of the sensor
Connector
sensor connection cable
Circular hole of
sensor end piece
Sensor head
Fixing sleeve
Temperature sensor
8
Pressure cell
chamber
Ultrasonic transducers
The sensor connection cable is fixed to the sensor body. It is used to connect the
sensor to the handheld unit for transmitting data and electrical power.
Fig. 3: Connector for
sensor connection cable
Contact pins of connector
Please note
Never replace the sensor connection cable yourself! For a professional replacement of the sensor connection cable, send the device to the OTT repair center if
necessary.
4.2 Handheld unit
The handheld unit is the interface between user and sensor. The user enters the
necessary parameters for the station and measuring method with the handheld
unit. The graphical user interface of the unit leads the user through the measurement and provides measurement information.
The handheld unit consists of the following components:
Digital board for processing the signals received
CPU board for data processing and output
Fixed battery pack (rechargeable battery) for electrical supply
Charging unit
Display
Keyboard
Loudspeaker for key and feedback signals
Interfaces for communication with the sensor and for data transfer to the PC
On/off switch
Please note
The serial number is printed on the type plate on the rear of the handheld unit.
You can also query the serial number via the menu of the handheld unit.
See menu
Main menu [2/2]/System Status/Serial Nr.
9
The following figure shows components that are important for working with the
handheld unit:
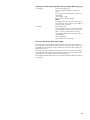
Fig. 4: Handheld unit with display,
operating keys and keyboard
LC Display
Operating keys
Keyboard
USB interface for connection to the PC
On/off switch
Sensor connection
10
4.2.1 Display screen
Saved data and current information on the measurement running are shown on
the graphical user interface of the display.
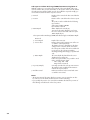
Fig. 5: Display screen during the
measurement (example)
Data quality display
Battery charge state
Measurement
progress indicator
0.95
0.85
Flow velocity
Distance of
verticals
from reference point
m/s
0,95m
1.00
Submersion depth
(set value)
Position of the sensor
on the vertical
Function display
for operating buttons
Position of the verticals
Units
Water and sensor depth as well as various positions and distances are shown in
separate displays on the handheld unit without units.
Depths and distances are measured in meters (m) or feet (ft). The unit is specified
when the handheld unit is set (see Chapter 5.2.1 "Setting the handheld unit").
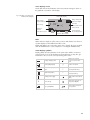
4.2.2 Display symbols
Display symbols provide information on the system status and the current measurement. In the course of the discharge measurement being run, they also give
information to the user on the correct positioning of the sensor.
Battery charging state
Distance of verticals
from cross-section zero
point
Data quality display
Position of vertical
Measurement progress indicator
Position of sensor on the
vertical (actual value)
Water temperature
V
–
Position of sensor on the
vertical (set value)
Battery power supply
Depth of the sensor (actual
value)
Flow velocity
Note: Leave sensor at current position (depth)
No signal (blinks)
Note: Position sensor further up/down
11
4.2.3 Operating keys
With the help of the operating keys ( ◆ , ●, ■ ), you can control the menu
sequence or delete existing characters in the input masks. The function of the operating keys depends on the current operating situation. It is shown directly above
the respective key in the display.
Call main menu
Return to previous menu
Ok and continue
Delete character
(in entry masks)
Delete or cancel
Confirm entry
(in input masks)
Move up/down
(in multipart menus and lists)
Switch between two views
on a display
?
Call help
Starting measurement
4.2.4 Character entry
Characters, e.g. file names, are entered in special input masks via the keyboard
of the handheld unit. Depending on the operational situation, the entry of numbers
(numerical values) or text (alphanumeric values) is possible in the individual entry
mask.
Numerical values, " . "and "-" : press relevant key once.
Alphanumeric values: press relevant key 1x, 2x, 3x or 4x until the required
character is shown in the display.
Fig. 6: Example of an input mask:
entering file name
Discharge Measuring
Filename
ILLE_
12
4.2.5 Interfaces and switches on the handheld unit
On the underside of the handheld unit there is a socket for the sensor connection,
the on/off switch, and the USB connection to the PC.
Fig. 7: Interfaces and on/off switch
on handheld unit
USB connection
On/off switch
Sensor connection
Please note
Cover the USB connection as soon as it is no longer needed for connecting to the
PC. For this use the protective cover supplied. The sealing of the handheld unit is
only ensured in this way. Protect the socket of the sensor connection from damp
and dirt!
13
5 Starting up the OTT ADC
Before you can carry out a measurement with the OTT ADC, you have to prepare
the unit for the measuring process. This includes:
Ensuring the power supply
Setting the handheld unit according to requirements
Attaching the sensor to the measuring rod
Attaching the handheld unit to the measuring rod
Connecting the sensor to the handheld unit
5.1 Ensuring power supply
The power supply for the handheld unit and sensor is provided by rechargeable
batteries, which are permanently installed in the handheld unit.
The charging state of the battery is shown by the filled amount of the battery symbol in the upper right corner of the display. You can also query the charging state
via the menu of the handheld unit.
See menu
Main menu [2/2]/System Status/Battery
With fully charged batteries, operation for more than 20 hours measuring operation is possible. Empty batteries can be charged more than 500 times. The charging time with completely discharged batteries is approx. 2 hours.
The handheld unit is equipped with intelligent energy management. A switched on
device supplied by the batteries switches off automatically if no keys are pressed
or no data communication takes place over a period of more than 15 minutes.
The background illumination is switched off as standard after 30 seconds without
a key press. However, the automatic switching off of the background illumination
can also be deactivated.
All data saved on the handheld unit are persistent and are also retained even with
completely discharged batteries.
Please note
Replacing the batteries installed is only possible by the OTT repair center (see
Appendix E "Repair").
Charging batteries
Required components: handheld unit, power supply with charging cable connector and power supply cable with plug, charging cable.
How to charge the batteries
Connect the charging cable connector of the power supply to the charging
cable with the barrel connector.
Connect the charging cable to the handheld unit via the USB connection.
Connect the mains plug of the power supply to the mains electricity supply.
The batteries are charged. The display of the handheld unit is automatically
switched on. The charging process lasts around 2 hours.
It is possible to make entries via the handheld unit while it is being charged.
14
Note
You can also charge the batteries using a vehicle voltage converter. There is an
optional adapter available for this (see Chapter 14 "Order numbers and accessories").
Caution
The power supply has been specially developed for the OTT ADC. The power supply may not be used for other devices that correspond to the USB standard, as differences in the output voltage can lead to damage to the device!
5.2 Starting up the handheld unit
Before you start using the handheld unit, ensure that the batteries are charged.
Switching the handheld unit on/off
Press on/off switch for approx. one second.
The startup process takes approx. 10 seconds. It is finished when the "++++" at
the upper edge of the display disappears.
5.2.1 Setting the handheld unit
You can adapt the settings of the handheld unit according to your individual wishes. Menus that contain the parameters for individual settings can be found in the
main menu.
See menu
Main Menu [2/2]
The following menus are relevant:
System Settings/System Menu
Here you can set the date and time, control the display screen, and change the
volume for key and feedback sounds.
Advanced/Advanced
Here you can set the display language, specify whether the key sounds are
switched on and specify the unit of measurement to be used on the display and
for calculations (metric/imperial).
Further information on the individual parameters and options of the relevant
menus can be found in Chapter 7 "Menu functions on the handheld unit".
15
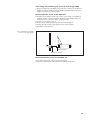
5.2.2 Attaching the handheld unit to the measuring rod
The OTT ADC is supplied with a universal attachment for measuring rods. In this
way the handheld unit can be attached both to rods with Ø 20 mm and to rods of
type USGS.
There is a fixing plate on the rear of the handheld unit with a permanently
attached ball head. When attaching the handheld unit to a rod, the aluminum
plates of the universal attachment clamps onto the ball, thus allowing the handheld
unit to move and be rotated in different directions.
Please note
Only attach the handheld unit after the sensor is mounted on the rod (see Chapter
5.3 "Starting up the sensor").
How to attach the handheld unit to the rod
Clamp the aluminum plates of the universal attachment to the ball on the rear
of the handheld unit.
Loosen the wing nut.
Clamp the free end of the universal attachment around the rod, so that the
plastic coated plates surround the rod.
Lock in the required position with the wing nut.
Fig. 8: Attachment of the
handheld unit to the rod
16
5.3 Starting up the sensor
Before beginning the measurement, you have to attach the sensor to the rod and
connect to the handheld unit. The sensor end piece serves as a mechanical
adapter for attaching the sensor to measuring rods.
5.3.1 Fixing and positioning the sensor on the 20 mm diameter rod
Required components: OTT ADC sensor, 20 mm diameter rod (starting piece),
extension for rod if necessary
How to attach the sensor to the rod
Unscrew the fixing sleeve of the sensor end piece.
Push the sensor with the circular hole of the sensor end piece (mechanical
adapter) over the rod. Ensure the sensor connection cable is pointing upward.
Position the sensor at the required point on the rod.
Tighten the fixing sleeve of the sensor end piece until the sensor is fixed.
Extend the rod as required.
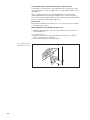
Fig. 9: Attachment of the
ADC sensor to the rod
Fixing sleeve
How to position the sensor on the rod
To move the sensor to a different position on the rod during a measurement, it has
to be lifted out of the water.
Unscrew the fixing sleeve of the sensor end piece.
Move the sensor and fix at the new position with the fixing sleeve.
17
5.3.2 Fixing and positioning the sensor on the rod with the
OTT HERES top setting wading rod
When using the OTT HERES top setting wading rod, the sensor is attached to the
top setting wading rod using the HERES adapter.
Required components: OTT ADC sensor, OTT HERES top setting wading rod
(starting piece), 20 mm diameter rod, extension for rod and OTT HERES if
necessary
How to attach the sensor to the OTT HERES
Unscrew the fixing sleeve off the sensor end piece.
Loosen the Allen screw on the HERES adapter.
Push the sensor end piece onto the receiver provided on the HERES adapter
and fix with the Allen screw. Ensure the sensor connection cable is pointing
upward, towards the rod.
Slide the starting piece of the OTT HERES onto the rod with the sensor mounted.
Extend the rod and OTT HERES as required.
Fig. 10: Attachment of the ADC
sensor to the OTT HERES
OTT HERES starting piece
HERES adapter
Allen screw
How to position the sensor with the OTT HERES
Using the OTT HERES top setting wading rod, which is pushed over the rod as a
sleeve, the sensor can be repositioned without lifting it out of the water.
Loosen the fixing screw of the OTT HERES top setting wading rod.
Move the sensor with the OTT HERES and fix at the new position with the fixing
screw.
18
5.3.3 Fixing and positioning the sensor to rods of type USGS
Required components: OTT ADC sensor with sensor end piece as mechanical
adapter for rod type USGS, rod of type USGS with appropriate meter/sensor
bracket, extensions for rod if necessary
How to attach the sensor to the USGS rod
Push the sensor with the circular cutout of the sensor end piece (mechanical
adapter) onto the receiver provided on the meter/sensor bracket of the rod.
Ensure the sensor connection cable is pointing upward.
Press the sensor as far as it goes.
Fix the sensor with the fixing screw of the mechanical adapter.
Position the sensor at the required point on the rod (see below).
Extend the rod as required.
Fig. 11: Attachment of the ADC
sensor to rods of type USGS
Sensor end piece
Meter/sensor bracket
How to position the sensor on the USGS rod
Loosen the fixing screw of the meter/sensor bracket.
Move the sensor and fix at the new position with the fixing screw.
19
5.3.4 Fixing and positioning the sensor to rods with USGS top
setting wading rod
Required components: OTT ADC sensor with sensor end piece as mechanical
adapter for rod type USGS, top setting wading rod of type USGS with appropriate meter/sensor bracket, extensions for round rod and top setting wading
rod if necessary
How to attach the sensor to the USGS top setting wading rod
Push the sensor with the circular cutout of the sensor end piece (mechanical
adapter) onto the receiver provided on the meter/sensor bracket of the top setting wading rod. Ensure the sensor connection cable is pointing upward.
Press the sensor as far as it goes.
Fix the sensor with the fixing screw of the mechanical adapter.
Position the sensor at the required point on the round rod (see below).
Extend the USGS top setting wading rod as required.
Fig. 12: Attachment of the ADC sensor
to the USGS top setting wading rod
Sensor end piece
Meter/sensor bracket
How to position the sensor with the USGS top setting wading rod
Press on the rubber stopper of the catch on the handle of the USGS top setting
wading rod and release the catch.
Move the sensor using the round rod and hold at new position.
Release pressure on the rubber stopper and lock.
20
5.4 Connecting the sensor to the handheld unit
To provide the sensor with electricity and allow communication with the handheld
unit, it has to be connected to the handheld unit.
Connect the sensor connection cable to the handheld unit. Take care to note the
markings () on the plug and socket!
After switching on the handheld unit, the OTT ADC is ready for measuring (see
Chapter 6.2 "Carrying out measurement").
21
6 Preparing and carrying out discharge
measurement
The following sections describe what you have to take note of before a discharge
measurement with the OTT ADC and in which steps the actual measurement proceeds.
Explanations for the individual menus and sub menus can be found in Chapter 7
"Menu functions on the handheld unit". The brief instructions for the ADC show
step-by-step with example illustrations how to use the OTT ADC menus during a
discharge measurement.
6.1 Preparing for measurement
6.1.1 Checking the measuring equipment
Before going to the station, you should collect the measuring equipment required
and check its functionality.
Note the following points:
All components of the OTT ADC must be in perfect condition and be complete
in the transport case.
The handheld unit must have sufficient battery capacity (see Chapter 5.1
"Ensuring power supply").
Handheld unit and sensor must have the same serial number – important if
there are several OTT ADC devices available.
Measuring rods and top setting wading rods to be used must be available in
sufficient number and be able to be connected without problem.
Aids for setting up the station must be ready, e.g. measuring rope or tape measure, pegs, sledge hammer, sickle, etc.
Functional protective clothing should be available (waders, rubber boots,
waterproof clothing, etc.).
6.1.2 Setting up the station
The area of use of the OTT ADC attached to the rod is limited by the effort needed
from the user to hold the sensor against the pressure of the flow. The effort is
mainly dependent on the flow velocity of the waterway and the length of the lever.
Setting up the measurement cross-section
The correct selection of the measurement cross-section is significant for the quality
of the measurement. Hydraulically suitable stations can be found in a straight
length of waterway with regular cross-sections and as consistent a bed gradient
as possible. Measurement cross-sections with still areas, counter or eddy currents
should be avoided. Equally unsuitable are stations in deep pools, below large
inflows, in the vicinity of ship moorings, ferries and sluices.
The measurement cross-section is set at right angles to the main flow direction. For
this a tape measure or a measuring rope is used, for example. Ensure that the
tape or measuring rope is taut.
22
Specify the verticals
The number and position of the verticals are dependent on the geometric shape of
the measurement cross-section and the intended measurement and evaluation
method. The following rules apply according to EN – ISO 748:
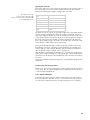
Tab. Number of verticals
in relation to the waterway width
Please note: the minimum waterway width
to use an OTT ADC: 0.5 m!
Waterway width Number of verticals
in m
> 0 and < 0,5
3–4
> 0,5 and < 1
4–5
> 1 and < 3
5–8
> 3 and < 5
8 – 10
> 5 and < 10
10 – 20
> 10
> 20
The distances between verticals are generally smaller where water depth and flow
velocities change significantly. This affects above all the bank areas, vertical or
steep slopes, ledges in divided cross-sections and transitions from the main waterway bed to the foreland. Verticals should also be located at significant changes in
the profile of the waterway bed. With consistent bed gradient of the waterway
there is the possibility to reduce the number of verticals and to space them evenly
without being in conflict with the above requirements.
European standard EN ISO 748 recommends selecting verticals in such a way
that with large waterways a discharge segment defined by the vertical(s) represents less than 5% of the complete discharge where possible and a maximum of
10%. A sufficient number of verticals is thus a prerequisite.
With discharge measuring with the OTT ADC you can check the percentage proportion of the complete discharge for each segment: This is automatically calculated and shown on the display of the handheld unit at the end of the measurement.
See menu
Main menu [1/2]/Discharge Measuring/Start/.../Completed/Discharge Measuring/Details
6.2 Carrying out measurement
Requirements: The measuring equipment is complete and functioning, the station is
set up, sensor and, as required, handheld unit are attached to the rod, the sensor
is connected to the handheld unit.
6.2.1 Depth calibration
To determine the water and sensor depths, an absolute pressure cell is built into
the sensor body of the OTT ADC. To ensure correct measurement values, the pressure cell must be calibrated under the currently existing air pressure conditions.
23
Please note
The sensor must be outside the water during calibration.
A first calibration is started before beginning the measurement with the help of the
handheld unit. During the measurement, you are requested every 30 minutes to
repeat the calibration via the user interface of the handheld unit.
See menu
Main Menu [1/2]/Depth Calibration
6.2.2 Making basic settings to the discharge measurement
In order to lead the user through the discharge measurement, and for the subsequent determination of the discharge, the OTT ADC firstly needs basic data for the
respective station. These data (basic settings) are entered via the handheld unit
before beginning the measurement.
The following basic settings are necessary for each measurement:
Details for near edge and far edge, such as position, water depth, roughness
and stream width
Position of the first vertical and spacing of the verticals
Planned sequence of the measurements at the verticals (e.g. from bottom to top)
Rod offsets (distances between rod base plate and waterway bed and between
base plate and symmetry axis of the sensor)
Method of velocity measurement (e.g. 2-point method or multi-point measurement)
Selection of the discharge calculation method (MID or MEAN section)
Required measurement duration per measure point
If necessary, details of salt content of the water
If basic settings already exist for the station concerned, these can be loaded and
used again. It is also possible to load the data for a measurement already carried
out and saved and to add further measure points.
See menu
Main menu [1/2]/Discharge Measuring/Settings/...
The measurement should also be named. For this the following details are
required:
File name to be used for saving the measurement data
Name of the party
See menu
Main menu [1/2]/Discharge Measuring/Name or Party
24
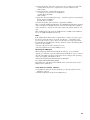
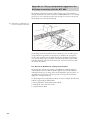
6.2.3 Carrying out discharge measurement
The sensor is only put into the water at the beginning of the discharge measurement. The depth of the sensor must be at least 2 cm.
The sensor is ideally positioned when the sensor head is pointing against the
direction of flow and the symmetry axis of the sensor is at right angles to the measurement cross-section. There should be no obstructions in the immediate vicinity
of the sensor. Ideally, the measurement is carried out from a bridge or a measuring pontoon. If the measurement is taken directly in the water, the user must stand
at a sufficient distance from the measuring device to ensure an unobstructed flow.
Fig. 13: Positioning of the OTT ADC
sensor in the water
Directio
n of flo
w
How to carry out a discharge measurement
Position the sensor at the first vertical.
Call the Discharge Measuring menu and select Start.
In sub menu Start Measuring, confirm the list of the important basic settings
with Ok and continue.
Lower the sensor to the bottom and select Water Depth in the window of the
relevant measure point.
In the subsequent window, confirm the measured water depth ➝ return to the
window for the relevant measure point.
Select Ok and continue to call the measuring mode.
Position the sensor at the first measure point. The correct depth is shown on the
display of the handheld unit (the value Submersion depth of sensor (set value)
blinks until the correct position is reached).
Start measurement (press ● button).
25
The measurement now runs for the set time interval. After completing the measurement, the result for this measure point is displayed. You can reject the measurement and repeat it, or confirm it and continue with the next measure point. Once
the measure points for all verticals have been processed, an appropriate message
is shown. If necessary, you can modify the edge parameters retrospectively. Afterwards, the handheld unit shows the calculated complete discharge. If required,
you can can still call details of the partial discharges for the individual verticals
and then end the measurement.
See menu
Discharge Measuring/Start...
Notes
– All relevant data for a discharge measurement are automatically saved on the
handheld unit.
– You can interrupt a measurement already started. To do so, switch off the handheld unit. When next switched on, the measurement will be continued.
Please note
As soon as the point Start in the Discharge Measuring menu is selected, you are
led through the measurement by the user interface of the handheld unit. Familiarize yourself with the display symbols so that you will correctly interpret the graphical information (see Chapter 4.2.2 "Display symbols").
Canceling measurement
A measurement already started can be canceled as soon as the operating key
function for Call Main Menu is active in the respective operating situation.
Call main menu and move to Main Menu [1/2] if necessary.
Select menu point Discharge.
Select END.
Navigate through the subsequent windows until the Return operating key function
is active. Press several times as necessary on Return (operating key ◆ ), to reach
rest mode.
6.3 Transferring data to the PC
The OTT QReview software is provided to clearly illustrate the data and for processing the data.
Using OTT QReview, the measurement data can be loaded onto the PC and
processed further there (see Chapter 9 "Processing data with OTT QReview").
26
7 Menu functions on the handheld unit
If the sensor is out of the water, after switching on the handheld unit the display
starts in rest mode after a few seconds unless a previous measurement had been
interrupted. If the sensor is in the water, the display changes to measuring mode
(see section "Measuring mode").
Fig. 14: Display in rest mode
15:51:34
m/s
-.- -
0,00m
From the rest mode and, depending on the operating situation, from within certain
menus and sub menus, the main menu is called with the right side operating key ■ .
Note
The following description uses the unit "m" for clarity for displaying distances,
depths, speeds and discharge values (e.g. m/s). If the appropriate setting is
changed on the handheld unit, the values shown are displayed with the respective
values in "ft".
7.1 Main menu
The main menu of the handheld unit is divided into two parts, Main Menu [1/2]
and Main Menu [2/2]. Both parts include several menus that are also divided into
sub menus and up to three subsequent windows. Menus, sub menus and subsequent windows are called by pressing the relevant number on the keyboard of the
handheld unit. Some subsequent windows are accessed by using the operating
keys.
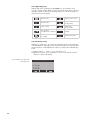
Fig. 15: Part 1 and part 2
of the main menu
Main Menui [1/2]
1.Discharge
2.Depth Calibration
3.View Data
Main Menu [2/2]
1.Delete files
2.System Status
3.System settings
4.Advanced
The following sections describe the individual menus and their sub menus and
subsequent windows. A detailed view of the most important display views can be
found in the brief instructions. For an overview of the main menu see „Appendix H“.
27
7.2 Discharge measuring menu
In this menu the basic settings are made for a discharge measurement and the
measurement is started.
Settings
Making basic settings for the measurement. The
basic settings are used as input parameters for
internal advance planning of measurements
and for calculating partial flows and complete
discharge.
Name
Enter the file name for the measurement.
Input format: alphanumeric, max. 8 characters
Party
Enter the name of the party.
Input format: alphanumeric, max. 30 characters
Notes
Enter notes.
Input format: alphanumeric, max. 80 characters
START
Start discharge measuring.
Sub menu Discharge Measuring/Settings
This sub menu is divided into three subsequent windows in which you enter parameters for the measurement cross-section, the type of measurement and the calculation method. The measurement time is also specified and the salinity of the
waterway if appropriate.
Subsequent window Discharge Measuring /Settings/Discharge [1/3]
Load...
Load basic settings from a saved file and use it,
or continue previous measurement.
Subsequent window Discharge Measuring /Settings/Discharge [1/3]/Load...
Load settings only
Continue a
previous measurement
28
Calls the list of saved files. After selecting the
file required, the settings saved there are
loaded. They are now preset for the new measurement and can be modified as necessary.
Calls the list of saved files. After selecting the
required file, the settings saved there are
loaded and the relevant measurement can have
further measure points added.
Note
To go to the measuring mode, after selecting
the required file press Return three times (key ◆).
Vertical and position of the next measure point
are shown on the display.
Near edge
Enter parameters for the near edge.
The near and far edges are the left and right
edge points that limit and define the complete
width of the water surface. The near edge is on
the side where the measurement is started
from.
Subsequent window Discharge Measuring /Settings/Discharge [1/3] /Near Edge
Position
Position of the near edge (m).
Value = 0 if the near edge corresponds to the
reference point for calculating the position of
the verticals. As a rule, the reference point is
the cross-section zero point of a measured discharge cross-section.
Value > 0 if the near edge is not the reference
point. The value is then equal to the distance of
the near edge from the reference point.
Value Range: 0.00 - 300.00
Entry format: numerical
Depth
Water depth at the near edge (m).
Value = 0 for natural waterways
Value > 0 for right-angled cross-sections
Value range: 0.00 - 10.00
Entry format: numerical
Roughness
Roughness factor of the side wall.
The roughness factor is only relevant for rightangled cross-sections. For these, it is used as
an influencing factor when calculating the discharge proportion of the edge areas.
Value range: 0.00 - 1.00
0.00 = very rough; 1.00 = smooth
Entry format: numerical
Stream width
Width of the water surface from the left to the
right edge (m).
Corresponds to the value for stream width in
subsequent window Far Edge and is automatically adapted there if the stream width is
changed here.
Value range: > 0.50 - 300.00
Entry format: numerical
Note
The values for position near/far edge and stream width are dependent on each
other. If the value for position is changed to a value > 0, a value previously set
for stream width is automatically adapted to this value.
29
Far Edge
Enter parameters for the far edge.
For definition see "Near Edge"
The far edge is on the side where the measurement is ended.
Subsequent window Discharge Measuring /Settings/Discharge [1/3]/Far Edge
Position
Position of the far edge (m).
Value > 0
The value is equal to the distance of the far
edge from the reference point.
Value range: > 0.00 - 300.00
Entry format: numerical
Note
The distance between near and far edge must
be at least 0.5 m.
Depth
Water depth at the far edge (m).
Value = 0 for natural waterways
Value > 0 for right-angled cross-sections
Value range: 0.00 - 10.00
Entry format: numerical
Roughness
Roughness factor of the side wall.
The roughness factor is only relevant for rightangled cross-sections. For these, it is used as
an influencing factor when calculating the discharge proportion of the edge areas.
Value range: 0.00 - 1.00
0.00 = very rough; 1.00 = smooth
Entry format: numerical
Stream width
Width of the water surface from the left to the
right edge (m).
Corresponds to the value for stream width in
subsequent window Near Edge and is automatically adapted there if the stream width is
changed here.
Note
If required, the edge parameters can be changed retrospectively at the end of a
measurement.
30
Verticals
Enter position and spacing of the verticals and
the measurement sequence.
Subsequent window Discharge Measuring /Settings/Discharge [1/3]/Verticals
First pos.
Distance of the first vertical from the reference
point (m).
Value range: 0.00 - 300.00
Entry format: numerical
Spacing
Distance between the verticals (m).
Value range: 0.00-10.00
Entry format: numerical
Note
The value for Spacing should be > 0 so that the
OTT ADC can calculate the position of the individual verticals in advance.
Measure Order
Sequence in which the measure points are
processed along the verticals. The current setting is shown on the display.
In the subsequent window the measurement
sequences Surface to bottom, Bottom to surface
and Alternating are available.
Rod Offsets
Distances between sensor/base plate and base
plate/waterway bed.
The symmetry axis of the sensor – where the
pressure cell is located – never lies directly on
the waterway bed and there is therefore a
remaining distance. When using rods with
base plate and tip, this extra distance can be
larger, depending on whether the subsurface is
firm or yields. The extra distance is important
as a parameter for the correct determination of
the water depth.
Subsequent window Discharge Measuring /Settings/Discharge [1/3]/Rod Offsets
Sensor offset
Distance between the symmetry axis of the sensor and the base plate of the rod (m).
Value Range: 0.00 - 1.00
Entry format: numerical
Point offset
Distance between the base plate of the rod and
the waterway bed (m).
Value range: 0.00 - 0.50
Entry format: numerical
31
Subsequent window Discharge Measuring /Settings/Discharge [2/3]
32
Measure method
Methods for velocity measurement.
The currently selected method is shown on the
display.
In the subsequent window there are 11 methods
available: 1-point, 2-point, 3-point, 4-point,
5-point, 6-point measurement, 2-point Kreps
method (2 Point Kreps), 1-point ice measurement (Ice, Single point), 2-point ice measurement (Ice, Two Point), surface 1-point measurement (ISO, surface), multipoint measure- ment.
Explanations of the individual methods for
velocity measurement can be found in Appendix A.1 "Overview: Methods for velocity measurement".
Using
Set the method for calculating the complete discharge. The currently set method is shown on
the display.
The possibilities available are MID-section or
MEAN-section.
Note
Experience shows that the MID section method
provides more exact results (ISO 748).
Corr.factor
Correction factor for the 1-point ice measurement and the surface 1-point measurement.
Can only be selected if under Measure method
the Ice, Single point or ISO, surface method
has been selected.
Value range: 0.7-1.0
Entry format: numerical
Subsequent window Discharge Measuring /Settings/Discharge [3/3]
Averaging
Enter measuring time (s).
The measuring time applies to all measure
points.
The currently set measuring time is shown on
the display.
Value range: 1-480
Entry format: numerical, integer
Note
The length of the measuring time at a measure
point should be at least 30 s. It is generally set
at between 30 s and 50 s.
Salinity
Enter salinity (ppt).
The currently set value is shown on the display.
The salinity influences the speed of the sound
and is used as a parameter in the velocity
measurement. In freshwater waterways, this is
generally 0 ppt.
Value range 0-50
Input format: numerical, integer
Sub menu Discharge Measuring/START
In this sub menu the discharge measurement takes place. If no name has been
given in the basic settings, the file name for the measurement is queried after calling START. The following two windows list the previously made basic settings for
information purposes:
The Start measuring window shows the file name of the measurement, the waterway width, the total number of verticals and the number of measure points. After
confirmation, the subsequent window Point #i is displayed.
The Discharge-Details window shows the selected measuring method and calculation method.
33
Subsequent window Discharge/START/Start Measuring/Point #i
With this window you can run the measurement of the water depth at the verticals. The window also provides information on the position of the verticals and the
selected measuring method, which can also be modified as required. Finally, you
can end the measurement at the respective vertical.
Vertical
Number of the vertical. The first vertical has the
number 1.
Position
Distance of the vertical from the reference point
(m).
The position can be modified in the following
input window.
Value range: 0.00 to 300.00
Input format: numerical
Water Depth
Water depth at the vertical (m).
To measure the water depth, the user lowers
the sensor to the bottom and calls menu point
Water Depth (key 2).
Subsequent window Discharge/START/Start Measuring/Point #i/Water Depth
Measured:
Sensor Depth
Depth of the sensor (m)
Sensor offset
Distance between the symmetry axis of the sensor and the waterway bed (m).
The distance shown is dependent on the basic
settings for the rod offset, which are listed in
the subsequent window and can be modified if
necessary (see also subsequent window
Discharge/Settings/Discharge [1/3] /Rod Offsets).
Water Depth
The water depth calculated from the sensor
depth and sensor offset (m).
In the subsequent window it is possible to modify the calculated water depth.
Value range: 0.0 - 10.0
Entry format: numerical
2-point (example)
Currently set method for velocity measurement.
The method can be modified in the Measure
method subsequent window.
End this vertical
End measurements for this vertical and continue with the next vertical.
Notes
– The measurement of the water depth is necessary at every vertical. It can also
be carried out in the detail window Vertical i or Next vertical [i].
– If you modify the position of a vertical, the OTT ADC calculates the positions of
the following verticals based on this new position.
34
Detail window Discharge/START/Start Measuring/Point #i/Vertical [i]
This window summarizes the information on the respective vertical. If required, the
values displayed can be modified, the current water level entered and measurements of any obstructions entered.
Position
Distance of the vertical i from the reference
point (m).
The position can be modified in the subsequent
entry window.
Value Range: 0.00 - 300.00
Entry format: numerical
Depth
Water depth at the vertical (m).
The current value can be confirmed or modified
in the subsequent window (see subsequent window Discharge/START/Start Measuring/Point
#i/Water depth).
Gauge
Current gauge level (m).
The gauge level can be entered/changed in the
subsequent entry window.
Entry format: numerical
Define obstruction
Enter definition of any obstructions in the measurement cross-section.
An obstruction is, for example, a bridge pier.
Subsequent window Discharge Measuring/START... /Vertical [i] /Define obstruction
First edge
Distance of the side of the obstruction facing
the near edge from the reference point (m).
Value Range: 0.00 - Stream width
Entry format: numerical
Last edge
Distance of the side of the obstruction facing
the far edge from the reference point (m).
Value Range: 0.00 - Stream width
Entry format: numerical
Width
Width of the obstruction (m).
Value range: 0.00 - 300
Entry format: numerical
Is automatically calculated if the edge values
are already available.
Note
If an obstruction is defined, the OTT ADC recalculates the position of the respective verticals.
35
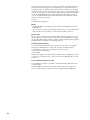
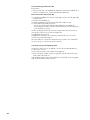
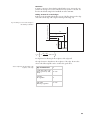
Measuring mode
After you have confirmed the window Point #i with Ok and continue, the handheld unit changes to measuring mode. Position the sensor at the preset depth. Take
note of the display symbols – the OTT ADC shows the depth of the relevant measuring point and whether the sensor is already at the correct position (see Chapter
4.2.1 "Display screen"). Alternatively, you can change the display view to call further information, e.g. on water temperature and SNR value (measure of the validity of the measured values - see Chapter 8.4 "Internal quality check").
Fig. 16: Example for alternative displays
during the measurement
0.95
0.85
m/s
0,95m
1.00 m
0.85 m/s
V
SNR 40 dB
0.95 m
15.5 o C
10.0 V
1.00
Start the measurement with key ●. The measurement runs for the set amount of
time. At the end of the measurement, the results are shown in a subsequent window. You can reject this measurement and repeat it, or accept the measurement
results and continue with the next measure point. Once all measure points for a
vertical have been processed, the subsequent screen Completed is shown.
Note
If the sensor is not positioned at the specified measure point, you receive the
warning message "Wrong depth" after starting the measurement. If you still want
to position the sensor at a depth other than that specified, continue as follows:
Cancel the warning message (key ■ ).
In the subsequent entry window, enter the required depth.
(input format numerical, value range 0.0 - 10.0)
Continue the measurement.
Subsequent window Discharge/START/Start Measuring/Point #i/.../
Completed
The measurement is completed for all measure points of a vertical. You can confirm the information in this window and continue with the next vertical, or you can
reject the measurement for this vertical.
36
Vertical nr. i
Number of the respective vertical.
Position
Distance of the vertical from the reference point
(m).
Avg. Velocity
Average flow velocity at the vertical (m/s).
Points
Number of measure points that have been
measured.
Subsequent window Discharge Measuring/ START.../Completed/
Next vertical [i]
This window shows the position of the next vertical. Here you can also measure
the water depth, enter the new gauge, and define any obstructions. The parameters in this window are identical to the parameters in the detail window Vertical i.
See menu
Discharge/START/Start Measuring/Point #i/Vertical [i]
After you have confirmed the window Next vertical [i], the window for the next
measure point is displayed. This has the identical content to window
Point #1 of the first measure point.
See menu
Discharge/START/Start Measuring/Point #i
After confirming with OK and continue, the measurement for this measure point is
started.
When the measure points of all verticals have been processed, you receive the
message DISCHARGE MEASUREMENT COMPLETED. This is followed by the window for setting the edge parameters in which you can change these parameters if
necessary. This can be particularly necessary for the far edge parameters as they
may only be clearly ascertained at the end of the measurement.
See menu
Discharge Measuring /Settings/Discharge [1/3]/Near Edge or Far Edge
Subsequent window Discharge Measuring/START.../Completed/
Next vertical/.../Completed/Edges/Discharge Measurement
Name
File name of the discharge measurement.
Discharge
Calculated total discharge
(m3/s).
Details
Details of the discharge measurement.
Subsequent window File name
Discharge
Calculated total discharge (m3/s).
Avg. Velocity
Average flow velocity (m/s).
Avg. Depth
Average water depth (m).
Area
Size of the measurement cross-section (m2).
Scrolling with the operating keys ● and ■ opens the detail windows for the
individual verticals:
Subsequent window Vertical nr.i [x%]
The percentage value (x%) shows what proportion of the total discharge is represented by the partial discharge of the vertical i.
Position
Distance of the respective vertical from the reference point (m).
Discharge
Partial discharge represented by vertical i
(m3/s).
Avg. Velocity
Average flow velocity at vertical i (m/s).
Depth
Water depth at vertical i (m).
Area
Cross-section of the measured discharge segment represented by vertical i (m2/s).
37
End
Ends the discharge measurement. Before finally
ending, a warning is shown that allows the
process to be canceled.
Continue
Continues the discharge measurement with a
further vertical.
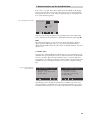
7.3 Depth calibration menu
In this menu you carry out the calibration of the sensor for depth measurement
(see Chapter 6.2.1 "Depth Calibration"). The integrated pressure cell is calibrated
in the current atmospheric pressure conditions at 0.00 m depth of the sensor. The
sensor must therefore be out of the water.
The calibration starts as soon as the menu is called.
Calibrate at
Shows the depth at which the calibration is
done (0.00 m).
Sensor reading
Shows the current measured value for the
depth (m).
After confirming with Ok and continue, the subsequent window Calibrated is displayed, which summarizes the results of the calibration.
38
At
Depth at which calibration took place (m).
Measured
Depth measured (m).
Offset
Current air pressure (mBar).
7.4 View Data menu
Using this menu, you call the sub menu Data Files, which contains a list of all files
saved on the handheld unit. The files contain information on discharge measurements previously carried out.
Subsequent window to sub menu View Data/Data Files
Shows the results of the complete discharge and partial discharges of the respective discharge measurement.
Subsequent window Data files/filename
Discharge
Total discharge determined (m3/s).
Avg. Velocity
Average flow velocity (m/s).
Avg. Depth
Average water depth (m).
Area
Size of the measurement cross-section (m2).
Subsequent window Data Files/Vertical nr.i [x%]
Shows the results for each individual vertical. The percentage value (x%) shows
what proportion of the total discharge is represented by the partial discharge of
the vertical i.
Position
Discharge
Avg. Velocity
Depth
Area
Distance of the vertical i from the reference
point (m).
Partial discharge represented by vertical i
(m3/s).
Average flow velocity at vertical i (m/s).
Water depth at vertical i (m).
Cross-section of the measured discharge segment represented by vertical i (m2/s).
7.5 Delete files menu
Using this menu, you call the sub menu Delete, which contains a list of all files
saved on the handheld unit. Here you can delete files that are no longer required.
After selecting the files to be deleted, a warning is displayed. You can continue
deleting or cancel the process.
39
7.6 System status menu
Using this menu you can call the System Info sub menu, which contains information on the handheld unit.
Sub menu System Status/System Info
Free Memory
Battery
Serial Nr.
Fw
Available memory, relative (in %) and absolute
(in points).
Charging state of the battery in %.
Serial number of the handheld unit. Only a
sensor with the same serial number may be
connected to the handheld unit!
Firmware version. The firmware is a program
permanently integrated in the handheld unit.
An upgrade is possible with the OTT QReview
processing software (see Appendix C
"Firmware upgrade").
7.7 System settings menu
Use this menu to call the System Menu sub menu, in which you set the parameters
for the handheld unit.
Sub menu System settings/System Menu
Date and Time
Setting date and time.
Display
Set display and measured value display.
Sound level
Set volume.
Subsequent window System Settings/System Menu/Date & Time
Input mask for time and date.
The date entry format is numerical and integer in each case.
Hour
Minutes
Seconds
Day
Month
Year
Current time: Enter whole hours.
Value range: 0-24
Current time: Enter minutes.
Value range: 0-60
Current time: Enter seconds.
Value Range: 0-60
Current date: Enter day.
Value range: 1-31
Current date: Enter month.
Value range: 1-12
Current date: Enter year.
Value range: 0-99
e.g. 08 for the year 2008.
After confirming with Ok and continue, your entries are displayed. After renewed
confirmation, the date and time are saved in the handheld unit.
Example for output
14:22:32
13/11/08
40
Subsequent window System Settings/System Menu/Display
Backlight
Set display illumination on/off
Subsequent window... /Display|Backlight
The current setting is marked with **
On
Automatic
Off
The display remains illuminated until the handheld unit is switched off.
The illumination is automatically switched off if
after approx. 30 seconds no entry has been
made or no data communication has taken
place.
The display illumination is switched off.
Contrast
Setting the display contrast.
Value Range: 1-10
(1 = low contrast, 10 = high contrast)
Velocity display
Specify the frequency of the measured value
display.
Subsequent window... /Velocity display
The current setting is marked with **
Continuous
The measurement results for flow velocity measurement are continuously displayed and
updated every second.
Note
The continuous display allows a visual impression of the turbulence of the flowing waterway.
Result only
Only the end result of the flow velocity measurement is displayed.
Subsequent window System Settings/System Menu/Sound level
Sound level
Sets the volume for key clicks and feedback
sounds.
Value Range: 0-10
(0 = no sound, 10 = loud)
41
7.8 Advanced menu
Use this menu to call the Advanced sub menu, where you can make further settings for the handheld unit, clear the memory, or carry out a reset.
Sub menu Advanced/Advanced
Language
Key Sound
Units
Format Recorder
Reset
Select display language.
Switch key sounds on/off. The current setting is
shown on the display ([ON] or [OFF]).
Select units.
Format recorder.
After calling Format Recorder a warning message appears. After confirming the message,
all files saved on the handheld unit are deleted.
Carry out reset.
After calling Reset a warning message
appears. After confirming the message, all settings on the handheld unit are deleted and
reset to the settings at delivery.
Subsequent window Advanced/Advanced/Language
Choice of English, Dutch, German, Spanish and French.
The currently set language is marked with **.
Subsequent window Advanced/Advanced/Units
The currently set unit is marked with **.
Metric
Imperial
42
Measured values and distances are calculated
and displayed using the metric system. Unit:
meter
Measured values and distances are calculated
and displayed using the imperial system.
Unit: foot
8 Ensuring data quality
To guarantee exact measurement data, an internal quality check in the device is
necessary as well as correct use and active checking by the user.
Notes on the correct use of the OTT ADC can be found in the relevant sections of
these instructions. The following sections describe what should be noted in addition to ensure the quality of your measured data.
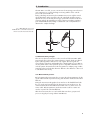
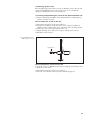
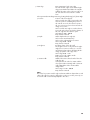
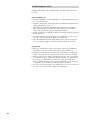
8.1 Angle of flow
The angle of flow is the angle between the alignment of the sensor (symmetry axis)
and the direction of flow. In an ideal situation, the angle of flow is 0°.
Hydraulically suitable stations exhibit low angles of flow when the sensor is positioned at right angles to the measurement cross-section and the flow is parallel to
the edges.
Direction of flow
Fig. 17: Sensor alignment with
an angle of flow of 0°.
90°
Measurement cross-section
In practical use in the field, there are naturally often small deviations from the
optimum sensor alignment leading to angled flows. These, but also angled flows
resulting from the cross-sections (e.g. near to vertical edge walls), lead to angles
of flow that are not equal to zero.
Due to the measuring principle and the location of the ultrasonic transducers, the
OTT ADC is relatively little affected by angular flows. In field tests, the measurement of the velocity was found to be unaffected by angular flows of up to 10°.
Furthermore, the measurement error is approx. 6 % with an angle of flow of 20°
and approx. 8 % with an angle of 30°.
Please note
Align the sensor visually so that it is positioned towards the flow and at right
angles to the measurement cross-section.
43
8.2 Temperature compensation
The OTT ADC is equipped with a temperature sensor. The water temperature is an
important parameter both for the calculation of the speed of sound and for the
temperature-compensated depth measurement with the pressure cell.
The temperature adjustment of the sensor under extreme conditions (from approx.
50° C to 5° C) takes approx. 5 to 6 minutes.
Please note
Before beginning the measurement, wait approx. 5 minutes until the sensor has
adjusted to the temperature of the water.
8.3 Depth calibration
The OTT ADC is equipped with an absolute pressure cell. In order to be able to
measure the depth of the sensor exactly, the pressure cell must be calibrated in the
air before beginning the measurement (see Chapter 6.2.1 "Depth calibration").
An internal timer requests the user to recalibrate after 30 minutes. In this way,
incorrect measurements caused by changes in air pressure are practically excluded.
8.4 Internal quality check
The internal quality check in the device is closely linked to the flow velocity measuring process. More details on this process can be found in Appendix B.
Each measured value is checked internally for adherence to the following criteria:
Correlation > 40%
Velocity > - 0.25 m/s and < 2.5 m/s
Velocity gradient < 0.25 m/s
(difference between current measurement and the previously measured velocity)
SNR > 10 db
Measured values that meet the criteria are saved. If the measurement time (integration time) is set to 30 s, for example, the OTT ADC collects a maximum of 30
values for each sound pulse. At the end of the measurement time, the OTT ADC
checks whether at least 50% of all measured values are valid. If not, the measurement is rejected and the user requested to repeat the measurement.
If the measured values are confirmed, the OTT ADC calculates the mean and standard deviation for the measured velocities in the cells closest to and furthest from
the sensor. Based on the result of the calculation, the final velocity is determined
and output.
44
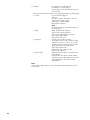
The focus of the internal quality check for flow velocity measurement is based on
the parameters in the following table.
Tab. 2: Parameters for
internal quality check
Parameters Description
Comment
SNR
SNR (Signal-Noise Ratio)
Limit: SNR > 10 db
- Indicator for the strength of the
reflections caused by the particles
in the water
- If the SNR value is too low, a
valid measurement is not possible
CF
CF (correlation factor)
Limit: CF > 40%
Indicator for the consistency of
sequentially received scan patterns
Peaks
Outliers in measured values caused see Comment A
by environmental conditions
V
Standard deviation for the velocity
- Indicator for the measurement
accuracy
see Comment B
- Takes account of water turbulence
and internal measuring errors
%Q
Percentage proportion of a discharge segment to the total discharge
EN ISO 748:2000
%Q < 5% ideal
%Q < 10% max.
see Comment C
Comment A – peaks
Peaks are eliminated in the check of the velocity gradient.
Comment B – standard deviation
The standard deviation is decisive for the determination of the valid measuring
range.
Comment C – segment proportion of total discharge
After a completed measurement, the percentage proportion of each segment of
the total discharge is shown on the display of the handheld unit. The user can then
decide whether additional verticals should be allocated.
(see recommendations in ISO standard).
Notes
– The SNR value can be viewed in the measuring mode by changing to the alternative display (see Chapter 7.2, Section "Measuring mode").
– The correlation is shown in the measuring mode with a display symbol (data
quality display). Each solid, vertical bar represents a correlation factor of 20%.
If all five bars are solid, the correlation is between 80% and 100%.
– The continuous display of the flow velocity on the handheld unit screen gives a
visual impression of the waterway turbulence.
See menu
Main menu [2/2]/System Settings/System Menu/Display/Velocity display
45
9 Processing data with OTT QReview
To give a clear representation of your data on a PC and for subsequent analysis,
the OTT QReview software is supplied. Using OTT QReview, you can transfer your
measured data directly from the handheld unit to a PC.
9.1 System requirements
IBM-compatible standard PC (notebook/desktop) from 233 MHz processor
Operating system MS Windows 98 or higher
64 MB RAM
10 MB free space on hard drive
Monitor with at least 800 x 600 pixel resolution (recommended ≥ 768 pixel)
USB connection
9.2 Installing USB device drivers and software
USB drivers for the handheld unit and the software components for OTT QReview
can be found on the CD supplied.
The drivers for the handheld unit are in the directory PC Software/USB Driver.
OTT QReview components are in the directory PC Software/QReview_xxx
(xxx = version identification).
Software updates can be found at www.ott.com.
9.2.1 How to install the drivers for the handheld unit
In order for the handheld unit to be recognized as a USB device, two components
have to be installed on the PC:
USB driver
Serial driver (virtual COM port)
The following steps describe the driver installation using the automatic hardware
recognition in Windows XP. The sequence of steps and window content can vary
slightly for other Windows versions.
Place the CD supplied in the CD drive of the PC.
Connect the handheld unit to the PC via the USB connection. Use the USB cable
supplied for this.
Switch on the handheld unit.
The Add Hardware Wizard opens.
In the Welcome window, answer the question whether a connection should be
made to Windows Update with:
– No, not this time
Click on Next.
46
In the next window, answer the question How do you want to proceed? with:
– Install software from a list or a particular source (for advanced users)
Click on Next.
In the next window, select the following options:
– Search this source for the most suitable driver
– Search (floppy disk/CD)
Click on Next.
Ignore the subsequent warning message ... Windows Logo Test not passed and
click on Continue installation.
The USB driver is installed.
In the next window, click on Finish to complete the installation.
After successfully installing the USB driver, the Add Hardware Wizard is restarted
as the serial driver for the USB device has not yet been installed. The installation
of the serial driver is carried out in the same way. It starts with the Welcome window.
After installing both components, the handheld unit is available via the USB interface as an additional COM port for the PC.
Note
If the Add Hardware Wizard does not find a driver, it may be necessary to give
the directory where the drivers are saved using Browse... . Depending on the
processor type in the PC, various driver versions may be necessary for transmitting data from the handheld unit to the PC, which are saved in the following directories on the CD supplied:
– Directory i386 for PCs with a Pentium processor
– Directory amd64 for PCs with an AMD processor.
Checking the COM port
When transferring data from the handheld unit to the PC, or for a firmware
upgrade, you may have to give the COM port the handheld unit uses to communicate with. The COM port can be found via the device manager of the operating
system. For example, with Windows XP at:
Start/Control Panel/System/Hardware/Device Manager/
Ports (COM and LPT)/OTT ADC (COMx)
The COM port is only shown if the handheld unit is connected to the PC via the
USB port and is switched on.
9.2.2 How to install the software
Save QReview files from the relevant directory on the CD supplied onto the
hard drive of the PC.
Start the application: Double click on QReview.exe
47
9.3 Transferring data to the PC
Requirements:
Software and drivers are installed. The COM port used for the handheld unit is
known (see Chapter 9.2.1, Section "Checking the COM port").
How to transfer data to the PC
Connect the handheld unit to the PC via the USB connection. Use the USB cable
supplied for this.
Switch on the handheld unit.
Start the OTT QReview application (double-click on QReview.exe).
Select ADC tab and click on Connect.
– If necessary, check which COM port the handheld unit is available on.
– In the subsequent window, select the relevant COM port from the drop-down
menu and click on Connect.
The files are displayed in the the area Files on ADC in the Connect window. To
save the files on the PC, proceed as described below:
Highlight the files required.
Under Files on desktop, select a directory where the files are to be stored.
Click on the Retrieve files button.
The selected files are saved in the relevant directory on the PC. If no further files
are to be saved, you can close the Connect window.
9.4 Processing and exporting data
In order to be able to process an ADC file saved on the PC with OTT QReview,
you first have to open it:
Select File/open in the main window of OTT QReview.
In the subsequent window, select the required file from the relevant directory,
mark it and confirm with ok.
In the Graphics tab, the measurement data for the selected file are shown graphically, and in the Data tab they are listed.
48
9.5 Menu functions in OTT QReview
You can edit the measured data, print it or export it. For this there are various
menus available described briefly below. An exact description of the individual
menu functions can be found in the online operating instructions for OTT QReview
(Help menu).
Using the File menu, open a new file or print out a file already open.
In the Edit menu you can adapt the measurement data and recalculate it – e.g.
you can change the calculation method.
In the Settings menu you specify certain calculation parameters, e.g. a value
that influences the calculation of the average flow velocity (PowerLaw) or the
unit to be used.
In the Settings menu, select the software language.
With the Tools menu you can carry out a PowerLaw analysis and thus represent
the relationship of the average flow velocity to the waterway depth.
In this menu, you can also start the upgrade of the user firmware for the handheld unit (see Appendix C "Firmware upgrade").
The ADC menu is used for transferring of measurement data from the handheld
unit to the PC (see Chapter 9.3 "Transferring data to the PC").
The Export menu offers an open interface for the export of data in various formats (.txt, XML, depth list), so that the data are also accessible to other evaluation programs, e.g. for BIBER, SoftwareQ or Excel.
The Help menu provides information on the software used, e.g. the current version of OTT QReview.
Here you can also find the online operating instructions.
49
10 Maintenance work
The high-quality design of the OTT ADC makes only a little maintenance work
necessary.
10.1 Handheld unit
Ensure that the USB port on the handheld unit is closed with the special protective cover when not in use.
Check the charging state of the battery before and after the measurement and
charge the battery if necessary.
The battery only needs changing after being charged more than 500 times.
Never replace the battery yourself! The replacement must be done at the
factory by the OTT repair center (see Appendix E "Repair").
Always carefully dry a handheld unit that has been made wet before placing in
the transport case!
Store the handheld unit in the transport case supplied when it is not in use. In
this way it is protected from dust, damp and contamination.
Wipe the handheld unit with a slightly damp, lint free cloth as necessary. Do
not use wet cloths or aggressive solvents, cleaning materials or abrasives!
10.2 Sensor
Before you pack the device after a measurement, remove any contamination
and dry the sensor and rods with a dry, lint free and absorbent cloth.
Regularly check the ultrasonic transducers for contamination, for example by
sand. If necessary, clean the transducers with a lint free cloth or a soft brush.
After using the sensor in sandy or muddy waterways, the sensor body should
be cleaned under clear, running water. Ensure at the same time that the holes
for the pressure cell chambers are washed out so that all contamination is
removed. With heavy soiling, it is recommended that the sensor is first placed
in clear water for a few minutes until all encrustation is dissolved.
Store the sensor in the transport case supplied when it is not in use. In this way
the device is protected from dust, damp and contamination.
50
11 Warnings and error messages
During a measurement, you may see warning messages or error messages on the
display of the handheld unit. The messages and their meaning are listed below.
11.1 Warnings
Stream width is incorrect. Check Edges.
The distance between near and far edges is too small. It must be at least 0.5 m.
➔ Change the position of the near and far edges as appropriate.
(Discharge Measuring /Settings/Discharge [1/3]/Near Edge or Far Edge)
This file already exists. Press [1] to overwrite.
The file name given already exists.
➔ Press key 1 to overwrite the file (deletes the existing data) or allocate a new
file name.
Cannot calculate Nr of verticals. Spacing = 0
The user has given the value 0 for the distance between verticals. The OTT ADC
cannot therefore calculate the overall number of verticals in the measurement
cross-section.
➔ Enter a spacing value > 0.
(Discharge Measuring /Settings/Discharge [1/3]/Verticals/Spacing)
Position is beyond edge
The position of the verticals lies outside the area defined by the near and far
edges.
➔ Check the near and far edges and adjust the position of the verticals
appropriately
(Discharge Measuring /Settings/Discharge [1/3]/Verticals/Position) or
(Discharge/START/... /Vertical i/Position or Next vertical [i]/Position)
Depth cannot be zero. Please enter a valid depth.
At the start of the measurement of the first measure point of a new vertical, the
water depth is automatically set to zero. The user is thus forced to give the
water depth for each vertical.
➔ Measure water depth
(Discharge/START/Start Measuring/.../Point #i/Water Depth)
Not enough valid data
There are not enough valid measured values available to calculate the average
flow velocity. Possible causes are an SNR value that is too low or water turbulence that is too high, each of which can lead to invalid measurements (see
also Chapter 8.4 "Internal quality check").
51
11.2 Critical error messages
If a critical error message is displayed, a discharge measurement started cannot
be finished.
FILE SYSTEM FAIL. Press [1] to FORMAT
Can occur once after switching on a new handheld unit for the first time or a
handheld unit with a new flash memory chip.
➔ Press key 1 and format the flash memory.
Could not open/close/write to/delete the file
Error in internal file system.
➔ Format recorder.
(Advanced/Format recorder)
If the error reoccurs, there is a device error.
➔ Send the handheld unit and sensor to the OTT repair center.
Error while starting sensor
The CPU (Central Processing Unit) of the handheld unit could not make a connection to the digital signal processor at startup.
➔ Send the handheld unit and sensor to the OTT repair center.
Please note
If a repair is necessary, please send both the handheld unit and sensor in the
transport case to the OTT repair center irrespective of which system components
are affected by the repair. The address of the OTT repair center can be found in
Appendix E "Repair".
52
12 Troubleshooting
The depth measured seems unrealistic.
Sensor properly calibrated in the air?
➔ Calibrate the pressure cell as described in Chapter 6.2.1.
After switching on the handheld unit, startup process completed ("++++"
symbols disappear in the display) before calibration function was called?
➔ Only calibrate after the end of the startup process.
Sand or mud in pressure cell chamber?
➔ Clean the chamber as described in Chapter 10.2.
Sensor correctly connected to the handheld unit?
➔ Check the sensor connection cable. Check the number (12 ) and alignment of the contact pins in the connector (see Chapter 4.1).
No velocities are displayed during measurement operation (-.--).
Continuous data output set?
➔ Set the measured value display to Continuous.
(Main menu [2/2] /System Settings/System Menu/Display)
Ultrasonic transducers dirty?
➔ Clean the ultrasonic transducers of any soiling (sand, mud, flotsam such
as leaves or similar).
Sensor correctly connected to the handheld unit?
➔ Check the sensor connection cable. Check the number (12 ) and alignment of the contact pins in the connector (see Chapter 4.1).
The velocity measured seems unrealistic.
Ultrasonic transducers soiled or damaged?
➔ Check the ultrasonic transducers for contamination (for example by sand)
and for damage. If necessary, clean the transducer with an absorbent lint
free cloth or a soft brush.
Sensor correctly aligned?
➔ Align the sensor at right angles to the measurement cross-section (see
Chapter 8.1). Ensure that the rod is held straight.
Obstruction in front of the sensor?
➔ Remove the obstruction or select a different measuring position.
Data quality sufficient (SNR > 10, display symbol for data quality solid)?
➔ Choose a different measuring position if necessary.
The SNR value does not change or only little.
Sensor properly calibrated in the air?
➔ Calibrate the pressure cell as described in Chapter 6.2.1.
53
13 Technical data
Velocity measurement
Measuring range
Accuracy
Resolution
Measured volumes
Distance from sensor
Diameter
Length
Acoustic frequency ultrasonic transducer
Depth measurement
Piezoresistive pressure cell (absolute)
Measuring range
Accuracy
Resolution
Max. overload
Temperature measurement
Measuring range
Accuracy
Resolution
Salinity
Range
Power supply
Type
Nominal voltage
Life
Charging cycles
Output voltage/current of power supply
Operating conditions
Operating temperature range
Storage temperature range
Shock resistance
Dimensions and weight
Cylindrical sensor body
Length
Weight in air
Weight in water
Handheld unit
Weight
Dimensions (L x W x H)
Material
Sensor housing
Screws
Handheld unit
Keyboard
IP protection class
Handheld unit
– Plug3) connected
– Plug3) not connected
Sensor (except for the plug3))
1)
2)
3)
54
–0.2 m/s to +2.4 m/s
±1 % of the measured value ±0.25 cm/s
0.001 m/s
10 cm
1 cm per sound pulse
5 cm
6 MHz
0 to 5 m
0.1 % FS
0.01 % FS
1.5 times the measuring range
–5 °C to +35 °C
±0.5 °C
0.1 °C
0 ppt to 50 ppt (mg/l)
fixed battery pack, NiMH
9.6 VDC
typically > 14 hours1)
> 5002)
18 VDC/1 A
–20 °C to +60 °C
–40 °C to +85 °C
compatible with EN 60068-2-32
Ø 40 mm
14.5 cm
800 g
620 g
700 g
23.3 cm x 8.3 cm x 3.2 cm
Delrin® / stainless steel
stainless steel
aluminium, powder coated
Autotex V 150 XI
IP 65
IP 40
IP 68
battery life which can be actually achieved depends on environmental conditions and on the number of charging cycles
completed
the number of charging cycles depends on the application, environmental conditions and other factors
for the sensor connection cable
EMC
EN 61000-6-2:2001
EN 61000-6-4:2001
FCC Part 15, subpart B, Section 145109
EMC Directive 89/336/EEC, Article 4
EMC Directive 2004/108/EU, Article 5
Internal data memory
Capacity
Ultrasonic transducers
Frequency
Beam angle
OTT QReview software
Operating system
Functionality
4 MB (flash)
6 MHz
20°
Windows®98, Windows®ME,
Windows®NT, Windows®2000,
Windows®XP, Windows® Vista
Data transfer from handheld unit
Data check and processing
Data export (XML, ASCII)
55
14 Order numbers and accessories
OTT ADC – acoustic digital current meter
Versions available with version code
– with 2.5 m connection cable and adapter for Ø 20 mm rods
– with 6 m connection cable and adapter for Ø 20 mm rods
– with 10 m connection cable and adapter for Ø 20 mm rods
– with 2.5 m connection cable and adapter for rod type USGS
– with 6 m connection cable and adapter for rod type USGS
– with 10 m connection cable and adapter for rod type USGS
10.500.001.9.0
1R
2R
3R
1H
2H
3H
OTT ADC accessories
Power supply with AC/DC converter
10.500.420.9.5
Universal power adapter set for power supply
97.850.022.9.5
Charging cable
10.500.428.9.5
Adapter for 12 V (vehicle connection)
97.850.025.9.5
Universal attachment for handheld unit
10.500.057.9.5
USB connection cable for PC connection
97.120.337.9.5
Protective cover for handheld unit USB socket
10.500.425.9.5
Bubble level
99.960.003.9.5
Rod accessories
Rod Ø 20 mm
with base plate and point
56
Division into dm
– 2 m long, 2-part
– 3 m long, 3-part
– 4 m long, 4-part
– 5 m long, 5-part
– 6 m long, 6-part
16.000.126.9.2
16.000.128.9.2
16.000.129.9.2
16.000.130.9.2
16.000.131.9.2
Division into cm
– 2 m long, 2-part
– 3 m long, 3-part
– 4 m long, 4-part
– 5 m long, 5-part
– 6 m long, 6-part
16.000.136.9.2
16.000.138.9.2
16.000.139.9.2
16.000.140.9.2
16.000.141.9.2
Extension pieces for Ø 20 mm rods
1 m long, division into dm
– 3-4 m
– 4-5 m
– 5-6 m
– 6-7 m
16.000.152.3.2
16.000.153.3.2
16.000.154.3.2
16.000.155.3.2
Extension pieces for Ø 20 mm rods
1 m long, division into cm
upon request
HERES top setting wading rod
Push on rod for Ø 20 mm rods
Allows the sensor to be vertically adjusted in the water.
The top setting wading rod is 1 m shorter than the respective rod in each case.
– 2 m long, 2-part
16.000.081.9.2
– 3 m long, 3-part
16.000.082.9.2
– 4 m long, 4-part
16.000.083.9.2
– 5 m long, 5-part
16.000.084.9.2
Direction indicator for rod
16.000.090.4.2
for showing the sensor direction when mounted without HERES top setting wading rod
Rod holder
with carrying strap
for a maximum of 6 rod lengths each of 1 m
or 5 HERES top setting wading rod pieces each 1 m long
16.000.007.2.1
Replacement pieces for HERES top setting wading rod
– starting piece, 1 m long
16.000.088.9.2
– middle piece, 1 m long
16.000.040.9.2
– end piece, 1 m long
16.000.038.9.2
57
Appendix A – Theory and practical suggestions for
discharge measuring with the OTT ADC
The discharge in flowing waterways is defined as the water volume that flows
through a particular cross-section in the time unit (DIN 4049 Part 1). It is normally
given in m3/s or l/s and is the product of the average cross-section velocity and
the discharge cross-section flowed through.
Fig. 18: Example of a discharge crosssection for discharge measurement.
The discharge measurement with the classic verticals process is an indirect measuring method. The goal of the measurement is to determine the average flow
velocity of the specified verticals and at the same time determine the discharge
cross-section. In this way it is possible to calculate the discharge using a mathematical model at the end of the measurement (see Section A.2 "Overview: Methods of flow calculation").
A.1 Overview: Methods for velocity measurement
The average flow velocity at a vertical is calculated from a defined number of
individual measurements at different depths. Applied to the vertical depth these
individual velocities give an image of the velocity distribution (velocity surface, see
also hatched surface in Figure 18). The quotient of velocity surface and water
depth is the average flow velocity.
For the arrangement of individual points there are various methods. The following
methods can generally be differentiated:
Velocity distribution method (multi-point method)
Method with reduced measure points
Supplementary methods
58
The following table contains an overview of all methods for velocity measurement
that are supported by the OTT ADC.
Tab. 3: Methods supported by the
OTT ADC for velocity measurement
Method
Position of measure points
Formula for calculating the mean
velocity
Comments
1-point measurement
0.6 x h
Vm = V0.6
A
2-point measurement
0.2 / 0.8 x h
Vm = (V0.2 + V0.8 ) / 2 A
3-point measurement
0.2 / 0.6 / 0.8 x h Vm = 0.25 x (V0.2 +
2 x V0.4 + V0.8 )
4-point measurement
0.2 / 0.4 / 0.7 /
0.9 x h
5-point measurement
near to surface /
Vm = 0.1 x (VO +
0.2 / 0.6 / 0.8 x h 3 x V0.2 + 3 x V0.6 +
/ near to bed
2 x V0.8 + VS)
B
6-point measurement
near to surface /
0.2 / 0.4 / 0.6 /
0.8 x h / near to
bed
Vm = 0.1 x (VO + 2 x
V0.2 + 2 x V0.4 + 2 x
V0.6 + 2 x V0.8 + VS)
B
2-point Kreps
near to surface /
0.62 x h
Vm = 0.31 x VO
+ 0.634 x V0.62
C
1-point ice measurement
0.5 x heffective
Vm = V0.5 x Kice
Kice =
0.88 – 0.90
Vm = 0.25 x ( V0.2 +
V0.4 + V0.7 + V0.9 )
(ISO 1996 )
2-point ice measurement
0.2 / 0.8 x heffective
Vm = (V0.2 + V0.8) / 2
Surface
1-point measurement
near to surface
Vm = VO x KO
Multi-point measurement
Number and position of the measure
points are freely
selected
KO =
0.84 – 0.9
(ISO 748 )
See figure 19
D
A – Method with reduced measure points
Advantage:
Disadvantage:
lower time requirement
based on the assumption of a consistent, logarithmic velocity
distribution.
With new stations it is recommended to confirm the accuracy of the method with
reduced measure points by using comparative measurements with the multi-point
method.
59
B – Supplementary methods
Supplementary methods with which the velocity near the surface VO and the velocity near the bed VS are measured require that the sensor is positioned as near as
possible to the water surface and the waterway bed. Near the water surface the
sensor must be completely submerged. The position of the highest and lowest
measure points should be the same for each vertical as far as possible. It should
be ensured that a measurement immediately below the surface is not influenced
by wind and random surface waves.
C – 2-point KREPS measurement
Approximation method from the year 1949 where the velocity near the surface
and at 38% of the depth are measured. It is named after its developer, Oberbaurat (government building officer) Dr. techn. Harald Kreps (Austrian hydrologist).
The notes under A apply.
D – Multi-point method
With this method, the measure points are allocated freely based on the water
depth and flow conditions. It is also here important that the highest and lowest
measure points are positioned as near to the water surface/bottom as possible.
The following table gives a rough guide to the number of measure points.
Tab. 4: Number of measure points in
relation to the waterway depth
Water depth
in m
Number of
measure
points
<1
3-4
1-3
4-6
4-7
5-8
>7
6-10
Advantage: Exact recording of the velocity surfaces
Disadvantage: Decreasing measurement reliability with varying water levels.
60
The average flow velocity is calculated according to the following rule:
Fig. 19: Calculation of the average
flow velocity
h1
V1
h2
V2
h
h3
V3
h4
V4
V5
h5
V6
Vm =
( V1 + V2 ) x h1+ ( V2 + V3 ) x h2 + ... + ( Vn -1 + Vn ) x hn -1
2h
A.2 Overview: Methods of discharge calculation
The calculation of the discharge can be done with either graphical or arithmetic
methods. The graphical methods require large amounts of processing power, and
are therefore supported by conventional evaluation programs for discharge volumes (e.g. SoftwareQ/BIBER).
The OTT ADC supports the arithmetic calculation method according to EN ISO 748.
MEAN section method (procedure with average cross-section)
With this method, the measurement cross-section is divided into individual flow
segments. Each partial segment is limited by two adjacent verticals.
Cross-section zero point
Fig. 20: MEAN section method
bn
bn -1
b4
b3
b2
b1
1
vm1 h1
2
vm2 h2
3
vm3 h3
4
vm4 h4
n-1
vm (n -1) hn -1
n
vm n hn
Segment
3-4
q3 – 4 =
Vm3 + Vm4
2
x
h 3 + h4
2
x ( b4 – b3 )
61
The equation given describes the discharge calculation for an individual segment
for the MEAN section method. The total discharge is thus the sum of the partial
discharges of all segments.
Comment
The additional discharge element of the two edge segments is calculated with the
assumption that speed and depth at the edges are zero.
MID section method (mid cross-section method)
With the mid cross-section method, the measurement cross-section is also divided
into individual segments. The individual segments do not, however, lie between the
verticals, but are defined by half the distance to the neighboring vertical in each
case. For this reason, the first and last verticals should be as near to the edges as
possible when using this method.
Cross-section zero point
Fig. 21: MID section method
bn
bn -1
b4
b3
b2
b1
1
2
vm2 h2
vm1 h1
q3 = Vm3 x
(b3 – b2 ) + (b4 – b3 )
2
3
vm3 h3
4
vm4 h4
n-1
vm(n -1)h
x h3
The equation given describes the discharge calculation for an individual segment
for the MID section method. The total discharge is thus the sum of the partial discharges of all segments.
62
Comment
In practice, experience shows that this method leads to more exact results compared to the average cross-section method and is also quicker to calculate. It is
therefore the default setting for the handheld unit of the OTT ADC.
Taking account of vertical edges
Both previously described methods take account of the flow element in the edge
areas with vertical edge walls using the following method (Fig. 22).
Cross-section zero point
Fig. 22: Taking account of vertical edges in
the discharge calculation
b3
b2
b1
1
h1 qR
qR = h1 x
( b2 – b1 )
2
2
vm 2
h2
x KR x Vm2
KR: edge factor for allowing for the roughness of the edge wall
The edge factor KR is dependent on the roughness of the edge. The KR values
shown in the following table can be considered as guide values.
Tab. 5: Edge factor KR dependent on the
roughness of the edge
Edge characteristics
KR
Smooth edge with no vegetation (e.g. concrete, steel, 0.8 – 0.9
cement)
Brick sides
with vegetation
0.7
Rough walls
with heavy vegetation
0.6 – 0.5
63
Appendix B – Flow velocity measurement with the
OTT ADC (functional principle)
For the measurement of the flow velocity, the OTT ADC is aligned towards the
flow.
As the sensor body influences the incoming flow dependent on the flow velocity,
the velocity measurement is a two-stage process:
1. Rough velocity measurement by a cell near the sensor
2. Exact velocity measurement in measured volumes
(approx. 10 cm in front of the sensor)
The measurement of the flow velocity is based on the evaluation of the phase difference from independent pulse echos.
For this purpose, the ultrasonic transducers of the OTT ADC sensor transmit in
each case two short ultrasound impulses with a modulation frequency of 6 MHz.
Afterwards the sensor receives the reflections caused by particles in the water. The
signal received is amplified, filtered and digitalized. With the information
attained, the phase shift of the two signals is calculated and converted into the
proportional velocity.
The current measured value is an average of the individually transmitted sound
impulses per sound pulse, which are transmitted in a burst lasting 75 ms. From
this the measured values each second for velocity, SNR and correlation are generated. Each measured value is subject to an internal quality check (see Chapter 8).
64
Appendix C – Firmware upgrade
The firmware relevant to the user is a program integrated into the handheld unit
that is responsible among other things for the representation of menus, sub menus
and subsequent windows. Every handheld unit is supplied with a particular version of the user firmware.
The version can be queried via the main menu [2/2].
See menu
System Status/System Info
Example of output: 1.03 / 117
The last three numbers (in the example 117 ) constitute the version number, which
is part of the firmware file name.
An upgrade of the firmware is only necessary if OTT Hydromet releases a new
firmware version, for example if new functions have been included.
Information on any releases can be found on the Internet at
www.ott.com. Here you can find the current firmware.
Firmware file name: ADC_Vxxx.bin .
xxx: Version number
The file name must not be changed!
Carry out the upgrade
The processing program OTT QReview is available to carry out the upgrade of the
user firmware. The upgrade is carried out in two steps:
1. Put the handheld unit into upgrade mode
2. Carry out the upgrade
Requirements:
The batteries of the handheld unit are charged (battery symbol in display is
completely filled)
The OTT QReview (QReview.exe) software is installed on the PC
USB driver of the handheld unit is installed on the PC
The current firmware is saved on the PC.
Please note
The batteries of the handheld unit must be fully charged for the upgrade process!
With insufficient power supply the upgrade process cannot be carried out.
1. How to put the handheld unit into upgrade mode
Switch off the device.
Connect the handheld unit to the PC via the USB connection.
Put the handheld unit into upgrade mode:
Press key combination "." and "–", hold and switch on the handheld unit.
The message FIRMWARE UPGRADE CHECKING STATUS appears on the
display. After a few seconds the UPGRADE CODE is requested.
Enter the upgrade code:
Enter the numbers 1, 2, 3 and 4 and confirm (press ■ key).
The handheld unit is now in firmware upgrade mode and ready for the upgrade.
65
2. How to carry out the upgrade
Start OTT QReview.
In the Tools menu select the ADC Firmware Upgrade menu point.
Select the current firmware in the subsequent window under Upgrade file and
confirm with the Open button.
Select the COM port Serial Port that is used by the USB interface that the handheld unit is connected to (see Chapter 9.2.1, Section "Checking the COM
port").
Press the Start button.
The upgrade is carried out. In the Status area of the ADC Firmware Upgrade window you can see information on the progress of the upgrade. As soon as the
upgrade is complete, a suitable message is displayed. The handheld unit is automatically switched off and put back into ready mode.
Please note
During the upgrade process the handheld unit must not be switched off. The
on/off switch of the handheld unit is therefore deactivated during the upgrade
process.
66
Appendix D – Standard settings
Settings on the handheld unit
Volume
Contrast
Background illumination
Units
Language
Measured value display (velocity)
Hours:Minutes:Seconds*
Year:Month:Day*
10
8
Automatic
Metric
English
Continuous
00:00:00
01/01/00
Standard settings for parameters for discharge measuring
Stream width
Near edge position
Far edge position
Position of first vertical
Spacing of verticals
Measure Order
Sensor offset
Point offset
Roughness
Correction factor (ice, 1-point measurement)
Correction factor (ISO, surface measurement)
Depth
Measurement duration (averaging time)
Salinity
10.00 m
0.00 m
10.00 m
1.00 m
1.00 m
alternating
0.00 m
0.00 m
0,70
0,89
0,80
0.00 m
30 s
0 ppt
System constants
Interval for calibrating the depth measurement
Automatic background illumination
(length of inactivity until switching off)
Permitted number of failed measurements
within a discharge measurement
Permitted change in velocity between two
measurements
Minimum spacing of the measure points of a
vertical with multi-point measuring
Minimum sensor depth
Required correlation value
Required SNR value
Distance of vertical to edge
Number of verticals
Number of measure points per vertical
30 min
30 s
max. 10
max. 0.25 m/s
0.10 m
0.02 m
40% – 100%
≥ 10 db
min. 0.02 m
1 – 100
1 – 10
* The values for date and time are carried forward and therefore deviate from the the basic
settings when delivered.
67
Appendix E – Repair
With a device defect, use Chapter 12 "Troubleshooting" to see if you can
resolve the problem yourself.
In case of device defects, please contact the repair center of
OTT Hydromet:
OTT Hydromet GmbH
Repaircenter
Ludwigstraße 16
87437 Kempten · Germany
Telephone +49 831/5617-433
Fax
+49 831/5617-439
[email protected]
Please note
Send both the handheld unit and the sensor to the OTT Repaircenter in the transport case provided irrespective of which component appears to be affected by the
fault.
Warning: Only have a defective OTT ADC checked and repaired by the repair
center at OTT Hydromet. Never make any repairs yourself under any
circumstances. Any repairs or attempted repairs carried out by the
customer will result in the loss of any guarantee rights.
68
Appendix F – Note on the disposal of old units
Within the member countries of the European Union
In accordance with the European Union guideline 2002/96/EC, OTT Hydromet
takes back old devices within the member countries of the European Union and
disposes of them in an appropriate way. The devices concerned by this are
marked with the symbol shown aside.
For further information on the return procedure, please contact your local sales
contact. You will find the address of the sales partners in the internet on
"www.ott.com". Please take into consideration also the national implementation
of the EU guideline 2002/96/EC of your country.
For all other countries
Dispose of the OTT ADC properly after taking out of service.
Observe the regulations valid in your country for the disposal of electronic
devices.
Never put the OTT ADC into the normal household waste.
Materials used
See Chapter 13 "Technical data".
69
Appendix G – Declaration of conformity
70
Data Files
3. View Data
Vertical nr. i (x%)
Filename
Depth Calibration
5. START
5. Rod Offsets
4. Verticals
3. Far Edge
2. 2 Point Kreps
1. Position
2. Using
MID-section /
MEAN-section
1. 6 Points
4. Stream width
2. Point offset
1. Sensor offset
3. Measure Order
2. Spacing
3. Corr.factor
Discharge (3/3)
2. Salinity
1. Averaging
Only relevant for Ice,Single point
and ISO, Surface
1. Multipoint
5. ISO, Surface
4. Stream width
1. First pos.
4. Ice, Two point
3. Roughness
3. Ice, Single point
5. 5 Points
3. Roughness
2. Depth
4. 4 Points
2. Depth
3. 3 Points
2. Near Edge
1. Position
1. 1 Point
4. Notes
1. Measure Method
2. 2 Points
1. Load settings only
Discharge (2/3)
2. Continue a previous
measurement
1. Load ...
Discharge (1/3)
3. Party
2. Name
1. Settings
Discharge Measuring
2. Depth Calibration
1/2
H.1
1. Discharge
Main Menu
Appendix H – Overview main menu
Main menu part 1
71
H.2
Main menu part 2
Main Menu
1. Delete files
2/2
Delete
1. File 1
...
2. File 2
2. System Status
System Info
3. System settings
System Menu
System information:
– Free Memory
– Battery
– Serial Nr.
– Fw (Firmware version)
1. Date and Time
2. Display
1. Backlight
1. On
2. Automatic on/off
3. Off
3. Sound level
4. Advanced
Advanced
1. Language
2. Contrast
3. Velocity display
1. Continuous
1. English
2. Result only
2. Dutch
3. German
4. Spanish
5. French
2. Key Sound
ON / OFF
3. Units
1. Metric
2. Imperial
4. Format Recorder
5. Reset
72
OTT Hydromet GmbH
Document number
10.500.001.B.E 05-0213
Ludwigstrasse 16
87437 Kempten · Germany
Tel. +49 831 5617- 0
Fax +49 831 5617-209
[email protected] · www.ott.com