1
C60 System - User Manual
o
o
o
o
o
o
o
o
o
o
o
o
o
o
o
o
o
Measure frequency responses from 10Hz to 4MHz
Frequency axis displayed logarithmically or linearly
Measure amplitude responses
Gain or loss displayed in dBs
Measure phase responses
Phase display ranges of 0o to 180o or ± 180o
Measure complex impedance responses
Display impedance in Ohms or admittance in Siemens
Calculate time delays
Produce professional graphs with 10 plots per graph
Interactive powerful graphing program
Save graphs as data files and jpg, bmp and meta files
Copy and paste plots from one graph to another
Easy to use PC interface
Reliable performance
Small, light weight, portable, USB powered device
Affordable
www.cypherinstruments.co.uk
Cypher Instruments Ltd
Page 2 of 121
Contents
© Copyright Cypher Instruments Ltd 2005 - 2006. All rights reserved.
Contents................................................................................................................................................. 2
Legal Disclaimer, Warnings and Restrictions ............................................................................................. 4
Product Description ................................................................................................................................. 5
Installing the Software ............................................................................................................................ 7
Installing the Software from the CD ...................................................................................................... 7
Software and Firmware Web Updates ................................................................................................... 9
Using the CypherGraph Software ........................................................................................................... 12
Menu Bar .......................................................................................................................................... 13
Tool Bars........................................................................................................................................... 28
Status bar ......................................................................................................................................... 30
Viewing a graph................................................................................................................................. 31
Measuring Amplitude Response.............................................................................................................. 39
Obtaining optimum results ................................................................................................................. 43
Measuring Impedance Response ............................................................................................................ 45
System Limitations ................................................................................................................................ 49
Harmonics ......................................................................................................................................... 49
Phase detection ................................................................................................................................. 50
Phase accuracy.................................................................................................................................. 52
Dynamic range .................................................................................................................................. 53
Time smearing................................................................................................................................... 54
Impedance boundaries....................................................................................................................... 55
Impedance accuracy .......................................................................................................................... 57
Applications Notes................................................................................................................................. 58
Filter responses ................................................................................................................................. 58
Ceramic resonators ............................................................................................................................ 60
Ultrasonic transducers........................................................................................................................ 61
Acoustic transducers .......................................................................................................................... 63
Simple reactive components – L C R ................................................................................................... 64
Battery impedance ............................................................................................................................. 68
Characteristic impedance – Cables ...................................................................................................... 69
Measuring delay times – Cables .......................................................................................................... 71
Digital audio devices .......................................................................................................................... 72
Transformer – Transmission ............................................................................................................... 73
Transformer – Reflected Impedance ................................................................................................... 74
Appendix A ........................................................................................................................................... 75
Amplitude responses and phase shifts in simple electrical circuits ......................................................... 75
Appendix B ........................................................................................................................................... 79
Reactance and Impedance in simple electrical circuits .......................................................................... 79
Appendix C ........................................................................................................................................... 81
The scripting language ....................................................................................................................... 81
Script commands ............................................................................................................................... 82
Appendix D........................................................................................................................................... 95
Installing CypherGraph....................................................................................................................... 95
Installation on Windows ’98................................................................................................................ 96
Installation on Windows ME.............................................................................................................. 101
Installation on Windows 2000........................................................................................................... 106
Installation on Windows XP .............................................................................................................. 113
C60 & CypherGraph User Manual
November 2006
Part # MAN-C60-1.2
Cypher Instruments Ltd
Preface
Page 3 of 121
written by Tim Orr
I have been designing electronic filters for about 35 years. These have been active and passive devices.
Since the arrival of personal computers and design software, it has been possible to design and simulate a
wide variety of filters. Of course, in the real world, you cannot purchase the precise component values that
this software generates. Also, real components are far from perfect. Capacitors and inductors have parasitic
elements and natural resonances; op amps have bandwidth, slew rate and phase shift problems and printed
circuit board tracks seem to do their very best to defeat your designs. Even if you can over come all these
hurdles, a design still has to be built and tested. This is also a problem because there isn’t much equipment
out there that will test filters and networks at a price that the average engineer can justify spending.
Recently, the frequency response analyser that I purchased 15 years ago, became unusable because its
consumables have been discontinued. I needed to obtain a new piece of test equipment just to satisfy my
own needs! I had designed many frequency response analysers over the last 30 years, and so we set out to
produce another unit based on what was the best current technology. The plan was to make a USB
peripheral device that would employ all the power of the PC to produce, store and print graphs. After 2
years of design work (mission creep) the C60 was produced. One result of deviation from the original design
brief was that the unit not only measures Amplitude and Phase frequency responses, but it also measures
Impedance responses. This reveals the often bizarre behaviour of electronic and electro-acoustic devices. I
wish that I had owned one of these machines 10 years ago when we were designing ceramic PZT
transducers. Many mysteries would have been easily observed, rather than just guessed. Any way, that’s
life.
Adam Fullerton
Software & Firmware
C60 & CypherGraph User Manual
Rene Fullerton
Logistics
November 2006
Tim Orr
Electronics
Part # MAN-C60-1.2
Cypher Instruments Ltd
Page 4 of 121
Legal Disclaimer, Warnings and Restrictions
The C60 has a low impedance output and a very sensitive input. Passive electronic circuits inside the unit
provide a level of protection to these ports, even when the unit is powered down. Do not exceed the voltage
and current restrictions applied to the input and output connectors, as specified in this manual. These are
not operating conditions, they are dangerous limits. Applying excessive voltages and currents will cause
dangerous power dissipation inside the C60 which can result in unexpected operational behaviour and/or
permanent damage.
WARNING:- Do not connect high voltages to any connector or other part of the C60. These
voltages will damage the C60 and other equipment to which it is electrically connected, such as
the computer. Also, these high voltages are dangerous and represent a risk to health.
Customers are responsible for their testing scenarios and interpretations of test results. Persons using the
product must have a scientific or engineering training, be familiar with the use of personal computers and
must observe good laboratory test methods and standards. Cypher Instruments assumes no liability for
customers test results and interpretations. The customer assumes all responsibility and liability for the
proper use of the equipment and software.
Cypher Instruments assumes no responsibility software performance, or infringement of patents or services.
The customer indemnifies Cypher Instruments from all claims arising from the use of the product.
Reproduction of the C60 user manual and any other information from ‘Cypher Instruments Ltd’ is freely
permitted only if the reproduction is done without any alterations and is accompanied by all associated
notices, legal disclaimers, warnings, warranties and restrictions. Cypher Instruments Ltd is not liable or
responsible for any such modified documentation.
Resale of Cypher Instruments products and services with statements different from the those stated by
Cypher Instruments for that product or service, voids all warranties for the associated product or service. As
such, Cypher Instruments is not liable for any such statements.
Cypher Instruments reserve the right to make corrections, enhancements and other changes to its products
and services at any time also to discontinue any product and service without notice. Customers should
obtain the latest information, software and embedded code from the web site.
Cypher Instruments does not warrant the completeness or the accuracy of the text, information, graphics
graphs, equations, diagrams or other material contained within the product manual.
The product is designed to operate in a laboratory at normal room temperatures. Operation at extreme
temperatures may result in unexpected behaviour. The unit has no harsh environmental ratings and will be
damaged by the ingress of moisture and/or corrosive chemicals. It has an IP30 rating:- prevention of small
objects bigger than 2.5mm from entering and no protection against the ingress of liquids.
C60 & CypherGraph User Manual
November 2006
Part # MAN-C60-1.2
Cypher Instruments Ltd
Page 5 of 121
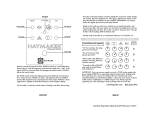
Product Description
The C60 investigates the opaque world of analogue networks. The unit operates in two test modes. It can
measure the frequency response of a two port system producing a gain/loss & phase graph. It can also
measure the reactive response of a two terminal network producing an impedance/admittance & phase
graph. Electronic, electrical, electro acoustic and other networks can be tested with swept sine waves and
the results displayed on a PC. The C60 is USB powered; it needs no batteries or external power supplies.
The unit has a USB-B connector at the rear, an input and output BNC connector and a USB Link activity LED.
All the functionality of the device is controlled by the PC.
DDS Sine wave generator/output
Frequency range of sine wave generator = 10Hz to 4MHz
DDS sine wave generator
Sine wave quality = 62dB SNAD (nominal)
Output voltage = 2Vpp maximum
Output attenuator, 0dB to -20.0dB in 2.5dB steps
DC offset at output = 0.9mV typical
Output impedance = 50 Ohms plus parasitic reactance of 23nH and 33pF (Impedance mode)
Frequency accuracy at 1MHz it is ±100ppm
BNC output connector
***** Destructive/Absolute Maximum Limits Applied to Output BNC*****
Absolute maximum current applied to output = 0.2Arms
Absolute maximum voltage applied to output = 9VDC or 22VppAC
Input channel
Input impedance = 1M ohm in parallel with 14.5pF
AC coupled input (0.15Hz high pass coupled)
Maximum signal input = 3.5Vpp maximum before compression (+5dB on graph)
Minimum input signal = 100uVpp (-86dB) with Rsource = 50R
Noise floor = -86dB at 1MHz/input S/C; -73dB at 1MHz/input O/C
BNC input connector
Absolute maximum voltage applied to input = 50VDC or 50VppAC (destructive limits)
C60 & CypherGraph User Manual
November 2006
Part # MAN-C60-1.2
Cypher Instruments Ltd
Page 6 of 121
Other hardware features
USB connection for data and power USB 2.0 full speed (12Mbps)
Mode led indicating Power and USB activity
Current consumption = 100mA to 220mA depending on activity
Power consumption = 0.5Watt to 1.1Watt depending on activity
Enclosure Ingress Protection rating = IP30
Size = 148mm x 132mm x 43mm – box size including feet and BNC connectors
Weight = 420 grams - box weight, not including the USB cable
Other details
Operating system requirements: Microsoft Windows 98SE, ME, 2000, XP pro with internet explorer 4 or
higher
Minimum PC requirements: Pentium II 333MHz, 64Mbytes of RAM, 50Mbytes of free hard disk space, mouse,
keyboard, USB, graphics card and monitor capable of 1024x768 resolution.
Advanced graphing program used to display test results
Maximum number of test points = 1000 per plot, 2 parameters per plot
Multiple plots; 10 plots per graph
User text fields
Logarithmic and linear frequency sweep and stationary frequency
Logarithmic and linear frequency axis
User controllable test settling time
User selectable range of frequency points
Logarithmic (dB) Gain/Loss amplitude display
Amplitude display range = +5dB to –86dB (0.025dB best resolution)
Amplitude detector straight line deviation = ±0.35dB
Phase accuracy = see graphs Phase accuracy
Phase range = ±180º and 0º to -180º
|Z| The modulus of the impedance of the test device (DUT)
Impedance accuracy = from ±0.5% to ±4.5% deviation from actual value (see graphs)
Impedance displayed in Ohms or Admittance in Siemens, on a linear/logarithmic axis
Impedance display range of 0.01 Ohms to ‘1M Ohm’ (450K Ohm maximum reading)
Auto ranging or fixed Impedance and Gain axes
Save/Recall as GAD and GZD files
Save graphs as JPEG images, BMP images, Meta files and data files
Use graphs in documents and emails
Graphing Controls; START, STOP, REPEAT, ZOOM, UNDO ZOOM, FULL SCREEN, USER TEXT FIELDS,
FREQUENCY LIMITS, SWEEP BACKWARDS, ALTERNATE SWEEP, SWEEP TO ZOOM EXTENTS, PEN
COLOURS, PEN LOCK, GRAPH SELECTION, COLOUR/BLACK/BLACK PLUS MARKERS, COPY, CUT, PASTE,
MASKS, SCRIPT CONTROL
Calibration option to remove internal amplitude deviations and phase trims
Multiple document operation
Scripting control of the unit
Applications
Measuring the frequency response (amplitude and phase) of systems
Impedance measurement of two terminal networks (including phase)
Design and production testing of electro acoustic transducers
Bio-chemical impedance measurements
Filter design and testing
Battery impedance testing
Cross talk and CMRR measurements
C60 & CypherGraph User Manual
November 2006
Part # MAN-C60-1.2
Cypher Instruments Ltd
Page 7 of 121
Installing the Software
If the software has previously been installed from the web site, there is no requirement to install the
software from the CD. Check the web site for the latest versions of the PC application and embedded code.
See the section Software and Firmware Web Updates for details.
Installing the Software from the CD
Warning: do not connect the C60 hardware to the PC with the USB cable before
the software has been installed.
Minimum requirements
o
Operating system requirements: Microsoft Windows 98, 98SE, ME, 2000, XP professional with
internet explorer 4 or higher
o
Minimum PC requirements: Pentium 2 333MHz, 64Mbytes of RAM, 50Mbytes of free hard disk space,
mouse, keyboard, USB, graphics card and monitor capable of 1024x768 resolution or better.
Installing the software
o
Quit all open applications.
o
If your computer has auto run enabled, then the software will automatically install. Insert the CD
into the drive and the installation will begin. Skip the next instruction.
o
If your computer has auto run disabled, then insert the CD into the drive and wait for the operating
system to read the disk. Hold the Windows key down and press the R key to open the run dialog
box. Type in the following- “#:\setup (enter)”, where # indicates the CD drive reference letter.
o
The dialog box - ‘Welcome to the CyperGraph Setup Wizard’ will appear. Click the ‘Next>’ button.
o
The ‘License Agreement’ box follows. Read it and if it is satisfactory, click ‘I Agree’.
o
If you already have CypherGraph installed on your PC, then you are prompted to uninstall the
existing version (recommended).
o
If this is a fresh installation, the ‘Choose Install Location’ box will appear. The usual location for the
software is C:\Program Files\CypherGraph\. Click ‘Install’.
o
The ‘Installing’ box will briefly appear, followed by the ‘Completing the CypherGraph Setup Wizard’
box. Click the ‘Finish’ button.
o
The CyperGraph application will now open. There is no other action needed, other than to remove
the CD.
o
Keep the CD in a safe place, for future use by you or your colleagues.
o
The C60 can now be connected to the PC via the USB lead. This will be the first time that the C60, a
USB device, has been registered with the computer. What happens next will depend on which
version of Windows is running.
o
Windows 98 and ME will automatically install the device driver without action on your part.
o
Windows 2000 will open the ‘Found New Hardware Wizard’. Click ‘Next>’. On the next dialog box
select ‘Search for a suitable driver for my device (recommended)’, which will complete the
installation.
o
Windows XP will open the ‘Found New Hardware Wizard’. Check the radio dial labeled ‘No, not this
time’ and then click ‘Next>’. On the next dialog box check the radio dial labeled ‘Install the software
automatically (Recommended)’ and click ‘Next.’ On the third dialog box click ‘Finish’ to complete the
driver installation.
o
Check the web site for the latest versions of the PC application and embedded code. See the section
Software and Firmware Web Updates for details.
C60 & CypherGraph User Manual
November 2006
Part # MAN-C60-1.2
Cypher Instruments Ltd
Page 8 of 121
Uninstalling the software
o
Navigate to the Control panel. Go to ‘Add or remove programs’. Left click on ‘CypherGraph’. Right
click on ‘Remove’.
See Appendix D for further software and device driver installation details.
C60 & CypherGraph User Manual
November 2006
Part # MAN-C60-1.2
Cypher Instruments Ltd
Page 9 of 121
Software and Firmware Web Updates
Periodically the PC software or Firmware of the instrument may be updated to add new features or fix bugs.
The Update Info. button on the About CypherGraph dialog provides the method of downloading and
installing software and firmware updates. From the Help menu select the About CypherGraph item. Click
the ‘Update Info’ key and then click the ‘Next>>’ key to check for available updates.
Select the ‘Check the internet for updates’ dial. This only works if the PC has internet access.
If the software and the firmware are up to date, then you will be prompted to leave. Otherwise, select the
firmware and software that you want to download. It is usual that both the software and the firmware
updates will be available. CypherGraph will only check for firmware updates when the instrument is
connected.
Click the ‘Next>>’ key.
Data will now be downloaded from the web and a blue progress bar will entertain you. In this example, both
the software and the firmware are downloaded from the web.
C60 & CypherGraph User Manual
November 2006
Part # MAN-C60-1.2
Cypher Instruments Ltd
Page 10 of 121
When the download is finished, you are asked to install the new firmware code into the internal processor of
the C60. Click ‘Next>>’.
Choose the serial number of the instrument that you want to upgrade. Usually there will only be one unit
connected.
A ‘WARNING’ states that the upgrade process will not
take kindly to being unplugged during this installation
procedure. The C60 has the capability to upgrade the
firmware which is stored in FLASH memory. The
original shipped firmware remains write protected,
but the remainder of the FLASH memory can be rewritten by the host computer. Upon reset, the original
shipped firmware is run. This firmware determines if
a newer version of code is present by using a CRC
check. If the newer version of firmware is found to be
correct, execution transfers to this code. This method
prevents an unrecoverable system crash that can
occur if a new program download is interrupted or
corrupted. Click the ‘Next>>’ key and hope that there
isn’t a power cut.
C60 & CypherGraph User Manual
November 2006
Part # MAN-C60-1.2
Cypher Instruments Ltd
Page 11 of 121
When the upgrade has been completed, click the ‘Finish’ key. The firmware has been modified and has been
installed inside the C60.
Now, install the CypherGraph software. This is a PC program. Click ‘Next>>’ and then ‘OK’.
Select the most recent file date and click ‘Open’. This takes you to the CypherGraph Setup Wizard. Click
‘Next>’. For details of software installation see Appendix D.
C60 & CypherGraph User Manual
November 2006
Part # MAN-C60-1.2
Cypher Instruments Ltd
Page 12 of 121
Using the CypherGraph Software
When the application is launched, a blank start up page is produced. If the device is not connected, then
tests cannot be performed, but existing graphs can be viewed. With the C60 connected, new graphs can be
produced and existing graphs can be viewed. The blank start up page is shown below. The Settings dialog
box will appear if a unit is attached.
The three boxes on the top right hand side are Minimize, which places the application on the task bar;
Maximize/Restore down, which controls the screen size of the application and Close, which turns off the
program.
The following text describes the menus and tools (in tedious detail), however for instant gratification, jump
to the section titled Viewing a graph, where as it suggests, you can view the example graphs that are
supplied with this product.
Ultrasonic transducer
Pen 1
Pen 2
Pen 3
15:15:52
Pen 6
Pen 7
Pen 8
Pen 9
Pen 10
10 4
Ultrasonic transducer
Pen 1
Pen 2
Pen 3
15:15:52
Pen 6
Pen 7
Pen 8
Pen 9
Pen 10
Elliptic low pass filter module
0
Modulus of Impedance - Ohms
10 3
17:24:26
Pen 2
17:28:55
17:31:53
Pen 5
Pen 6
17:27:34
17:33:27
Pen 9
Pen 10
-10
10 3
Modulus of Impedance - Ohms
-20
-30
Amplitude Gain - dB
10 2
-40
-50
10 2
-60
105
Frequency (Hz)
Produced by Cypher Instruments
106
-70
2*105
3*105
Frequency (Hz)
Produced by Cypher Instruments
-80
4*10 5
-90
104
C60 & CypherGraph User Manual
November 2006
105
Frequency - Hz
Produced by Cypher Instruments
106
Part # MAN-C60-1.2
Cypher Instruments Ltd
Page 13 of 121
Menu Bar
The row of text is called the menu bar, the function of which is described next.
File
The File handling drop down menu allows the user to open existing files (graphs), investigate file properties,
create new files, save, print and export them. Note that the commands in this menu can also be initiated by
control characters. For example, Ctrl+N = New File.
New starts a new file, which can be Amplitude or an Impedance response.
Open… takes you to the Plots folder, where
files (graphs) are stored. Double clicking on a
file will open it. There is a choice of plot file
extensions; gad which is the amplitude response
format and gzd, which is used for impedance
responses.
Close finishes work on the current file.
Save stores the current file in the Plots folder.
Hint, don’t use either / \ (slash) in the graph title
and CypherGraph will suggest this as the file
name.
Save As… stores the current file with the option
of choosing a new file name
Save All stores all files that are open in the application.
C60 & CypherGraph User Manual
November 2006
Part # MAN-C60-1.2
Cypher Instruments Ltd
Page 14 of 121
Properties… shows the properties of the graph
that is currently in focus. This information
includes the file path, size, and date of initial
creation. Also shown is the version number of
the PC software, the embedded code version
number and the hardware serial number of the
C60 used at the time of creation. If an old file is
reused with different hardware and software,
the File Properties do not reflect these changes.
Print… enables graphs to be printed directly
from the application. The best print quality is
obtained by this method. Colour, Monochrome
or graph markers can be selected in the Graph
View Options dialog as shown in The Graph View
Options section. The Setup… button takes you
to the dialog box for the installed printer, so that
the paper size and orientation can be chosen.
Export… can generate data files for use in
other programs. From the Text tab, select the
individual pen plot that is to be exported. Next,
press Save and enter the file name. Note; only
one plot at a time is exported, not the whole
graph.
The Text file contains the data that is
used to draw the individual plots. The
file can be opened and edited with
Microsoft’s Notepad and can also be
used by other graph plotting programs.
C60 & CypherGraph User Manual
November 2006
Part # MAN-C60-1.2
Cypher Instruments Ltd
Page 15 of 121
CypherGraph also produces image files. These formats are JPEGs, bit maps and meta files. These are useful
if you have to include the graphs in other documents. Generally the meta files give the best image quality.
First select the image file format. If you want good quality JPEG graphs, then choose a high resolution. Next
change the aspect ratio as desired and then Save the file, renaming it if needed.
There are many properties associated with file
formats and file sizes. The following pictures are all
the same graph. The graph on the right is a screen
capture which was saved as a JPEG file. This is not
an Export Image feature of CypherGraph. The file
size is 178k and is dependant on the screen image
resolution of the PC.
When Export Image is applied to the same graph,
with a 1600 X 1200 resolution, the files sizes are;
*.JPG = 398k
*.BMP = 7,501k (massive)
*.WMF = 130k
C60 & CypherGraph User Manual
November 2006
Part # MAN-C60-1.2
Cypher Instruments Ltd
Page 16 of 121
455KHz ceramic resonator
The top picture is the Export Image JPEG
output, with an aspect ratio of 1600 X 1200.
16:52:37
The Export Image BMP output file is so
massive (7.7Mbyte which is bigger than the
size of this manual) that it was not included
in this document.
Modulus of Impedance - Ohms
455KHz ceramic resonator
16:55:11
16:35:23
16:36:54
16:39:42
16:41:47
16:44:15
16:46:21
16:35:23
16:36:54
16:39:42
16:41:47
16:44:15
16:46:21
16:47:48
16:50:28
10 3
The WMF metal file (large middle and small
lower) is the smallest of these outputs. It
produces a good graphical image and has
good resizing, stretching, colouring and
transparency controls.
16:52:37
16:55:11
16:47:48
10 2
16:50:28
Modulus of Impedance - Ohms
10 3
10 2
3.3*106
3.4*106
3.5*106
Frequency - Hz
3.6*106
3.7*106
3.8*106
Produced by Cypher Instruments
3.3*10
6
3.4*10
6
3.5*10 6
Frequency - Hz
3.6*10
6
3.7*10
6
3.8*10
6
Produced by Cypher Instruments
Exit closes the application.
C60 & CypherGraph User Manual
November 2006
Part # MAN-C60-1.2
Cypher Instruments Ltd
Page 17 of 121
Edit
Undo zoom steps backwards through the graph Zoom history. There are some aberrations in this process,
but it does get there.
Redo zoom steps forwards through the graph Zoom history.
Cut, Copy, Paste allows the user to Cut or Copy a plot from one file and to Paste it into another. These
files must have the same file extensions.
Open two files. Click on the first graph and then select a pen number by clicking on one of the ten pen
colours. This is the pen plot that will be copied. Press Ctrl+C to Copy it. Now click on the second graph.
Select a pen number that has not been used. Press Ctrl+V to Paste the plot into second graph. This is a
very powerful method of editing and transferring plots. Cut (Ctrl+X) can also be used as a direct method of
deleting a plot in a graph.
Preferences… enables the user to customize some of the features of the application. Select the Pen
Colours tab and then double click on a colour box. This launches the Color dialog box which is used to define
the pen colour from a Basic selection or a Custom Colour range.
C60 & CypherGraph User Manual
November 2006
Part # MAN-C60-1.2
Cypher Instruments Ltd
Page 18 of 121
Use the preferences box to set up the default
view of the graph.
The Amplitude Response tab sets the
Frequency axis to be Logarithmic or Linear,
sets the Amplitude Scale range and controls
the settings of the Phase graph.
The Impedance/Admittance Response tab
sets the Frequency axis to be Logarithmic or
Linear, sets the Impedance/Admittance Scale
range and controls the settings of the Phase
graph.
The General tab has a selection of user
preferences. The pen selections are worth
considering. These can be set to overwrite a
plot, which could result in loosing valuable
work! To avoid this, pens can be locked after
a plot has been performed. Control of the
minor graticule shade is provided here.
C60 & CypherGraph User Manual
November 2006
Part # MAN-C60-1.2
Cypher Instruments Ltd
Page 19 of 121
The files associated with CypherGraph are
stored in four folders.
\Plots - GAD & GZD files are the Amplitude
and Impedance graphs.
\Export – data, BMP, JPG and WMF files are
stored in this folder.
\Script – is a programming language that
drives the hardware. This is useful for
automated applications.
\Updates – for the PC application and the
embedded code are held here.
C60 & CypherGraph User Manual
November 2006
Part # MAN-C60-1.2
Cypher Instruments Ltd
Page 20 of 121
View
The View menu controls the general view of the application and the graph.
Toolbar, Pen Bar, Status Bar turn on and off these Bar displays. This in turn affects the screen area that
is available for graphs.
Zoom Extents maximizes the horizontal and vertical range of the graph that is currently in focus. This
includes the phase graph if it was active.
Mark Data Points inserts solid markers on the graph (toggle action). These markers indicate the location
of test data points. Some flat plots can be obscured by the graph axis marks. Other plots have such dramatic
transitions that they are not visible on a maximized graph (see 1MHz crystal.gzd). Only when the Mark Data
Points function is active, are some plots are visible. Also, this function is useful for revealing under sampling
problems. In the following two graphs, the black and mauve plots are impedance plots of the same ceramic
resonator. Marking the data points reveals that the black plot is heavily under sampled. It misses most of the
response curves. Even the mauve plot needs more sample points.
455KHz ceramic resonator
6*10 2
Modulus of Impedance - Ohms
4*10 2
2*10 2
10 2
8*10 1
6*10 1
4*10 1
2*10 1
3.46*10
6
3.48*10
6
3.52*10 6
Frequency - Hz
Produced by Cypher Instruments
3.50*10
6
3.54*10
6
6
3.56*10
455KHz ceramic resonator
6*10 2
Modulus of Impedance - Ohms
4*10 2
2*10 2
10 2
8*10 1
6*10 1
4*10 1
2*10 1
3.46*10
6
C60 & CypherGraph User Manual
3.48*10
6
6
3.52*10 6
Frequency - Hz
Produced by Cypher Instruments
3.50*10
November 2006
3.54*10
6
3.56*10
6
Part # MAN-C60-1.2
Cypher Instruments Ltd
Page 21 of 121
Add Text allows the user to annotate a
graph. The graph title can be edited, as can
each of the 10 plot legends. Pens that are not
titled by the user are time stamped
(hh:mm:ss). The font & size can be selected
from the Graph View Options dialog box.
When a graph is saved, the program will
suggest that the ‘graph title’ is used for the
file name. This is a self documenting process.
However, if any of the following characters
are used in the title – (/,\.,:,*,”,<,>,|) the
user will have to manually enter a file name
containing valid characters.
Graph View Options selections can be
obtained from this menu. This dialog box can
also be accessed by right clicking on the
graph. The plots can be Locked, Unlocked,
Erased and Displayed or hidden, either
individually or as a complete block.
When a graph contains many plots, it
becomes difficult to identify each one. By
clicking the Display box, a plot can be made
to identify itself.
For a detailed explanation of the graph view
options available see The Graph View Options
section.
C60 & CypherGraph User Manual
November 2006
Part # MAN-C60-1.2
Cypher Instruments Ltd
Page 22 of 121
Test
Start, Stop and Repeat are commands that control the hardware. These commands are
also available from the horizontal tool bar.
Start causes the C60 to perform a frequency sweep test, the results of which are used to generate a pen
plot. At the end of a sweep, the pen number is incremented.
Stop terminates any test that is currently in progress. The system does not have a pause feature.
Repeat puts the unit into a repeat sweep mode. In this mode, tests which have been started continue
endlessly until they are stopped. Plots on the graph are over written when the pen counter revisits them.
However, pens can be locked to avoid this (see Graph View Options).
Run Script… enables the user to control the
C60 from a script file. Instead of typing and
pointing and clicking with the mouse to
perform a test, the user can run a previously
written list of commands. This allows the user
to create tests that can be opened and run,
enabling repetitive usage. The script language
is detailed in Appendix C of this document.
A non document text editor is used to edit the
scripts and error checking traps gross
mistakes. The script file is sent to the C60
where it resides in non-volatile memory. This
provides the user with the facility to configure
an instrument to perform a set of tests for a
particular application. The user then need
only to connect the device to the PC and Rerun the last test script. In combination with the C60’s digital control outputs this makes the instrument
particularly suited to production test and quality control applications.
For details of the scripting language see Appendix C.
Re-Run Last Script repeats the last Script run by the instrument.
Check mask compares the plot against the graphical masks. First select a pen from the pen bar. Then
select Test - Check mask. The selected plot will then be tested to see if it is inside the mask and a dialog box
will declare the test result.
C60 & CypherGraph User Manual
November 2006
Part # MAN-C60-1.2
Cypher Instruments Ltd
Page 23 of 121
Settings control the C60 electronics. The Oscillator tab of the
Settings dialog box controls the sine wave test generator. The
oscillator sweep range is from Frequency A to Frequency B, or B to A,
or Alternate. This last setting is very useful for the Repeat mode.
Frequencies are entered numerically and scientific notation (1k523 or
0.774M) can also be used. Click the Apply button to enter the data.
The sweep range can also be controlled graphically by checking the X
Axis extents box. This uses a Drag & Zoom function to define the
sweep range. If say, there is an interesting section in a plot, then
zoom into it and the next test will use these zoom limits to perform
the sweep.
The number of test points is set by a slider. With 1024 test points, the
graph has maximum resolution, but takes a long time to generate a
plot. The minimum number is 24 points, which allows the user
perform a quick test.
The Idle Output Frequency can be set to be Off (no output signal), or
On, at a frequency set by the User or the Test Start value. Choose
Test Start for Repeat mode. Extra time delays can be added to each
test point using Test period slider. This allows systems under test to
stabilize.
Most parameters are applied at the end of a test, although the
Number of test points slider is active all of the time.
The Engineering tab provides control of the sine wave output
attenuator. The output range is 0dB to -20.0dB, selectable in 2.5dB
steps. Best results are obtained by using a maximum level test signal.
The C60 has its own dynamic range issues and the use of low signal
levels will degrade performance. In the Amplitude response mode, the
C60 is designed to test systems with very little gain and lots of
attenuation. If the device under test (DUT) has a significant gain (X
dBs for example) then use a low impedance attenuator of X dBs at the
input of the test device.
The Monitor bar displays the input signal Amplitude or the ‘output’
DUT Impedance when the Monitor box is checked. This is used to
monitor the Amplitude or Impedance before a test. It is not active
during a test. The test frequency can be set manually.
The Diagnose key generates a self test graph. It displays the previous
calibration curve, the attenuator steps and the amplitude slope. This
graph is useful for remote fault diagnosis.
Calibrate Amplitude tests the amplitude flatness of the C60 and
applies a correction curve to plots. This process takes a long time.
The user should recalibrate regularly. Phase calibrates the internal
phase trim electronics. This process is performed automatically by the
instrument. When the phase calibration is performed a graph is
produced allowing fault diagnosis to be conducted remotely.
C60 & CypherGraph User Manual
November 2006
Part # MAN-C60-1.2
Cypher Instruments Ltd
Page 24 of 121
Device opens the Select Instrument dialog
box. If there is more than one unit connected,
then choose which one to use. The
instrument’s serial number is displayed. If
there is only one instrument plugged in to the
PC then press F6 to connect.
C60 & CypherGraph User Manual
November 2006
Part # MAN-C60-1.2
Cypher Instruments Ltd
Page 25 of 121
Window
The window menu provides control over the graph document windows. Alt + W followed by a number 1 to 9
provides quick selection of the first 9 document windows. Further documents may be selected through the
More Windows… dialog. Next document and Previous document cycle through the document list.
When there are multiple graphs open, Cascade
produces a cascaded display of graphs. Only the top
graph can be seen, but the others are placed in
focus by clicking on the blue bar at the top of their
box.
Tile Horizontal and Tile Vertical enable all graphs
to be made visible.
C60 & CypherGraph User Manual
November 2006
Part # MAN-C60-1.2
Cypher Instruments Ltd
Page 26 of 121
As more and more graphs are displayed, their size is reduced. There is no limit to the number of graphs
open. The limitation is one of screen resolution. Eventually, the graph and text is so diminished that it serves
no purpose having it on the screen. Even with many graphs open, the one that is in focus can be used to
perform tests.
Arrange Icons is used to organize graphs/icons that have been minimized.
Close All removes all graphs from the screen. If they need saving, then a prompt dialog box will appear
C60 & CypherGraph User Manual
November 2006
Part # MAN-C60-1.2
Cypher Instruments Ltd
Page 27 of 121
Help
The User Manual is viewable as a pdf document, with an active document map.
The Cypher Instruments On Line button menu item connects to the web site.
About Instrument lists the device
properties of the connected unit. Other units
will have different operating ranges and
functionality.
The About CypherGraph menu item details
the PC application and the embedded code
version numbers and the hardware serial
number.
The System Info button displays the system
information summary of the host computer.
The Update Info button connects to the web
site to check for the latest versions of the PC
application and the instrument firmware. For
more information see the section Software
and Firmware Web Updates.
C60 & CypherGraph User Manual
November 2006
Part # MAN-C60-1.2
Cypher Instruments Ltd
Page 28 of 121
Tool Bars
CypherGraph has two tool bars for quick access to regularly used functions. The function of these is
described below.
The horizontal tool bar
The horizontal tool bar contains several familiar and new tools. Some of these tools can be accessed by
right clicking on the graph document and then selecting them from the drop down menu.
From left to right these are; New test, which prompts the user to choose an amplitude or impedance test;
Open an existing file, again with a user choice of amplitude or impedance; Save a graph; Export a plot as
a text file or a graph in an image format and Print the current graph on the installed printer.
From left to right these are; Cut, Copy and Paste. These allow the user to Cut or Copy a plot from one file
and to Paste it into another. These files must have the same file extensions. Open two files. Click on the first
graph and then select a pen number. This is the pen plot that will be copied. Press Ctrl+C to copy it. Now
click on the second graph. Select a pen number that has not been used. Press Ctrl+V to paste the plot into
second graph.
From left to right these are; Graph view options; Add text to the current graph; Mark Data Points on
the selected graph; Zoom extents, which maximizes the graph display range; Undo and Redo, which step
through the zoom history.
From left to right these are; Start test, which initiates the test procedure and graphing program (referred
to as a plot); Stop test, which halts this process and Repeat test, which puts the unit into a repeat test
mode. Note; we define a graph as being a collection of plots. There can be a maximum of ten plots per
graph, each plot having its own pen colour and pen number. Graphs are stored as data files with the
following file extensions; GAD for amplitude graphs and GZD for impedance graphs.
From left to right these are; Test settings, which causes the Settings dialog box to appear and Connect
device, which selects the USB instrument and displays the unit serial number. These only function when a
C60 is connected.
From left to right these are, Previous document and Next document, which allow the user to scroll
through the open graph documents.
The Help tool provides on screen access to this manual.
C60 & CypherGraph User Manual
November 2006
Part # MAN-C60-1.2
Cypher Instruments Ltd
Page 29 of 121
The vertical tool bar
The vertical tool bar provides quick access to the features available on the Pen tab of the Graph View
Options dialog box. This tool bar provides quick access for pen, colour, lock and view features. Pen selection
1 to 10 is also available through the number keys 1 to 9 and 0 for 10.
Lock pen locks the currently selected pen so that it cannot be over written.
Unlock All Pens that are locked on the graph in focus.
Display/hide the currently selected pen. This is very useful for identifying a single plot in a busy graph,
particularly when monochrome is selected! Select a pen number and the press the eye button to hide/show
the plot.
Display all pens on the graph in focus. Pens can be hidden by the Graph View Options selection. This
retrieves them.
When a graph is open, left click on a pen box to Select the Pen
number. The selected pen has then been chosen for the next pen
function such as a plot or a copy & paste operation. Right click on
a box to enter the colour definitions box. This controls the plot line
colour of the graph document in focus.
C60 & CypherGraph User Manual
November 2006
Part # MAN-C60-1.2
Cypher Instruments Ltd
Page 30 of 121
Status bar
At the bottom of the application is the Status bar. This bar displays data about the graph in focus and the
current test.
The Status bar displays ‘Connected’ when connected, Testing’ when testing and ‘Disconnected’ when
disconnected. In this mode, it also reveals the test progress.
The current pen number is shown. Click the pen bar boxes and this number will change.
The two frequencies A & B are displayed. These are changed when the (Settings – Apply) button is pressed
or when (Sweep - X axis extents) values are applied or when Zoom Extents is asserted.
The Point counter shows the number of points in a test and is also used as a progress counter during a test.
Change the number of test points using the slider in the Settings dialogue box and see them change in the
Status bar.
Next, the oscillator idle frequency is shown. In this example it was set to 1000Hz. Other displays include, Off
& Start. These are all controlled in the Settings dialogue box.
The extra time period per test is displayed in milliseconds.
The sweep can be A to B, B to A or Alternate.
The oscillator attenuation is shown in dBs.
When a test point on a graph is selected (point & left click), the X & Y coordinates are displayed. The X axis
is frequency. The Y axis can be gain/loss in dBs, phase in degrees and impedance/admittance in Ohms or
Instrument
connected
Frequency A
Pen number
Point Counter
Frequency B
Time period
mili Second
Phase data
acquisition
Sweep
direction
Oscillator idle
frequency
Y axis – dB, Phase,
Ohms, Siemens
Oscillator
attenuatio
X axis Frequency
When an instrument is disconnected, the status bar can still be used to provide the XY coordinates of data
points in a graph and to display the currently selected pen.
Y axis – dB, Phase,
Ohms, Siemens
Instrument
Disconnected
Pen number
C60 & CypherGraph User Manual
X axis Frequency
November 2006
Part # MAN-C60-1.2
Cypher Instruments Ltd
Page 31 of 121
Viewing a graph
To view an existing graph, select File Open from the menu bar or press the Open file icon from the tool
bar. A dialogue box will appear. Navigate to the Plots\Samples folder that contains the example plot files.
Remember that there are two types of file, gad (amplitude graph) and gzd (impedance graph), which are
identified graphically as an A or |Z| icon.
For illustration purposes, select the file shown below. This file contains the amplitude and phase response
data values for a low pass filter which is then displayed as a graph.
Load up three other files, including the ‘455KHz resonator’ response. These are displayed as a multi
document cascade. In the Open Plot file dialog the Ctrl key can be held down to select multiple files.
C60 & CypherGraph User Manual
November 2006
Part # MAN-C60-1.2
Cypher Instruments Ltd
Page 32 of 121
Select Window Tile Horizontal from the menu bar. The four graphs will appear in a two by two matrix.
Click on any of the graphs to change the graph document in focus.
C60 & CypherGraph User Manual
November 2006
Part # MAN-C60-1.2
Cypher Instruments Ltd
Page 33 of 121
There are some interesting impedance resonances in this electro acoustic device. Using the mouse, left click
on the graph and then draw out a rectangle (shown as a negative image). When the left click is removed,
the graph will Zoom into the rectangle.
455KHz ceramic resonator
10 5
Modulus of Impedance - Ohms
10 4
10 3
10 2
4*105
Frequency - Hz
5*105
6*105
Produced by Cypher Instruments
The zooming can be repeated almost endlessly, eventually revealing the noise floor, assorted errors,
interference and the quantization steps of the system.
C60 & CypherGraph User Manual
November 2006
Part # MAN-C60-1.2
Cypher Instruments Ltd
Page 34 of 121
455KHz ceramic resonator
16:52:37
16:55:11
16:35:23
16:36:54
16:39:42
16:41:47
16:44:15
16:46:21
16:47:48
16:50:28
3.2*10 3
3.0*10 3
Modulus of Impedance - Ohms
2.8*10 3
2.6*10 3
2.4*10 3
4.710*105
4.715*105
4.720*105
4.725*105
4.730*105
4.735*105
Frequency - Hz
Produced by Cypher Instruments
Right click on the graph and a menu box will appear. This provides a fast route to the graphing controls.
Undo Zoom will now step back through the different areas of the graph you have zoomed into. Redo
Zoom steps forward once you have done an Undo Zoom.
C60 & CypherGraph User Manual
November 2006
Part # MAN-C60-1.2
Cypher Instruments Ltd
Page 35 of 121
The Graph View Options
The Graph view options dialogue box allows the user
to exercise control over the 10 pen plots that make up
a graph. Right click on a graph to invoke the Graph
View Options box. The Pen tab allows pen colours to
be set. Double click on the coloured box to activate a
colour palette, and then select a pen colour. Each
graph can have a different set of pen colours, which
can be set before performing a test and can be
changed afterwards. Each Pen plot can be displayed or
hidden, which is useful when there are many pen plots
on a graph. Pens plots can be locked, so that they
cannot be over written. In this way, a set of locked
plots can be displayed as a reference. Pen plots can
also be erased
The Display tab sets the Amplitude View (left) to be
Gain or Loss represented in dBs. The Gain display
range is from +10dB to -90dB and the Loss range is from -10dB to +90dB. These two views are inverted
images of each other. Also, Impedance view (right box) selects either Impedance in Ohms or Admittance in
Siemens.
The Phase graph controls the phase display range. When active, the phase graph can display a 0º to 180º
range or a ±180º range. The phase electronics uses a sign detector to un-wrap the phase graph and to
double the display range. This works well on big clean signals and not so well on very small signals with
poor S/N ratios. If the input signal has a poor S/N ratio or has interference, then the results will be
degraded.
The ‘Mark Data Points’ check box, toggles the data points on and off. The Show test information box reveals
the software version number and the graph date.
C60 & CypherGraph User Manual
November 2006
Part # MAN-C60-1.2
Cypher Instruments Ltd
Page 36 of 121
The Axes tab sets the frequency axis to be either logarithmic or linear. Most frequency responses are best
displayed as dBs versus log frequency. In this way, many filter and impedance responses have ‘straight line’
slopes. However, time delay networks, such as comb filters, have peaks and notches which are linearly
spaced and so a linear axis works well for this type of system. The Upper and Lower viewing frequencies can
also be set. Also the amplitude display range can also be set (left box) or the Impedance range (right box).
The Style tab controls the appearance of the graph.
The graph can be plotted in colour, monochrome and
monochrome with symbol markers. Some technical
magazines still publish in black and white.
The font used inside the graph can be selected from
the PC font folder. This allows the user to match the
graph font to a font used in a document. Three sizes
are available. These sizes impact on the available
area in which to plot the graph.
The large font is useful for the wmf file formas. The
font appears to be very large on the screen, but is
suitably large in a document. The wmf process for
text in resizable graphs is not wysiwyg.
The graph Legend Location can also be controlled by the user. These give the user even more choices over
the visual look of the graph. The examples below use the ‘Top’ option.
C60 & CypherGraph User Manual
November 2006
Part # MAN-C60-1.2
Cypher Instruments Ltd
Page 37 of 121
Below are colour, monochrome and monochrome plus symbol views of the same graph
lowpass10k
Test
Test
0
lowpass10k
Test
Test
-20
0
-30
-10
-40
-20
-50
-30
0
-40
-10
-50
-20
-60
-30
lowpass10k
-60
-70
-80
10000
Test
-70
100000
Frequency (Hz)
Produced by Cypher Instruments
1000000
-80
Amplitude (dB)
Amplitude (dB)
Amplitude (dB)
-10
Test
-40
-50
10000
100000 -60
Frequency (Hz)
Produced by Cypher Instruments
1000000
-70
-80
10000
100000
Frequency (Hz)
Produced by Cypher Instruments
1000000
The Mask tab enables lines to be drawn on a graph. These
lines can be used as boundary markers to test device
performance. A set of upper and lower boundary lines
forms a test mask, through which the response of the DUT
has to travel. Pass or fail can be visually determined by the
user, or a Check mask test can be applied. These masks
can be applied to amplitude responses and impedance
responses.
The upper and lower masks consume two of the ten
available pens. These masks have been assigned to pens
#9 and #10. Select the Mask tab and click on the ‘Show
mask lines’ box. A small dialog box reminds the operator
that any existing plots that used pens #9 and #10 will be
erased! For a new graph, this warning has no meaning.
For an existing graph, you could end up erasing plots.
C60 & CypherGraph User Manual
November 2006
Part # MAN-C60-1.2
Cypher Instruments Ltd
Page 38 of 121
In this example, an elliptic low pass filter response will have a mask drawn around it. Data points are
entered manually into the Frequency and Amplitude boxes for both the upper and lower Masks. A mask is
constructed from 2 to 24 points. As the data points are entered, they appear on the graph as dotted lines.
The Next and Previous buttons allow the user to change data points. The two masks are treated the same as
any other plot line.
An offset button allows masks to be shifted up and down.
10KHz Elliptic low pass filter QA test
CypherGraph V0.95.230 C60-0504-0109 V0.95.1972 : 04/01/2006
Sample 1
0
Sample 2
Upper mask
Lower mask
-10
-20
Amplitude Gain - dB
-30
-40
-50
-60
-70
-80
-90
101
102
103
104
Frequency - Hz
105
106
Produced by Cypher Instruments
Note: When a mask is enabled, the logarithmic/linear axis view options are frozen in their current state.
This removes ambiguities that may result from subsequent changes to the axis view settings.
C60 & CypherGraph User Manual
November 2006
Part # MAN-C60-1.2
Cypher Instruments Ltd
Page 39 of 121
Measuring Amplitude Response
To create a new graph, connect the C60 to the PC
using the USB lead. Connect the Device Under Test
(DUT) from the output BNC, into the input BNC. In the
following examples a passive low pass Elliptic filter is
used. This filter has a fast roll off slope and some very
interesting notches in its response. The following
illustration will apply equally to any filter that is used.
If there is no device connected, press F6. The
connection status can be seen on the Status bar.
Select new file from the menu bar or press the new
file icon from the tool bar. A dialogue box will appear
with a choice of two modes of operation; Amplitude
response or Impedance measurement. Select
Amplitude Vs Frequency and click OK.
Right click on the graph area and a context sensitive
menu will appear. Select Test Settings to get the
Settings dialogue box. Set the A B frequency range
and click the Apply button or press return. In this test,
a frequency range of 1kHz to 4MHz was selected. Do
not check the Use X axis extents box as this over rides
the Frequency boxes (it greys them out). The sweep
direction is B to A.
Set the number of test points using the slider. This is
active even during a test.
Title
Pen 1
10
Pen 2
Pen 3
Pen 4
Pen 5
Pen 6
Pen 7
Pen 8
Pen 9
Pen 10
0
-10
Amplitude Gain - dB
-20
-30
-40
-50
-60
-70
-80
-90
150
100
50
Phase - Degrees
A blank graph sheet will appear with a maximum range
of amplitude, phase and frequency values. All plots are
drawn inside this sheet. Tests can be performed inside
the area of the sheet, by limiting the frequency limits,
zooming and by turning off the phase portion of the
display.
0
-50
-100
-150
Set the Idle Output Frequency. The choices are Off,
User Defined in Hz and the Test Start frequency.
100
10 1
102
103
10 4
10 5
Frequency - Hz
Produced by Cypher Instruments
106
107
10 8
109
An additional wait period can be introduced by setting
the Test period slider.
The test can now proceed. Click on the Start Test tool
(green arrow). A sine wave sweep of the DUT produces
Amplitude and Phase readings that are displayed on the
graph. In this example the data points are Marked, but these can be turned
on and off during a test. Also, Zoom and Undo Zoom are active during tests.
C60 & CypherGraph User Manual
November 2006
Part # MAN-C60-1.2
Cypher Instruments Ltd
Page 40 of 121
Amplitude response 10kHz elliptic filter
17:42:40
10
Pen 2
Pen 3
Pen 4
Pen 5
Pen 6
Pen 7
Pen 8
Pen 9
Pen 10
0
-10
Amplitude Gain - dB
-20
-30
-40
-50
-60
-70
-80
-90
150
100
50
Phase - Degrees
The Amplitude response graph reveals the rapid roll
off slope of an eighth order low pass elliptic filter.
This filter has four notches in the stop band, three
of which are visible. The amplitude response starts
at -7dB and falls into notches going down to -84dB.
The phase response is dramatic. An eighth order low
pass filter has lots of phase shift caused by the 8
poles. Also, each time the response passes through
a notch, the phase response does an abrupt 180o
reversal. This happens at zero amplitude which
makes measurement rather difficult. However, the
graph shows the phase response even at a notch,
with display wrap around at ±180o. When the
signal level is very small, the phase detector is not
being driven by a sine wave, but by noise. In this
circumstance, the detector mechanism decides that
the phase is ±90o. As a rule of thumb, if the phase
is ±90o, then the input signal has disappeared!
0
-50
-100
-150
10 1
102
103
10 4
Frequency - Hz
Produced by Cypher Instruments
105
10 6
Amplitude response 10kHz elliptic filter
Right click on the graph. A menu will appear. Select
Phase, then Off. The phase portion of the graph will
vanish, which doubles the display size of the
amplitude gain plot.
10
17:42:40
Pen 2
Pen 3
Pen 4
Pen 5
Pen 6
Pen 7
Pen 8
Pen 9
Pen 10
0
-10
-20
Amplitude Gain - dB
-30
-40
-50
-60
-70
-80
-90
101
102
103
104
Frequency - Hz
Produced by Cypher Instruments
105
106
Again, right click on the graph and select Graph View
Options, Display tab. The Amplitude view can be
shown as Gain or Loss. Click the Loss dial.
C60 & CypherGraph User Manual
November 2006
Part # MAN-C60-1.2
Cypher Instruments Ltd
Page 41 of 121
Amplitude response 10kHz elliptic filter
Now the graph shows Loss and not Gain. The graph has
just been inverted. It used to be the fashion to display
frequency responses this way up in Germany and Japan.
For all we know, it still is!
90
17:42:40
Pen 2
17:42:40
Pen 2
Pen 3
Pen 4
Pen 5
Pen 6
Pen 7
Pen 8
Pen 9
Pen 8
Pen 9
Pen 10
80
70
Use Graph View Options to return to a Gain display and
then select the Axes tab. Select the Linear Frequency
axis scale.
60
Amplitude Loss - dB
50
40
30
20
10
0
Amplitude response 10kHz elliptic filter
-10
101
102
Pen 3
103
Pen 4
104
-Pen
Hz 6
Pen Frequency
5
Pen 7
Produced by Cypher Instruments
105
106
Pen 10
-10
-20
Now the graph is plotted on a linear frequency axis from
10Hz to 4MHz. The 400KHz response only occupies 10%
of the graph paper. If the response had been a 4KHz
plot, then it would have only used 0.1% of the linear
graph range. This is 1.5 pixels on a PC display! The
graph would still exist, but on a linear axis it would not
be visible.
Amplitude Gain - dB
-30
-40
-50
-60
-70
-80
-90
0.05M
0.15M
0.20M
0.25M
Frequency - Hz
Produced by Cypher Instruments
0.30M
0.35M
0.40M
Amplitude response 10kHz elliptic filter
Point the cursor on the graph and drag a box around
the area of interest. The graph will be redrawn to reveal
the selected area. Generally, Gain versus Logarithmic
frequency is the best way to display test results. Many
natural systems have responses that are proportional to
frequency which result in straight line plots on a log/log
graph.
10
17:42:40
Pen 2
Pen 3
Pen 4
Pen 5
Pen 6
Pen 7
Pen 8
Pen 9
Pen 10
0
-10
-20
-30
Amplitude Gain - dB
However, time delay responses such as comb filters are
best displayed on a linear frequency axis.
0.10M
-40
-50
-60
-70
-80
-90
0.5M
C60 & CypherGraph User Manual
November 2006
1.0M
1.5M
2.0M
2.5M
Frequency - Hz
Produced by Cypher Instruments
3.0M
3.5M
Part # MAN-C60-1.2
Cypher Instruments Ltd
Page 42 of 121
Return the view to a logarithmic frequency axis. On the
Settings dialogue box, click the Use X Axis extents box.
This allows the user to zoom into an area of interest and
to retest it. When this is happening, Frequency A & B are
greyed out.
Amplitude response 10kHz elliptic filter
The first two notches of the filter are quite interesting.
Click and drag a box around them. However, when the
graph zooms in, they don’t seem that good. They don’t
have enough data sample points to reveal the response
of the filter. Remember, lots of dots make good graphs,
but you are only allowed 1024 dots per plot. Also, lots
of dots takes lots of time.
17:42:40
Pen 2
Pen 3
Pen 4
Pen 5
Pen 6
Pen 7
Pen 8
Pen 9
Pen 10
-58
-60
-62
-64
Amplitude Gain - dB
-66
-68
-70
-72
-74
-76
-78
-80
1.4*10 4
Plots are limited to 1024 data points each. It is possible
to make a plot with 10240 data points. Break up the
frequency axis into 10 sections. Use a different pen for
each section and set all the pen colours to be the same.
Note; 10,240 test points will take a while.
1.6*10 4
Amplitude response 10kHz elliptic filter
17:42:40
Pen 2
18:00:46
Pen 4
Pen 5
Pen 6
Pen 7
Pen 8
Pen 9
Pen 10
-58
-60
-62
-64
-66
Amplitude Gain - dB
The red pen was selected (by clicking on it) and a new
test performed (click on the green Tool Bar arrow). The
new test uses the X axis extents of the zoom window,
but the same number of test points as before. The
notches are tested with much finer frequency resolution.
Note that although the black plot suffers from poor
resolution due to under sampling, its data points fall on
the much finer plot of the red pen. This means that all
the data points are correct, irrespective of resolution.
1.5*104
Frequency - Hz
Produced by Cypher Instruments
-68
-70
-72
-74
-76
Don’t forget to save your graph, or it will be lost
forever.
-78
-80
1.4*10 4
C60 & CypherGraph User Manual
November 2006
1.5*104
Frequency - Hz
Produced by Cypher Instruments
1.6*10 4
Part # MAN-C60-1.2
Cypher Instruments Ltd
Page 43 of 121
Obtaining optimum results
The input of the C60 is sensitive. It has a 1M ohm input impedance (at low frequencies) and a small signal
bandwidth of more than 10 MHz. A 2V peak to peak sine wave presented to the input is equivalent to 0dB
on the graph. Other signal level relationships are show below.
2Vpp
=
0dB
200mVpp
=
-20dB
20mVpp
=
-40dB
2mVpp
=
-60dB
200µVpp
=
-80dB
100µVpp
=
-86dB
A 100µVpp sine wave is a very small signal. This is the smallest signal that the C60 can measure from a low
impedance source before the noise floor becomes dominant. Any unwanted signals that enter the input will
be misinterpreted by the unit. For example, mains hum, power supply switcher noise, radio interference,
magnetic fields, electrical and acoustic noise will all be faithfully interpreted as amplitude, phase and
impedance readings and plotted as such. The C60 is not capable of recognizing good signals from bad ones.
The user has to be careful to perform tests in a ‘quiet’ environment.
Some PCs have electrically noisy power supplies. If the C60 is powered from such a PC and it is used to test
another switcher-powered unit, then large switching currents can flow through the system. This can
introduce interfering spikes into the test signal which produce spurious results. Best results are obtained by
using an electrically floating, battery powered laptop PC. Even connecting a digital scope to the test
scenario, can inject digital interference into the readings.
Also, using USB hubs can introduce extra power supply noise into the test system. Other units connected to
the hub will add their own ‘noise’ currents into the ground wiring. For best results use a single USB
connection from the C60 to the PC that is controlling it.
Unscreened DUTs can pick up electric, magnetic and electro magnetic interference. To avoid this, the C60
and the DUT should be placed inside a metal box. Connect the box to the C60 ‘ground’, and this will provide
a quiet environment to perform tests. Aluminium will stop mobile phone radio emissions from interfering
with the tests, but it will not stop magnetic fields emanating from electromagnetic devices. Steel (not
stainless) will attenuate magnetic fields. Sometimes, just a good ground plane under the C60 is sufficient. A
sheet of copper or aluminium connected to local mains earth via a big flat conductor, or the ground of the
C60, will provide a target for electric fields to collapse into and yet allow easy access for the operator.
Avoid big wire loops connected to the DUT. They look like inductors in the impedance test mode and act as
radio antennas which both transmit and receive.
Noise and vibration can introduce error signals into a C60 test. Everything seems to be micro phonic.
Ceramic capacitors are actually used as acoustic transducers, although they polarize them during
manufacture to increase their sensitivity. Coaxial cables are micro phonic. They make noise when they are
flexed, due to the tribo electric phenomena. They are used as a linear microphone to monitor road traffic
usage.
The C60 has an output attenuator with a 20dB range, available in 2.5dB steps. The output voltage can be
varied from 2Vpp to 200mVpp, although best results are obtained when the C60 is running at maximum
voltage. This might not be suitable for many amplitude test scenarios. For example a microphone amplifier
input may overload unless the input is very small. The solution to this problem is to use an external low
impedance attenuator.
C60 & CypherGraph User Manual
November 2006
Part # MAN-C60-1.2
Cypher Instruments Ltd
Page 44 of 121
The circuit shows a 20dB and a 40dB resistive attenuator. Use 1% wire ended metal film resistors, as these
are relatively non reactive. The attenuation is about 1% accurate and the output impedance is
approximately 50 ohms. Solder the components into a metal BNC adaptor box. Connect both BNC grounds
together with thick tinned copper wire. A signal level from 0dB to -60dB can be generated by introducing of
one of these attenuator boxes into the signal path, and by controlling the C60’s attenuator.
C60 & CypherGraph User Manual
November 2006
Part # MAN-C60-1.2
Cypher Instruments Ltd
Page 45 of 121
Measuring Impedance Response
To create a new graph, connect the C60 to the PC
using the USB lead. Connect the Device Under Test
(DUT) to the output BNC. The input BNC is not used
for impedance tests. In the first example a 150nF
capacitor in series with 10R is used as the DUT. If
there is no device connected press F6. The connection
status can be seen on the Status bar.
Select new file from the task bar or press the new file
icon from the tool bar. A dialogue box will appear with
a choice of two modes of operation; Amplitude
response or Impedance measurement. Select
Impedance Vs Frequency and click OK.
Pen 2
10 6
Pen 3
Pen 4
Pen 5
Pen 6
Pen 7
Pen 8
Pen 9
Pen 10
10 5
10 4
Modulus of Impedance - Ohms
Right click on the graph area and a context sensitive
menu will appear. Select Test Settings to get the
Settings dialogue box. Set the A B frequency range
and click the Apply button or press return. In this test,
a frequency range of 10Hz to 4000kHz was selected.
Do not check the Use X axis extents box as this
overrides the Frequency boxes (it greys them out). Set
the number of test points using the slider.
Series RC 150nF + 10R
10 3
10 2
10 1
10 0
10 -1
10 -2
0
-20
-40
Phase - Degrees
A blank graph sheet will appear with a maximum range
of impedance, phase and frequency values. All plots
are drawn inside this sheet. Tests can be performed
inside the area of the sheet, by limiting the frequency
limits, zooming and by turning off the phase portion of
the display.
-60
-80
-100
-120
-140
-160
-180
101
102
103
104
Frequency - Hz
Produced by Cypher Instruments
105
106
The test can now proceed. Click on the Start Test tool (green arrow). A
sine wave sweep of the DUT produces Impedance and Phase readings that
are displayed on the graph. In this example the data points are Marked,
but these can be turned on and off during a test. Also, Zoom and Undo
Zoom are active during tests.
C60 & CypherGraph User Manual
November 2006
Part # MAN-C60-1.2
Cypher Instruments Ltd
Page 46 of 121
The phase plot shows the phase shift of the current
flowing through the DUT relative to the voltage across
the DUT. When the capacitor behaves like a capacitor,
the phase shift is -90º. The graph displays the magnitude
of the impedance and the phase shift as a function of
frequency. The graph represents the complex impedance
of the DUT.
Series RC 150nF + 10R
10 6
Modulus of Impedance - Ohms
10 5
10 4
10 3
10 2
10 1
10 0
150
100
50
Phase - Degrees
The Impedance response graph reveals the slow roll off
slope of capacitor in series with a resistor. The
impedance of a capacitor will fall by half for every
doubling of the drive frequency, until it equals the
resistor value. On a log/log graph this is a straight line
with a slope of -6dBZ/octave or -20dBZ/decade. That is,
one decade cycle of Impedance for every decade cycle of
Frequency on the graph. The Z plot goes flat at about 10
ohms. The plot then has a relatively constant slope,
which is typical for a simple reactive device. Also, testing
down to 10Hz takes a long time!
0
-50
-100
-150
101
Right click on the graph. A menu will appear. Select
Phase, then Off. The phase portion of the graph will
vanish, which doubles the display size of the Impedance
plot.
10 6
Series RC 150nF
10
+ 10R
102
07:27:23
Pen 2
103
Pen 3
4
Frequency - Hz
Produced by Cypher Instruments
Pen 4
Pen 5
Pen 6
Pen 7
105
106
Pen 8
Pen 9
Pen 10
10 5
Modulus of Impedance - Ohms
10 4
10 3
10 2
10 1
10 0
101
102
103
104
Frequency - Hz
Produced by Cypher Instruments
105
106
Again, right click on the graph and select Graph View
Options, Display tab. The Impedance view can be
displayed as Admittance, which is measured in Siemens.
Click the Admittance dial.
C60 & CypherGraph User Manual
November 2006
Part # MAN-C60-1.2
Cypher Instruments Ltd
Page 47 of 121
Now the graph shows Admittance and not Impedance. The graph has just been inverted and the vertical
units changed.
Series RC 150nF + 10R
Conversion of Impedance to Admittance
10 2
1 mOhm
1 KMho
1 KS
10 1
1 Ohm
1 Mho
1S
1 KOhm
1 mMho
1 mS
1 MOhm
1 uMho
1 uS
07:27:23
Pen 2
Pen 3
Pen 4
Pen 5
Pen 6
Pen 7
Pen 8
Pen 9
Pen 10
Modulus of Admittance - Siemens
10 0
Use Graph View Options to select the Axes tab, then
select the Linear Frequency axis scale.
10 -1
10 -2
10 -3
10 -4
101
102
103
104
Frequency - Hz
Produced by Cypher Instruments
105
106
Series RC 150nF + 10R
10 2
07:27:23
Pen 2
Pen 3
Pen 4
Pen 5
Pen 6
Pen 7
Pen 8
Pen 9
Pen 10
10 1
Modulus of Admittance - Siemens
10 0
10 -1
10 -2
10 -3
10 -4
0.5M
1.0M
1.5M
2.0M
2.5M
Frequency - Hz
Produced by Cypher Instruments
3.0M
3.5M
4.0M
Now the graph is plotted on a linear frequency axis from 10Hz to 4MHz. All of the straight line slopes have
been lost. Physical phenomena are usually best displayed on a log/log graph.
C60 & CypherGraph User Manual
November 2006
Part # MAN-C60-1.2
Cypher Instruments Ltd
Page 48 of 121
Next, go back to Impedance on a Logarithmic frequency axis. Click the Auto Scale dial. The graph is then
auto scaled vertically between the maximum and minimum impedance values (below, right). There are no
redundant vertical log decade cycles. This also operates in ‘real time’ when a test is being performed.
The Upper and Lower display limits can also be set by clicking the Manual dial. The values are then entered
numerically.
Series RC 150nF + 10R
07:27:23
Pen 2
Pen 3
Pen 4
Pen 5
Pen 6
Pen 7
Pen 8
Pen 9
Pen 10
10 5
Modulus of Impedance - Ohms
10 4
10 3
10 2
101
C60 & CypherGraph User Manual
November 2006
102
103
104
Frequency - Hz
Produced by Cypher Instruments
105
106
Part # MAN-C60-1.2
Cypher Instruments Ltd
Page 49 of 121
System Limitations
As with any measurement system the C60 has its limits. It is important that the operator is aware of these
limits to aid accurate interpretation of the results. Because the C60 measures three parameters there are
limitations associated with these. In many cases they can be reduced or eliminated by making changes to
the test settings. Others are simply inherent limitations of which the user should be aware.
Harmonics
The sine wave generator contains harmonic, non-harmonic forms of distortion. The resultant waveform is
not a pure sine wave. The non-harmonic components are sometimes referred to as noise because of their
apparently random nature. These components can cause spurious peaks in the amplitude response of some
systems. The sum of the distortion is about 62dBs below the sine wave level. However, the C60 has a 90dB
dynamic range and can detect and plot low level distortion signals.
LCR 220uH 100nF 50R
Distortion products can also change amplitude response
graphs. A passive series LCR filter is tested in both its low
pass and high pass configurations. The two responses
(right) should be mirror images of each other. The high
pass response has a low level shelf at about minus
62dBs. This shelf is the sum of all the harmonic
components and distortion products that are not
attenuated by the high pass filter, but which are
generally removed by the low pass filter configuration.
Pen 1
Pen 2
Pen 3
Pen 4
Pen 5
Pen 6
16:00:08
Pen 8
Pen 9
Pen 10
0
-10
Amplitude Gain - dB
-20
Another manifestation of the sine wave distortion is
shown in this low pass filter (right). When the response is
plotted with very fine resolution, there are some spikes in
the stop band. These are low level, low frequency spurs
that are produced by the sine wave generator. For
example, at 800KHz there is a 400Hz spur at a level of 72dB. This is inside the pass band of the low pass filter
and appears as a reading 4dBs above the -81dB noise
floor. Zooming in reveals the fine detail (50Hz bandwidth)
of these low level spurs (below, left and right).
-30
-40
-50
-60
-70
103
4
10non
harmonic tones
Hunting for
Frequency - Hz
Produced by Cypher Instruments
105
106
-10
-20
Amplitude Gain - dB
-30
Hunting for non harmonic tones
-40
Hunting for non harmonic tones
-50
-77.0
-77.0
-77.5
-60
-77.5
-78.0
-78.0
-70
-78.5
-78.5
-79.0
-80
Amplitude Gain - dB
Amplitude Gain - dB
-79.0
-79.5
-80.0
-79.5
-90
105
Frequency - Hz
Produced by Cypher Instruments
10 6
-80.0
-80.5
-80.5
-81.0
-81.5
-81.0
-82.0
-81.5
-82.5
7.7*105
7.8*105
7.9*10 5
Frequency - Hz
Produced by Cypher Instruments
8.0*10 5
C60 & CypherGraph User Manual
8.1*10 5
7.886*10 5
7.887*10 5
November 2006
7.888*105
Frequency - Hz
Produced by Cypher Instruments
7.889*10 5
7.890*10 5
Part # MAN-C60-1.2
Cypher Instruments Ltd
Page 50 of 121
Phase detection
Two transducer system
06:15:44
06:15:50
06:15:53
06:15:56
8*103
9*103
06:15:59
06:16:02
06:16:05
06:16:11
06:16:15
06:16:21
-25
Amplitude Gain - dB
-30
-35
-40
-45
-50
0
-10
-20
-30
-40
Phase - Degrees
The next graph shows the amplitude and phase
response of a two transducer system. One transducer
is used as a transmitter, the other as the receiver.
They are connected together by a resonant metal bar.
The combined electro mechanical system displays low
Q amplitude resonances and phase loops, all of which
can be modified by external mechanical masses and
damping mechanisms. The phase is plotted using a
180o display range. The amplitude response has no
overall slope but has many resonance peaks and
notches. This can result in the phase detection
electronics being presented with a greatly attenuated
test sine wave to which many amplified harmonic
products are added. Under these poor conditions, the
180o display range gives the best phase plot (right).
-50
-60
-70
-80
-90
-100
6*103
7*103
104
Frequency - Hz
Produced by Cypher Instruments
When the phase is unwrapped to indicate a ±180o range, the presence of distortion products makes itself
known (below). The sign detector, which does the unwrapping becomes confused and gives spurious results.
This is the same phase plot as the one above.
Two transducer system
Phase detectors have problems resolving the
transitions from ±0o and ±180o. On the graph, the
±180o transition is at the top and bottom of the
picture, which makes it ‘highly’ visible. The ±0o
transition is in the middle and so is less obvious. The
20KHz Elliptic low pass filter (below) demonstrates
the phase unwrapping in action. In the region from
18KHz to 40KHz there are several ±180o phase
transitions. At this part of the graph, the phase is
moving very rapidly and so the transitions through 0o
phase do not show any obvious aberrations. Slowly
passing through 0o phase will usually produce a kink
in the plot.
30
20
10
0
-10
-30
-40
-50
-60
-70
Elliptic filter modules
-80
0
-100
6*103
7*103
8*10 3
9*103
104
Frequency - Hz
Produced by Cypher Instruments
At about 2.3MHz, the signal level is very small
(-80dB) and the phase and sign detectors
produce big errors. The signal to noise ratio is
terrible and the bandwidth requirements of the
phase detector circuit are enormous. The phase
plot under these conditions looks dubious.
Amplitude Gain - dB
-90
Phase - Degrees
Phase - Degrees
-20
-20
-40
-60
-80
100
0
-100
10 2
C60 & CypherGraph User Manual
November 2006
10 3
10 4
10 5
10 6
Frequency - Hz
Produced by Cypher Instruments
Part # MAN-C60-1.2
Cypher Instruments Ltd
Page 51 of 121
8KHz LC filter module circa 1980
0
Amplitude Gain - dB
Another filter plot shows what happens to the
phase detector when the signal level is very
small. An 8KHz low pass filter module, which
was built 25 years ago, still shows a good
amplitude roll off (right). The phase detector
does a couple of complete rotations before the
signal is completely lost. The phase just seems
to explode into a ‘fuzzy’ plot. Several plots are
shown on the graph.
-20
-40
-60
-80
Phase - Degrees
150
100
50
0
-50
-100
-150
102
C60 & CypherGraph User Manual
November 2006
103
104
Frequency - Hz
Produced by Cypher Instruments
105
Part # MAN-C60-1.2
Cypher Instruments Ltd
Page 52 of 121
Phase accuracy
The phase accuracy is difficult to specify. It varies with test frequency, test level, signal attenuation in the
DUT, interference and the frequency response of the DUT. Also, the sign detector that unwraps the phase,
can find it difficult to perform well under all circumstances. The following two graphs exercise the phase
detection system to reveal the operational accuracy.
The phase detectors are calibrated at
maximum signal level. If the signal is then
subsequently attenuated, then the calibration is
not valid.
-60
-70
-80
-90
0
-20
-40
Phase - Degrees
At the low frequency end, where the signal
amplitudes are large, the phase deviates over a
3.6o range.
Amplitude Gain - dB
In the first test, the C60 drives an LC low pass filter at 9 different signal levels. This will reveal any phase
deviations that are associated with the variable test levels emanating from the C60. The amplitude graph
shows 9 plots that track each other with a 2.5dB separation. Above 1MHz, the plots are compressed into the
system noise floor. The phase plots track each
Amplitude & phase responses using 0dB to -20dB from the internal attenuator #2
other over a wide range. At 1MHz, the returned
CypherGraph V0.77.150 C60-0504-X0107 V0.77.1045 : 06/09/2005
signal levels vary from -62dB to -82dB. These
15:55:43 15:55:58 15:57:54 15:58:24 15:58:53 15:59:22 15:59:48 16:00:15 16:00:44 Pen 10
are very small signals and so the phase
0
detector plots start to spread out. The signal
-10
levels at this frequency are 2mVpp to 200µVpp.
-20
These are not very useable signal levels. There
-30
is some phase information contained in the
-40
signal, but it is dominated by noise.
-50
-60
-80
-100
-120
-140
-160
Another aspect of the phase plot is resolution.
When the input signal has a good S/N ratio,
the best resolution of the phase detector is
0.044o. This fine detail sometimes can be seen
on the phase tails of first order filters. This is
useful for revealing phase movements, but the
absolute phase accuracy is much worse.
-180
103
104
105
Frequency - Hz
Produced by Cypher Instruments
106
0dB to -80dB Amplitude & Phase using external attenuator
0dB
-10dB
-20dB
16:50:01
-40dB
-50dB
-60dB
-70dB
-80dB
-80dB
0
-10
Amplitude Gain - dB
-20
-30
-40
-50
-60
-70
-80
-90
0
-5
-10
-15
Phase - Degrees
The next test drives the output into the input
via an external low impedance attenuator. This
will reveal the phase deviation with respect to
frequency, for 9 signal levels. Up until 1MHz,
the phase deviation is below 3.0% for signals
as small as -60dB. At -70dB, the error is 5.3%
and at -80dB it meanders around from 25% to
10%. At -80dB, the signal level is 200µVpp,
which is just about the limit of the phase
detector. At this level, the phase results are
very inaccurate. The amplitude detector has a
larger dynamic range than the phase detector,
so when the two are plotted on a graph, the
phase response comes a ‘poor second’.
-20
-25
-30
-35
-40
-45
-50
102
C60 & CypherGraph User Manual
November 2006
103
104
Frequency - Hz
Produced by Cypher Instruments
105
106
Part # MAN-C60-1.2
Cypher Instruments Ltd
Page 53 of 121
Dynamic range
The C60 generates a maximum signal level of 2Vpp. This is the 0dB reference level on the Amplitude graph.
For example a 200mVpp signal presented to the input of the C60 would produce a -20dB plot. Signals larger
than 2Vpp can be presented to the C60. The input protection circuit causes signal compression (graph
below). The green plot is the output of the C60 fed into a 10kHz high pass filter. This was then given +20dB
of gain by an external amplifier and then
Input compression and overload
fed back into C60, producing the input plot
(red). The difference between the two plots
Drive
C60 Response
20
is the input compression of the C60. When
the input level is +5.0dB, the compression
18
is about 0.5dB. For larger signals, the
compression is correspondingly larger.
16
The input level limit for signal compression
of less than 0.5dB is +5.0dB, which is a
level of 3.5Vpp.
14
Input compression error
Amplitude Gain - dB
12
10
8
6
4
2
0
-2
103
2*103
4*103
6*103
8*103 104
Frequency - Hz
Produced by Cypher Instruments
2*104
4*104
Open circuit & short circuit noise floors October 2005
open
short
1K0
10K
Pen 5
Pen 6
Pen 7
Pen 8
Pen 9
Pen 10
-66
-68
-70
-72
-74
Amplitude Gain - dB
The input noise floor of the C60
determines the lower level for operation.
A frequency response test, with the input
of the C60 open circuited and then
shorted, reveals both of these levels. The
black plot is the open circuit (1Mohm)
response. It is a true frequency response,
because the unit has various internal
cross talk paths that were painfully
flattened out. Reducing the input
impedance from 1Mohm, rapidly reduces
the noise floor value. The minimum noise
floor is obtained from a very low
impedance input source, in this case a
short circuit (brown). Also shown are
noise floors for 10K (orange) and 1K0
(red) input source resistance.
-76
-78
-80
-82
-84
The amplitude dynamic range of the C60
extends from +5dB to -87dB, although
great care has to be taken to obtain this
in an actual test scenario. A signal level of
-87dB on this scale is 89µVpp, which is
very small!
C60 & CypherGraph User Manual
-86
-88
-90
101
102
November 2006
103
104
Frequency - Hz
Produced by Cypher Instruments
105
106
Part # MAN-C60-1.2
Cypher Instruments Ltd
Page 54 of 121
Time smearing
If tests are performed too rapidly, then the test signals may not be fully stable when they are converted into
data. This results in time smeared plots. The phase detector has a time constant that is much longer than
that of the amplitude detector and so phase is more sensitive to smearing. When performing a test, look at
the graph and adjust the controls so that the phase plot is free of this effect.
Test speed is defined as the ratio change in frequency per data point. For example; testing from 10Hz to
1MHz (100,000 to 1) with 25 test points gives a 58.4% change per step (25th root of 105 = 1.584). This is a
very large incremental change and is considered to be fast. Changing the test frequency by one point could
cause a large phase or amplitude change in the DUT. These signals would take some time to reach new
stable values. If they are read when they are still moving, then time smearing will happen. However, if 1024
test points are used over the same frequency range, the incremental change is only 1.1%. This is much
slower, with much smaller changes in the data values.
HP filter phase errors due to speed
A high pass filter was tested from
100Hz to 1MHz.using insufficient
frequency points The phase loop
shows signs of time smearing. The
test frequency changes too rapidly
so that the phase signal has not
enough time to settle. When the
test is redone using the maximum
number of points, the graph is a
consistent smooth curve.
If the Repeat mode is being used,
then use the Alternate A B
frequency selection. This avoids a
large frequency step during the
‘fly back’, which can introduce big
transients into the system.
-100
-110
Phase - Degrees
For best results use at least 250
data points, and set the oscillator
idle frequency to Test Start. Fewer
data points with a long Test period
could be used to allow the signals
to settle, but more data points has
the same effect and better
resolution.
-90
-120
-130
-140
-150
-160
103
Frequency - Hz
Produced by Cypher Instruments
C60 & CypherGraph User Manual
November 2006
104
Part # MAN-C60-1.2
Cypher Instruments Ltd
Page 55 of 121
Impedance boundaries
Just like the amplitude measurements, the impedance range is limited by physical constraints. The output
BNC and associated electronics has some unwanted properties. The ideal scenario would be that the output
section of the C60 had no parasitic series resistance, capacitance and inductance, no parallel resistance and
the electronics had no noise floor. Well, it’s got all of these. The parasitic resistance and noise floors limit the
low frequency minimum and maximum impedance measurements. At high frequencies, parasitic inductance
increases the apparent impedance and conversely, parasitic capacitance decreases the apparent impedance.
Also, the parasitic L and C components form resonant circuits with the test DUT’s C and L components.
The C60 is small enough to be placed physically close to the DUT. In fact, it is important that tests are
performed as close as possible to the C60. The output BNC connector has an resistance of approximately 5
milliohms when brand new (so take good care of it). If test leads are used, then they will add to the
measured impedance. As a rule of thumb, one inch of ‘straight’ wire in air has an inductance of about 20nH.
Cables with two conductors have capacitance between them of the order of 100pF per meter. The value
depends on the cable construction. Cables also have series resistance. Connectors and test fixtures have
parasitic capacitance and inductance. Great care must be taken when measuring impedance, otherwise you
can end up with misleading plots.
Some impedance analysers use a four terminal method of driving the DUT. The DUT is driven by two
voltages, V-High and V-Low. Then, two terminals are used to measure the voltage difference across the
DUT, C-High and C-Low. The ‘C’ refers to the Current terminals that you would get on a four terminal
‘current sensing’ resistor. By using this method, the parasitic components of the analyzer can be largely
removed from the test by making the measurements at the DUT terminals. This is at the expense of having
four cables connected to the DUT and extra reactive components in the system.
The C60 has a stray inductance of 23nH and a stray capacitance of 33pF. These reactive components will
resonate with any counterparts that they are connected to. Also, they form part of the maximum and
minimum impedance measurement boundaries.
The C60 impedance performance was tested (below). With an open circuit, the C60 reaches a maximum
reading of 450K. This is the upper boundary of the unit set by internal noise floors of the electronics. The
upper boundary is a compressing limit. A 330K resistor reads 271K, an error of about 18%. A 220K resistor
reads 196K, an error of about 11%. Lower resistor values have virtually no significant error. The upper
boundary was measured using the maximum output signal level. If the signal level is reduced by 20dBs,
then the point at which the noise floor equals the signal is also reduced by the same amount. Lowering the
signal level, lowers the maximum impedance readings.
The lower impedance boundary is limited by the C60’s output resistance and inductance. This is nominally a
10 milli Ohm resistive boundary at low frequencies. The output inductance causes the high frequency
impedance lift. The slight droop at 20Hz/0.01 Ohms is caused by measurement errors in the C60.
C60 & CypherGraph User Manual
November 2006
Part # MAN-C60-1.2
Cypher Instruments Ltd
Page 56 of 121
The measured low frequency impedance boundary range (below) is 457k to 0.01R. This is a continuous
dynamic range of 45,700,000 to 1 (153dBs).
Impedance limits & accuracy
10 6
open circuit
100K
10K
1K0
100R
10R
1R0
220K
330K
short circuit
10 5
10 4
Modulus of Impedance - Ohms
10 3
10 2
10 1
10 0
101
102
C60 & CypherGraph User Manual
103
104
Frequency - Hz
Produced by Cypher Instruments
November 2006
105
106
Part # MAN-C60-1.2
Cypher Instruments Ltd
Page 57 of 121
Impedance accuracy
When an impedance test is performed on a single reactive component, the theoretical slope should be a
straight line with a slope of ±6dBZ/octave. In the C60, the electronics that measures impedance has a small
cyclic deviation from a straight line performance. This results in an undulating error when measuring
impedance.
0dB to -20dB from the internal attenuator, driving 220uH
16:32:02
16:32:31
16:33:36
16:40:24
Pen 5
16:41:15
16:42:11
16:42:55
16:43:36
16:44:18
105
104
Modulus of Impedance - Ohms
A 220µH inductor was tested with 9
signal levels from 0dB to -20dB. The
resulting graph (right), shows a slight
variation in the plot width. Ideally this
graph should be 9 plots, all having
exactly the same data points. However,
the variable signal level reveals the
errors in the detection system. The
detector operates continuously over a 7
decade
range
and
so
some
compromises are bound to be
expected.
103
102
101
100
104
When we zoom into a small area of the
graph, the errors become more
visible. The impedance plot shows the
cyclic nature of the deviation. At
60kHz the deviation is almost zero. At
about 120kHz, the deviation reaches a
maximum with a ±4.5% error.
106
0dB to -20dB from the internal attenuator, driving 220uH
16:32:02
16:32:31
16:33:36
16:40:24
Pen 5
16:41:15
16:42:11
16:42:55
16:43:36
16:44:18
4*102
2*102
Modulus of Impedance - Ohms
This phenomenon can be seen on
inductor, capacitor and tuned circuit
networks. With only one plot, it
manifests itself as a slight undulation
along the slope. When the network is
tested at a variety of drive levels, the
deviation is more visible.
105
Frequency - Hz
Produced by Cypher Instruments
102
8*101
6*101
4*101
2*104
C60 & CypherGraph User Manual
November 2006
4*104
6*104
8*104 105
Frequency - Hz
Produced by Cypher Instruments
2*105
Part # MAN-C60-1.2
Cypher Instruments Ltd
Page 58 of 121
Applications Notes
Filter responses
Some continuous time filters were tested (below). These filters have digitally selectable cut off frequencies.
High pass 4th order
10
10
0
0
-10
-10
-20
-20
Amplitude Gain - dB
Amplitude Gain - dB
Low pass 4th order
-30
-40
-30
-40
-50
-50
-60
-60
-70
-70
-80
-80
103
104
105
106
Frequency - Hz
Produced by Cypher Instruments
102
103
104
105
Frequency - Hz
Produced
by Cypher
Low pass
8thInstruments
order
103
104
105
Frequency - Hz
Produced by Cypher Instruments
106
10
The 4th order low pass filter has a pass band gain of
+7dB, and a noise floor at -71dB, giving it a dynamic
range of at least 78dB.
0
The high pass filters have a low frequency shelf at about 60/62dB. This is caused by the quantization noise of the
digital sine wave generator.
-10
The graphs on this page were exported as meta files with
a portrait aspect ratio, to match that of the paper.
Amplitude Gain - dB
-20
The 8th order low pass filter shows a much more dramatic
roll off slope than the previous graphs. The noise floor is
shown at about -76/78dB. Some of the high frequency
spikes in the stop band are low frequency spurs from the
sine wave generator that are passed by the filter. They
reveal the performance of the sine wave and not the filter.
-30
-40
-50
-60
-70
-80
C60 & CypherGraph User Manual
November 2006
Part # MAN-C60-1.2
Cypher Instruments Ltd
Page 59 of 121
A voltage controlled state variable filter with a ‘100 to 1’ control range was tested (below). This filter has
simultaneous low pass, high pass and band pass outputs. By mixing HP and LP outputs, a range of notch
responses is generated. This filter has a continuously variable tuning range from 19KHZ to1.5MHz.
Voltage controlled filter HP 19KHz - 1.5MHz
10
10
0
0
-10
-10
-20
-20
Amplitude Gain - dB
Amplitude Gain - dB
Voltage controlled filter LP 19KHz - 1.5MHz
-30
-40
-30
-40
-50
-50
-60
-60
-70
-70
-80
-80
102
103
104
105
106
Frequency - Hz
Produced by Cypher Instruments
102
Voltage controlled filter BP 19KHz - 1.5MHz
103
104
105
106
Frequency - Hz
Produced by Cypher Instruments
Voltage controlled filter notch 19KHz - 1.5MHz
0
10
-10
0
-10
-20
Amplitude Gain - dB
Amplitude Gain - dB
-20
-30
-40
-50
-30
-40
-50
-60
-60
-70
-70
-80
-80
102
103
104
105
106
Frequency - Hz
Produced by Cypher Instruments
C60 & CypherGraph User Manual
November 2006
102
103
104
105
106
Frequency - Hz
Produced by Cypher Instruments
Part # MAN-C60-1.2
Cypher Instruments Ltd
Page 60 of 121
Ceramic resonators
Modulus of Impedance - Ohms
A 455KHz resonator was tested
(right). It exhibits many resonance
modes, including a major dip and
peak at about 455KHz. The device
has the general impedance slope of
a capacitor and produces a -90o
phase shift for most of the
frequency range. However, at
resonant frequencies the phase
shift moves towards +90o. The
resonance at 455KHz shows a
classic phase loop.
10 5
10 4
10 3
10 2
10 1
150
100
50
Phase - Degrees
Ceramic resonators are used in
electronic circuits to generate tuned
oscillators. They are not as accurate
or stable as quartz crystal
oscillators, but they are small and
inexpensive.
Their
resonance
modes are determined by surface
acoustic time delays.
455KHz resonator, complex impedance
0
-50
-100
-150
4*105
8*105
106
Frequency - Hz
Produced by Cypher Instruments
2*106
4*106
455KHz resonator, complex impedance
10 5
Modulus of Impedance - Ohms
The resonator was retested from
420KHz to 480KHz. The phase loop
is revealed in much greater detail,
showing a ±90o range. Note also,
that the impedance changes from 5
ohms to 20,000 ohms.
6*105
10 4
10 3
10 2
10 1
150
100
Phase - Degrees
50
0
-50
-100
-150
4.0*105
C60 & CypherGraph User Manual
4.2*105
November 2006
4.4*105
4.6*105
Frequency - Hz
Produced by Cypher Instruments
4.8*105
5.0*105
Part # MAN-C60-1.2
Cypher Instruments Ltd
Page 61 of 121
Ultrasonic transducers
A 40KHz ultra sonic air transducer has a very interesting impedance response. The device is constructed
from a circular diaphragm that is riddled with dramatic resonance modes. The transducer was tested from
20KHz to 500KHz. Over this range, the impedance varies from 200 ohms to 5K. When zoomed in, there is a
classic impedance curve (a series resonance followed by a parallel resonance ) at 40KHz. But there is not
just one, there are also many others.
C:\projects\Cypher\Plots\Ultrasonic2005.gzd
Pen 2
106
Pen 3
Pen 4
Pen 5
Pen 6
C:\projects\Cypher\Plots\Ultrasonic2005.gzd
Pen 7
14:31:22
14:33:48
104
Pen 2
Pen 3
Pen 4
Pen 5
Pen 6
Pen 7
14:31:22
14:33:48
105
104
103
Modulus of Impedance - Ohms
Modulus of Impedance - Ohms
103
102
101
102
100
10 1
10 2
103
104
Frequency - Hz
Produced by Cypher Instruments
10 5
10 6
2*104
4*104
6*104
8*104
105
Frequency - Hz
Produced by Cypher Instruments
2*105
4*105
There is a major resonance at about 270KHz. Zooming in on this, we can see that there seems to be another
small resonance in between the minimum and maximum impedance. However, there are not enough sample
points in the plot to clearly reveal the response of the device. The transducer was retested using the ‘Use X
axis extents’ facility. The plot now has many points, enough to show the smaller resonance in finer detail.
C:\projects\Cypher\Plots\Ultrasonic2005.gzd
Pen 2
Pen 3
Pen 4
Pen 5
Pen 6
Pen 7
C:\projects\Cypher\Plots\Ultrasonic2005.gzd
14:31:22
14:33:48
Pen 2
Pen 4
Pen 5
Pen 6
Pen 7
14:31:22
14:33:48
14:36:42
Modulus of Impedance - Ohms
103
Modulus of Impedance - Ohms
103
Pen 3
102
2.0*105
102
2.5*105
Frequency - Hz
Produced by Cypher Instruments
3.0*105
3.5*105
2.0*105
2.5*105
Frequency - Hz
Produced by Cypher Instruments
3.0*105
3.5*105
Again, the ‘Use X axis extents’ facility is used to further zoom in and retest the response of the transducer.
C60 & CypherGraph User Manual
November 2006
Part # MAN-C60-1.2
Cypher Instruments Ltd
Page 62 of 121
Now the response is starting to look rather crunchy and ragged. This plot is now showing the noise floor and
quantization gremlins of the test system. Further zooming in will reveal more about the electronics of the
C60 than the response of the transducer.
C:\projects\Cypher\Plots\Ultrasonic2005.gzd
14:39:03
Pen 2
Pen 3
Pen 4
Pen 5
Pen 6
Pen 7
14:36:42
Modulus of Impedance - Ohms
2*102
2.64*105
C60 & CypherGraph User Manual
2.66*105
2.68*105
Frequency - Hz
Produced by Cypher Instruments
November 2006
2.70*105
2.72*105
Part # MAN-C60-1.2
Cypher Instruments Ltd
Page 63 of 121
Acoustic transducers
The impedance varies from 4.5 ohms to 35 ohms.
Also, the high end impedance varies as the passive
tone control is adjusted. The impedance & phase
plots reveal the horrors of driving reactive power
loads. The phase shift is between ±50o, which is
moderately dramatic. Imagine if it were ±90o. This
would mean that for certain frequencies the current
phase would be orthogonal to the voltage phase. Put
another way, the power amplifier driving this load
would have to deliver peak current when its output
voltage was zero volts. I have trouble imagining this.
Also, this peak current is extracted at the amplifier’s
distortion cross over point.
4*101
2*101
101
8*100
6*100
4*100
150
100
Phase - Degrees
A more common acoustic transducer is the humble
loud speaker. Probably there are more of these on
this planet than there are people. The nearest one to
hand, with a cable attached is my ‘8’ ohm studio
monitor with 2 speakers, a cross over and a passive
treble control.
Modulus of Impedance - Ohms
Studio monitor with tone control
50
0
-50
-100
-150
101
102
103
Frequency - Hz
Produced by Cypher Instruments
104
Some more impedance plots are shown below. Two head phones were tested, revealing the usual low
frequency peak. Also, a microphone with a three position passive tone switch, used to select different audio
responses. Both are electro acoustic transducers and their roles can be reversed. A microphone can be used
as a speaker and visa versa. This is common practice in ultrasonic pulse echo systems.
Remember that when testing acoustic devices, noise in the test room is turned into electrical energy. This is
an interfering signal, just as much as magnetic and electric interference is to electrical circuits. The C60 does
not know what it is doing. It treats all signals as the truth.
The two graphs were ‘tiled’ and screen captured, so their shape is not the usual square aspect ratio
C60 & CypherGraph User Manual
November 2006
Part # MAN-C60-1.2
Cypher Instruments Ltd
Page 64 of 121
Simple reactive components – L C R
Capacitors and inductors have a reactance that varies with frequency. They also suffer from parasitic effects
that degrade their theoretical performance. Inductance and capacitance store magnetic and electric energy
respectively. When these two combine they form resonant circuits.
The following tests were performed on capacitors and inductors with axial leads. These leads add parasitic
inductance and resistance to the part being tested.
Eight different capacitors were examined. The yellow trace is a 100pF ceramic capacitor. The subsequent
values are 1nF (brown), 10nF (black), 100nF (red), 1uF (orange), all plastic film. Then, a 10uF (blue),
tantalum bead. Next, a 100uF (mauve), regular electrolytic can type. Last, a 470uF capacitor (grey), a low
impedance electrolytic can device.
Capacitors
10nF
1nF
100nF
1uF
100pF
10uF
100uF
470uF
Modulus of Impedance - Ohms
10 6
10 5
10 4
10 3
10 2
10 1
10 0
10 -1
10 -2
150
Phase - Degrees
100
50
0
-50
-100
-150
101
102
103
104
Frequency - Hz
105
106
Produced by Cypher Instruments
The 1uF and 100nF capacitors show resonances at 1MHz and 2.7MHz. This is a mixture of self resonance
and the parasitic inductance in the test setup. The complex impedance graph reveals the capacitive, resistive
and inductive portions of the DUT response. A capacitor has a -90o V/I phase shift. An inductor has a +90o
V/I phase shift.
The plots show that ceramic and plastic film capacitors with wire leads and other forms of stray inductance,
will form series impedance resonators. At frequencies past this resonance, they ‘look’ inductive, which is
displayed by the phase jump. They have a rising impedance plot and a current phase reversal. To avoid
resonances with capacitors, use surface mount parts (no leads), use short thick tracks and use a ground
plane (the parasitic inductance is proportional to the loop area of the conduction return path). A ground
plane will reduce stray inductance, but will increase stray capacitance, which is another problem. Also, to
reduce stray capacitance, make tracks as small as possible, break up or cut out parts of the ground plane
under these tracks or use a ceramic board or a board with low dielectric value. Ordinary fibre glass (FR4)
has a value of 4; that is it is 4 times better than a vacuum at making capacitors. FR1 dielectric has a value of
1. To reduce both L and C parasitics, make everything as small as possible.
The 10uF tantalum capacitor has a characteristic flat response. For much of the response, its impedance
curve is better than the 100uF electrolytic capacitor. The low impedance 470uF capacitor has, as its name
suggests, the lowest impedance response, making it ideal for the bulk of a power supply reservoir. At high
frequencies, the stray inductance causes a rising impedance plot.
C60 & CypherGraph User Manual
November 2006
Part # MAN-C60-1.2
Cypher Instruments Ltd
Page 65 of 121
Capacitors have other parameters to consider. They have temperature coefficients. The Y5V ceramic
dielectric has an enormous coefficient, where as COG and NPO are really quite stable. Some capacitors
change value with applied DC voltage. They also have a parameter called ESR, Equivalent Series Resistance,
which may cause overheating and explosive rupture when used to filter or couple power; see the 100uF
electrolytic.
Five inductors with the same value (10uH) printed on them were tested by the C60. The results show that
they all have the same basic response at high frequencies, but not at low frequencies. The low end
impedance varies by about 50:1. This is a caused by different winding resistances used in the construction
of the inductors. Magnetic materials also have their own frequency response, quite apart from the definition
of reactance for an inductor { X L = 2 fL }, which assumes that the value of the inductor is invariant with
respect to frequency. For example, soft iron works well at low frequencies. However, ferrites are produced
for selected high frequency operation.
Five inductors with 10uH marking
Modulus of Impedance - Ohms
10 3
10 2
10 1
10 0
10 -1
10 -2
150
Phase - Degrees
100
50
0
-50
-100
-150
101
102
103
104
105
Frequency - Hz
Produced by Cypher Instruments
106
The phase shift is +90o when the impedance is dominated by the inductive reactance. When the winding
resistance becomes significant, the phase shift tends to zero.
Eventually, all inductors will self resonate or resonate with external parasitic capacitance. Five inductors,
1uH, 10uH, 100uH, 1mH and 10mH were tested (below). Their impedance plots show low frequency
shelving caused the winding resistance. This is an important consideration if they are to be used as passive
C60 & CypherGraph User Manual
November 2006
Part # MAN-C60-1.2
Cypher Instruments Ltd
Page 66 of 121
power filters. The power dissipated by the resistance defines the maximum safe current allowed through the
part. Their inductance may also vary with DC bias current.
Inductors
10uH
100uH
100uH
1uH
10000uH
Modulus of Impedance - Ohms
10 6
10 5
10 4
10 3
10 2
10 1
10 0
10 -1
10 -2
150
Phase - Degrees
100
50
0
-50
-100
-150
101
102
103
104
105
Frequency - Hz
Produced by Cypher Instruments
106
At high frequency, resonance occurs. Any stray capacitance forms a parallel LC resonator which causes an
impedance peak. It also causes a phase reversal. This is called the self resonant frequency of an inductor.
Past this frequency, it has the characteristics of a capacitor. At this frequency it behaves like a parallel
resonator. Even below this frequency it doesn’t behave much like a pure inductor. In this example, the
inductors are ‘inductive’ over a three to four decade range. If you want to use an inductor in a tuned circuit,
be certain that the self resonant frequency (SFR) of the inductor is much higher than that of the circuit.
C60 & CypherGraph User Manual
November 2006
Part # MAN-C60-1.2
Cypher Instruments Ltd
Page 67 of 121
In the previous text, ‘pure’ inductors and capacitors turned out to be less than perfect. Their parasitic
components produced self resonance. Below are examples of intentionally tuned circuits which are
constructed from discrete inductors and capacitors. In the example, a 10nF capacitor and a 10uH inductor
are used to construct resonant circuits. The downward sloping line (green) is the impedance plot of the 10nF
capacitor. The rising slope (brown), is that of the 10uH inductor.
Inductors and capacitors
Modulus of Impedance - Ohms
10nF
10uH
Parallel
Series
10 3
10 2
10 1
10 0
150
Phase - Degrees
100
50
0
-50
-100
-150
104
105
106
Frequency - Hz
Produced by Cypher Instruments
When the two components are wired in parallel (red), the impedance has a peak response at resonance.
When the two components are wires in series (blue), the impedance has a minimum response at resonance.
The phase plots indicate the transition through resonance. The resonant frequency happens at the
intersection of the L and C impedance plots. That is, when
|ZL |= |ZC|, resonance will occur.
These plots look like amplitude response graphs. They have the same general characteristics, such as
20dB/decade slopes, but they are representations of what is happening in the impedance domain.
C60 & CypherGraph User Manual
November 2006
Part # MAN-C60-1.2
Cypher Instruments Ltd
Page 68 of 121
Battery impedance
There are many types of battery. Some have relatively flat output voltage discharge curves, others have
large variations. Some are rechargeable, others not. Some self discharge with enthusiasm, others have a
good shelf life. They all suffer from similar problems. Their output voltage drops with discharge. Also their
internal impedance increases with discharge and with the number of times they have been recharged.
To date, there does not seem to be a reliable method of measuring the energy stored in a battery or the
available time left before the electrical demand collapses the power supply. Electronic gas gauges, so called
because they emulate the gasoline tank in a car, try to measure the charge in the battery as if it were a
‘liquid’. Coulombs (the liquid) are counted in and they are counted out. In this way, a gas gauge is
constructed. However, internal battery self discharge (a leak), defeats the measurement system. The battery
is overfilled on charge, which usually gives a 50% error on start up. Also, as the battery capacity reduces
with recharge cycles, it becomes more difficult to predict how much charge is left at any point in time. Even
if the gas gauge actually worked, it does not measure output impedance. The gas gauge could say, ‘there is
40% capacity left in the batteries’. However, the output impedance might have increased by a factor of 10.
If a high current demand happens, such as the charging up of a photo flash circuit, then the battery voltage
will suddenly dip causing a micro controller reset. It happens all the time. You go to take a digital photo, you
press the shutter switch and the camera turns itself off. Wonderful!
Battery Impedance; two Ni-MH AA cells
100uF/71mR
Pen 2
Charged battery
Pen 4
Pen 5
Pen 6
Used battery
Pen 8
Pen 9
Pen 10
10 0
Modulus of Impedance - Ohms
A pair of Nickel Metal Hydride
rechargeable AA cells was tested
for
impedance.
They
were
connected to the C60 via a 1000µF
low Z capacitor. This stops any DC
current from entering the C60 and
overheating it. The lower (black)
plot is the impedance of the
capacitor on its own. It claims to
have an ESR of 70mR at 100KHz.
The plot indicates 90mR, but also
includes
the
screw
terminal
adaptor, the C60 output inductance
and the wire leads of the capacitor.
This plot shows the errors caused
by the capacitor coupling. The
impedance
increases
at
low
frequencies
because
of
the
capacitor and increases at high
frequencies because of the stray
inductance of the test fixture.
10 -1
The middle plot (red) is a freshly
recharged pair of batteries. At
10KHz, the internal impedance is
0.4R. A 1 Amp current surge will
103
104
105
106
cause the voltage to dip by 400mV.
Frequency - Hz
Produced by Cypher Instruments
The top plot (blue) is a pair of the
same type of batteries that had powered a digital camera for 50 shots. The internal impedance at 10KHz is
3.5R. A 1 Amp current surge will cause the voltage to dip by 3.5V. Testing the battery impedance is another
tool that can be used to monitor battery quality.
C60 & CypherGraph User Manual
November 2006
Part # MAN-C60-1.2
Cypher Instruments Ltd
Page 69 of 121
Characteristic impedance – Cables
Put two or more insulated conductors together in a long cable and a characteristic impedance is formed
between them. This is because they virtually occupy the same physical space and so have mutual
capacitance and inductance.
This impedance is defined by; Zc = L / C , where Zc is the characteristic impedance of the cable and
L & C are the lumped inductance and capacitance per unit length of the cable. As we don’t have values for
either of these, the formula is only useful to cable designers who have control over the physics of the
design. There are two methods of finding out the characteristic impedance of a cable. One; it is written on
the cable drum and sometimes on the cable. Two; if that is too easy for you, then you can measure it.
Method
Take the cable and strip the insulation at both ends. Connect one end of the cable (two wires) to the C60.
Measure the impedance with the far end of the cable open circuit and then repeat with a short circuit. A reel
of less than 100 meters of RG179PE was tested (below). The open circuit Z (blue) is large at low
frequencies; the short circuit Z (mauve) is equal to the DC resistance of the cable loop.
The cable impedance at high frequencies is defined as;
Zc =
Zopen × Zshort .
Using the graph below; at high frequency, take a value for the open and shorted impedance, multiply and
square root to obtain a value for the characteristic impedance. At three increasing frequencies, values of
75.4R, 74.2R and 73.9R were calculated. The RG179PE is specified at 75R ± 3R. The characteristic
impedance can be obtained without mathematics; it is the value at the intersection of these two plots.
RG179PE cable impedance
RG179 o/c 100m
RG179 s/c 100m
Modulus of Impedance - Ohms
10 3
10 2
0.5M
1.0M
1.5M
2.0M
2.5M
Frequency - Hz
Produced by Cypher Instruments
3.0M
3.5M
4.0M
Note that the graph uses a linear Frequency axis. The cable is about 100 meters long and time domain
effects can be seen (the wave length in the cable). The RG179PE is a small diameter, general purpose
screened coaxial cable. The screen and the inner conductor form the characteristic impedance.
C60 & CypherGraph User Manual
November 2006
Part # MAN-C60-1.2
Cypher Instruments Ltd
Page 70 of 121
The next cable to be tested has been designed to connect USB-1 devices together. USB-1 uses data rates of
12 Mbits per second. It is important that the data wires in this cable bundle have a well specified
characteristic impedance. Electronic transmitters differentially drive the cable with a known drive resistance
and the receivers also have a known termination resistance. In this way, data waveform shapes are well
preserved, leading to minimal data errors. The USB cable bundle has two data wires that are twisted
together, a pair of power wires that are not twisted and an overall screen. The cable was designed to send
and receive data, to power peripheral devices and to be flexible by virtue of using multi-strand conductors
(unlike most Ethernet plumbing). The graph shows the impedance plots of the data pair for a 200m reel of
cable (black and brown) and a 4m length (red and orange). The screen and power wires were left floating
for this test. The USB standard says that the cable length shall not exceed 5m because of transmitter and
wavelength limitations.
USB cable impedance
10 5
Open
Shorted
Open small
Shorted small
Modulus of Impedance - Ohms
10 4
10 3
10 2
10 1
0.5M
1.0M
1.5M
2.0M
2.5M
Frequency - Hz
3.0M
3.5M
4.0M
Produced by Cypher Instruments
Again, a linear frequency axis reveals the regular time domain variations in the 200m cable. It looks like all
four plots are aiming for the same final value. At any frequency, take a value for the open and shorted
impedance, multiply and square root to obtain a value for the characteristic impedance. This gives values of
102R to 97.2R for the 200m length, and 95R for the 4m length. The USB specification for cable impedance is
90R ± 15%.
C60 & CypherGraph User Manual
November 2006
Part # MAN-C60-1.2
Cypher Instruments Ltd
Page 71 of 121
Measuring delay times – Cables
The signal propagation delay time of a 100m drum of coaxial cable was tested (below). One end of the cable
was driven via an external amplifier. The far end of the cable was resistively terminated by 75R. The output
of the C60 and the far end of the cable were resistively mixed together and fed into the input of the C60.
The resultant linear frequency response shows a cosine comb filter response (black). This is caused by the
differential time delay of the two signal paths. The red plot shows the cable on its own. It has high
frequency losses that cause the notch depth to diminish with frequency. The first notch is at 828KHz. This is
when the time delay is half a wavelength. A sine wave of 828KHz has a wave length of about 1.2µS, so half
a wavelength is 600nS. That means that the signal took 600nS to travel the 100m cable length. Therefore,
the velocity down the cable is given by V=D/T, which is V=100m/600nS. This is 166km/S, which is slower
than the velocity of light at 300km/S. For a cosine comb response, further notches occur at 3F, 5F, etc.
Both phase responses are shown on one graph by using a cut and paste process. The middle plot (red)
shows a triangle response. This is the phase response of a constant time delay. When this response is
unwrapped to show ±1800 (lower plot), the response is a ramp waveform. Phase errors are now more
visible at the zero crossing and at the extremes. Note, the data was acquired with the Linear mode selected,
so the points are linearly spaced.
Coaxial cable, 100m long
Coaxial
0
Cable only
-5
-10
Amplitude Gain - dB
-15
-20
-25
-30
-35
-40
-45
-50
0
-20
-40
Phase - Degrees
-60
-80
-100
-120
-140
-160
-180
0.5M
1.0M
1.5M
2.0M
Frequency - Hz
2.5M
3.0M
3.5M
3.0M
3.5M
Produced by Cypher Instruments
150
Phase - Degrees
100
50
0
-50
-100
-150
0.5M
1.0M
1.5M
2.0M
Frequency - Hz
2.5M
Produced by Cypher Instruments
C60 & CypherGraph User Manual
November 2006
Part # MAN-C60-1.2
Cypher Instruments Ltd
Page 72 of 121
Digital audio devices
Amplitude Gain - dB
A digital audio device was driven by the C60. The signal was converted by an ADC into a 24 bit digital data
stream and then reconverted back into an analogue signal with a DAC. This loop back test reveals some of
the perils of high quality digital audio systems. Both conversion processes send the data through long
transversal digital filters that shape the signal and noise spectrums and also recovery the analogue signal.
This filtering takes time to process the signals, in this case 3.1 milliseconds. The input signal was resistively
mixed with the non-inverted delayed signal. If the two signals have the same amplitude, then a cosine comb
response is produced. At 161Hz on
Digital Audio latency (21/3380) / 2 = 3.1065mS
CypherGraph V0.78.158 C60-0504-X0108 V0.77.1148
the graph, the first notch appears.
A frequency of 161Hz has a period
-5
of 6.2mS. However, a delay of half
-10
of 6.2mS will produce a delayed
-15
sine wave output that is in anti
-20
phase with the input signal. When
-25
these two signals are added
-30
together they cancel each other
-35
out, producing a notch in the
frequency response. So, the delay
-40
time of the unit is 6.2/2 = 3.1mSec.
-45
-50
-55
150
100
50
Phase - Degrees
The notches repeat every 322Hz.
There are 62 of them going all the
way up 20KHz. This is a nightmare
for the audio industry. Imagine
sending a signal off to a digital
effects unit, and then mixing it back
in with the source signal. Often, the
resultant mix will have a ‘drain pipe’
quality to it, caused by the
inadvertent comb filtering.
0
-50
-100
-150
0.0001M
0.0002M
0.0003M
0.0004M
0.0005M
0.0006M
Frequency - Hz
Produced by Cypher Instruments
0.0007M
0.0008M
0.0009M
The phase response is the classic saw tooth shape. At 0Hz, the input and output are in phase with each
other, and so the phase shift is zero. As the frequency increases, the phase swings linearly towards -90o,
and then flips around by 180o (at the zero) and continues to ramp downwards. The phase detector and the
sign detector are operating in near ideal conditions. The signals are low frequency (20KHz max) and large
(2Vpp). Compare this with a 2MHz sine wave at -60dB. The frequency is 100 times faster and the signal is
1/1000th of the level.
C60 & CypherGraph User Manual
November 2006
Part # MAN-C60-1.2
Cypher Instruments Ltd
Page 73 of 121
Transformer – Transmission
Isolation transformers are often used to couple signals from one part of a circuit to another. There is no
conducting electrical connection from one side to the other, which is useful when galvanic isolation is needed
to provide an electrical safety barrier. Barrier voltages of several thousand volts are easily obtained with slit
bobbins or tape layers. Transformers can be used to provide balanced inputs or outputs, which are
sometimes referred to as ‘floating’ or ‘differential connections’. These transformers pass differential signals,
but block common mode signals, which tend to be interfering signals. To be well balanced, a transformer
would need to be symmetrically constructed, which is physically difficult. Signals are magnetically coupled
from the input windings to the output windings. If the input/output winding ratio is less than unity, then the
transformer will provide a voltage gain. The transformer seems to be an engineering miracle, but does it
have any drawbacks?
The amplitude response of a transformer with a 1:2 and 1:4 ratio was tested (below). The transformer has a
‘band pass’ response. It has a high pass section, a flat pass band that extends for about two decades and
then a sharp cut off. This is a typical transformer response. It is very difficult to make a transformer with a
wide frequency response and a flat pass band. This part was designed to operate from 40KHz to 120KHz
which is the relatively flat part of the response. The plots show the amplitude gains of +6dB and +12dBs
(less a 10dB output attenuation from the C60).
The common mode rejection ratio [CMRR] was also tested (red plot). All the input terminals were connected
together and driven by the C60’s output. The signal at the output shows a dramatic rise in amplitude, which
suggests that this transformer has a poor CMRR at high frequencies. There is no copper screen between the
windings in this transformer design. If there had been an earthed screen, then the CMRR would have been
greatly improved.
Transformer with 1:2 and 1:4 ratios. Output attenuation = -10dB.
1:4
1:2
CMRR
0
-10
-20
Amplitude Gain - dB
-30
-40
-50
-60
-70
-80
101
102
C60 & CypherGraph User Manual
103
104
Frequency - Hz
Produced by Cypher Instruments
November 2006
105
106
Part # MAN-C60-1.2
Cypher Instruments Ltd
Page 74 of 121
Transformer – Reflected Impedance
A transformer can be used to provide a voltage gain. The transformer in the test below has two winding
ratios of 1:2 and 1:4. If it is driven with a 1Vpp signal, then 2Vpp and 4Vpp can be obtained at the output. It
is a passive voltage amplifier, with no power gain. The input side of the transformer ‘sees’ the load on the
output through the transformer windings. If the output voltage across the load has doubled, then the output
current into the load will double. The load impedance ‘seen’ at the input has increased with the square of
the turns ratio. The word ‘load’ can be misleading. If the load was resistive, then increasing the load is to
reduce the resistance. So, if you drive a resistor through a transformer with a voltage gain (N), the
resistance ‘seen’ at the driving side is reduced by N2. The voltage gain (N) is also the turns ration. For N=2,
the load quadruples. For N=4, the load increases by a factor of sixteen. This is also true for reactive loads
such as capacitors and inductors.
The input impedance of the transformer was examined. With the outputs open circuited, the transformer
shows a very peaky self resonance. With a 1K0 resistor across the X2 output, the load is 1K0/4 = 250R. With
a 1K0 resistor across the X4 output, the load is 1K0/16 = 62.5R. If the transformer had a X10 output, the
load would be 1K0/100 = 10R.
Transformer Reflected Impedance
No lead 1:2
1k0 = 250R 1:2
1k0 = 62.5R 1:4
10 5
Modulus of Impedance - Ohms
10 4
10 3
10 2
102
103
104
Frequency - Hz
105
106
Produced by Cypher Instruments
C60 & CypherGraph User Manual
November 2006
Part # MAN-C60-1.2
Cypher Instruments Ltd
Page 75 of 121
Appendix A
Amplitude responses and phase shifts in simple electrical circuits
There is not total agreement on the definition of phase shift in books, filter programs and web sites. Many
sources get the phase sign, filter equations and graphical response wrong! This appendix should help resolve
the confusion.
A first order RC low pass filter has a steady state phase lag when driven by a sine wave. This phase lag is
represented by a negative phase value. At low frequencies, the input and output signals are almost in phase,
approaching 90o at high frequencies. The amplitude and phase equations for a first order RC low pass filter
are shown below. With component values of R1=1 and C1=1, the filter has break frequency (-3dB point) of
1 radian per second.
First order low pass response
The amplitude response, Vout/Vin is referred to as A.
=
1
1+
2
, where
is the test frequency.
This can be expressed in dBs of loss.
dB
= 20. log10
1
1+
2
dB
The phase shift measured from Vin to Vout is referred to as
= tan
1
, where
tan
1
.
indicates the arctan function.
A first order RC high pass filter has a steady state phase lead when driven by a sine wave. This phase lead is
represented by a positive phase value. This lead is actually an extra long lag. Time travel has not happened!
At high frequencies, the input and output signals are almost in phase, approaching 90o at low frequencies.
The amplitude and phase equations for a first order RC high pass filter are shown below. The filter has break
frequency (-3dB point) of 1 radian per second (1/[R1C1]).
First order high pass response
The amplitude response, Vout/Vin is referred to as A.
=
1+
2
, where
is the test frequency.
This can be expressed in dBs of loss.
dB
= 20. log10
1+
2
dB
The phase shift measured from Vin to Vout is referred to as
= + tan
1
1
, where
C60 & CypherGraph User Manual
tan
1
.
indicates the arctan function.
November 2006
Part # MAN-C60-1.2
Cypher Instruments Ltd
Page 76 of 121
The top section of the graph is the measured amplitude response of a single pole (first order) high pass filter
(red) and a single pole low pass filter (blue). The bottom graph is the phase response of the high pass filter
and the low pass filter.
C:\projects\Cypher\Plots\LPHP_one_pole.gad
Pen 1
5
Pen 2
12:28:09
Pen 4
Pen 5
Pen 6
12:26:48
Pen 8
Pen 9
Pen 10
0
Amplitude Gain - dB
-5
-10
-15
-20
-25
-30
-35
-40
150
Phase - Degrees
100
50
0
-50
-100
-150
102
103
104
Frequency - Hz
105
106
Produced by Cypher Instruments
On the next page are the calculated responses of first and second order high and low pass filters.
Butterworth designs were used for this simulation. The Butterworth filter is called maximally flat because it
has no overshoot in the ‘Amplitude’ frequency response. Other filter designs trade pass band flatness for
stop band attenuation. These show up in the phase response, group delay and step response. For best wave
shape preservation, use a Bessel filter. This has a ‘flat’ group delay, but poor roll off response. The
Butterworth filter has a better initial roll off slope at the expense of over shoot to a step drive. The poles of a
high order Butterworth filter are all at the same frequency, only the Q factors are different. For faster roll off
slopes, Chebyshev filters trade pass band ripple, wild phase responses and time domain ringing for rapid
initial roll off slopes. Even faster roll offs can be obtained with Cauer or Elliptic filters. These use stop band
zeros that cause the output signal to disappear into notches that are situated along the frequency axis. A
signal passing through a zero suffers an instantaneous 180o phase shift. However, the signal has zero
amplitude and so that makes it an event that is difficult to observe.
C60 & CypherGraph User Manual
November 2006
Part # MAN-C60-1.2
Cypher Instruments Ltd
10
Page 77 of 121
1st Order Lowpass and Highpass
10
0
-10
-10
dB
dB
0
-20
-20
-30
-30
0.1
1
10
Frequency Radians/Sec
-40
0.01
100
150
150
100
100
50
50
Phase
Phase
-40
0.01
0
-50
-100
-100
-150
-150
10
0.1
1
10
Frequency Radians/Sec
0.1
1
10
Frequency Radians/Sec
100
0.1
1
10
Frequency Radians/Sec
100
0
-50
0.01
100
0.01
1st & 2nd Order Lowpass
10
0
-10
-10
1st & 2nd Order Highpass
dB
dB
0
-20
-20
-30
-30
-40
0.01
0.1
1
10
Frequency Radians/Sec
-40
0.01
100
150
150
100
100
50
50
Phase
Phase
2nd Order Lowpass and Highpass
0
-50
-100
-100
-150
-150
0.1
1
10
Frequency Radians/Sec
C60 & CypherGraph User Manual
100
0.1
1
10
Frequency Radians/Sec
100
0
-50
0.01
0.1
1
10
Frequency Radians/Sec
100
November 2006
0.01
Part # MAN-C60-1.2
Cypher Instruments Ltd
Page 78 of 121
10
4th Order Lowpass and Highpass
0
-10
dB
Another simulation shows a fourth order Butterworth low pass
and high pass filter. The filter slopes are 24dB/octave or
80dB/decade. The phase excursions are 360o in magnitude. When
the two steady state phase responses are plotted on the same
graph they are coincident. Actually, they are always 360o apart,
but this type of graph wraps the phase data and so they appear
to be coincident.
-20
-30
-40
0.01
0.1
1
10
Frequency Radians/Sec
100
0.1
1
10
Frequency Radians/Sec
100
150
100
Phase
50
0
-50
-100
-150
0.01
S plane pictures by courtesy of James Grant
Above, is a range of low pass Butterworth filter responses, drawn above the S plane. These are all pole
devices, with filter orders from 4 to 9. The Butterworth design is maximally flat in the frequency domain.
However, their response to a step function will produce an overshoot. The poles are evenly spread on a
semicircle whose origin is the axis crossing of the S plane. The 3D plots are vertically sliced along the j
(imaginary) axis to reveal amplitude response.
C60 & CypherGraph User Manual
November 2006
Part # MAN-C60-1.2
Cypher Instruments Ltd
Page 79 of 121
Appendix B
Reactance and Impedance in simple electrical circuits
The Reactance of physical object is a description of how it resists the flow of current when driven with a
sinusoidal voltage. As the frequency varies, the magnitude of the Reactance varies. For electronic
components there are three types of Reactance. These are referred to as XL, XC, and XR, which are
respectively the reactance of pure inductive, capacitive and resistive devices. Reactance is expressed in the
units of resistance, the Ohm. Inductors have the property of storing magnetic energy by way of moving
electrons (current). Capacitors store electric energy in the form of a static collection of electrons (charge).
Resistors store absolutely nothing. They waste electrical energy by turning it into heat.
Definition of the Reactance of pure inductance, capacitance and resistance
X L = 2 fL
f is the frequency in Hz and L is inductance in Henrys
,where
X C = 1 (2 fC ) ,where C is the capacitance in Farads
XR = R
,where R is resistance in Ohms
The inductor has a Reactance that is proportional to frequency. Double the frequency and the
Reactance will double in magnitude. Graphically, this is slope that rises in magnitude by +6dBs
for every octave increase in frequency (see plot below).
The capacitor has a Reactance that is inversely proportional to frequency. Graphically, this is
slope that falls in magnitude by -6dBs for every octave increase in frequency.
The resistor is not frequency dependant. Its Reactance has a constant value.
The Reactance of two inductors and two capacitors plotted as a function of frequency
:= 0.01, 0.02.. 100
Inductors
Capacitors
L := 0.01
a(
) := 20log(
L)
b(
) := 20log(
L 10)
c(
) := 20log
1
d(
) := 20log
1
C 10
C 100
Reactance response
0
a( )
C := 1
20
dB
b( )
c( )
40
d( )
60
80
0.01
0.1
1
10
100
Frequency
C60 & CypherGraph User Manual
November 2006
Part # MAN-C60-1.2
Cypher Instruments Ltd
Page 80 of 121
Reactance is used to describe pure inductance and capacitance. A mixture of LCR components is said to
have a Complex Impedance. Real components contain all three types of Reactance in the form of stray
capacitance, stray inductance and series/parallel resistance, all of which compromises their functionality.
In fact, many components can self resonate, inductors and capacitors being common examples.
Manufacturers often provide a SRF value (self resonant frequency) for inductors. At this frequency the
inductor and its stray capacitance form an LCR resonator. Above this frequency the device behaves more like
a capacitor. Conversely, the leads on a capacitor are inductive. These form series LCR resonators that makes
the device behave as an inductor past the resonance frequency. Impedance plots from component
manufacturers are often to use to illustrate this behaviour.
Wires and printed circuit board tracks introduce stray inductance and capacitance to electronic networks.
One inch of wire can have an inductance of about 20nH (rule of thumb). This has a Reactance of 1.25 ohms
at 10MHz. If a peak to peak sinusoidal current of 2Amps is flowing through this wire, then there is a 2.5Vpp
voltage drop across the one inch of wire. This voltage is produced by the Reactance of the wire. My personal
record was 22Vpp sustained across a lead from a BNC connector to ground in a prototype RF power
amplifier.
A 1X scope probe has an input resistance of 1Mohm and an input capacitance of about 100pF. Past 1.59kHz,
the probe Impedance is dominated by the capacitor. At 1MHz, the 1Mohm scope probe has an Impedance of
1591 ohms, and at 10MHz, it is 159 ohms. Often a circuit will change its operation when a scope probe is
connected. Why could that be? A FET scope probe with a 1pF//1MR input capacitance will reduce this
problem. The down side is that a FET probe can cost as much as the scope. Another scope probe
Impedance phenomena is the earth clip. This forms a nice loop inductor, which can resonate with the probe
capacitance. This self resonance limits the bandwidth of the probe. This effect can be seen by probing a high
speed logic signal and then curling the earth lead around the probe body. The signal seen on the scope has
resonant edges that can be changed by modifying the earth clip geometry. The inductance can be minimized
by using a probe with a tip and pointed earth ring. For this to work, the part of the circuit being probed
needs a local earth pad. This is almost impossible to arrange. Most circuits are constructed from very small
surface mount components. A 0.4mm IC pin pitch is not uncommon! The problem with probing these boards
is one of physical size, quite apart from the probe impedance. Scope probes have not reduced much in size
in the last 40 years and now are often as big as the board being tested!
Scope probe impedance
The BNC to 4mm adaptor (grey) was
a surprise. It has an impedance of
34K at 1MHz, which is equivalent to a
4.5pF capacitor. Even this small
capacitance shows up on the graph.
open circuit
Ax1
A x 10
B x 10
C x 100
1M coax thin
1M coax thick
BNC/4mm
open circuit
10 4
10 3
103
C60 & CypherGraph User Manual
Bx1
10 5
Modulus of Impedance - Ohms
A selection of scope probes and other
connectors was tested (right). The
highest impedance probe was a X100
device (green). The worst probe was
the ‘B x 1’ (orange), which was 584
Ohms at 4MHz. This graph shows how
much loading a scope probe will
present to a circuit, even at relatively
low frequencies. Two coaxial BNC to
BNC leads were also tested (blue &
mauve). They presented the biggest
loading.
November 2006
104
Frequency - Hz
Produced by Cypher Instruments
105
106
Part # MAN-C60-1.2
Cypher Instruments Ltd
Page 81 of 121
Appendix C
The scripting language
Test scripts are ASCII text files that contain instructions to control the instrument to perform a test or set of
tests. This enables the user to run a collection of tests and leave the program to it, rather than having to
control the program manually. This is most useful if you wish to perform production testing or quality control
tests on a large quantity of devices. The test script can be written using any non-document text editor (such
as notepad.exe) and are downloaded to the instrument where it resides in non-volatile memory. This allows
an instrument to be configured to test a particular device.
The instrument can also control an external multiplexer to switch between different parts or channels of a
device that require testing. The test script language (known as CypherScript) allows full control of the
instrument as well as the ability to save the graphs and export the data in any of the supported formats. A
test script can be passed to CypherGraph via the command line, or re-run the test script in non-volatile
memory (with –rerun), allowing test automation of the instrument and the CypherGraph software. For
example below is a small example of a test script. A “#” or hash character at the start of a line defines a
comment. For reading ease the comment are in green, the commands in blue and the data is in black text.
# Load a new amplitude document and name it "My Graph"
newampf My Graph
# Set the number of points
points 500
# Start the test from 1K to 100KHz
amptest 1000 100000
# Label the line
legend My Device
# Wait for the test to complete
wait
# Set the export format not to append time, date and serial number
# and use a precision of 3 decimal places
exportformat 1 0 0 0 3
# Export the data in plain ASCII text
exporttxt Pen1TextFileName
# Save the graph to the hard disk in the plot files folder with time, date and serial no.
exportformat 0
savegraph My Graph
# print the graph (0 = portrait 1 = landscape)
printgraph 0
# close the graph
close
# End of file
If the hash character is omitted the first word will be parsed as a command and it is likely that an error will
occur as most will either be invalid commands or pass invalid data. The first command ‘newampf’ will open a
new amplitude verses frequency graph and title it ‘My Graph’. The second command, ‘points’ sets the
number of test points to 500. The third command is ‘amptest’ this command starts the test from 1K to
100KHz. The next command is ‘legend’; this command sets the pen legend text to “My Device”. The
command ‘wait’ halts script processing until the test has completed. Otherwise the test script will execute
the command before the test has finished. The ‘exportformat’ command defines the text format with which
to output the data, and the exporttxt command writes the file to the hard disk in the export folder. The next
command is ‘savegraph’ this command saves and closes the graph. The text following the command is the
name given to the file when it is saved. The name given to the saved file also contains the date and time of
the save, this is because the ‘exportformat 0’ command specifies this behaviour. The ‘printgraph’ command
then prints the graph to the default printer in portrait orientation. Finally the ‘close’ command closes the
document.
Scripts commands are executed one after another in the order they appear in the text file. There are no
facilities to loop or jump. Strings and file names can be of a maximum of 62 characters in length. Script files
can be a maximum of 25K bytes (25600 characters). Windows file name character restrictions do not allow
the following characters; /,\,:,*,”,<,> and |. If any of these characters appear in a file name they will be
removed. If a file name or title is omitted the user will be prompted to enter one.
C60 & CypherGraph User Manual
November 2006
Part # MAN-C60-1.2
Cypher Instruments Ltd
Page 82 of 121
Script commands
There are a total of 35 commands used to control the instrument, which are outlined Figure 1. Each
command has none, one or more parameters and a return character to signify the end of the command.
Command
abort
amptestt
atten
close
checkmask
endfreq
exportbmp
exportjpg
exporttxt
exportformat
exportwmf
idlefreq
imptest
legend
linear
loadgraph
message
newampf
newimpf
period
phase
points
printgraph
prompt
promptabort
prompnottabort
quit
savegraph
setpen
setpin
sleep
startfreq
sweepmode
title
wait
Description
Aborts the test script
Starts an amplitude test
Sets the output attenuator in 2.5dB steps
Closes the current open document
Checks the specified pen’s data set against the masks for a GO or NO GO result
Specifies the end frequency of the sweep in Hz
Exports a bitmap image file of the graph to the Exports folder
Exports a JPEG image file of the graph to the Exports folder
Exports an ASCII text file of one pen’s data
Specifies the export file format for ASCII text and file naming
Exports a Windows meta file image of the graph to the Exports folder
Specifies the oscillator frequency when not testing
Starts an impedance test
Adds text to a pen legend
Specifies linear or logarithmic test points
Loads a graph from the Plots folder
Launches a dialog box with text to inform the operator
Opens a new amplitude Vs Frequency graph
Opens a new modulus of impedance Vs Frequency graph
Specifies the time period in milliseconds between test points
Enables / disables phase data acquisition
Specifies the number of test points to take
Prints the graph
Launches a dialog and waits for the user to click OK
Launches a dialog and aborts script processing if the Yes button is clicked
Launches a dialog and aborts script processing if the No button is clicked
Quits the CypherGraph application
Saves the graph
Sets the pen number to use
Sets the output control pins
Halts script processing for a specified number of milliseconds
Specifies the start frequency of the sweep in Hz
Specifies the direction of sweep
Adds text to a graph’s title
Halts script processing until the test has completed
Figure 1 Table of test script commands
The alphabetical list of commands below includes a description of each one with an example. All
commands must be in lower case letters.
C60 & CypherGraph User Manual
November 2006
Part # MAN-C60-1.2
Cypher Instruments Ltd
Page 83 of 121
A
abort
abort<CR>
This command aborts further processing of a script.
Example:
# Save the graph
savegraph X303
# export a wmf
exportwmf X303
# print the graph (0 = portrait 1 = landscape)
printgraph 0
# for now leave the file open for examination
abort
# close the graph – because the abort command is executed before the close
# script processing is stopped before the document is closed
close
amptest
amptest startFrequency endFrequency numTestPoints<CR>
startFrequency – Optional parameter to specify the starting frequency (A) in Hz
endFrequency – Optional parameter to specify the ending frequency (B) in Hz
numTestPoints – Optional parameter to specify the number of test points to use
This is a command to start an amplitude test. Three optional parameters can be passed to the
command these are start frequency (A), end frequency (B) and number of points. The test is then
started. If the command is passed without additional parameters the settings are as previously set or
default if not specified by another command. Before this command is executed a document should be
opened with newampf, newimpf or loadgraph command. It should also be followed by the wait
command to halt further script processing until the test has finished.
Example:
# Load a new amplitude document and name it "My Graph"
newampf My Graph
# Set the number of points
points 500
# Start the test from 1K to 100KHz
amptest 1000 100000
wait
atten
atten attenuationCode<CR>
attenuationCode – Parameter to specify the output attenuation in 2.5dB steps
This command specifies the oscillator output attenuation according to the table in Figure 2.
Attenuation Code
Oscillator output attenuation in dB
0
0
1
2.5
2
5
3
7.5
4
10
5
12.5
6
15
7
17.5
8
20
Figure 2 Oscillator output attenuation codes
C60 & CypherGraph User Manual
November 2006
Part # MAN-C60-1.2
Cypher Instruments Ltd
Page 84 of 121
Example:
# Load a new amplitude document and name it "My Graph"
newampf My Graph
atten 0
linear 0
sweepmode 0
imptest 1000 3000
legend 0dB
wait
atten 1
imptest
legend -2.5dB
wait
C
close
close<CR>
A command to close an open document. It isn’t necessary to pass any parameters with the command.
It is recommended that only one document is open at any one time. This will avoid confusion over
which is the active document in CypherGraph’s Multi-Document user interface. Therefore when the
data has been acquired and saved or exported to the hard disk then the document should be closed
before a new one is opened.
Example:
newampf Amplitude
prompt A new amplitude document
close
newimpf Impedance
prompt A new impedance document
close
checkmask
checkmask penIndex passNotification failNotification abortScriptOption<CR>
penIndex – The index of the pen (0 to 9) to compare against the mask
passNotification – Launch a dialog box to notify of pass when set to 1. No notification when set to 0.
failNotification – Launch a dialog box to notify of failure when set to 1, No notification when set to 0.
abortScriptOption – Option to abort script processing when set to 1 on failure, 2 for pass and no abort
when set to 0
When data has been acquired into a graph with limit masks drawn, CypherGraph can compare the
data against the masks to produce a “PASS” or “FAIL” result. The check mask command allows this to
be automated. The pen index, pass notification, fail notification and abort script processing
parameters define the actions of the command.
Example:
# Check the data (pen 3 - index 2) against the mask
# Do not inform on pass, inform on fail, abort test script on fail
checkmask 2 0 1 1
C60 & CypherGraph User Manual
November 2006
Part # MAN-C60-1.2
Cypher Instruments Ltd
Page 85 of 121
E
endfreq
endfreq endFrequency<CR>
endFrequency – Parameter to specify the end frequency (B) in Hz
Example:
endfreq 4000000
startfreq 10
exportbmp
exportbmp bmpFileName<CR>
bmpFileName – Optional file name of the bitmap file without the file extension (.bmp)
This command exports a bitmap image of the graph to the export folder using the file name specified.
If the file name is omitted then the user is prompted to enter one. If no file name is entered then the
file is not saved. File paths are not allowed, only the file name. Windows file name character
restrictions apply.
exportjpg
exportjpg jpgFileName<CR>
jpgFileName – Optional file name of the JPEG file without the file extension (.jpg)
This command exports a JPEG image of the graph to the export folder using the file name specified. If
the file name is omitted then the user is prompted to enter one. If no file name is entered then the
file is not saved. File paths are not allowed, only the file name. Windows file name character
restrictions apply.
Example:
exportformat 1
exportbmp BmpFileName
message Done!
# eof
exporttxt
exporttxt txtFileName<CR>
txtFileName – Optional file name of the text file without the file extension (.txt)
This command exports one pen’s data as ASCII text to the export folder using the file name specified.
If the file name is omitted then the user is prompted to enter one. If no file name is entered then the
file is not saved. File paths are not allowed, only the file name. Windows file name character
restrictions apply. The pen to export should be specified by the exportformat command.
Example:
exportformat 1 0 0 0 3
exporttxt Pen1TextFileName
exportformat 1 1 1 0 3
exporttxt Pen2TextFileName
exportformat 1 2 1 1 3
exporttxt Pen3TextFileName
exportformat 1 3 0 0 3
exporttxt Pen4TextFileName
exportformat 1 4 0 0 3
exporttxt Pen5TextFileName
exportformat 1 5 0 0 3
exporttxt Pen6TextFileName
exportformat 1 6 0 0 3
exporttxt Pen7TextFileName
exportformat 1 7 0 0 3
exporttxt Pen8TextFileName
exportformat 1 8 0 0 3
exporttxt Pen9TextFileName
C60 & CypherGraph User Manual
November 2006
Part # MAN-C60-1.2
Cypher Instruments Ltd
Page 86 of 121
exportformat 1 9 0 0 3
exporttxt Pen10TextFileName
message Done!
exportformat
exportformat filePreference penNumberIndex phaseType dataType decimalPrecision<CR>
filePreference – Parameter to control the addition of date, time and instrument serial number to the
file name. When set to 0 no text will be appended and will overwrite a previous file without
prompting. When set to 1 the date, time and instrument serial number are appended. This parameter
alters all export file name preferences and the savegraph command too.
penNumberIndex – Parameter to specify the zero based pen index (0..9) for pens 1 to 10 to export in
ASCII text format.
phaseType – Parameter to specify the phase export ASCII data, 0 for 360 degrees and 1 for 180
degrees.
dataType – Parameter to specify the amplitude / impedance export ASCII data, 0 for gain /
impedance and 1 for loss / admittance.
decimalPrecision – Parameter to specify the decimal precision of the ASCII text data.0 to 9
representing the number of decimal places required.
This command specifies the output file-naming format for all files exported via a script command. It
also specifies the pen number, phase data, amplitude / impedance data types and the decimal
precision of the data for text exported via a script command. The file preference parameter gives the
user the ability to either generate an individual file name for each export or to overwrite an existing
file. This is useful if the CypherGraph application is used to acquire data for automated testing. The
data acquired can be exported to a text file where it can be further processed by another application.
Example:
exportformat 1 0 0 0 3
exporttxt Pen1TextFileName
exportformat 1 1 1 0 3
exporttxt Pen2TextFileName
exportformat 1 2 1 1 3
exporttxt Pen3TextFileName
exportformat 1 3 0 0 3
exporttxt Pen4TextFileName
exportformat 1 4 0 0 3
exporttxt Pen5TextFileName
exportformat 1 5 0 0 3
exporttxt Pen6TextFileName
exportformat 1 6 0 0 3
exporttxt Pen7TextFileName
exportformat 1 7 0 0 3
exporttxt Pen8TextFileName
exportformat 1 8 0 0 3
exporttxt Pen9TextFileName
exportformat 1 9 0 0 3
exporttxt Pen10TextFileName
message Done!
exportwmf
exportwmf wmfFileName<CR>
wmfFileName – Optional file name of the Windows meta file without the file extension (.wmf)
This command exports a Windows meta file image of the graph to the export folder using the file
name specified. If the file name is omitted then the user is prompted to enter one. If no file name is
entered then the file is not saved. File paths are not allowed, only the file name. Windows file name
character restrictions apply.
Example:
exportformat 1
exportwmf WmfFileName
message Done!
C60 & CypherGraph User Manual
November 2006
Part # MAN-C60-1.2
Cypher Instruments Ltd
Page 87 of 121
I
idlefreq
idlefreq idleFrequency<CR>
idleFrequency – Parameter to specify the oscillator output frequency in Hz
Command to set the oscillator idle output frequency. If the function is passed a zero then the
oscillator output is switched off when not testing and a value of -1 should be passed for start
frequency.
Example:
idlefreq 0
prompt Check that there is no output sine wave
sweepmode 0
startfreq 1000
idlefreq -1
prompt Check that the output frequency is 1KHz
idlefreq 2000
prompt Check that the output frequency is 2KHz
imptest
imptest startFrequency endFrequency numPoints<CR>
startFrequency – Optional parameter to specify the starting frequency (A) in Hz
endFrequency – Optional parameter to specify the ending frequency (B) in Hz
numTestPoints – Optional parameter to specify the number of test points to use
This is a command to start an impedance test. Three optional parameters can be passed to the
command these are start frequency (A), end frequency (B) and number of points. The test is then
started. If the command is passed without additional parameters the settings are as previously set or
default if not specified by another command. Before this command is executed a document should be
opened with newimpf, amptest or loadgraph commands.
Example:
loadgraph CypherScriptImp.gzd
atten 0
linear 0
startfreq 1000
endfreq 3000
imptest
legend 0dB
wait
L
legend
legend penLegendText<CR>
penLegendText – Parameter that specifies the current pen legend text
A command to legend a pen.
Example:
newampf My Graph
imptest 1000 3000
legend Pen Legend Text
wait
C60 & CypherGraph User Manual
November 2006
Part # MAN-C60-1.2
Cypher Instruments Ltd
Page 88 of 121
linear
linear pointInterval<CR>
pointInterval – Parameter to specify logarithmic or linear frequency point intervals
Command to specify the frequency test points interval spacing. A parameter value of 1 specifies linear
frequency intervals and a value of 0 specifies logarithmic frequency intervals.
Example:
linear 0
amptest
legend Logarithmic test points
wait
linear 1
amptest
legend Linear test points
wait
title Linear / logarithmic test
prompt Linear / logarithmic function test complete
loadgraph
loadgraph graphFileName<CR>
graphFileName – Parameter specifying the file name of a graph to open
This command loads an existing graph residing in the Plots folder of the hard disk. The file
name must be specified including the file extension. Windows file name restrictions apply.
This allows the user to configure the view of a graph prior to running a script, including a
mask and then load the graph during script processing.
loadgraph CypherScriptAmp.gad
atten 0
linear 0
startfreq 1000
endfreq 3000
amptest
legend Test 1
wait
M
message
message messageText<CR>
messageText – The text string. This can be a maximum of 62 characters
Command to bring up an information dialog box containing the message text. This command does not
halt script processing.
Example:
message Done!
C60 & CypherGraph User Manual
November 2006
Part # MAN-C60-1.2
Cypher Instruments Ltd
Page 89 of 121
N
newampf
newampf graphTitleText<CR>
graphTitleText – Optional parameter to specify the title text of the graph
This command creates a new amplitude vs. frequency document. The title of the graph can optionally
be specified in the command.
Example:
newampf Amplitude
sleep 100
prompt A new amplitude document
close
newimpf
newampf graphTitleText<CR>
graphTitleText – Optional parameter to specify the title text of the graph
This command creates a new impedance vs. frequency document. The title of the graph can optionally
be specified in the command.
Example:
newimpf Impedance
sleep 100
prompt A new impedance document
close
P
period
period testPeriod<CR>
testPeriod – Parameter to specify the test period time in mS
Command to set the test period time, which is the time between a change in the oscillator’s frequency
and when the amplitude / impedance and phase measurements are made.
phase
phase phaseOption<CR>
phaseOption – Parameter to specify phase data collection on = 1 or off = 0
Command to enable or disable the acquisition of phase data.
Example:
phase 1
points
points numPoints<CR>
numPoints – Parameter to specify the number of test points
Command to set the number of test points to use when not specified in the XREF-amptest or XREFimptest commands.
C60 & CypherGraph User Manual
November 2006
Part # MAN-C60-1.2
Cypher Instruments Ltd
Page 90 of 121
printgraph
printgraph paperOrientation<CR>
paperOrientation – Parameter specifies the orientation in which to print the graph
The command prints the graph. The paper orientation parameter specifies portrait when 0 and
landscape when 1.
Example:
printgraph 0
prompt
prompt promptText<CR>
promptText – Text string to appear in the prompt dialog box.
This command launches a dialog box containing the text string. It halts script processing until the user
clicks to OK button. This command is designed to halt script processing until the operator has
acknowledged and responded to the prompt text.
Example:
newimpf Impedance
prompt A new impedance document
close
promptabort
promptabort promptText<CR>
This command launches a dialog box containing the text string. It halts script processing until the user
clicks the ‘Yes’ or ‘No’ buttons. If the user clicks the ‘Yes’ button, further script processing is aborted.
If the user clicks the ‘No’ button, script processing is resumed.
Example:
# Prompt to quit the application
promptabort Do you wish to continue using CypherGraph?
# If the user clicks ‘Yes’ then the script is aborted and the quit command is not processed
quit
# eof
prompnottabort
promptnotabort promptText<CR>
This command launches a dialog box containing the text string. It halts script processing until the user
clicks the ‘Yes’ or ‘No’ buttons. If the user clicks the ‘No’ button, further script processing is aborted. If
the user clicks the ‘Yes’ button, script processing is resumed.
Example:
# Prompt to quit the application
prompnottabort Do you wish to exit CypherGraph?
# If the user clicks ‘No’ then the script is aborted and the quit command is not processed
quit
# eof
C60 & CypherGraph User Manual
November 2006
Part # MAN-C60-1.2
Cypher Instruments Ltd
Page 91 of 121
Q
quit
quit<CR>
This command quits the CypherGraph program. No parameters are required. The user will be
prompted to save any un-saved documents. This is useful if CypherGraph is to be used as a part of an
automated test procedure, where the application is launched, performs some tests, exports the data
and then quits allowing further processing of the data to be performed.
Example:
quit
C60 & CypherGraph User Manual
November 2006
Part # MAN-C60-1.2
Cypher Instruments Ltd
Page 92 of 121
S
savegraph
savegraph graphFileName<CR>
graphFileName – Optional text string of the file name to use when saving the graph
This command saves the graph with the file name specified. If no file name is specified in the
command the user is prompted to enter one. If the user does not enter a file name the file is not
saved. File paths are not allowed, only the file name. Windows file name character restrictions apply.
The file extension should be omitted since this will be added automatically based on the type of graph
being saved.
Example:
# Save the graph
savegraph My Graph
setpen
setpen penIndex<CR>
penIndex – The zero based index of the pen to use (0..9)
Command to select a new pen. The command requires a number from 0 to 9 specifying the pen
number 1 to 10.
Example:
newampf Amplitude tests
points 424
# lazy way of setting the start and end frequency
# saves typing the same numbers at the end of each amptest or imptest
# command. Also means groups of test can be changed easily
startfreq 1000
endfreq 1000000
atten 0
setpin 8
sleep 100
amptest
legend Black
wait
setpin 9
sleep 100
amptest
legend Brown
wait
setpin 10
sleep 100
amptest
legend Red
wait
setpin 11
sleep 100
amptest
legend Orange
wait
# Skip yellow pen
setpen 5
setpin 12
sleep 100
amptest
legend Green
wait
C60 & CypherGraph User Manual
November 2006
Part # MAN-C60-1.2
Cypher Instruments Ltd
Page 93 of 121
setpin
setpin pinCode<CR>
pinCode – Parameter to specify the code presented to the output control pins
The instrument has a six bit digital output facility, which can be used to control an external hardware
multiplexer. This enables the user to select different hardware configurations prior to performing a test. The
‘setpin’ command controls this digital code. The table in Figure 3 shows the relationship between the
parameter number and the logical state of the output terminals.
The pinCode is a decimal number in the range 0 to 63, that is interpreted as a six bit binary number, D5
(msb) to D0 (lsb). This can be calculated from the series:pinCode Number = D5c(32) + D4c(16) + D3c(8) + D2c(4) + D1c(2) + D0
where the ‘D’ references can be a 1 or 0.
The table in Figure 3 shows the relation ship between the parameter number and the logical state of
the output terminals.
D5
D4
D3
D2
D1
D0
Number
0
0
0
0
0
0
0
0
0
0
0
0
1
1
0
0
0
0
1
0
2
0
0
0
0
1
1
3
0
0
0
1
0
0
4
0
1
0
0
0
0
16
0
1
0
0
0
1
17
1
1
1
1
1
0
62
1
1
1
1
1
1
63
Figure 3 Pin code number to output table
sleep
sleep timeIn_mS<CR>
This command causes script processing to halt for the specified time period in milliseconds. During
portions of script processing the user may wish script processing to pause to let analogue signals
settle. An example of this would be when changing a the pin code which controls a de-multiplexer
driving channel selection relays. Because the relays will mechanically bounce and a DC offset may
have been introduced into the device under test a small pause is required before test can continue.
Example:
sleep 100
startfreq
startfreq startingFrequency<CR>
startingFrequency – Parameter to specify the starting frequency in Hz.
Command to set the test start frequency to use when not specified in the test command.
Example:
startfreq 1000
C60 & CypherGraph User Manual
November 2006
Part # MAN-C60-1.2
Cypher Instruments Ltd
Page 94 of 121
sweepmode
sweepmode sweepDirection<CR>
sweepDirection – Parameter to specify the sweep direction.
This command controls the direction of sweep. Set the parameter to 0 to sweep from the start
frequency (A) to the end frequency (B). Set the parameter to 1 to reverse the direction (B to A).
Finally a value of 2 will alternate between forward (A to B) and reverse (B to A).
sweepmode 2
T
title
title graphTitleText<CR>
graphTitleText – Text string of the required title.
Command to set the graph title. If the title text is omitted then the user is prompted to enter one. If
the user fails to enter a title it is unchanged.
W
wait
wait<CR>
Command to halt command processing until the current test has completed. This command should
always follow the amptest or imptest commands.
C60 & CypherGraph User Manual
November 2006
Part # MAN-C60-1.2
Cypher Instruments Ltd
Page 95 of 121
Appendix D
Installing CypherGraph
The CypherGraph software requires Windows ‘98SE with Internet Explorer 4 (or higher), ME, 2000, or XP.
The basic installation procedure is the same for all operating systems however the installation of the device
driver for the C60 varies slightly. The device driver is included on the CypherGraph software CD and it is
advised that the CD is in the CD-ROM drive when the C60 is plugged in for the first time.
When the CypherGraph application is opened it will connect to the first instrument that it finds. If
CypherGraph is already opened and the status bar reports that the instrument is disconnected (bottom left
hand corner of the application window) then click the USB icon on the horizontal tool bar. This will open the
Select Instrument dialog box. Choose the device to connect to from the drop down list box. If there are no
instruments listed, make sure that the instrument is connected and click the ‘Refresh’ button. Click ‘OK’ to
connect to the device.
If CypherGraph does not display any devices in the drop down list when the refresh button is pressed and
the C60 is connected, then follow the instructions in the Device driver update section to ensure that the
device driver has been properly installed.
C60 & CypherGraph User Manual
November 2006
Part # MAN-C60-1.2
Cypher Instruments Ltd
Page 96 of 121
Installation on Windows ’98
CypherGraph Software
1. Quit all open applications.
2. If your computer has auto run enabled, then the software will automatically install. Insert the
CypherGraph Software CD into the CD-ROM drive and the installation will begin. Skip the next
instruction.
3. If your computer has auto run disabled, then insert the CD into the drive and wait for the operating
system to read the disk. Hold the Windows key down and press the R key to open the Run dialog.
Type the drive letter of the CypherGraph software CD followed by ‘:\setup’. Click the OK button.
4. The dialog box - ‘Welcome to the CyperGraph Setup Wizard’ will appear. Click the ‘Next>’ button.
C60 & CypherGraph User Manual
November 2006
Part # MAN-C60-1.2
Cypher Instruments Ltd
Page 97 of 121
5. The ‘License Agreement’ box follows. Read it and if it is satisfactory, click ‘I Agree’.
6. If you already have CypherGraph installed on your PC, then you are prompted to uninstall the
existing version (recommended).
7. If this is a fresh installation, the ‘Choose Install Location’ box will appear. The usual location for the
software is C:\Program Files\CypherGraph\. Click ‘Install’.
C60 & CypherGraph User Manual
November 2006
Part # MAN-C60-1.2
Cypher Instruments Ltd
Page 98 of 121
8. The installer will now copy all the required files to your PC. If a dialog asks you to reset your PC now
click ‘No’ and continue with the install.
9. Once the installer has finished copying the files you can choose to start the CypherGraph application
by clicking finish. If you do not wish to run the application then uncheck the Run CypherGraph check
box and click finish.
10. The C60 can now be connected to the PC via the USB lead. After a short period the Windows will rebuild the device driver data base and then automatically install the device driver.
11. Remove the CD. Keep the CD is a safe place, for future use by you or your colleagues.
C60 & CypherGraph User Manual
November 2006
Part # MAN-C60-1.2
Cypher Instruments Ltd
Page 99 of 121
Device driver update
If the C60 was plugged in before the CypherGraph software was installed then Windows may not have
located the device driver for the instrument. Follow the instructions below to perform a re-install of the
device driver after CypherGraph software has been installed.
1. Insert the CypherGraph Software CD into the CD-ROM drive. If the CypherGraph installer opens then
click ‘Cancel’ and then ‘Yes’ to quit.
2. Plug in the C60.
3. Open the Device Manager by right clicking on the ‘my computer’ icon then left clicking properties.
Then select the device manager tab in the System Propertied dialog box. If windows has failed to
find a device driver for the instrument then this will be represented by yellow question mark in the
device manager.
C60 & CypherGraph User Manual
November 2006
Part # MAN-C60-1.2
Cypher Instruments Ltd
Page 100 of 121
4. Click on the ‘Device’ icon and press the delete key. Click ‘Yes’ to confirm removal of the device.
5. Disconnect and reconnect the C60. Windows will now install the driver automatically. This may take
a short time as Windows re-builds its device driver data base and copies the driver files.
6. The screen shot below shows the device driver has been properly installed.
C60 & CypherGraph User Manual
November 2006
Part # MAN-C60-1.2
Cypher Instruments Ltd
Page 101 of 121
Installation on Windows ME
CypherGraph Software
1. Quit all open applications.
2. If your computer has auto run enabled, then the software will automatically install. Insert the
CypherGraph Software CD into the CD-ROM drive and the installation will begin. Skip the next
instruction.
3. If your computer has auto run disabled, then insert the CD into the drive and wait for the operating
system to read the disk. Hold the Windows key down and press the R key to open the Run dialog.
Type the drive letter of the CypherGraph software CD followed by ‘:\setup’. Click the OK button.
4. The dialog box - ‘Welcome to the CyperGraph Setup Wizard’ will appear. Click the ‘Next>’ button.
C60 & CypherGraph User Manual
November 2006
Part # MAN-C60-1.2
Cypher Instruments Ltd
Page 102 of 121
5. The ‘License Agreement’ box follows. Read it and if it is satisfactory, click ‘I Agree’.
6. If you already have CypherGraph installed on your PC, then you are prompted to uninstall the
existing version (recommended).
7. If this is a fresh installation, the ‘Choose Install Location’ box will appear. The usual location for the
software is C:\Program Files\CypherGraph\. Click ‘Install’.
C60 & CypherGraph User Manual
November 2006
Part # MAN-C60-1.2
Cypher Instruments Ltd
Page 103 of 121
8. The installer will now copy all the required files to your PC. If a dialog asks you to reset your PC now
click ‘No’ and continue with the install.
9. Once the installer has finished copying the files you can choose to start the CypherGraph application
by clicking finish. If you do not wish to run the application then uncheck the Run CypherGraph check
box and click finish.
10. The C60 can now be connected to the PC via the USB lead. After a short period the Windows will rebuild the device driver data base and then automatically install the device driver.
11. Remove the CD. Keep the CD is a safe place, for future use by you or your colleagues.
C60 & CypherGraph User Manual
November 2006
Part # MAN-C60-1.2
Cypher Instruments Ltd
Page 104 of 121
Device driver update
If the C60 was plugged in before the CypherGraph software was installed then Windows may not have
located the device driver for the instrument. Follow the instructions below to perform a manual install of the
device driver after CypherGraph software has been installed.
1. Insert the CypherGraph Software CD into the CD-ROM drive. If the CypherGraph installer opens then
click ‘Cancel’ and then ‘Yes’ to quit.
2. Plug in the C60.
3. Open the Device Manager by right clicking on the ‘my computer’ icon then left clicking properties.
Then select the device manager tab in the System Propertied dialog box. If windows has failed to
find a device driver for the instrument then this will be represented by a yellow question mark in the
device manager.
C60 & CypherGraph User Manual
November 2006
Part # MAN-C60-1.2
Cypher Instruments Ltd
Page 105 of 121
4. Click on the ‘Device’ icon and press the delete key. Click ‘Yes’ to confirm removal of the device.
5. Disconnect and reconnect the C60. Windows will now install the driver from the CD. The screen shot
below shows the device driver has been properly installed.
C60 & CypherGraph User Manual
November 2006
Part # MAN-C60-1.2
Cypher Instruments Ltd
Page 106 of 121
Installation on Windows 2000
CypherGraph Software
1. Quit all open applications.
2. If your computer has auto run enabled, then the software will automatically install. Insert the
CypherGraph Software CD into the CD-ROM drive and the installation will begin. Skip the next
instruction.
3. If your computer has auto run disabled, then insert the CD into the drive and wait for the operating
system to read the disk. Hold the Windows key down and press the R key to open the Run dialog.
Type the drive letter of the CypherGraph software CD followed by ‘:\setup’. Click the OK button.
4. The dialog box - ‘Welcome to the CypherGraph Setup Wizard’ will appear. Click the ‘Next>’ button.
C60 & CypherGraph User Manual
November 2006
Part # MAN-C60-1.2
Cypher Instruments Ltd
Page 107 of 121
5. The ‘License Agreement’ box follows. Read it and if it is satisfactory, click ‘I Agree’.
6. If you already have CypherGraph installed on your PC, then you are prompted to uninstall the
existing version (recommended).
7. If this is a fresh installation, the ‘Choose Install Location’ box will appear. The usual location for the
software is C:\Program Files\CypherGraph\. Click ‘Install’.
C60 & CypherGraph User Manual
November 2006
Part # MAN-C60-1.2
Cypher Instruments Ltd
Page 108 of 121
8. The installer will now copy all the required files to your PC. If a dialog asks you to reset your PC now
click ‘No’ and continue with the install.
9. Once the installer has finished copying the files you can choose to start the CypherGraph application
by clicking finish. If you do not wish to run the application then uncheck the Run CypherGraph check
box and click finish.
C60 & CypherGraph User Manual
November 2006
Part # MAN-C60-1.2
Cypher Instruments Ltd
Page 109 of 121
10. The C60 can now be connected to the PC via the USB lead. After a short period the Windows will
open the found new device wizard. Click ‘Next >’ to continue.
11. Select the ‘Search for a suitable driver for my device (recommended)’ option and click ‘Next >’ to
continue.
C60 & CypherGraph User Manual
November 2006
Part # MAN-C60-1.2
Cypher Instruments Ltd
Page 110 of 121
12. Check the ‘CD-ROM drives’ box and click ‘Next >’ to continue.
13. The Found New Hardware Wizard should now find the driver on the CypherGraph Software CD. Click
‘Next >’ to install the driver.
14. Click ‘Finish’ to complete the driver installation
15. Remove the CD. Keep the CD is a safe place, for future use by you or your colleagues
C60 & CypherGraph User Manual
November 2006
Part # MAN-C60-1.2
Cypher Instruments Ltd
Page 111 of 121
Device driver update
If the C60 was plugged in before the CypherGraph software was installed then Windows may not have
located the device driver for the instrument. Follow the instructions below to perform a manual install of the
device driver after CypherGraph software has been installed.
1. Insert the CypherGraph Software CD into the CD-ROM drive. If the CypherGraph installer opens then
click ‘Cancel’ and then ‘Yes’ to quit.
2. Plug in the C60.
3. Open the Device Manager by right clicking on the ‘my computer’ icon then left clicking properties.
Then select the device manager tab in the System Propertied dialog box. If windows has failed to
find a device driver for the instrument then this will be represented by an exclamation mark in a
yellow in the device manager.
C60 & CypherGraph User Manual
November 2006
Part # MAN-C60-1.2
Cypher Instruments Ltd
Page 112 of 121
4. Click on the ‘C60 Impedance-Amplitude-Phase Analyser’ icon and press the delete key.
5. Disconnect and reconnect the C60. Windows will now install the driver from the CD. The screen shot
below shows the device driver has been properly installed.
C60 & CypherGraph User Manual
November 2006
Part # MAN-C60-1.2
Cypher Instruments Ltd
Page 113 of 121
Installation on Windows XP
CypherGraph Software
1. Quit all open applications.
2. If your computer has auto run enabled, then the software will automatically install. Insert the
CypherGraph Software CD into the CD-ROM drive and the installation will begin. Skip the next
instruction.
3. If your computer has auto run disabled, then insert the CD into the drive and wait for the operating
system to read the disk. Hold the Windows key down and press the R key to open the Run dialog.
Type the drive letter of the CypherGraph software CD followed by ‘:\setup’. Click the OK button.
4. The dialog box - ‘Welcome to the CyperGraph Setup Wizard’ will appear. Click the ‘Next>’ button.
C60 & CypherGraph User Manual
November 2006
Part # MAN-C60-1.2
Cypher Instruments Ltd
Page 114 of 121
5. The ‘License Agreement’ box follows. Read it and if it is satisfactory, click ‘I Agree’.
6. If you already have CypherGraph installed on your PC, then you are prompted to uninstall the
existing version (recommended).
7. If this is a fresh installation, the ‘Choose Install Location’ box will appear. The usual location for the
software is C:\Program Files\CypherGraph\. Click ‘Install’.
C60 & CypherGraph User Manual
November 2006
Part # MAN-C60-1.2
Cypher Instruments Ltd
Page 115 of 121
8. The installer will now copy all the required files to your PC. If a dialog asks you to reset your PC now
click ‘No’ and continue with the install.
9. Once the installer has finished copying the files you can choose to start the CypherGraph application
by clicking finish. If you do not wish to run the application then uncheck the Run CypherGraph check
box and click finish.
10. There is no other action needed, other than to remove the CD. Keep the CD is a safe place, for
future use by you or your colleagues.
C60 & CypherGraph User Manual
November 2006
Part # MAN-C60-1.2
Cypher Instruments Ltd
Page 116 of 121
11. The C60 can now be connected to the PC via the USB lead. After a short period the Found New
Hardware Wizard dialog will appear. Check the radio dial labelled ‘No, not this time’. Click the ‘Next
>’ button.
12. Check the radio dial labelled ‘Install the software automatically (Recommended)’ and click ‘Next >’.
C60 & CypherGraph User Manual
November 2006
Part # MAN-C60-1.2
Cypher Instruments Ltd
Page 117 of 121
13. Click ‘Finish’ to complete the driver installation.
C60 & CypherGraph User Manual
November 2006
Part # MAN-C60-1.2
Cypher Instruments Ltd
Page 118 of 121
Device driver update
If the C60 was plugged in before the CypherGraph software was installed then Windows may not have
located the device driver for the instrument. Follow the instructions below to perform a manual install of the
device driver after CypherGraph software has been installed.
1. Insert the CypherGraph Software CD into the CD-ROM drive. If the CypherGraph installer opens then
click ‘Cancel’ and then ‘Yes’ to quit.
2. Plug in the C60.
3. Open the Device Manager by right clicking on the ‘my computer’ icon then left clicking properties.
Then select the hardware tab in the System Propertied dialog box and click the Device Manager
button. If windows has failed to find a device driver for the instrument then this will be represented
by a yellow question mark in the device manager next to the C60 Impedance-Amplitude-Phase
Analyser device. Right click on the icon and left click ‘Update Driver’.
C60 & CypherGraph User Manual
November 2006
Part # MAN-C60-1.2
Cypher Instruments Ltd
Page 119 of 121
4. The Wizard dialog will appear. Check the radio dial labelled ‘No, not this time’. Click ‘Next >’ to
continue.
5. Select the ‘Install from a list or specific location(Advanced) option. Click ‘Next >’ to continue.
C60 & CypherGraph User Manual
November 2006
Part # MAN-C60-1.2
Cypher Instruments Ltd
Page 120 of 121
6. Check the ‘Search removable medial (floppy, CD-ROM…)’ box. Click ‘Next >’ to continue.
7. Windows will now copy the driver files from the CD-ROM to the hard disk.
C60 & CypherGraph User Manual
November 2006
Part # MAN-C60-1.2
Cypher Instruments Ltd
Page 121 of 121
8. Click ‘Finish’ to complete the driver installation.
9. The screen shot below shows the device driver has been properly installed.
d End of document d
C60 & CypherGraph User Manual
November 2006
Part # MAN-C60-1.2