1
smar - TrendWorX
First in Fieldbus
USER’S MANUAL
TrendWorX
MAY / 06
TrendWorX
VERSION 8
TM
FOUNDATION
P V I E WT WK M E
www.smar.com
Specifications and information are subject to change without notice.
Up-to-date address information is available on our website.
web: www.smar.com/contactus.asp
Table of Contents
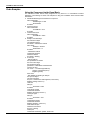
TABLE OF CONTENTS
Chpter 1 - GETTING STARTED .................................................................................................................. 1.1
INTRODUCTION ..........................................................................................................................................................1.1
STARTING TRENDWORX...........................................................................................................................................1.1
STARTING TRENDWORX CONTAINER ....................................................................................................................1.1
USING THE MOUSE AND KEYBOARD ......................................................................................................................1.3
MOUSE FUNCTIONS ..................................................................................................................................................1.3
SHORTCUT KEYS .......................................................................................................................................................1.3
NEW FEATURES IN THE TRENDWORX CONTAINER .............................................................................................1.4
ABOUT THE TRENDWORX CONTAINER ..................................................................................................................1.4
SCREEN FEATURES ..................................................................................................................................................1.5
MENUS.........................................................................................................................................................................1.5
FILE MENU...................................................................................................................................................................1.5
EDIT MENU ..................................................................................................................................................................1.5
VIEW MENU .................................................................................................................................................................1.6
ACTIONS MENU ..........................................................................................................................................................1.7
TOOLS MENU..............................................................................................................................................................1.8
WINDOW MENU ..........................................................................................................................................................1.9
HELP MENU...............................................................................................................................................................1.10
PRINTING...................................................................................................................................................................1.10
PRINT PREVIEW .......................................................................................................................................................1.10
PRINTING SCREEN INFORMATION ........................................................................................................................1.11
CANCEL PRINTING...................................................................................................................................................1.11
STATUS BAR AND TOOLBARS................................................................................................................................1.11
STATUS BAR .............................................................................................................................................................1.12
TOOLBARS ................................................................................................................................................................1.12
CREATING NEW TREND DISPLAYS .......................................................................................................................1.12
TREND ACTIVEX VIEWER TYPES...........................................................................................................................1.13
EDITING TREND WINDOWS ....................................................................................................................................1.13
PROPERTIES WINDOW............................................................................................................................................1.14
DISPLAY PREFERENCES ........................................................................................................................................1.14
GENERAL TAB ..........................................................................................................................................................1.15
WINDOW DIMENSIONS....................................................................................................................................................... 1.15
NEW OBJECTS .................................................................................................................................................................... 1.15
PRINTING OPTIONS............................................................................................................................................................ 1.15
APPLY TO ALL DISPLAYS................................................................................................................................................... 1.16
TILE OBJECTS ON RESIZE................................................................................................................................................. 1.16
DISPLAY COLOR ................................................................................................................................................................. 1.16
RUNTIME TAB ...........................................................................................................................................................1.16
RUNTIME TITLE BAR OPTIONS.......................................................................................................................................... 1.16
RUNTIME FRAME STYLE.................................................................................................................................................... 1.16
RUNTIME START STATE .................................................................................................................................................... 1.17
GRIDS TAB ................................................................................................................................................................1.17
APPLICATION PREFERENCES................................................................................................................................1.17
GENERAL TAB ..........................................................................................................................................................1.18
NEW DISPLAYS ................................................................................................................................................................... 1.18
WINDOW DIMENSIONS...................................................................................................................................................... .1.18
RUNTIME TAB ...........................................................................................................................................................1.19
RUNTIME TITLE BAR OPTIONS.......................................................................................................................................... 1.19
RUNTIME FRAME STYLE.................................................................................................................................................... 1.19
RUNTIME SETTINGS........................................................................................................................................................... 1.20
LOADING TAB ...........................................................................................................................................................1.20
PERSISTENT TRENDING TAB .................................................................................................................................1.21
REPORTING TAB ......................................................................................................................................................1.21
LOGGING TAB...........................................................................................................................................................1.22
ACTIVEX TOOLBAR ..................................................................................................................................................1.22
CUSTOMIZING THE ACTIVEX TOOLBAR ...............................................................................................................1.22
TRENDWORX OLE AUTOMATION...........................................................................................................................1.23
APPLICATION OBJECT (TWX32APP)......................................................................................................................1.23
III
TrendWorX – User’s Manual
PROPERTIES....................................................................................................................................................................... 1.23
METHODS ............................................................................................................................................................................ 1.23
DOCUMENTS OBJECT (TWX32DOCUMENTS) ......................................................................................................1.24
PROPERTIES....................................................................................................................................................................... 1.24
METHODS ............................................................................................................................................................................ 1.24
DOCUMENT ...............................................................................................................................................................1.24
PROPERTIES....................................................................................................................................................................... 1.24
METHODS ............................................................................................................................................................................ 1.24
EVENTS................................................................................................................................................................................ 1.25
OLE AUTOMATION EXAMPLES AND SAMPLES ....................................................................................................1.25
TRENDWORX SECURITY.........................................................................................................................................1.26
IMPORTANT NOTE .............................................................................................................................................................. 1.26
DOWNLOAD TO WINDOWS CE SUPPORT.............................................................................................................1.26
DOWNLOADING PROCESSVIEW CONFIGURATION FILES TO YOUR POCKET PC ..........................................1.27
VCRWORX DATA REPLAY .......................................................................................................................................1.31
Chpter 2 - LOGGER CONFIGURATOR ...................................................................................................... 2.1
INTRODUCTION ..........................................................................................................................................................2.1
ABOUT THE TRENDWORX CONFIGURATOR ..........................................................................................................2.1
STARTING THE TRENDWORX CONFIGURATOR ....................................................................................................2.1
CREATING CONFIGURATION DATABASES .............................................................................................................2.2
CREATING A MICROSOFT ACCESS CONFIGURATION DATABASE .....................................................................2.3
CREATING A MICROSOFT SQL SERVER CONFIGURATION DATABASE .............................................................2.5
ADDING A CONFIGURATION DATABASE TO AN EXISTING SQL SERVER DATABASE ......................................2.7
TOOLBARS ................................................................................................................................................................2.12
STANDARD TOOLBAR ........................................................................................................................................................ 2.12
DATA MANIPULATION TOOLBAR....................................................................................................................................... 2.13
MENUS.......................................................................................................................................................................2.13
FILE MENU........................................................................................................................................................................... 2.13
EDIT MENU .......................................................................................................................................................................... 2.19
VIEW MENU ......................................................................................................................................................................... 2.20
GO MENU............................................................................................................................................................................. 2.21
ACTION MENU ..................................................................................................................................................................... 2.22
TOOLS MENU ...................................................................................................................................................................... 2.22
HELP MENU ......................................................................................................................................................................... 2.24
TRENDWORX CONFIGURATOR SETUP.................................................................................................................2.25
CREATING A NEW CONFIGURATION.....................................................................................................................2.27
CONFIGURATION PROPERTIES .............................................................................................................................2.27
CREATING A NEW DATABASE GROUP..................................................................................................................2.30
CONFIGURING DATABASE GROUP PROPERTIES ...............................................................................................2.31
CREATING A NEW DATA SOURCE .........................................................................................................................2.32
SELECTING A LOGGING DATABASE......................................................................................................................2.34
CREATING A NEW LOGGING GROUP ....................................................................................................................2.36
CONFIGURING LOGGING GROUP PROPERTIES .................................................................................................2.36
DATA COLLECTION TAB ..........................................................................................................................................2.37
LOGGING TAB...........................................................................................................................................................2.39
TABLE MANAGEMENT TAB .....................................................................................................................................2.40
CONTROL BOARD FOR GROUPS...........................................................................................................................2.41
CREATING A NEW TAG............................................................................................................................................2.42
CONFIGURING TAG PROPERTIES .........................................................................................................................2.43
TROUBLESHOOTING DATA LOGGING...................................................................................................................2.48
Chpter 3 - SQL DATA LOGGER ................................................................................................................. 3.1
INTRODUCTION ..........................................................................................................................................................3.1
CONFIGURATION .......................................................................................................................................................3.3
FEATURES OF THE TRENDWORX SQL DATA LOGGER ........................................................................................3.3
UPGRADING TO VERSIONS 6.00 AND 6.10 .............................................................................................................3.5
UPGRADING FROM VERSION 5.20 TO VERSION 6.00: STEP 1 .............................................................................3.5
UPGRADING FROM VERSION 5.20 TO VERSION 6.00: STEP 2 .............................................................................3.5
UPGRADING FROM VERSION 5.20 TO VERSION 6.00: STEP 3 .............................................................................3.5
IV
Table of Contents
UPGRADING FROM VERSION 5.20 TO VERSION 6.00: STEP 4 .............................................................................3.7
UPGRADING FROM VERSION 5.20 TO VERSION 6.00: STEP 5 .............................................................................3.7
CHOOSING A DATABASE ..........................................................................................................................................3.8
DATA-LOGGING LOAD ...............................................................................................................................................3.9
DATA-STORAGE REQUIREMENTS ...........................................................................................................................3.9
LOAD OF CLIENT CONNECTIONS ..........................................................................................................................3.10
DATABASE BACKUP AND MAINTENANCE.............................................................................................................3.11
SETTING UP DATA LOGGING..................................................................................................................................3.12
INTRODUCTION TO DATA LOGGING .....................................................................................................................3.12
CONFIGURING MICROSOFT ACCESS DATABASES.............................................................................................3.14
CONFIGURING MICROSOFT SQL SERVER AND MSDE DATABASES ................................................................3.16
CONFIGURING ORACLE DATABASES ...................................................................................................................3.20
PERFORMANCE OPTIMIZATION AND EVALUATION ............................................................................................3.22
DATA-COMPRESSION TOOLS.................................................................................................................................3.22
DEADBAND................................................................................................................................................................3.22
DATA-LOGGING FILTERS ........................................................................................................................................3.23
DATABASE ACCESS SCHEDULING........................................................................................................................3.24
DATA LOGGING LOAD DISTRIBUTION...................................................................................................................3.25
MULTITHREADED ARCHITECTURE........................................................................................................................3.25
MANAGING THE DATABASE TABLE ORGANIZATION ..........................................................................................3.25
OTHER CONSIDERATIONS......................................................................................................................................3.26
MONITORING PERFORMANCE ...............................................................................................................................3.27
SUMMARY OF OPTIMIZATION FOR MICROSOFT SQL AND MSDE.....................................................................3.28
TROUBLESHOOTING ...............................................................................................................................................3.36
DATABASE DRIVER ERRORS .................................................................................................................................3.36
INSPECTING DATA-LOGGING ACTIVITY................................................................................................................3.36
GENEVENT REGISTRAR AND NT EVENT LOGGER INTEGRATION ....................................................................3.37
SECURITY INTEGRATION........................................................................................................................................3.39
DATABASE SCHEMA ................................................................................................................................................3.41
TAGS TABLE .............................................................................................................................................................3.43
INFO TABLE...............................................................................................................................................................3.43
NOTES TABLE...........................................................................................................................................................3.43
NUMBERED TABLES ................................................................................................................................................3.44
GLOBAL TABLE.........................................................................................................................................................3.44
TRENDWORX SQL DATA LOGGER OLE AUTOMATION INTERFACE..................................................................3.47
OPC HDA COM INTERFACE ....................................................................................................................................3.51
INTERFACES .............................................................................................................................................................3.51
METHODS..................................................................................................................................................................3.52
MSDE SUPPORT.......................................................................................................................................................3.53
RUNNING TRENDWORX SQL DATA LOGGER AS A NT SERVICE.......................................................................3.53
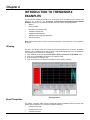
Chpter 4 - INTRODUCTION TO TRENDWORX EXAMPLES ..................................................................... 4.1
ALIASING .....................................................................................................................................................................4.1
EXCEL TEMPLATES ...................................................................................................................................................4.1
REAL-TIME TREND CONFIGURATION......................................................................................................................4.2
TRENDWORX BACKGROUNDS.................................................................................................................................4.2
TRENDWORX DATA LOGGING AND REPORTING ..................................................................................................4.2
TRENDWORX OLE DB PROVIDER DEMO ........................................................................................................................... 4.3
REPORTING TOOLS EXAMPLES ......................................................................................................................................... 4.4
TRENDWORX VBA EXAMPLES .................................................................................................................................4.5
TRENDCUSTOMPEN1.T32.................................................................................................................................................... 4.5
TRENDCUSTOMPEN2.T32.................................................................................................................................................... 4.5
TRENDPRINT.T32.................................................................................................................................................................. 4.6
TWXSCREENNAVIGATION.T32 ............................................................................................................................................ 4.6
TRENDVBADEMO.T32........................................................................................................................................................... 4.7
PERSISTENTTRENDVBADEMO.T32 .................................................................................................................................... 4.7
VBSCRIPT EXAMPLES ...............................................................................................................................................4.8
Chpter 5 - PERSISTENT TRENDING ......................................................................................................... 5.1
INTRODUCTION TO PERSISTENT TRENDING ........................................................................................................5.1
V
TrendWorX – User’s Manual
NEW FEATURES IN TRENDWORX PERSISTENT TRENDING ................................................................................5.1
PERSISTENT TREND OLE AUTOMATION OBJECT DESIGN ..................................................................................5.2
OLE AUTOMATION PROPERTIES .............................................................................................................................5.2
OLE AUTOMATION METHODS ..................................................................................................................................5.3
CONFIGURING THE PERSISTENT TRENDING OLE AUTOMATION SERVER.......................................................5.9
TOOLBARS ..................................................................................................................................................................5.9
MENUS.......................................................................................................................................................................5.10
FILE MENU........................................................................................................................................................................... 5.10
EDIT MENU .......................................................................................................................................................................... 5.10
VIEW MENU ......................................................................................................................................................................... 5.11
ACTIONS MENU................................................................................................................................................................... 5.12
TOOLS MENU ...................................................................................................................................................................... 5.12
HELP MENU ......................................................................................................................................................................... 5.13
GROUPS ....................................................................................................................................................................5.13
ADDING AND CONFIGURING GROUPS..................................................................................................................5.13
GROUP CONFIGURATION TAB ...............................................................................................................................5.13
LOGGING CONFIGURATION TAB ...........................................................................................................................5.14
GROUP STATUS .......................................................................................................................................................5.14
TAGS ..........................................................................................................................................................................5.15
ADDING PERSISTENT TAGS ...................................................................................................................................5.15
DELETING PERSISTENT TAGS ...............................................................................................................................5.15
COPYING PERSISTENT TAGS ................................................................................................................................5.16
SEARCH AND REPLACE ..........................................................................................................................................5.16
GROUP SEARCH ......................................................................................................................................................5.16
GLOBAL SEARCH .....................................................................................................................................................5.17
USING THE PERSISTENT TRENDING OLE AUTOMATION SERVER ...................................................................5.17
PERSISTENT TRENDING OLE AUTOMATION EXAMPLES ...................................................................................5.19
SECURITY..................................................................................................................................................................5.19
Chpter 6 - REPORTING .............................................................................................................................. 6.1
FEATURES IN TRENDWORX REPORTING...............................................................................................................6.1
INTRODUCTION ..........................................................................................................................................................6.2
STARTING TRENDWORX REPORTING ....................................................................................................................6.2
TRENDWORX SQL TOOL ACTIVEX CONTROL........................................................................................................6.3
TRENDWORX SQL TOOL ACTIVEX CONTROL: PROPERTIES ............................................................................6.10
TRENDWORX SQL TOOL ACTIVEX CONTROL: METHODS..................................................................................6.11
TRENDWORX SQL TOOL ACTIVEX CONTROL: EVENTS .....................................................................................6.12
TRENDWORX SQL REPORTING .............................................................................................................................6.12
TOOLBAR...................................................................................................................................................................6.12
MENUS.......................................................................................................................................................................6.13
FILE MENU........................................................................................................................................................................... 6.13
EDIT MENU .......................................................................................................................................................................... 6.14
VIEW MENU ......................................................................................................................................................................... 6.14
ACTIONS MENU................................................................................................................................................................... 6.15
TOOLS MENU ...................................................................................................................................................................... 6.15
HELP MENU ......................................................................................................................................................................... 6.15
REPORT CONFIGURATION .....................................................................................................................................6.15
GENERAL............................................................................................................................................................................. 6.16
TAGS .................................................................................................................................................................................... 6.17
REPORT ............................................................................................................................................................................... 6.19
TARGET ............................................................................................................................................................................... 6.22
SCHEDULE .......................................................................................................................................................................... 6.25
RANGE ................................................................................................................................................................................. 6.27
EDITING A REPORT..................................................................................................................................................6.29
RUNTIME MODE .......................................................................................................................................................6.30
TRENDWORX REPORTING SECURITY ..................................................................................................................6.31
GENEVENT REGISTRAR INTEGRATION ................................................................................................................6.32
OLE AUTOMATION ...................................................................................................................................................6.32
OLE AUTOMATION PROPERTIES ...................................................................................................................................... 6.32
OLE AUTOMATION METHODS ........................................................................................................................................... 6.33
TRENDWORX OLE DB PROVIDER..........................................................................................................................6.37
VI
Table of Contents
USING THE TRENDWORX OLE DB PROVIDER .....................................................................................................6.40
CONNECTING TO TRENDWORX OLE DB PROVIDER ..........................................................................................6.40
RETRIEVING HISTORICAL DATA ............................................................................................................................6.44
RETURNED RECORDSET STRUCTURE.................................................................................................................6.46
EXAMPLE APPLICATION USING TRENDWORX OLE DB PROVIDER ..................................................................6.47
Chpter 7 - VIEWER ACTIVEX ..................................................................................................................... 7.1
INTRODUCTION ..........................................................................................................................................................7.1
TRENDWORX VIEWER ACTIVEX FEATURES ..........................................................................................................7.1
NEW FEATURES .........................................................................................................................................................7.2
USING THE TRENDWORX VIEWER ACTIVEX..........................................................................................................7.3
CONNECTIONS ...........................................................................................................................................................7.3
RUNTIME MODE OPERATIONS.................................................................................................................................7.4
VCRWORX DATA REPLAY .........................................................................................................................................7.4
FUNCTIONS NOT SUPPORTED IN RUNTIME MODE ..............................................................................................7.5
SECURITY....................................................................................................................................................................7.5
ASYNCHRONOUS DOWNLOADING FEATURES......................................................................................................7.6
LANGUAGE-ALIASING SUPPORT .............................................................................................................................7.6
SAMPLE LANGUAGE CONFIGURATION.............................................................................................................................. 7.7
GLOBAL ALIASING SUPPORT .................................................................................................................................7.10
INTERNAL ARCHITECTURE OF ACTIVEX ..............................................................................................................7.11
TRENDWORX OBJECT CAPABILITY.......................................................................................................................7.11
USING VISUAL BASIC TO VIEW TITLE OBJECTS..................................................................................................7.12
USING VISUAL BASIC TO VIEW GRID OBJECTS...................................................................................................7.12
USING VISUAL BASIC TO VIEW RANGES OBJECTS ............................................................................................7.12
USING VISUAL BASIC TO VIEW TIME SETTINGS OBJECTS................................................................................7.12
USING VISUAL BASIC TO VIEW DETAILS OBJECTS ............................................................................................7.12
USING VISUAL BASIC TO VIEW PEN OBJECTS ....................................................................................................7.13
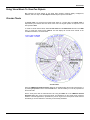
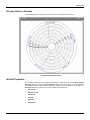
CIRCULAR CHARTS .................................................................................................................................................7.13
ALTERING THE APPEARANCE OF A CIRCULAR CHART .....................................................................................7.14
CIRCULAR CHARTS IN RUNTIME ...........................................................................................................................7.15
ACTIVEX PROPERTIES ............................................................................................................................................7.15
GENERAL TAB ..................................................................................................................................................................... 7.16
APPEARANCE TAB.............................................................................................................................................................. 7.17
RANGES TAB....................................................................................................................................................................... 7.24
PENS TAB ............................................................................................................................................................................ 7.25
RATES TAB .......................................................................................................................................................................... 7.27
SETTINGS TAB .................................................................................................................................................................... 7.27
OPC TAGS .................................................................................................................................................................7.28
TAGS MENU ..............................................................................................................................................................7.29
EXPRESSION EDITOR ........................................................................................................................................................ 7.30
EDITING THE TREND PEN.................................................................................................................................................. 7.30
SIMULATION VARIABLES ................................................................................................................................................... 7.31
PERSISTENT TREND .......................................................................................................................................................... 7.31
HISTORY TAG...................................................................................................................................................................... 7.32
EDITING PENS ..........................................................................................................................................................7.33
GENERAL TAB ..................................................................................................................................................................... 7.33
ALARMS TAB ....................................................................................................................................................................... 7.35
RANGES TAB....................................................................................................................................................................... 7.36
RANGES TAB FUNCTIONS ................................................................................................................................................. 7.37
TOTALIZER TAB .................................................................................................................................................................. 7.37
TREND VIEWER TOOLBAR......................................................................................................................................7.38
EDIT PENS ........................................................................................................................................................................... 7.39
EDIT TREND ........................................................................................................................................................................ 7.40
EDIT PERIOD ....................................................................................................................................................................... 7.41
FREEZE MODE .................................................................................................................................................................... 7.42
STATISTICS ......................................................................................................................................................................... 7.42
ZOOM TREND ...................................................................................................................................................................... 7.42
CURSOR BACK/CURSOR FORWARD................................................................................................................................ 7.43
PAGE BACK ......................................................................................................................................................................... 7.43
PAGE FORWARD................................................................................................................................................................. 7.43
SET RIGHT TIME ................................................................................................................................................................. 7.43
VII
TrendWorX – User’s Manual
SHOW COMMENTS ............................................................................................................................................................. 7.44
PRINT TREND ...................................................................................................................................................................... 7.45
SAVE TREND ....................................................................................................................................................................... 7.45
DOCK TOOLBAR.................................................................................................................................................................. 7.45
HISTORICAL REPLAY...............................................................................................................................................7.46
MIXED REPLAY.................................................................................................................................................................... 7.47
HISTORY ONLY REPLAY .................................................................................................................................................... 7.47
PEN FILTERS ....................................................................................................................................................................... 7.49
IDEAL PENS ..............................................................................................................................................................7.50
EDITING PENS DURING RUNTIME MODE..............................................................................................................7.56
PEN OPTIONS DURING RUNTIME MODE ......................................................................................................................... 7.56
FORMATTING PENS DURING RUNTIME MODE................................................................................................................ 7.57
STACKING TREND PLOTS DURING RUNTIME MODE...................................................................................................... 7.58
SWITCHING PEN RANGES IN STACKED PLOTS .............................................................................................................. 7.59
COMBINING PENS IN A STACKED PLOT .......................................................................................................................... 7.59
TIME SHIFTING PENS DURING RUNTIME MODE ............................................................................................................. 7.60
GRAPHICAL TIME SHIFTING .............................................................................................................................................. 7.61
OLE AUTOMATION ...................................................................................................................................................7.62
INTERFACES ....................................................................................................................................................................... 7.62
PROPERTIES AND METHODS FOR THE TRENDWORX VIEWER ACTIVEX .......................................................7.63
VIEWER: PROPERTIES....................................................................................................................................................... 7.63
VIEWER: METHODS ............................................................................................................................................................ 7.64
PROJECTWORX SUPPORT ................................................................................................................................................ 7.68
EVENTS FIRED .........................................................................................................................................................7.69
PROPERTIES AND METHODS FOR SUPPORTING OBJECTS .............................................................................7.70
TITLE OBJECTS ........................................................................................................................................................7.70
TITLE OBJECTS: PROPERTIES.......................................................................................................................................... 7.70
TITLE OBJECTS: METHODS ............................................................................................................................................... 7.70
TIME SETTINGS OBJECTS ......................................................................................................................................7.70
TIME SETTINGS OBJECTS: PROPERTIES ........................................................................................................................ 7.70
TIME SETTINGS OBJECTS: METHODS ............................................................................................................................. 7.71
RANGES OBJECTS...................................................................................................................................................7.71
RANGES OBJECTS: PROPERTIES .................................................................................................................................... 7.71
RANGES OBJECTS: METHODS.......................................................................................................................................... 7.72
PEN OBJECTS...........................................................................................................................................................7.72
PEN OBJECTS: PROPERTIES ............................................................................................................................................ 7.72
PEN OBJECTS: METHODS ................................................................................................................................................. 7.74
DETAILS OBJECTS ...................................................................................................................................................7.74
DETAILS OBJECTS: PROPERTIES..................................................................................................................................... 7.74
DETAILS OBJECTS: METHODS.......................................................................................................................................... 7.75
GRID OBJECTS .........................................................................................................................................................7.75
GRID OBJECTS: PROPERTIES........................................................................................................................................... 7.75
GRID OBJECTS: METHODS................................................................................................................................................ 7.75
CODE SAMPLES .......................................................................................................................................................7.76
USING THE COMPONENT INSIDE VISUAL BASIC ............................................................................................................ 7.76
VBA EXAMPLES................................................................................................................................................................... 7.77
Chpter 8 - INTRODUCTION TO DATABASE UPSIZING ........................................................................... 8.1
AUTO-STARTING THE SQL SERVICE.......................................................................................................................8.1
USING THE TRENDWORX DATABASE UPSIZE UTILITY
VIII
8.1
Chapter 1
Getting Started
Introduction
TM
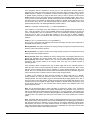
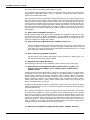
TrendWorX 32 is a powerful collection of real-time trending, historical data logging, reporting, and
analysis tools that seamlessly integrates with enterprise-wide information systems. Based on the
OPC Historical Data Access specification for creating Plug and Play historical data servers and
clients, TrendWorX offers an open solution to applications requiring scalable and distributed realtime performance.
The powerful Microsoft based ADO/OLEDB data-logging provider is at the core of TrendWorX. OPC
HDA provides the standard COM and OLE interface for Smar Trend ActiveX Viewer Control to
display real-time and historical data, separately or simultaneously.
Several trend display types are supported, including time plots, XY plots, logarithmic plots, bar plots,
the popular strip chart recorder, and even circular charts! Acquire thousands of data points and
organize them into groups for very fast and efficient replay of historical and real-time information.
You can use the built in Visual Basic Application to create reports, calculations, and data analysis.
TrendWorX integrates with Microsoft Access, Microsoft SQL 7.0, Microsoft SQL 2000, and Oracle
using ADO and OLEDB database technologies. In addition, TrendWorX supports MSDE 7.0 and
MSDE 2000.
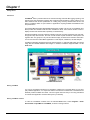
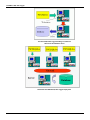
TrendWorX Architecture
Starting TrendWorX
You can use TrendWorX Container as a stand-alone software tool connected directly to your thirdparty software application, or in conjunction with the ProcessView Control Series or ProcessView for
Windows products available from Smar. This user's guide assumes that you are using TrendWorX
as a stand-alone application accessed directly from your desktop.
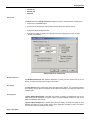
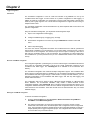
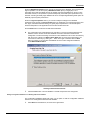
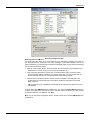
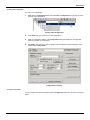
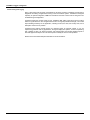
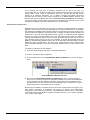
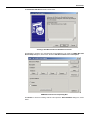
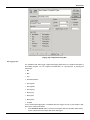
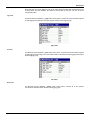
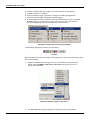
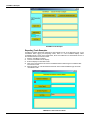
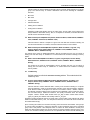
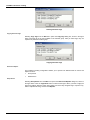
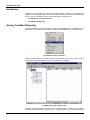
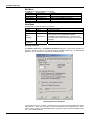
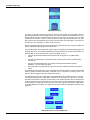
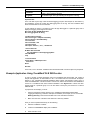
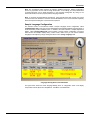
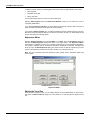
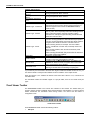
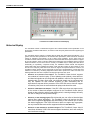
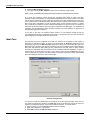
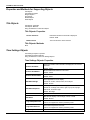
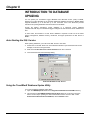
Starting TrendWorX Container
To start the TrendWorX Container from the Windows Start menu, select Programs > Smar
ProcessView > ProjectWorX > TrendWorX, as shown in the figure below.
1.1
TrendeWorX Container
Starting the TrendWorX Container
If you do not install an Smar Software License, you will only be able to run TrendWorX Container in
a two hour Demo mode. If you have a software license and do not wish to run in Demo mode, make
sure that the license is properly installed.
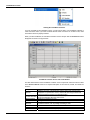
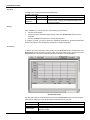
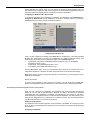
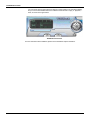
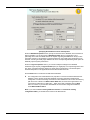
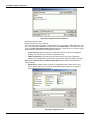
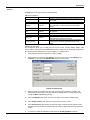
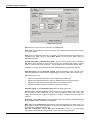
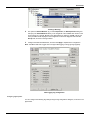
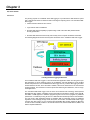
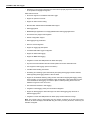
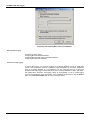
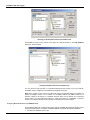
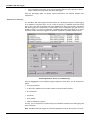
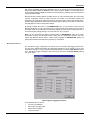
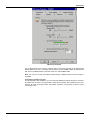
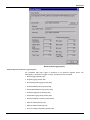
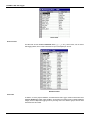
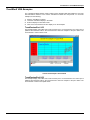
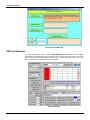
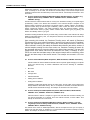
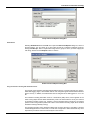
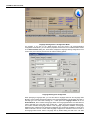
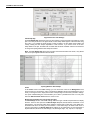
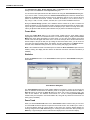
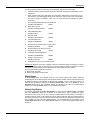
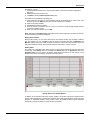
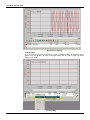
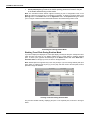
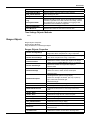
When you start TrendWorX, the TrendWorX Container screen will open and a Trend Viewer window
will appear as shown in the figure below.
TrendWorX Container Screen and Trend Window
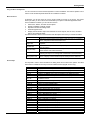
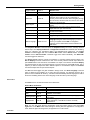
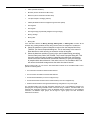
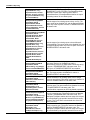
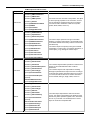
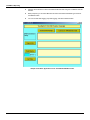
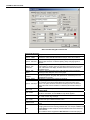
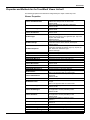
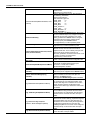
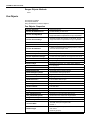
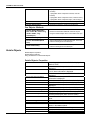
The table below lists the basic TrendWorX Container screen components and their functions. Refer
to the Screen Features section for a complete description of the menu bar, toolbar, and status bar
functions.
Component
Title bar
Control-menu box
Minimize button
Maximize button
Menu bar
Toolbar
Work area
Status bar
1.2
Function
Displays the name of the application and the name of the current screen
displayed. To reposition the screen, click the title bar using the left mouse
button and drag the screen to the desired location.
Displays the Windows Control menu. Refer to your Windows documentation
for more information about the control menu.
Reduces the window to an icon.
Enlarges the active application window to fill the entire screen.
Contains the various menus through which you can access TrendWorX
Container features, such as printing and saving to a file.
Contains toolbar buttons for certain useful menu items.
Displays the various TrendWorX Container screens as you select them.
Displays context-sensitive help, display mode, and the current time and date.
Getting Started
Using the Mouse and Keyboard
You can use both the mouse and the keyboard to control TrendWorX. This section explains how to
use the mouse and lists keyboard shortcuts for TrendWorX Container.
Mouse Functions
In Windows, you use the mouse to move a pointer (usually an arrow) on the screen. The pointer
shows you where you are on the screen and enables you to point to and select application items.
In the TrendWorX Container, you can use the mouse to:
•
Select icons, buttons, and other screen objects.
•
Resize TrendWorX Container screens.
•
Reposition windows and dialog boxes.
•
Scroll through list boxes.
•
Display context-sensitive help in the status bar for screen objects, such as icons, command
buttons, and parameter fields.
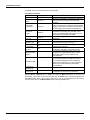
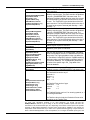
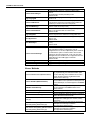
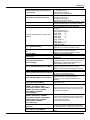
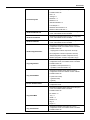
The table below lists various mouse functions and descriptions with which you need to be familiar.
Function
Left-click
Right-click
Double-click
Drag-and-drop
Select
Move pointer over
Description
Position the mouse pointer over an object, such as an icon or a command
button, and press the left mouse button once.
Inside a Trend window, press the right mouse button once to view ActiveX
properties.
Position the mouse pointer over an object, and press the left button twice in
quick succession.
Click an object, and with the button still depressed, move the object to the
desired location and release the button.
Click an object once with the left mouse button, highlighting the object
(enclosing the object in a rectangle with a dotted rule or in reverse color).
Place the mouse pointer on top of an object, such as an icon or a command
button, to display context-sensitive help for that object in the status bar.
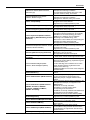
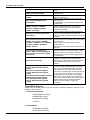
Shortcut Keys
The keyboard is used to enter information into dialog boxes and to select menu options. The table
below lists the available shortcut keys and their related functions (English version only).
Key
ALT+F
ALT+E
ALT+V
ALT+A
ALT+SHIFT+T
ALT+W
ALT+H
CTRL+N
CTRL+O
CTRL+S
CTRL+P
CTRL+X
CTRL+C
CTRL+V
CTRL+1
CTRL+2
CTRL+3
CTRL+4
CTRL+5
CTRL+6
DEL
F12
F4
F3
F2
Function
Displays the File menu options available for the displayed screen
Displays the Edit menu options available for the displayed screen
Displays the View menu options available for the displayed screen
Displays the Actions menu options available for the displayed screen
Displays the Tools menu options available for the displayed screen
Displays the Window menu, which contains a list of available TrendWorX
Container screens
Displays the available Help menu options
Opens a new Trend window
Opens an existing Trend window
Saves the active Trend window
Prints the current screen
Cuts a selected item from the display
Copies a selected item from the display
Pastes a selected item from the display
Adds a Time Plot to the display
Adds an XY Plot to the display
Adds a Bar Plot to the display
Adds a Log Plot to the display
Adds a Strip Chart to the display
Adds a Circular Chart to the display
Deletes an object from the display
Inserts a new object in the display
Displays the properties of the active Trend window
Shows the display preferences for the active Trend window
Displays the application preferences
1.3
TrendeWorX Container
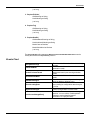
CTRL+T
CTRL+SHIFT+T
CTRL+SHIFT+Y
CTRL+B
CTRL+F
CTRL+G
CTRL+H
CTRL+SHIFT+
G
CTRL+ALT+U
CTRL+A
CTRL+U
CTRL+E
CTRL+R
CTRL+M
ALT+F8
ALT+F11
CTRL+W
SHIFT+L
CTRL+K
CTRL+Q
F6
F7
F8
F1
Toggles all toolbars
Displays the Main toolbar
Displays the ActiveX toolbar
Displays the status bar
Sizes an ActiveX object to the display
Tiles all ActiveX objects in the display
Cascades all ActiveX objects in the display
Shows grids
Displays language selections
Animates the active Trend window in the display
Activates runtime mode
Activates persistent trend mode
Activates reporting mode
Activates logging mode
Starts the Macros dialog
Starts the Visual Basic editor
Starts TrendWorX Logger Configurator
Connects to TrendWorX SQL Data Logger
Launches TrendWorX Persistent Trending
Launches TrendWorX History Reporting
Launches security login in runtime mode
Starts the Security Configurator
Sets the ProcessView working directory
Opens the Help topics file
New Features in the TrendWorX Container
TrendWorX includes many new features that not only add functionality to the product but also make
it easier to use. For a list of the new features for each application within TrendWorX, see the
documentation for that application.
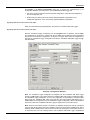
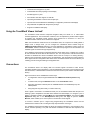
About the TrendWorX Container
The TrendWorX Container is a fully VBA-enabled application, which allows for a high degree of
customization and functionality. A container is an application that supports embedding of ActiveX
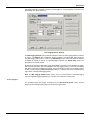
objects, which are available from the Edit menu and the ActiveX toolbar.
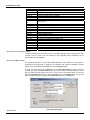
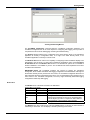
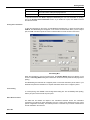
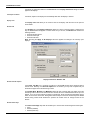
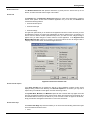
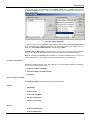
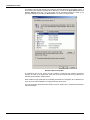
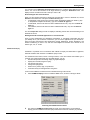
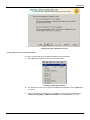
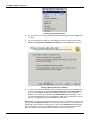
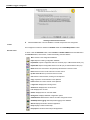
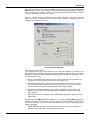
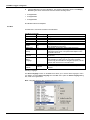
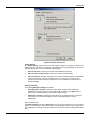
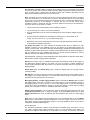
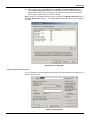
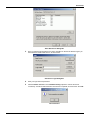
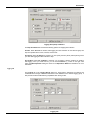
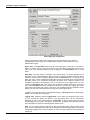
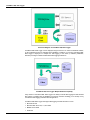
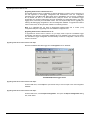
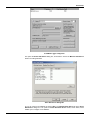
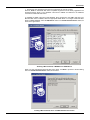
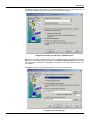
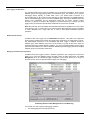
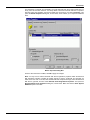
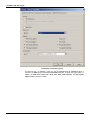
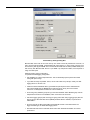
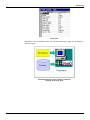
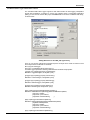
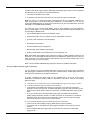
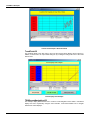
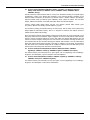
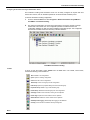
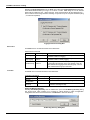
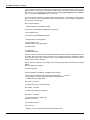
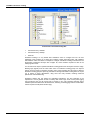
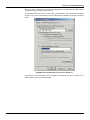
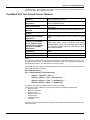
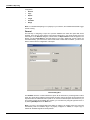
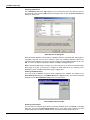
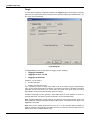
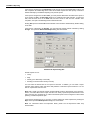
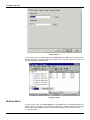
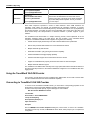
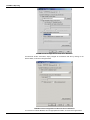
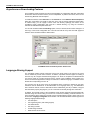
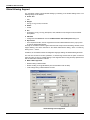
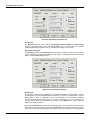
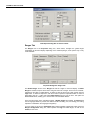
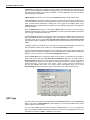
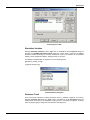
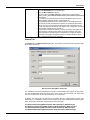
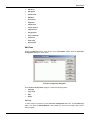
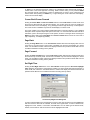
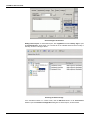
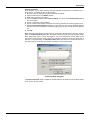
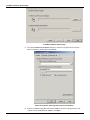
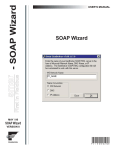
To insert an ActiveX object from the Edit menu, choose Insert New Object, or press the shortcut
key F12. This opens the Insert Object dialog box, which is shown in the figure below. You can
select an existing ActiveX object from the list, or you can create a new ActiveX object. You can also
open the Insert Object dialog box by clicking the OLE button on the ActiveX toolbar. You can also
insert an ActiveX object by choosing from the Add Trend submenu in the Edit menu.
Insert Object Dialog Box
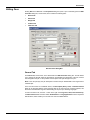
Screen Features
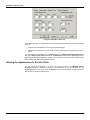
1.4
Getting Started
Menu Bar
Printing
Status Bar and Toolbars
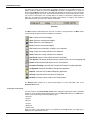
Menus
This section explains the various features available from the menu bar, toolbar, and status bar that
allow you to manage your database records and use TrendWorX easily and efficiently.
The menus in the TrendWorX Container enable you to change the default settings for many
elements of the container. You can also use the menus to add new trends and open different
elements of the TrendWorX application.
•
File menu
•
Edit menu
•
View menu
•
Actions menu
•
Tools menu
•
Window menu
•
Help menu
Note: The File menu functions vary according to the screen that is displayed. (This is documented
where appropriate.)
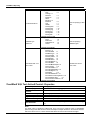
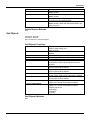
File Menu
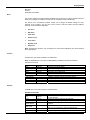
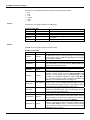
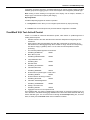
The File menu commands are listed in the table below.
Note: If a Trend window is not open, the Close, Save, and Print commands are disabled.
File Menu Commands
Command
New
Open
Close
Save
Save As
Print
Print Preview
Print Setup
Recent File
Exit
Shortcut Keys
CTRL+N
CTRL+O
CTRL+S
CTRL+P
Function
Creates a new trend display.
Opens an existing trend display.
Closes the current trend display.
Saves the current display file.
Saves current display file with a new name or file extension.
Prints the current trend display.
Displays a preview of the screen before printing.
Configures printer settings.
Lists the last four files opened in TrendWorX.
Closes the application.
Edit Menu
The Edit menu commands are listed in the table below.
Edit Menu Commands
Command
Shortcut Keys
Cut
CTRL+X
Copy
Paste
CTRL+C
CTRL+V
Paste Special
Add Trend
Time Plot
XY Plot
CTRL+1
CTRL+2
Function
Cuts the selected object from the current view and places it
on the clipboard.
Copies the selected object to the clipboard.
Pastes the last object placed on the clipboard.
Pastes the last object placed on the clipboard (with special
options).
Provides a selection of supported Trend ActiveX Viewer styles
that you can insert directly into the Trend window.
Adds a time plot to the display.
Adds an XY plot to the display.
1.5
TrendeWorX Container
Bar Plot
Log Plot
Strip Chart
Circular Chart
Delete Object
Insert New
Object
Links
Properties
CTRL+3
CTRL+4
CTRL+5
CTRL+6
DEL
F12
Adds a bar plot to the display.
Adds a log plot to the display.
Adds a strip chart to the display.
Adds a circular chart to the display.
Deletes the selected object from the Trend window.
Opens the Insert Object dialog box, which allows you to
embed an ActiveX control in the Trend window.
Edits linked objects.
Opens the ActiveX Properties dialog box.
The Cut, Copy, Delete Object, and Properties commands affect the currently selected ActiveX
object in the Trend window. The Add Trend submenu provides a selection of supported Trend
ActiveX Viewer styles that you can insert directly into the Trend window. The Paste and Paste
Special commands paste ActiveX objects into the Trend window. The Properties command opens
the TWXView32 ActiveX Properties dialog box. The Properties dialog box is described in detail in
the TrendWorX Viewer section.
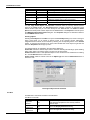
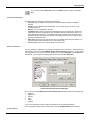
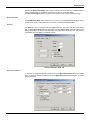
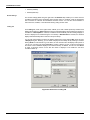
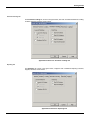
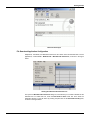
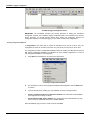
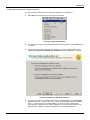
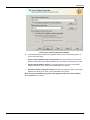
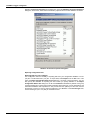
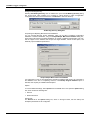
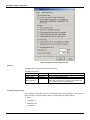
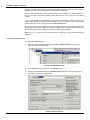
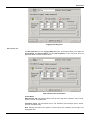
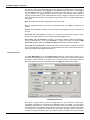
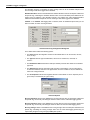
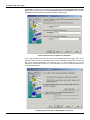
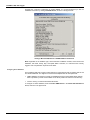
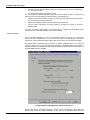
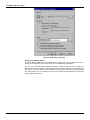
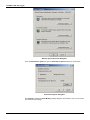
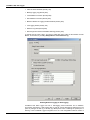
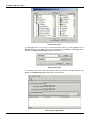
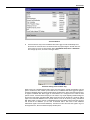
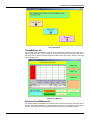
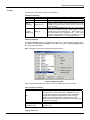
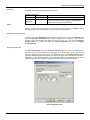
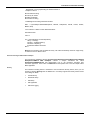
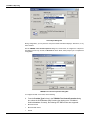
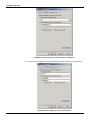
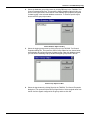
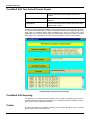
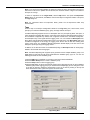
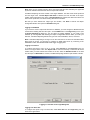
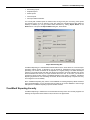
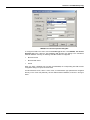
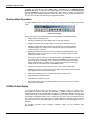
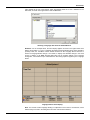
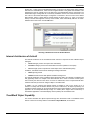
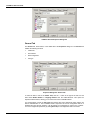
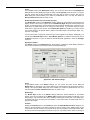
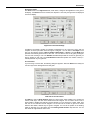
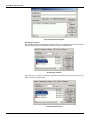
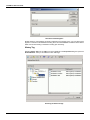
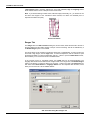
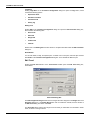
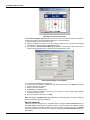
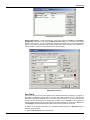
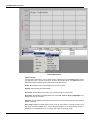
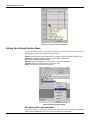
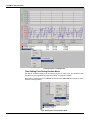
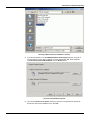
Inserting Objects
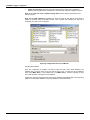
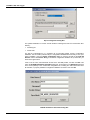
Selecting Insert Object from the Edit menu opens the Insert Object dialog box, shown in the figure
below, which allows you to embed an ActiveX control in the container window. Alternatively,
integrated ActiveX Controls can be inserted by selecting the corresponding button on the ActiveX
toolbar. To configure the properties for an object, either double-click on that object or right-click and
select the Properties from the pop-up menu.
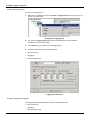
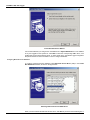
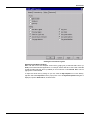
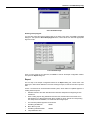
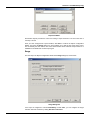
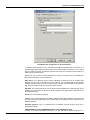
The following options are available in the Insert Object dialog box:
Create New: Inserts the selected object into the container. Selecting this tab brings up the following
dialog, which offers a list of object types to choose from as shown below:
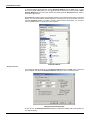
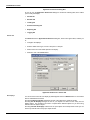
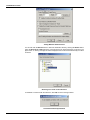
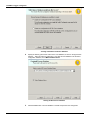
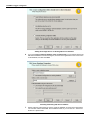
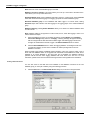
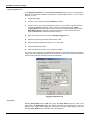
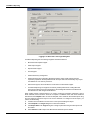
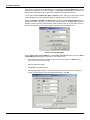
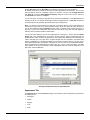
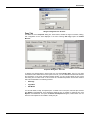
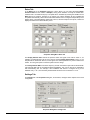
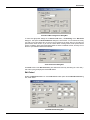
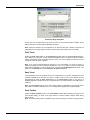
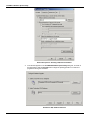
Create From File: Inserts a user-specified object into the container that is created from an existing
file. Click the Browse button to select a file.
Create Control: Adds an ActiveX control to the Object Type list. Click the Add Control button to
browse for a file.
Inserting an Object Into the Container
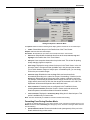
View Menu
The View menu commands are listed in the table below.
View Menu Commands
Command
Shortcut Keys
Function
Opens the Properties window, which shows alphabetical
Properties
F4
and categorical properties for the currently selected
Window
ActiveX object.
Display
F3
Opens the Display Preferences dialog.
Preferences
Application
F2
Opens the Application Preferences dialog.
Preferences
1.6
Getting Started
Toggle Toolbars
CTRL+T
Main Toolbar
ActiveX Toolbar
CTRL+SHIFT+T
CTRL+SHIFT+Y
Status Bar
CTRL+B
Object Layout
Size to Display
CTRL+F
Tile to Display
CTRL+G
Cascade
CTRL+H
Grid
CTRL+SHIFT+G
Select Language
CTRL+ALT+U
Switches between the TrendWorX Main toolbar and the
ActiveX toolbar.
Toggles the TrendWorX Main toolbar.
Toggles the ActiveX toolbar.
Toggles the status bar, which indicates the status of the
container, which mode you are in (configuration or
runtime), and the date and time. When navigating through
the menu items, whichever item the mouse is over will be
displayed in the status bar.
Controls the positioning of currently selected ActiveX
objects.
Maximizes the size of the currently selected ActiveX
object within the open Trend window.
Changes the size of all ActiveX objects to fit them evenly
into the Trend window.
Overlaps all of the open ActiveX objects.
Toggles the grids available in configuration mode.
Specifies the language to be used in the from the Select
Language dialog box. Select the language you wish to
use for your system and click OK. For navigation
purposes, use the radio buttons and check boxes in the
List section.
The Properties Window command opens the Properties dialog box for the currently selected
ActiveX object. The Display Preferences and Application Preferences commands open the dialog
boxes for configuring the TrendWorX display and application-level preferences. The Toggle
Toolbars command toggles both the TrendWorX Main toolbar and the ActiveX toolbar. The Main
Toolbar and the ActiveX Toolbar commands toggle each toolbar individually. The Status Bar
command toggles the status bar.
The Object Layout submenu controls the positioning of currently selected ActiveX objects. The
Size to Display command maximizes the size of the currently selected ActiveX object within the
open Trend window. This command is not available if an object is not selected. The Tile to Display
command changes the size of all ActiveX objects to fit them evenly into the Trend window. This is
helpful if you want to compare the data in different objects or move between objects. The Cascade
command overlaps all of the open ActiveX objects.
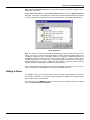
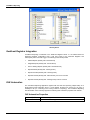
The Grid command toggles the grids available in Design mode. The Select Language command
opens a dialog box that enables you to select the user language. If a language resource .dll is
present in the TrendWorX Bin directory, TrendWorX will automatically load the language and switch
the menus and dialog boxes to the chosen language. It will also start up in that language.
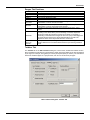
Actions Menu
The Actions menu commands are listed in the table below.
Actions Menu Commands
Command
Shortcut Keys
Animation Mode CTRL+A
Runtime Mode
CTRL+U
Persistent Trend
CTRL+E
Mode
Reporting Mode CTRL+R
Logging Mode
CTRL+M
Function
Animates or deanimates the active Trend window in the display.
Activates runtime mode for all Trend windows.
Toggles runtime mode for the TrendWorX Persistent Trending
application, if it is loaded.
Toggles runtime mode for the TrendWorX Reporting application,
if it is loaded.
Toggles data-logging mode for the TrendWorX SQL Data
Logger application, if TrendWorX Container is already
connected to it.
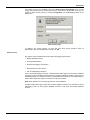
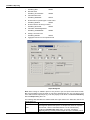
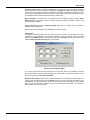
Note: You can also toggle between configuration mode and runtime mode by using the Traffic
Light button on the Main toolbar. When the light is showing Red, the application is in configuration
mode. When the light is showing Green, the application is in runtime mode.
Tools Menu
1.7
TrendeWorX Container
The Tools menu commands are listed in the table below.
Tools Menu Commands
Command
Shortcut Keys
Macros
ALT+F8
Visual Basic
Editor
ALT+F11
TrendWorX
Configurator
CTRL+W
Connect to
Logger
SHIFT+L
Persistent
Trending
Reporting
CTRL+Q
Security Login
F6
Security
Configuration
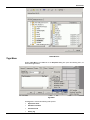
Set Working
Directory
VCRWorX Data
Replay
Publish to HTML
Configure for
Windows CE
Windows CE
Preferences
CTRL+K
F7
F8
Function
Runs a macro using the Macros dialog box.
Opens the Visual Basic for Applications (VBA) IDE
environment for developing customized VBA
modules.
Starts the TrendWorX Configurator application,
which has all the tools required for configuring data
logging and provides a comprehensive set of tools
for data logging monitoring and troubleshooting.
Starts the TrendWorX SQL Data Logger and
establishes a connection to it. Note that, in this
case, the TrendWorX SQL Data Logger will run in
the background and will not be visible.
Launches the TrendWorX Persistent Trending
application.
Launches the TrendWorX Reporting application.
Opens the security login screen for logging into the
Security Server (runtime mode only).
Launches the Security Server Configurator
(configuration mode only).
Specifies a custom directory in which all application
configuration files will be stored and retrieved.
Launches the VCRWorX Control Panel, which
enables you to replay historical data. For more
information, please see the VCRWorX help
documentation.
Launches the Web Publishing Wizard, which allows
you to export (generate) an HTML file based on
your TrendWorX display file and/or publish the
HTML file to a Web server. For more information,
please see the Web Publishing Wizard Help
documentation.
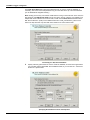
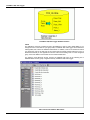
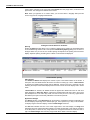
Starts configuration mode for Pocket TrendWorX.
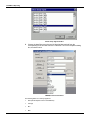
Configures settings for downloading the
configuration to a Pocket PC or CE device.
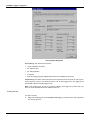
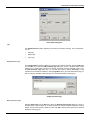
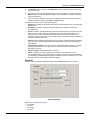
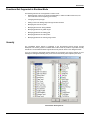
Selecting Macros > Macros from the Tools menu opens the Macros dialog box, as shown in the
figure below. Type a name for the macro and then click the Create button. This opens the Microsoft
Visual Basic Editor, where you can create a new macro. You can run an existing macro by entering
the name of the macro in the Macro Name field and clicking the Run button.
1.8
Getting Started
Creating and Running Macros
The TrendWorX Configurator command starts the TrendWorX Configurator application. The
TrendWorX Configurator has all the tools required for configuring data logging, and it provides a
comprehensive set of tools for data logging monitoring and troubleshooting.
The Security submenu allows for the configuration of the Smar Security Server, if the TrendWorX
application is currently in configuration mode, or for login to the Smar Security Server, if the
TrendWorX application is currently in runtime mode.
The Windows CE submenu refers to the capability of configuring Pocket TrendWorX displays to be
downloaded to the CE device. To start Pocket TrendWorX configuration mode, choose Configure
for Windows CE from the Windows CE submenu. The Windows CE options are not available if
Pocket TrendWorX is not installed on your PC. The CE features are further explained in the Pocket
TrendWorX documentation.
IMPORTANT NOTE: The TrendWorX Container has support for starting the TrendWorX
Configurator, which enables TrendWorX data-logging configuration and administration. Although the
ProcessView Security Server protects this menu action, the TrendWorX Configurator itself has not
been interfaced with the ProcessView Security Server. It is recommended that floor operators do not
have access to the TrendWorX Configurator, since they might accidentally delete data-logging
configurations and/or stop data logging.
Window Menu
The Window menu commands are listed in the table below.
Window Menu Commands
Command
Shortcut Keys
Function
Close
Closes the active Trend window.
Close All
Closes all open Trend windows.
Cascade
Overlaps all open Trend windows.
Changes the size of all open Trend windows to fit them
evenly into the Container screen as non-overlapping tiles.
Tile
This is helpful if you want to compare the data in different
Trend windows or move between Trend windows.
Arrange Icons
Arranges icons at the bottom of the window.
The Window menu also contains a list of all open Trend windows. In this list, the active window is
indicated by a check mark. You can display a window by selecting it from this list.
1.9
TrendeWorX Container
Help Menu
The Help menu commands are listed in the table below.
Help Menu Commands
Command
Shortcut Keys
Function
Help Topics
F1
Launches the online help for TrendWorX.
Launches the About Box, which contains the product
About
version number, copyright, and available disk space, and
Application
contact information.
Printing
Using TrendWorX, you can perform any of the following printer functions:
•
Print the current window.
•
Preview the screen information before printing. Refer to the Print Preview section for more
information.
•
Print only the Help instructions for the currently selected trend.
To configure a printer, you need to define the appropriate parameters in the Microsoft Windows
Control Panel. Refer to your Windows documentation for complete information.
Print Preview
To preview the screen information before printing, choose Print Preview from the File menu. The
Print Preview screen will appear as shown below. The figure below shows a print preview of the
Trend window for a time plot. The title bar indicates the file that is currently displayed.
Print Preview Screen
The table below lists the command buttons found in the Print Preview screen and their functions.
These buttons enable you to view the print preview information before you print.
Button
Print
Next Page
Previous Page
Two Page
1.10
Function
Displays the Print dialog box
Displays the next page in a multiple-page print preview
Displays the page that immediately precedes the current page in a multiplepage print preview
Displays two pages simultaneously in a multiple-page print preview
Getting Started
Zoom In
Zoom Out
Close
Enlarges the view of the Print Preview screen from normal view
Decreases the view of the Print Preview screen to a full-page view, enabling
you to see how the entire printed page will look
Exits the Print Preview screen and returns to the normal view
To print the document, click Print to display the Print dialog box. For more information on printing,
refer to the Printing Screen Information section. If you decide not to print, click Close to exit the
Print Preview screen.
Printing Screen Information
To print the information on the screen, choose Print from the File menu, or press the shortcut keys
CTRL+P. The Print dialog box will appear on the screen as shown below. When you are ready to
print, click OK. TrendWorX prints all records contained within the scroll window on the screen.
Print Dialog Box
When the information is sent to the print queue, the Printing Status dialog box appears on the
screen. The Printing Status dialog box indicates the number of records printed and the page that is
printing.
The Print dialog box indicates the configured printer to which this information prints. Refer to your
Windows and printer documentation for complete information about how to configure a printer.
Cancel Printing
To cancel printing, click Cancel in the Printing Status dialog box. This immediately halts printing,
and the print job is removed from the print queue.
Status Bar and Toolbars
The status bar and toolbar are objects in the TrendWorX Container screen. The information
contained in the status bar varies depending upon the current screen displayed and the current
system configuration and activity. The toolbars provide a convenient way to choose commands that
are also available in the menu bar.
Status Bar
1.11
TrendeWorX Container
The status bar, shown in the figure below, is located at the bottom of the TrendWorX screen. To
display or hide the status bar, choose the Status Bar command in the View menu, or press the
shortcut keys CTRL+B. The left side of the status bar describes the functions of menu commands
as you navigate through each menu. This side also describes the functions of toolbar buttons. When
you move the mouse pointer over a toolbar button, the function of the button is displayed in the
status bar. The status bar also indicates the display mode (runtime or configure), the number of
open ActiveX objects, the current time, and the current date.
Status Bar
Toolbars
The Main toolbar is located below the menu bar. As shown in the figure below, the Main toolbar
contains buttons for different functions available in TrendWorX.
New: Creates a new trend display.
Open: Opens an existing trend display.
Save: Saves the current display file.
Print: Prints the current trend display.
Cut: Deletes current selection, sending it to the clipboard.
Copy: Copies the current selection to the clipboard.
Paste: Pastes the current contents of the clipboard.
Add Trend: Inserts a Trend Viewer ActiveX in the display.
Tile Objects: Fits all open windows into the container screen as non-overlapping tiles.
Delete: Deletes the selected object from the Trend window.
Persistent Trending: Launches the TrendWorX Persistent Trending application.
Configurator: Starts the TrendWorX Configurator application.
Reports: Launches the TrendWorX Reporting application.
Security: Launches the Security Server Configurator.
Runtime: Activates runtime mode for all Trend windows.
The ActiveX toolbar enables you to select ActiveX objects. For more information, refer to the
ActiveX Toolbar section.
Creating New Trend Displays
You must create a new Trend ActiveX Viewer before adding and editing pens. Refer to the Pens
section for more information about selecting pens. From the Add Trend submenu in the Edit menu,
choose one of the following Trend ActiveX Viewer types:
• Time plot
• XY plot
• Bar plot
• Log plot
• Strip chart
• Circular chart
When you select a Trend ActiveX Viewer, it is inserted into the Trend window. The object type is
displayed in the upper left-hand corner.
1.12
Getting Started
You can also click the Add Trend button on the Main toolbar to create a new Time
Plot.
Trend ActiveX Viewer Types
TrendWorX offers the following Trend ActiveX Viewer types:
•
Time plot. This is a variable-versus-time plot. This is the default setting for new Trend
windows.
•
XY plot. This is a variable-versus-variable plot. You can select any pen to be the x-axis
(horizontal axis) pen.
•
Bar plot. This is a variable plot in bar form.
•
Logarithmic plot. This is a plot that uses a logarithmic scale. The ranges set in the first pen
used always determine the logarithmic axis. TrendWorX determines the nearest factor of 10
and scales all grids accordingly. Any negative values are clamped to 0.10. All values in the
details field at the bottom of the Trend ActiveX are displayed in decimal form, while all curves
are drawn in logarithmic scale.
•
Strip chart. Like the time plot Trend Viewer, this is a variable-versus-time plot. However, in a
strip chart the time data are plotted on the y-axis (vertical axis).
•
Circular chart. This is a plot of signal values in a circular field.
Editing Trend Windows
You can display the properties of a selected TrendWorX Viewer ActiveX by double-clicking the
ActiveX object. This opens the TrendWorX Viewer ActiveX Properties dialog box, which is shown
in the figure below. You can also open this dialog box by choosing Properties from the Edit menu.
Alternatively, you can right-click using the right mouse button and select Properties.
Trend Viewer ActiveX Properties Dialog Box
As you can see, the TrendWorX Viewer ActiveX Properties dialog box contains the following tabs:
•
General
•
Appearance
•
Ranges
•
Pens
•
Rates
•
Settings
You can use these tabs to edit or modify the properties of the selected ActiveX object.
For a complete description of each of these tabs, see the TrendWorX Viewer documentation.
Properties Window
1.13
TrendeWorX Container
To view the ActiveX object properties, choose Properties Window from the View menu, or press
the shortcut key F4. Alternatively, you can right-click using the right mouse button and select Show
Property Window from the menu. Each of these commands opens the Properties window, which is
shown in the figure below.
The Properties window contains all configurable options for the selected ActiveX object or the entire
display. You can switch between ActiveX objects by choosing them from the drop-down list at the
top of the Properties window. To modify a property, click the field for that property. You can either
use the available options or simply type in your changes.
Properties Window
Display Preferences
To configure the display properties, choose Display Preferences from the View menu, or press the
shortcut key F3. This opens the Display Preferences dialog box, shown in the figure below.
Display Preferences Dialog Box
As you can see, the Display Preferences dialog box contains the following tabs, which enable you
to modify the display:
1.14
Getting Started
•
General tab
•
Runtime tab
•
Grids tab
General Tab
The General tab in the Display Preferences dialog box, shown in the figure below, enables you to:
•
Set the size of the Trend window.
•
Choose how to arrange open Trend ActiveX Viewers and/or other ActiveX objects.
•
Change the display background color.
•
Configure the display for printing. This last option has been implemented to save ink while
printing Trend displays.
Display Preferences: General Tab
Window Dimensions
The Window Dimensions field specifies dimensions (in pixels) from the left and the top of the
window, as well as the width and the height of the window.
New Objects
The New Objects section positions the object with respect to the display. You can place the object
in the display, size the object to the display, tile the object to the display, or arrange the object in the
cascade mode.
Printing Options
If Ignore Display Background is checked upon printing a display, the background color of the
entire display will be temporarily changed to white. The original display background color will be
restored immediately after printing.
If Ignore Object Background is checked upon printing a display, all background colors of each
individual area within a Trend ActiveX Viewer will be temporarily changed to white. The original
colors will be restored immediately after printing.
Apply to All Displays
1.15
TrendeWorX Container
If checked, the parameters defined in the General tab of the Display Preferences dialog box will be
applied to all displays.
Tile Objects on Resize
If checked, objects in the display are automatically tiled when the display is resized.
Display Color
The Display Color field allows you to choose a color for the display. Click the color box to open the
Color Palette.
Runtime Tab
The Runtime tab in the Display Preferences dialog box, shown in the figure below, configures the
way the Trend window will appear in runtime mode. As you can see, the Runtime tab contains the
following features:
• Runtime title bar options
• Runtime frame style
• Runtime start state
Note: Checking the Apply To All Displays check box applies the settings to all currently open
displays.
Display Preferences: Runtime Tab
Runtime Title Bar Options
If the Show Title Bar box is checked, the title bar of the Trend window will be displayed during
runtime mode. Similarly, if the Override Caption box is checked, you may enter a caption that you
would like to appear in the title bar during runtime.
The System Menu, Minimize, and Maximize options all refer to buttons that may appear in the title
bar during runtime. When all of these boxes are checked, all of the indicated buttons show up in the
title bar. If you do not want a button to appear in the title bar, simply click the box that applies to that
button to remove the check mark. Hiding these buttons helps to ensure the functionality of the Trend
window during runtime mode because the operator can neither close nor change the size of the
window.
Runtime Frame Style
The Outer Frame Edge drop-down list enables you to choose from the following three frame styles:
• None
• Raised (resizable)
• Raised (fixed size)
1.16
Getting Started
Selecting the Raised (Fixed Size) option helps to maintain the functionality of the Trend window in
runtime mode because the operator is not allowed to change the configured display.
The Inner Frame Edge drop-down list gives you the option to have a sunken inner frame edge.
Runtime Start State
The Runtime Start State feature enables you to choose how the Trend window will appear during
runtime mode. Check the appropriate box to minimize or maximize the Trend window.
Grids Tab
The Grids tab, shown in the figure below, configures the type, style, size, and color of the display
grid. Selecting Show Grid makes the grid visible. Selecting Snap To Grid makes all borders of the
display objects align with the grid lines when they are moved across the display area. The grids are
not available when the display is in animation mode.
Display Preferences: Grids Tab
Application Preferences
To configure or change the application preferences, select Application Preferences from the View
menu, or press the shortcut key F2. This opens the Application Preferences dialog box, as shown
in the figure below.
1.17
TrendeWorX Container
Application Preferences Dialog Box
As you can see, the Application Preferences dialog box contains the following tabs, which enable
you to modify the display:
•
General tab
•
Runtime tab
•
Loading tab
•
Persistent trending tab
•
Reporting tab
•
Logging tab
General Tab
The General tab in the Application Preferences dialog box, shown in the figure below, enables you
to:
•
Configure new displays.
•
Select a default Trend type, such as a time plot or a bar plot.
•
Define how a new Trend will be placed in the display.
•
Define the size of the Trend window.
Application Preferences: General Tab
New Displays
You can choose to have the new display by default appear either as a Blank window or as a window
with an embedded Trend Viewer.
Checking Fit Object to Display maximizes the size of the object in the container window.
Checking Tile All Displays changes the size of your objects to fit them into the evenly into the
display window. This is helpful if you want to compare data in different objects or if you are moving
back in forth from object to object.
Checking Cascade All Displays resizes all of the open objects and overlaps them so that you can
see the top and left side of every open object window.
1.18
Getting Started
Window Dimensions
The Window Dimensions field specifies dimensions (in pixels) from the left and the top of the
window, as well as the width and the height of the window.
Runtime Tab
The Runtime tab in the Application Preferences dialog box, shown in the figure below, configures
runtime mode options for the entire TrendWorX application. As you can see, the Runtime tab
contains the following features:
•
Runtime title bar options
•
Runtime frame style
•
Runtime settings
The right side options allow you to decide how the application will start in runtime and how you want
the application to appear in runtime mode. Additionally, the last two options let the you decide if you
want to view the ActiveX Toolbar (described later) and if you want the save changes dialog to
appear when you make changes in runtime and then exit the application. If the Suppress Save
Modified Message Box check box is checked, you will not be warned to save all changes made to
a display while in runtime mode, and these changes will be lost.
Application Preferences: Runtime Tab
Runtime Title Bar Options
If the Show Title Bar box is checked, the title bar of the TrendWorX Container screen will be
displayed during runtime mode. Similarly, if the Override Caption box is checked, you may enter a
caption that you would like to have appear in the title bar during runtime.
The System Menu, Minimize, and Maximize options all refer to buttons that may appear in the title
bar of the TrendWorX Container screen during runtime. When all of these boxes are checked, all of
the indicated buttons show up in the title bar. If you do not want a button to appear in the title bar,
simply click the box that applies to that button to remove the check mark.
Runtime Frame Style
The Outer Frame Edge drop-down list enables you to choose from the following three frame styles
for the TrendWorX Container screen:
•
None
1.19
TrendeWorX Container
•
Raised (resizable)
•
Raised (fixed size)
Runtime Settings
The runtime settings (listed along the right side of the Runtime tab) enable you to choose how the
TrendWorX Container screen will appear during runtime mode. For example, check the appropriate
box to minimize or maximize the TrendWorX Container screen. You can also choose whether to
have menu bars, toolbars, or the status bar showing during runtime mode.
Loading Tab
The Loading tab, shown in the figure below, enables you to add or delete previously created Trend
displays during startup. If Auto Load is checked, the selected displays will be loaded upon startup of
TrendWorX. If Auto Update is checked, TrendWorX will automatically add the existing displays to
the list of displays to be loaded during the next startup. If Auto Runtime is checked, the selected
displays will automatically start in runtime mode upon startup.
You can also select displays to add to the display startup list by simply clicking Add, which will open
a Display dialog box. Similarly, you can delete a display from the startup list by selecting it and then
clicking Delete. For this feature to go into effect, the user must first save the display startup list as a
.csv file. You can do this by clicking Save As to choose a directory for the .csv file that contains all
the names of the TrendWorX displays to be loaded at startup. In addition, the user can click Select
to select a previously saved .csv file with the names of displays to be loaded the next time
TrendWorX starts up.
Application Preferences: Loading Tab
1.20
Getting Started
Persistent Trending Tab
The Persistent Trending tab, shown in the figure below, sets when TrendWorX Persistent Trending
is started, stopped, launched, and shut down.
Application Preferences: Persistent Trending Tab
Reporting Tab
The Reporting tab, shown in the figure below, configures when TrendWorX Reporting is started,
stopped, launched, and shut down.
Application Preferences: Reporting Tab
1.21
TrendeWorX Container
Logging Tab
The Logging tab, shown in the figure below, enables you to interface with the TrendWorX SQL Data
Logger. Note that the TrendWorX Container will connect to the SQL Data Logger via a COM
interface. As a result, when the TrendWorX SQL Data Logger is loaded, it will not be visible. The
most important feature on this tab is the Computer Name field, which allows the user to choose
which machine on the network they want to start the TrendWorX SQL Data Logger. It is assumed
that all components are properly registered and DCOM properly configured for this function to work.
Application Preferences: Logging Tab
ActiveX Toolbar
The ActiveX toolbar consists of two main parts. The OLE button is used to display the ActiveX
Control Selection dialog, while the next five buttons represent Smar ActiveX controls:
•
GraphWorX ActiveX Control
•
AlarmWorX ActiveX Control
•
TrendWorX SQL Tool ActiveX Control
•
GraphWorX Gauge ActiveX Control
•
GraphWorX Switch ActiveX Control
ActiveX Toolbar
The other buttons represent common ActiveX controls, which are supported by and can be
referenced in VBA.
The TrendWorX SQL Tool ActiveX Control is an invisible-at-runtime control used to retrieve
TrendWorX historical data on a per-tag basis.
Customizing the ActiveX Toolbar
1.22
Getting Started
You can add, remove, or relocate items on the ActiveX toolbar within TrendWorX. To access the
Customize Toolbar dialog box, shown in the figure below, simply right-click the toolbar and the
dialog box will appear.
Customize Toolbar Dialog Box
To remove a button from the ActiveX toolbar, select the button from the Current toolbar buttons
list on the right and click <-Remove. Similarly, if you wish to add a button to the toolbar, select the
button from the Available toolbar buttons on the left and click Add->.
Click Move Up and Move Down to relocate buttons on the toolbar. This feature is helpful because
there may be a button on the toolbar that you do not use, in which case it should be removed.
Note: All functions of the ActiveX toolbar will either be in the list of available buttons or in the list of
current toolbar buttons. It is impossible to remove a function entirely from the dialog box.
TrendWorX OLE Automation
TrendWorX Container exposes a rich and useful set of OLE Automation properties and methods.
The various OLE objects exposed are:
•
Application Object (Twx32App)
•
Documents Object (Twx32Documents)
•
Document
Application Object (Twx32App)
The Application Object has the following properties and methods:
Properties
•
BSTR Name
•
boolean Visible
•
boolean RuntimeMode
•
IDispatch* Application
•
IDispatch* Documents
•
boolean EnterRuntime()
•
boolean ExitRuntime()
Methods
1.23
TrendeWorX Container
•
void Quit()
•
boolean LoadBgTrend()
•
boolean ShutDownBgTrend()
•
void CloseAllDocuments()
Documents Object (Twx32Documents)
The Documents property exposes another OLE object, which can be used to manipulate individual
TrendWorX displays. It has the following properties and methods:
Properties
•
long Count
•
boolean Open(BSTR FilePath)
•
boolean Add(BSTR Caption)
•
boolean RunDocument(BSTR Item)
•
boolean CfgDocument(BSTR Item)
•
boolean PrintDocument(BSTR Item)
•
boolean IsDocRunning(BSTR Item)
•
boolean CloseDocument(BSTR Item)
•
boolean CloseSaveDocument(BSTR Item)
Methods
Document
TrendWorX Container supports the following properties, methods, and events at the Document
(Display) level:
Properties
1.24
•
IDispatch* Application
•
BSTR FullName
•
BSTR Path
•
boolean Saved
•
boolean RuntimeMode
•
boolean VBADesignMode
•
boolean Maximized
•
BSTR Caption
•
boolean Visible
•
boolean IgnoreBackColor
•
boolean IgnoreObjectBackColor
Getting Started
•
boolean GridsOn
•
void EnterRuntime()
•
void ExitRuntime()
•
long NumberOfObjects()
•
void Activate()
•
void Save()
•
void SaveAs(BSTR fileName)
•
void Print() *
Methods
* Note: For the document print method, use the following code in a VBA application:
Private Sub CommandButton1_Click()
Dim Twx32App As Twx32.Application
Dim TwX32Documents As Twx32.Documents
Dim strName As String
' Get Doc Name
strName = This Document.Caption
' Get Application
Set Twx32App = ThisDocument.Application
' Get Documents Collection
Set Twx32Documents = Twx32App.Documents
' Print
Twx32Documents.PrintDocument strName
Events
•
void Open()
•
void Close()
•
void Runtime()
•
void Configure()
•
void NewTrend()
•
void NoSecurity()
•
void NoKey()
•
void Print()
OLE Automation Examples and Samples
TrendWorX includes a set of VBA examples under the "\Smar\ProcessView\Examples\TrendWorX
Examples" directory. The following folders located inside the "Examples" directory are associated
with the Viewer.
Aliasing. The files in this folder demonstrate the use of the OLE Automation interface of the
TrendWorX Viewer ActiveX within a VBA-enabled application, such as GraphWorX, in aliasing.
Excel Templates. The files in this folder are example Excel templates that can be used when
creating Excel workbooks to be used with TrendWorX Reporting.
Real-Time Trend Configuration. The files in this folder demonstrate the use of the OLE
Automation interface of the TrendWorX Viewer ActiveX within a VBA-enabled application, such as
1.25
TrendeWorX Container
GraphWorX. It demonstrates how to add pens "on the fly" by reading the pen configuration from a
Microsoft Access database (.mdb) file and utilizing the OLE Automation properties of the TrendWorX
ActiveX through VBA scripts.
TrendWorX Data Logging and Reporting. This folder contains sample TrendWorX data-logging
configuration, a sample historical database, as well as sample reporting and historical replay
displays.
TrendWorX Backgrounds. This folder contains several image files that can be used as
backgrounds for the TrendWorX Viewer ActiveX display.
TrendWorX VBA Examples. This folder contains various examples that demonstrate the use of the
OLE Automation interface of the various TrendWorX modules and components.
VB Script Examples. This folder contains a TWX-VBScriptEx.gdf display that uses VB scripting.
TrendWorX Security
TrendWorX has an interface with the ProcessView Security Server and currently supports the
security actions shown in the dialog box below.
Security Server
Important Note
The TrendWorX container has support for starting the TrendWorX Configurator application, which
enables TrendWorX data-logging configuration and administration. Although the Security Server
protects this menu action, the TrendWorX Configurator itself has not been interfaced to the Smar
Security Server. It is recommended that floor operators do not have access to the TrendWorX
Configurator, because they can accidentally delete data-logging configurations and/or stop data
logging.
Download to Windows CE Support
All display files for Pocket ProcessView are first configured on a desktop PC using a ProcessView
application (such as GraphWorX, TrendWorX, and AlarmWorX) and then saved in a format that is
compatible with Pocket PC and Windows CE. A display file is then downloaded to the Pocket PC or
Windows CE device to be viewed during runtime. Once you open the display file in the
corresponding Pocket ProcessView application (i.e. Pocket GraphWorX, Pocket TrendWorX, or
1.26
Getting Started
Pocket AlarmWorX) in runtime mode, you can execute all runtime functional dynamics that have
been added during configuration. With a few exceptions, Pocket ProcessView applications have the
same basic runtime functionality as their counterpart ProcessView applications.
Configuring for Windows CE in ProcessView
To configure for Windows CE in GraphWorX, TrendWorX, and AlarmWorX, select Windows CE >
Configure for Windows CE from the Tools menu, as shown in the figure below. If you have just
installed Pocket ProcessView, this will be checked by default.
Configuring for Windows CE
Once you have configured your display, select Save As from the File menu. This opens the Save
As dialog box, which allows you to save your configuration as a display for Windows CE file. Give
the file a name and select one of the following file types from the Save As Type box:
•
In GraphWorX, select either "GraphWorX Displays for WinCE (*.gdc)" or "GraphWorX
Templates for WinCE (*.gdc)."
•
In AlarmWorX, select "AWXview32 CE File (*.ace)."
•
In TrendWorX, select "TWXviewerCE File (*.tce)."
Click the Save button. Upon saving your configuration file for Windows CE, features that are not
supported by Pocket PC or Windows CE will be removed from the Pocket ProcessView display.
Note: When opening a Pocket ProcessView display in ProcessView, you must specify the proper
Windows CE file extension.
Remote Connections
In order to connect remotely to OPC servers over a network, you must install and use GenBroker.
Please see the GenBroker Help documentation for more information about configuring GenBroker.
Downloading ProcessView Configuration Files to Your Pocket PC
Once you have configured your application in ProcessView and saved the Pocket ProcessView
display file, you can use the file Download to Windows CE Utility in ProcessView to download
configuration files from GraphWorX, TrendWorX, and AlarmWorX to your Pocket or CE device.
When developing a configuration file for a Pocket ProcessView application, this feature allows you to
download the configuration file to a Windows CE or Pocket PC device. The file download function
uses Microsoft ActiveSync to connect to the CE device.
Setting up the Download
The download to CE tool requires modules on both a desktop or workstation PC as well as a Pocket
PC or CE device, because Microsoft ActiveSync services are used for connecting and authenticating
the CE device.
Configuring the Desktop
1.27
TrendeWorX Container
The desktop is the only part that has to be configured. If the file download tool is installed properly, it
will be listed in the ActiveSync Manager list of ActiveSync modules in the Sync Options tab of the
Windows Options dialog box. You must enable the file download ActiveSync module in the
ActiveSync Manager by checking the Download box, as shown in the figure below.
Windows Options Dialog Box
An association with the CE device must be created to synchronize the download ActiveSync
modules, as shown in the figure below. When the CE device responds without any problems, the
download synchronization module is active.
When enabled, the file download tool immediately downloads the configuration file for Windows CE
to the CE device. When disabled, the configured file will only be saved.
For more information about Microsoft ActiveSync services, please refer to the Microsoft ActiveSync
help documentation.
1.28
Getting Started
Microsoft ActiveSync
File Download Application Configuration
GraphWorX, TrendWorX, and AlarmWorX have their own version of the file download tool. In these
applications, choose Tools > Windows CE > Windows CE Preferences, as shown in the figure
below.
Starting the Windows CE Download Tool
This opens the Windows CE Preferences dialog box, which allows you to enable or disable the file
download tool. To enable this tool, check the Download On Save check box. Then select the
destination directory on the CE device by entering the path name in the Download Directory field,
as shown in the figure below.
1.29
TrendeWorX Container
Setting Windows CE Preferences
You can also click the Browse button to select the destination directory. Clicking the Browse button
opens the Browse for Folder dialog box, which shows the CE device directories, as shown in the
figure below. A warning message box will be displayed when the file download ActiveSync module
is inactive.
Browsing for a Folder on the CE Device
To establish a connection with the CE device, click OK, as show in the figure below.
File Download ActiveSync Module
1.30
Getting Started
You can also use the Windows CE Preferences dialog box to configure other settings for the CE
device. You can set the resolution of the target device by clicking the Resolution button. This
displays a list of resolutions from 200 x 320 up to 1024 x 768.
Downloading the File to the CE Device
When you have finished configuring a display file and would like to save it to Windows CE, choose
Save As from the File menu. This opens the Save As dialog box.
•
In GraphWorX, enter the file name and select either "GraphWorX Displays for WinCE (*.gdc)"
or "GraphWorX Templates for WinCE (*.gdc)" from the Save As Type box.
•
In AlarmWorX, enter the file name and select "AWXview32 CE File (*.ace)" from the Save As
Type box.
•
In TrendWorX, enter the file name and select "TWXviewerCE File (*.tce)" from the Save As
Type box.
The Smar Import File dialog box will be displayed, indicating that the files are downloading to the
Windows CE device.
Starting Pocket ProcessView Applications on Your Pocket PC
Once you have downloaded your GraphWorX, AlarmWorX, or TrendWorX configuration files from
your desktop PC to your Pocket PC or CE device, you can run the applications on your Pocket PC.
Open the Pocket ProcessView client applications (Pocket GraphWorX, Pocket AlarmWorX, and
Pocket TrendWorX) you wish to run, and then select Open from the File menu. Browse for the
desired .gdc, .ace, or .tce file.
VCRWorX Data Replay
VCRWorX is a powerful tool in ProcessView that enables the replay and reanimation of graphical,
historical and alarm data. Features of VCRWorX replay include:
The VCRWorX Control Panel, shown in the figure below, is the user interface that enables you to
configure your historical data replay time and date settings. You can:
•
See what the operator saw through replay of graphical displays.
•
Specify time and date ranges for replay.
•
Fast forward and rewind.
•
Change the replay speed.
•
Search for key events, tags, or expressions.
•
Customize the layout and appearance using skins.
To launch the VCRWorX Control Panel from TrendWorX during runtime mode:
1.
Select VCRWorX Replay from the TrendWorX Tools menu, as shown in the figure below.
Launching the VCRWorX Control Panel
2.
This opens the VCRWorX Control Panel, as shown in the figure below. The TrendWorX
display goes into VCRWorX historical replay mode based on the time and date you provided.
1.31
TrendeWorX Container
You can see the process point values and ActiveX controls update in the TrendWorX display,
and you can see the time/date field of the VCRWorX Control Panel in replay, or "playback,"
mode, as shown in the figure below.
VCRWorX Control Panel
For more information about VCRWorX, please see the VCRWorX help documentation.
1.32
Chapter 2
Logger Configurator
Introduction
The TrendWorX Configurator is used to create and maintain a tag database for use by the
TrendWorX SQL Data Logger. Its main function is to perform configuration for data logging. In
addition to simple tag configuration, the Configurator is used to create and maintain a process-area
hierarchy and to group tags into one or more named configurations to support servers running on
multiple network nodes.
The TrendWorX Configurator receives field data from any OPC-compliant data access server and
performs configuration.
Using the TrendWorX Configurator, you will perform the following basic steps:
1.
Open a new configuration for data logging.
2.
Configure a database group, a logging group, and tags.
3.
Download the configuration to the server by using the Make Active command on the File
menu.
4.
Start or stop data logging.
The server can read its configuration information from a Microsoft Access .mdb file, provided the
relevant driver is installed on your local machine. You can select either a machine source or a file as
a data source for the Configurator. This means that you have the option of selecting a data source
that need not necessarily reside on your local machine. The Configurator can retrieve data either
from a database on your PC (machine source) or from a database that resides on the network (file
source).
About the TrendWorX Configurator
The Configurator application ("Twx32Cfg.exe") is used to make changes to the database file that the
server uses for configuration information. This file is the Logger Configurator component of the
TrendWorX SQL Data Logger. The Twx32Cfg.exe file is installed in the ProcessView "Bin"
directory.
The TrendWorX Configurator has enhanced multiple configuration support. The TrendWorX SQL
Server stores its configuration data in a database file. The TrendWorX Configurator is interfaced to
the TrendWorX SQL Data Logger through a COM interface. Through this COM interface, you can
download configurations to the TrendWorX SQL Data Logger, start and stop data logging, and
retrieve status information.
The configuration data can be stored in either a Microsoft Access database or a Microsoft SQL
Server database. The ProcessView installation utility installs a default Microsoft Access
configuration database, called Twx32.mdb, which is located in the ProcessView "Bin" directory. The
configuration database default file contains all of the defined configuration tables as well as all the
used restrictions and constraints. These files should never be altered because they can violate
database integrity.
Starting the TrendWorX Configurator
To start the TrendWorX Configurator:
1.
From the Windows Start menu select Programs > Smar ProcessView > ProjectWorX >
TrendWorx > TrendWorX Configurator.
2.
This opens the Configurator, as shown in the figure below. The screen consists of a split
window with a tree control view in the left-hand pane and a configuration view in the right-hand
pane. The Configurator provides a standard format for the configuration database, as well as a
sample (default) Trend Logger configuration project. The Configurator also includes a toolbar
and menus with many command functions.
2.1
TrendWorX Logger Configurator
TrendWorX Logger Configurator Screen
IMPORTANT: The TrendWorX Container has security protection on starting the TrendWorX
Configurator. However, the TrendWorX Logger Configurator itself is not interfaced to the Security
Server. Therefore, you should exercise caution when starting the Configurator because the
Configurator enables you to stop data logging or even delete currently used configurations.
Creating Configuration Databases
A configuration is the name given to a block of information to be used by a server. Only one
configuration per node can be active at one time. Only one server per node can run at one time.
The Configurator provides a Configuration Database Wizard for creating new Microsoft Access and
SQL Server configuration databases. The database can store multiple configurations. To create a
new configuration database in the Configurator:
1.
Select New from the File menu, as shown in the figure below.
Creating a Configuration Database
2.
The introduction screen for the Configuration Database Wizard appears. Click the Next button
to continue.
3.
You have two options for creating your new database, as shown in the figure below:
•
Create a new Microsoft Access configuration database: For a Microsoft Access database,
the Configurator uses a single .mdb file
•
Create a Microsoft SQL Server database: The Configurator uses Universal Data Link (.udl)
files to connect to a Microsoft SQL Server or MSDE database.
Select the database type you want to create, and then click Next.
2.2
Introduction
Choosing the Type of Database To Create
Creating a Microsoft Access Configuration Database
To create a new Microsoft Access configuration database in the Configurator:
1.
Select New from the File menu, as shown in the figure below.
Creating a Configuration Database
2.
The introduction screen for the Configuration Database Wizard appears. Click the Next button
to continue.
3.
You have two options for creating your new database, as shown in the figure below. Select
Create new configuration in MS Access database. Click the Next button to continue.
2.3
TrendWorX Logger Configurator
Creating a New Microsoft Access Database
4.
Specify the directory path and file name for the new database, as shown in the figure below.
Click the ... button to browse for a directory. If you want this new database to be the active
configuration database, check Make Database Active.
Naming the New Access Database
5.
2.4
Click the Finish button. The new database is created and opened in the Configurator.
Introduction
Creating a Microsoft SQL Server Configuration Database
To create a new Microsoft SQL Server configuration database in the Configurator:
1.
Select New from the File menu, as shown in the figure below.
Creating a Configuration Database
2.
The introduction screen for the Configuration Database Wizard appears. Click the Next button
to continue.
3.
You have two options for creating your new database, as shown in the figure below. Select
Create new configuration in MS SQL Server database. Click the Next button to continue.
Creating a New Microsoft SQL Server Database
4.
To connect to a SQL Server database, either select an existing database from the Database
Name drop-down list, or a type a new name to create a new database, as shown in the figure
below. If you choose to use an existing database, you have the option of adding (autoappending) the configuration to the existing database. (For more information about the autoappend function, please see "Adding the Configuration to an Existing Database.")
2.5
TrendWorX Logger Configurator
In the SQL Server Name field, select the local SQL Server on which to create the database. If
necessary, enter a user name and password to log on to the SQL Server. (It is recommended that
you use Windows NT integrated security.)
Note: Usually you have only one instance of SQL Server running on the local node. In this case, the
drop-down list under SQL Server Name has only one option: "(local)." However, it is possible to run
multiple SQL Server instances on the local node, in which case the SQL Server field lists all those
SQL Server instances: "(local)" for the default instance and "node_name/instance_name" for all
others. The drop-down list may show SQL Server instances on other nodes as well.
Connecting to a SQL Server Database
5.
Specify a directory path location in which to create the database, as shown in the figure below.
You can either use the default SQL Server database folder, or you can click the ... button and
browse for a specific folder.
Specifying the Database Location and Properties
2.6
Introduction
Under the Database Properties section, specify an initial size for the database, which should be as
large as possible. You can also specify a Database Growth option (in megabytes) or as a
percentage of the total size. MSDE servers are capable of growing the database on the fly to store
more data. However, if this operation is performed frequently, the overall system performance may
decrease. Choosing an initially large database size and a corresponding database growth option can
drastically improve system performance.
Under the Log File Properties section, you can also modify the settings for the database
transaction log file. Specify a Log File Growth option (in megabytes) or as a percentage of the total
size. Again, a sufficient initial size setting can greatly improve performance. The default options
should be adequate for most applications with a small to medium size load.
Click the Next button to create the new SQL Server database.
6.
The Configurator uses Universal Data Link (.udl) files to connect to the Microsoft SQL Server
database. These .udl files contain OLE database connection information that allows the
Configurator to create and manage connections to OLE databases. Enter a name and directory
path for the new .udl file in the Data Link File Name field, as shown in the figure below. You
can browse for a directory by clicking the … button to the right of this field. Click the Next
button to continue. If you want this new database to be the active configuration database,
check Make Database Active.
Creating a Universal Data Link File
7.
Click the Finish button. The new database is created and opened in the Configurator.
Adding a Configuration Database to an Existing SQL Server Database
The Configuration Database Wizard also gives you the option to add the configuration database
structure to an existing Microsoft SQL Server database:
1.
Select New from the File menu, as shown in the figure below.
2.7
TrendWorX Logger Configurator
Creating a Configuration Database
2.
The introduction screen for the Configuration Database Wizard appears. Click the Next button
to continue.
3.
You have two options for creating your new database, as shown in the figure below. Select
Create new configuration in MS SQL Server database. Click the Next button to continue.
Creating a Microsoft SQL Server Database
4.
To connect to a SQL Server database, select the existing database from the drop-down list, as
shown in the figure below. Check the Auto-append configuration into existing database
check box. In the SQL Server field, select the local SQL Server on which to create the
database. Type a name for the database in the Database Name field. If necessary, enter a
user name and password to log on to the SQL Server. (Note: It is recommended that you use
Windows NT integrated security.) Click the Next button to continue.
Note: Usually you have only one instance of SQL Server running on the local node. In this case, the
drop-down list under SQL Server Name has only one option: "(local)." However, it is possible to run
multiple SQL Server instances on the local node, in which case the SQL Server field lists all those
SQL Server instances: "(local)" for the default instance and "node_name/instance_name" for all
others. The drop-down list may show SQL Server instances on other nodes as well.
2.8
Introduction
Connecting to an Existing SQL Server Database
5.
If the existing database already has configuration tables, you have the following options, as
shown in the figure below:
•
Select a different database name (recommended): This option allows you to rename the
database without affecting the existing database as well as create a new Data Link (.udl) file.
•
Use the existing database structure: This option preserves the content of the existing
database and allows you to create a new Universal Data Link (.udl) file.
•
Override all existing configuration tables: This option expunges the content of the existing
database and allows you to create a new Universal Data Link (.udl) file.
Note: Overriding the database may disable other applications that also use the database.
Click the Next button to continue.
2.9
TrendWorX Logger Configurator
Adding the Configuration to an Existing SQL Server Database
6.
If you chose Select a different database name (recommended), you are directed back to the
SQL Server Database Connection dialog box, as shown in the figure below. Enter a new name
for the database, and then click Next.
Renaming the Existing SQL Server Database
7.
2.10
Specify a directory path location in which to create the database, as shown in the figure below.
You can either use the default SQL Server database folder, or you can click the ... button and
browse for a specific folder.
Introduction
Specifying the Database Location and Properties
Under the Database Properties section, specify an initial size for the database, which should be as
large as possible. You can also specify a Database Growth option (in megabytes) or as a
percentage of the total size. MSDE servers are capable of growing the database on the fly to store
more data. However, if this operation is performed frequently, the overall system performance may
decrease. Choosing an initially large database size and a corresponding database growth option can
drastically improve system performance.
Under the Log File Properties section, you can also modify the settings for the database
transaction log file. Specify a Log File Growth option (in megabytes) or as a percentage of the total
size. Again, a sufficient initial size setting can greatly improve performance. The default options
should be adequate for most applications with a small to medium size load.
Click the Next button to create the new SQL Server database.
8.
The Configurator uses Universal Data Link (.udl) files to connect to the Microsoft SQL Server
database. These .udl files contain OLE database connection information that allows the
Configurator to create and manage connections to OLE databases. Enter a name and directory
path for the new .udl file in the Data Link File Name field, as shown in the figure below. You
can browse for a directory by clicking the … button to the right of this field. Click the Next
button to continue. If you want this new database to be the active configuration database,
check Make Database Active.
Note: If you chose to Use the existing database structure or to Override all existing
configuration tables, you will still need to create a new Data Link file.
2.11
TrendWorX Logger Configurator
Creating a Universal Data Link File
9.
Click the Finish button. The new database is created and opened in the Configurator.
Toolbars
The Configurator contains two toolbars: a Standard toolbar and a Data Manipulation toolbar.
Standard Toolbar
To show or hide the Standard toolbar, select Toolbars > Standard Buttons from the View menu.
The Standard toolbar, shown below, contains the following command buttons.
New: Creates a new configuration database.
Open: Opens an existing configuration database.
Import Data: Imports configuration data from a text file (.txt) or a Microsoft Excel file (.csv).
Export Data: Exports configuration data to a text file (.txt) or a Microsoft Excel file (.csv).
Back: Moves the cursor back to the previously selected item in the tree control.
Next: Moves the cursor to the next item in the tree control.
Up One Level: Moves up one level in the tree control.
Cut: Deletes current selection, sending it to the clipboard.
Copy: Copies the current selection to the clipboard.
Paste: Pastes the current contents of the clipboard.
Large Icons: Displays items as large icons..
Small Icons: Displays items as small icons.
List: Displays items as a list.
Details: Displays items as a list with details.
Dialog View: Displays additional configuration options.
Global Refresh: Refreshes the data for the entire Configurator screen.
Start/Stop Data Logging: Starts/stops data logging to the database.
About: Displays information about the application.
Help: Displays context-sensitive help.
Help Topics: Launches online help for the application.
2.12
Introduction
Data Manipulation Toolbar
To show or hide the Data Manipulation toolbar, select Toolbars > Data Manipulation Buttons from
the View menu. The Data Manipulation toolbar, shown below, contains the following command
buttons.
New Configuration: Inserts a new configuration at the Master Configuration level.
New Database Group: Inserts a new database group at the Configuration level.
New Logging Group: Inserts a new logging group the Database Group level.
Insert New OPC Tags: Inserts a new OPC tag at the Group level.
New Simulation Variable: Inserts a new simulation variable at the Group level.
New Expression: Inserts a new expression at the Group level.
Multiply: Multiplies the selected item in the tree control.
Delete: Deletes the selected item from the tree control.
Menus
The menu bar of the TrendWorX Configurator contains the following menus:
• File
• Edit
• View
• Go
• Action
• Tools
• Help
File Menu
The File menu commands are listed in the table below.
File Menu Commands
Command
Shortcut Keys Function
New
CTRL+N
Creates a new configuration database.
Opens a Microsoft Access (.mdb) or Microsoft Data Link (.udl) file,
Open
CTRL+O
which allows you to connect to any OLE database source, such as a
SQL database.
Saves the current database under a different name as a Microsoft
Save As
Access (.mdb) or Microsoft Data Link (.udl) file.
Connection
Displays the current database connection properties.
Properties
Exports configuration data from your database to a text file (.txt) or a
CSV Export
Microsoft Excel file (.csv). You can specify the delimiters and what to
export.
Imports data into your configuration database from a text file (.txt) or a
CSV Import
Microsoft Excel file (.csv). You can then specify the delimiters and
choose from the import settings.
XML Export
Exports configuration data to an XML file.
XML Export
Exports configuration data to an XML Schema file.
Schema
XML Import
Imports configuration data from an XML file.
This feature does not import an XML data file, but it will try to validate
XML Validate
its structure using stored XML schema. Once it passes this validation,
the XML file is acceptable for import by the Configurator.
Activates the current database and downloads the configuration to the
Make Active
server before data logging. If this command is not available, then the
current database is already the active database.
Closes the application and stops data logging if it started within the
Exit
Configurator.
Database Connection Properties
2.13
TrendWorX Logger Configurator
Selecting Connection Properties from the File menu opens the Database Connection Properties
dialog box, shown below, which lists the initialization properties for the current database connection.
Database Connection Properties Dialog Box
Exporting Configuration Data
Exporting Data to a Text or CSV File
The Configurator offers the flexibility of exporting data from your configuration database to a text
(.txt) file or a Microsoft Excel (.csv) file. To export data, select Export from the File menu. This
opens the Export Configuration Data to File dialog box, as shown in the figure below. You can
then specify the delimiters for exporting the data. Unless you specify delimiters in the Export
Configuration Data to File dialog box, the file uses Commas as delimiters by default. Each group
contains headings and columns that provide information about each item, such as descriptions and
associated translations and expressions. It also provides the "tree" pathway for each item. Choose
the directory to which you want to export the data from your database. In the Save As Type field,
choose the file type (.txt or .csv) that you would like to save.
2.14
Introduction
Exporting Configuration Data
Exporting Data to an XML File
The Configurator also allows you to export data from your configuration database to an XML file.
The XML export/import functionality was mainly developed for Windows platforms that do not
support databases (e.g. Windows CE and Windows Embedded). XML has the following advantages
over the CSV import/export function:
•
XML has a standardized format, unlike the text/CSV format, which uses various delimiters (e.g.
TAB instead of commas, strings could not accept all characters, etc.)
•
XML is language-independent, whereas CSV converts date/time, floats, and currency fields
according to local settings in Windows. For example, using CSV, you cannot export data on
German Windows and import it on English windows without making changes
•
Windows has an installed automation object that has the capability to work with XML. Thus,
programmers can create/modify their configurations outside the Configurator using Visual
Basic, if desired.
•
XML supports schemas. A schema is a special XML file that specifies the data structure of an
XML data file.
To export data, select XML Export from the File menu. This opens the Export XML File dialog box,
as shown in the figure below. Give the file a name, and then choose the directory to which you want
to export the data from your database. Click Save.
Note: You can also export configuration data to an XML Scheme file by selecting XML Export from
the File menu.
2.15
TrendWorX Logger Configurator
Exporting Configuration Data to a XML File
Importing Configuration Data
Importing Data From a Text or CSV File
The Configurator offers the flexibility of importing data from a text (.txt) file or a Microsoft Excel (.csv)
file to your configuration database. To import data, select Import CSV from the File menu. This
opens the Import Configuration Data From File dialog box, shown below. You can then specify
the delimiters and choose from the following import settings:
•
Create new items. When the import file contains items that are not yet in the configuration
database, then it creates them. Otherwise it skips these items.
•
Update existing items. When the import file contains items that are in the configuration
database, then it updates them using data from the import file. Otherwise it skips these items.
Note: Either Create new items or Update existing items must be selected. Otherwise there is
nothing to import.
•
Display errors. When this item is checked, the Configurator shows a dialog box if an error
occurs, and then asks you if you want to proceed with the import. When it is not checked, it
skips all items where an error occurred.
Importing Configuration Data
2.16
Introduction
When you have selected a file to import, click Open. When the import is completed, the File Import
Results dialog box opens, as shown below. This shows the import settings, including the input file
name. It also provides a summary of the import, including how many items were inserted, updated,
or rejected, and shows how many errors occurred.
Click the ... button to the right of each field to get the details view of the import results, as shown
below. This view shows the specific items that were inserted, updated, or rejected, as well as a
description of any errors that occurred.
File Import Results Dialog Box
Importing Data From an XML File
The Configurator allows you to import data from your configuration database to an XML file. The
XML export/import functionality was mainly developed for Windows platforms that do not support
databases (e.g. Windows CE and Windows Embedded). XML has the following advantages over the
CSV import/export function:
•
XML has a standardized format, unlike the text/CSV format, which uses various delimiters (e.g.
TAB instead of commas, strings could not accept all characters, etc.)
•
XML is language-independent, whereas CSV converts date/time, floats, and currency fields
according to local settings in Windows. For example, using CSV, you cannot export data on
German Windows and import it on English windows without making changes
•
Windows has an installed automation object that has the capability to work with XML. Thus,
programmers can create/modify their configurations outside the Configurator using Visual
Basic, if desired.
•
XML supports schemas. A schema is a special XML file that specifies the data structure of an
XML data file.
To import data, select XML Import from the File menu. This opens the Import XML File dialog box,
as shown in the figure below. Give the file a name, and then choose the directory from which you
want to import the data. You can then specify the delimiters and choose from the following import
settings. Click Open.
•
Create new items. When the import file contains items that are not yet in the configuration
database, then it creates them. Otherwise it skips these items.
2.17
TrendWorX Logger Configurator
•
Update existing items. When the import file contains items that are in the configuration
database, then it updates them using data from the import file. Otherwise it skips these items.
Note: Either Create new items or Update existing items must be selected. Otherwise there is
nothing to import.
Note: Selecting XML Validate from the File menu does not import an XML data file, but it will try to
validate its structure using stored XML schema. Once it passes this validation, the XML file is
acceptable for import by the Configurator.
Importing Configuration Data from a XML File
Activating the Database
Once your configuration is complete, you need to make sure that it is the active database. The
database that is currently active is the one that the server uses. To make the current database
active, select Make Active… from the File menu. If the Make Active… selection is grayed out, then
the current database is already the active database.
A dialog box appears showing both the current active database and database that is currently being
edited. To set the edited database as the active database, click the Yes button.
2.18
Introduction
Edit Menu
The Edit menu commands are listed in the table below.
Edit Menu Commands
Command
Shortcut Keys
New
Rename
CTRL+R
Multiply
CTRL+M
Delete
CTRL+DEL
Cut
CTRL+X
Copy
Paste
CTRL+C
CTRL+V
Select All
CTRL+A
Invert Selection
Function
Creates a new item depending on what is selected in the
tree control.
Renames the selected item.
Multiplies the selected object in the tree control. (For
more information on this command, see the section
below.)
Deletes the selected object.
Cuts the selected object from the view and places it on
the clipboard.
Copies the selected object to the clipboard.
Pastes the last object placed on the clipboard.
Selects all objects in a list. The selection is shown in the
upper-right-hand section of the viewer.
Unselects all selected items and selects all unselected
items in a list in the upper-right-hand section of the
viewer.
Multiply Item Command
The Configurator allows you to multiply items in the tree control, including aliases, folders, alias
values, themes, and theme items. Multiplication provides a simple way of developing configurations
where there are many similar items in a given category. To multiply an item:
1.
Select the item in the tree control that you wish to multiply.
2.
Either right-click the item and select Multiply from the pop-up menu, or select Multiply from
the Edit menu. This opens the Multiply Item dialog box, shown below.
Multiply Item Dialog Box
3.
When the items are multiplied, they are all given a base name followed by a number. The
default base text is the name of the item selected for multiplication. To modify the base text,
change the Base Text field appropriately.
4.
In the First Number field, specify the number to appear next to the first multiplied item.
5.
In the Number of Items field, specify how many items you wish to create.
6.
In the Numeric Places field, specify the minimum length of each number to append. Values
that take up less space than the specified amount of numeric places will have zeros before the
number.
7.
If you want to multiply all subfolders as well, check the Including Subtree check box.
2.19
TrendWorX Logger Configurator
8.
Click the OK button to do the multiplication. The example configuration shown in the Multiply
Item dialog box above creates three new items with the following names:
•
PumpSpeed001
•
PumpSpeed002
•
PumpSpeed003
All subfolders will also be multiplied.
View Menu
The View menu commands are listed in the table below.
View Menu Commands
Command
Shortcut Keys
Toolbars
Status Bar
Large Icons
F7
Small Icons
F8
List
F9
Details
F10
Dialog View
F11
Sort By
Show/Hide
Columns
Select
Language
Global Refresh
Subtree
Refresh
F5
CTRL+F5
Function
Toggles the standard and data manipulation toolbars.
Toggles the status bar.
Displays items as large icons.
Displays items as small icons.
Displays items as a list.
Displays items as a list along with detailed information about
the configuration of each item.
Toggles the configuration window (right-hand pane).
Displays a list of options for sorting the columns in the righthand pane of the screen. The options listed depend on the
level within the view.
Displays a list of options that you can choose to show or hide
in the view.
Opens the Select Language dialog box (see below). Choose
the language you wish to use for your system (Unicode
version only) and click OK. For navigation purposes, use the
buttons and check boxes in the List section.
Refreshes the data for the entire Configurator screen.
Refreshes only the data contained in the currently selected
subtree.
Selecting Languages
The Select Language function on the View menu allows you to choose which language to use in
your display. Choosing Select Language from the View menu opens the Select Language dialog
box, shown in the figure below.
Note: A language resource .dll is required for language switching.
2.20
Introduction
Select Language Dialog Box
Define the parameters listed in the table below. Then click OK to return to the work area.
Select Language Parameters
Parameter
Description
List
Lists available languages. Depending on which item you have
selected, the view on the left will change. If English is checked,
the languages will appear as their English name. If Localized is
checked, the languages will appear with the native country in
parentheses (for languages with several dialects only). When
Native is checked, the languages are displayed the way they
would be written in that language.
Installed Locales Only
If this is checked, local languages appear in the box.
Available Language
Translations Only
Checking this box allows you to choose from available language
translations only.
Go Menu
The Go menu commands are listed in the table below.
Go Menu Commands
Command
Shortcut Keys
CTRL+ALT+ Left
Back
Arrow
CTRL+ALT+
Forward
Right Arrow
Up One Level
ALT+Down
Next Item
Arrow
Previous Item
ALT+Up Arrow
Expand Item
ALT+Left Arrow
Collapse Item
ALT+Right Arrow
Page Up
ALT+PgUp
Page Down
ALT+PgDown
Home
ALT+Home
End
ALT+End
Next Pane
F6
Previous Pane
SHIFT+F6
Function
Moves the cursor back to the previously selected item in the
tree control.
Moves the cursor forward to the previously selected item in
the tree control.
Moves the cursor up one level in the tree control.
Moves the cursor to the next item down in the tree control.
Moves the cursor to the next item up in the tree view.
Expands an item that contains a submenu.
Collapses an item that contains a submenu.
Moves the cursor up to the first item in the tree.
Moves the cursor down to the last visible item in the tree.
Moves the cursor up to the first item in the tree.
Moves the cursor down to the last visible item in the tree.
Moves the cursor to the next pane.
Moves the cursor to the last pane used.
Action Menu
The Action menu commands are listed in the table below.
Action Menu Commands
Command
Function
Start logger
Starts data logging for the active configuration.
Stop logger
Stops data logging for the active configuration.
Tools Menu
The Tools menu commands are listed in the table below.
Tools Menu Commands
Command
Function
Set Working Directory Sets a working directory for all files relating to the saved configuration.
Launches the Options dialog, which gives you several options for controlling
the inserting and updating of tags, applying changes, and automatically
Options
connecting to and disconnecting from the server as well as automatically
updating data.
Compact/Repair MS
Opens the Compact/Repair MS Access Database dialog box.
Access Database
MSDE Manager
Launches the ProcessView MSDE Manager for configuring MSDE
2.21
TrendWorX Logger Configurator
databases.
Setting the Working Directory
Selecting Set Working Directory from the Tools menu opens the Set Working Directory dialog
box, shown below, which enables you to configure a custom directory in which all application
configuration files will be stored and retrieved. Click Browse to select the directory.
Set Working Directory Dialog Box
Compacting and Repairing Microsoft Access Databases
You can compact Microsoft Access databases, which can be either TrendWorX configuration
databases or historical databases, using the Compact/Repair MS Access Database dialog box,
shown below. Microsoft Access-based databases are subject to database fragmentation over time,
and the support for the database will compact the target database, reclaim unused space, and
drastically improve database performance.
Compact/Repair Microsoft Access Database
It is critical that no users or client applications (including TrendWorX SQL Server) are connected to
the database at the time of compacting and that, if the Backup Original Database option is
selected, there is plenty of available hard disk space.
Options
To choose additional settings, select Options from the Tools menu. This opens the Options dialog
box, which contains the following tabs:
•
General
•
Editor Preferences
General Tab
The General tab of the Options dialog box, shown in the figure below, sets the startup and
workspace parameters for the Configurator.
2.22
Introduction
Options Dialog Box: General Tab
Startup Settings
The Startup Settings options allow you to save regional settings in the registry so that they are
applied each time you start the Configurator. This applies to the language settings as well as time
and date settings. Select one of the following startup settings:
•
Open the active file: Launches the currently active database upon startup.
•
Open the most recently used file: Launches the recently opened database.
•
Open a specific file: Specifies a Microsoft Access (.mdb) or Microsoft Datalink (.udl) database
to launch upon startup. To select a database, click the ... button next to the text box and
browse for the file. When this option is selected, the "active" database is overridden by the
specified database.
Workspace Settings
The following Workspace Settings are available:
•
Auto-apply editor changes: Checking this option allows changes to the configuration
database to be saved each time you switch dialogs without clicking on the Apply button or
being shown a message asking if you would like to apply changes.
•
Enable hover selection: Checking this option allows you to highlight an item by moving the
mouse pointer over that item and keeping it there for a specified amount of time (in
milliseconds).
Editor Preferences Tab
The Editor Preferences tab of the Options dialog box, shown in the figure below, gives you several
options for controlling the inserting and updating of tags, applying changes to your configurations,
and automatically connecting to and disconnecting from the server as well as automatically updating
data.
2.23
TrendWorX Logger Configurator
Options Dialog Box: Editor Preferences Tab
Help Menu
The Help menu commands are listed in the table below.
Help Menu Commands
Command
Shortcut Key
Help Topics
F1
What's This?
SHIFT+F1
About Application
Function
Launches the online Help for the Configurator.
Displays context-sensitive help.
Launches the About Box, which contains information about
the product version number, copyright, and available disk
space. It also contains contact information.
TrendWorX Configurator Setup
The TrendWorX Configurator setup “tree” in the left-hand pane of the Configurator screen, shown in
the figure below, contains the following levels of configuration, from lowest to highest:
2.24
•
Tags
•
Logging group
•
Database group
•
Configuration
Introduction
TrendWorX Configuration Tree
The extent of configuration varies from level to level. Starting from the highest level in the tree, the
extent to which you can manipulate the settings changes depending on the current selection.
•
Tags. At the tags level, the lowest level, you can click on a tag to view information about the
tag and to manipulate its settings. In addition, you can add new tags by clicking Add New at
the bottom of the tags display.
•
Logging group. The logging group level allows more flexibility. At this level, you can configure
data-collection, logging, and table-management settings, as shown in the figure above. You
can also add new tags at this level.
•
Database group. At the database group level, you can actually establish database-connection
settings. You can activate or deactivate the data-logging process. You can also switch logging
databases.
•
Configuration. At the configuration level, which is just below the configuration file level, you
can connect or disconnect to the logger by clicking the Connect/Disconnect buttons in the
right-hand pane of the configuration setup. You can also start or stop data logging by clicking
the Start Data Logging/Stop Data Logging buttons. It is important to download the
configuration before you start data logging. You can do this by clicking the Make Active button.
Note: At each level, you can add an item from the level below by using the right-click menu.
Database Groups
From a configuration point of view, a database group represents a:
•
High-level grouping of data-logging groups.
•
Multithreaded object for managing data updates and logging to disk activities, along with an
extensive runtime user interface.
•
Physical connection to an underlying database.
2.25
TrendWorX Logger Configurator
Database Group Configuration
As shown in the figure above, multiple database objects can exist within the same instance of the
TrendWorX Configurator, and each of them can be physically connected to the same or different
database media. The TrendWorX Configurator resolves any conflicts that might occur between
databases, such as table names.
Each database object is responsible for managing groups of signals. A database group object
allows for:
•
A logical collection of signals to be data-logged.
•
Common data-collection rate and data-logging table.
•
Common data-logging configuration.
•
Group style management and editing capability for a collection of signals.
A database group is used to group OPC tags. Clients can use this information for filtering purposes.
A tag can exist under multiple database groups or even multiple times within the same logging
group. In the latter case, the logging name of the tag must be different.
Tags
A tag represents a single object for OPC information. A tag can contain information for multiple
types of OPC input and output.
Note: For historical replay, each historical tag is identified by:
DatabaseObjectName.GroupObjectName.LoggingName
Modifying any of these elements requires re-establishing client connections.
2.26
Introduction
Creating a New Configuration
To create a new configuration:
1.
Right-click the Configurations folder and select New > Configuration from the pop-up menu,
as shown in the figure below.
Creating a New Configuration
2.
In the Name field, type a name for the new configuration.
3.
Enter the configuration settings in the Configuration dialog box displayed in the right-hand
pane of the window, as shown below.
4.
Click Apply. The name of the new configuration will be displayed in the left-hand pane of the
window under Configurations.
Configuration Properties
Configuration Properties
You can configure the following settings using the Configuration dialog box, as shown in the figure
below.
2.27
TrendWorX Logger Configurator
Configuration Properties
Name. Enter the name of the new configuration in the Name field.
Node name. Enter the name of the PC through which the TrendWorX SQL Server will be accessed.
It is "local" by default.
Note: Once all configuration work here is completed, you should download the configuration to the
TrendWorX SQL Data Logger by clicking Make Active to ensure that the Data Logger has
processed all changes.
Network node name. The Network Node Name is the name of the network where the TrendWorX
SQL Server will be accessed. It can be the local name, if the TrendWorX SQL Server is running
locally, or a remote node name. Clicking the ... button displays a list of all available network nodes.
In addition to the above, the following functions are available within the configuration dialog box.
Start data logging. Clicking Start Data Logging starts the data-logging mode. This will not be
activated if there are any errors that prevent proper logging of data (i.e. table naming conflicts, etc.).
Within this mode you can:
•
Retrieve up-to-date information with respect to database generated errors.
•
Retrieve up-to-date information with respect to database tables currently being logged.
•
Retrieve up-to-date information with respect to the time it takes to log data.
•
Deactivate a database object for maintenance, and then reactivate it.
Stop data logging. Clicking Stop Data Logging stops the data-logging mode.
Connect. Clicking Connect establishes a physical connection to the TrendWorX Data Logger. Once
the connection has been established, you can make a configuration active, start or stop data
logging, and reset the Data Logger's configuration (i.e. erase all configured groups and tags from
memory).
Disconnect. Clicking Disconnect disconnects the Data Logger. No interaction with the Data Logger
will be available until the connection is re-established.
Make active. Clicking Make Active downloads the selected configuration to the Data Logger. The
Data Logger will create a historical database "footprint" into the target databases, which can be used
to configure the TrendWorX Reporting tool.
Add new configuration. Clicking Add New Configuration creates a new data-logging
configuration and automatically selects it as the current node in the configuration tree.
2.28
Introduction
Use UTC time. If Use UTC Time is checked, all time stamps stored in the database will be stored
as UTC time stamps. This is to accommodate automatic daylight savings time switching in Windows
when the Data Logger is logging data. All historical clients and TrendWorX Reporting tools will
always retrieve historical data in their local (non-UTC) time.
Note: TrendWorX up to and including Version 6.1x is using the Windows-based APIs for converting
a time from local time to UTC or from UTC to local time. The Windows APIs do not correctly adjust
the conversion for the daylight savings time if the timestamp to be converted was obtained from a
different time period (i.e. it was obtained in "summer" time but now we have "winter" time).
TrendWorX Version 7 introduced new time conversion utilities that account for this discrepancy.
There are, however, some things to consider:
•
These functions are used by default (no user enabling is required).
•
This is what they do in order to convert each timestamp:
o
They check Windows for the PC Time Zone Settings and to see if automatic daylight savings is
enabled.
o
They also obtain from Windows the times/dates for switching over. (These dates do not
change; they are in the form of, e.g., the first Sunday of April.)
o
Depending on the previous information, the new functions properly adjust the conversion times
to compensate for daylight savings time.
Use global connection. This option instructs the TrendWorX SQL Server to maintain an open
database connection, for each database group, for the duration of the data-logging activity. By
default, it is set to TRUE. It should be used when the data-logging application writes frequently to the
database; it yields a better performance. However, if data-collection rates are slower and logging to
disk is configured to be slow, disabling this option may actually improve performance, memory
utilization, and CPU and database server resource usage.
Advanced/Simple. Clicking the Advanced/Simple button displays/hides the Retrials, Retrial Delay,
Max Samples, and Max Logging Packets parameters.
Retrials. Since version 5.00, the TrendWorX Data Logger has supported retrials for data logging, if
the data-logging operation failed for any reason. As such, the number of retrials indicates the
number of times TrendWorX SQL Server will try to log data if the operation fails for the specific datalogging package.
Retrial delay (sec). The Retrial Delay option controls the elapsed time (in seconds) between
successive retrials.
Max samples. This sets the maximum number of samples to be kept in the memory buffers prior to
data logging on a per-signal (tag) basis. It is used to avoid cases in which an excessive amount of
samples could consume large memory resources.
Max logging packets. The Max Logging Packets option is used with the Retrials option to handle
data-logging failure cases and to provide a more robust system. It sets the maximum number of
data-logging packets to keep in memory, in case of data-logging failure, so that the data-logging
activity will not utilize all available PC memory. The larger the number of retrials and max logging
packets, the more system memory the TrendWorX SQL Server will utilize.
Adjust logging parameters. You can adjust the values of data-logging parameters and then click
the Adjust Log. Params button to apply the changes. Of all the available parameters, the Use
Global Connection field cannot be adjusted while the TrendWorX SQL Server is in data-logging
mode.
Note: Once you have completed all configuration work, it is recommended that you click the Make
Active button to download the selected configuration to the Data Logger. Once this is done, the
Data Logger creates a historical database "footprint" in the target databases, which can be used to
configure the TrendWorX Reporting tool.
Remote Download
The TrendWorX Configurator supports remote download of database group connections. You can
now locally configure ODBC DSN connections. When you click the Make Active button, the
TrendWorX Configurator will download the configuration to the remote PC where the TrendWorX
2.29
TrendWorX Logger Configurator
SQL Server resides. Upon doing so TrendWorX SQL Server will perform a test connection using the
database connection strings downloaded by the TrendWorX Configurator.
If the test fails with Microsoft Access, it will try to create a new .mdb file in the desired directory. If
the test succeeds, it will create an ODBC system data source on the fly using the newly created
.mdb file.
If the test fails with Microsoft SQL/MSDE, it will replace the workstation ID with the current node
name in both OLEDB and ODBC connection strings. If the test succeeds, it will create an ODBC
System data source on the fly using the Microsoft SQL/MSDE database.
Any errors generated will be reported to the NT event logger and to the Configurator database. The
remote data source creation support has also been integrated into the switch database functionality
of TrendWorX SQL Server to enable "hot-switching" of data-logging databases.
Note: There is no support for this functionality when configuring an Oracle-based data-logging
application.
Creating a New Database Group
To create a new database group:
1.
Right-click on the new configuration and select New > Database Group from the pop-up
menu, as shown in the figure below.
Creating a New Database Group
2.
In the Name field, type a name for the new database group.
3.
Configure the database settings in the Database Group dialog box in the right-hand pane of
the window, as shown in the figure below.
Database Group Properties
2.30
Introduction
4.
Select a data source by clicking Browse in the Database Connection Settings field. This
opens the Select Data Source dialog box, shown below. You have the option of selecting an
existing machine data source that is specific to the machine or creating a new machine data
source. When you have made your selection, click OK.
Note: Currently the TrendWorX SQL Data Logger only supports the Machine Data Source tab of
the Select Data Source dialog box. This tab establishes the data source and sets a database
connection.
Select Data Source Dialog Box
Configuring Database Group Properties
You can configure the following database group settings using the database group dialog box, as
shown in the figure below.
Database Group Properties
2.31
TrendWorX Logger Configurator
Name. Enter the name of the database group in this field.
Database connection settings. This section allows you to set up a connection to the data source.
It also allows you to set up a new data source.
Activate database group. If the TrendWorX SQL Data Logger is in runtime mode, clicking Activate
starts data collection and data logging for all logging groups of the selected database group.
Deactivate database group. If the TrendWorX SQL Data Logger is in runtime mode, clicking
Deactivate stops data collection and data logging for all logging groups of the selected database
group.
Database switching. Clicking Switch Database allows you to switch to a different database while
in runtime mode.
Note: Database switching is supported in runtime mode; that is, when data logging is active. You
need to follow these steps:
1.
Select the database to which you would like to switch by clicking Browse in the Database
Connection Settings field), and then click Apply. A warning message will appear indicating
that the changes will not take effect until the Data Logger exits data-logging mode and the
changes are downloaded to the Data Logger or the Switch Database button is clicked.
2.
Click the Switch Database button to switch the logging database. A message box will warn
you again and will give you the choice of whether to redirect pending writes to the new
database connection.
When the Data Logger detects a database switch operation, it also may require a higher count of
client units if the database switch is an upgrade from a Microsoft Access database to a SQL server
database or an Oracle database. If the client units are not available, the database switching
operation will fail and the active logging database will revert back to the old one. For more
information, please review the ProcessView licensing and client units registration documentation.
Creating a New Data Source
You can also create a new data source and establish a new database connection for the new
database group you have just created by using the following procedure:
1.
2.32
Click the New button in the Select Data Source dialog box, as shown in the figure below.
Introduction
Select Data Source Dialog Box
2.
This opens the Create New Data Source wizard, shown below, which is a series of dialog
boxes that will guide you through the required steps to create a new data source. Select a User
Data Source or a System Data Source. We recommend choosing a system data source.
Then click Next to continue with the data source creation.
Create New Data Source Wizard: Selecting a Data Source
3.
Select an installed driver that you wish to use, and then click Next.
Note: Currently, the TrendWorX SQL Data Logger only supports Microsoft Access, Microsoft SQL
Server, MSDE and Oracle databases using the Oracle provided ODBC Driver.
Create New Data Source Wizard: Selecting a Driver
4.
In the next dialog box of the Create New Data Source wizard, shown below, click Finish to
create the data source you have just configured.
2.33
TrendWorX Logger Configurator
Create New Data Source Wizard: Completing Data Source Creation
5.
The wizard will then provide you with further instructions.
Selecting a Logging Database
You can now select the data source to which you want to log the data by using the following
procedure:
1.
Select a logging database by clicking Browse in the ODBC Data Source field in the Database
Group properties, as shown in the figure below.
Database Group Properties
2.
2.34
The new data source is then displayed in the Select Data Source dialog box, as shown below.
Introduction
Select Data Source Dialog Box
3.
Once you select the proper data source name, click OK. You will then be asked to login if you
have selected a machine data source, as shown below.
Data Source Login Dialog Box
4.
Enter your login name and password.
5.
Click the Perform Test button in the Database Group properties to execute the test for
connectivity. You will be notified when the test has been completed, as shown below. Click OK.
Test Connection
2.35
TrendWorX Logger Configurator
Creating a New Logging Group
To create a new logging group:
1.
Right-click on a database group and select New > Logging Group from the pop-up menu, as
shown in the figure below.
Creating a New Logging Group
2.
This opens the Logging Group dialog box in the right-hand pane of the TrendWorX
Configurator screen, as shown below.
3.
In the Name field, type a name for the new logging group.
4.
Define the parameters for the following three tabs:
•
Data collection tab
•
Logging tab
•
Table management tab
Logging Group Properties
Configuring Logging Group Properties
The logging group properties dialog box contains the following three tabs:
2.36
•
Data collection tab
•
Logging tab
•
Table management tab
Introduction
Logging Group Properties
Data Collection Tab
The Data Collection tab in the Logging Group dialog box, shown below, allows you to define the
Control Board, the Start Conditions, and the Stop Conditions for the new group. Enter the
appropriate fields in this tab as defined below.
Data Collection Tab: Control Board
Control Board
Data-collection rate. This field specifies the rate at which data will be collected in units of hours,
minutes, seconds, and milliseconds.
Calculation period. This field defines when a new calculation period will begin (hours, minutes,
seconds, and milliseconds).
Note: Warnings are built into the system to ensure that the new calculation will not begin at an
inappropriate time.
2.37
TrendWorX Logger Configurator
Batch and lot tracking. The TrendWorX Configurator supports batch and lot tracking. You can
enable this support on a per-data-logging group basis and define OPC string signals that store the
current batch and lot information. These values may be automatically retrieved through a bar
scanner or manually entered through a graphics screen within a GraphWorX or VBA Form.
Start and Stop Conditions
Click Start Conditions and Stop Conditions, as shown in the figure below, to define the beginning
and end of data collection, or the period during which the logging group is connected to the data
source and is logging data.
Logging Group Start Conditions
The Start Conditions field contains the following options for starting data collection.
On time. When On Time is checked, data logging and data collection for the selected group will
start at a specified time in hours, minutes, and seconds.
Sync. When Sync is checked, the data collection for the selected logging group will be
synchronized to start on the next full time interval starting one full data-collection period from the
time selected. For example, if the desired start time is 10:00:00 AM, the data-collection rate is 1
hour, and the Data Logger enters runtime mode at 10:15:00 AM, the data-collection and datalogging activity for the selected logging group will start at 11:00:00 AM.
On interval. When On Interval is checked, you can specify the time period (interval) during which
you want data logging and data collection to start.
On condition. When On Condition is checked, you can define a specific condition for starting data
logging. Once you check this box, you can click the Browse (…) button on the right. This will display
the Edit Expression dialog box. Refer to the Expression Editor help documentation for more
information.
On start. Checking On Start starts data collection and data logging for the selected group whenever
the Data Logger enters runtime mode (default selection).
2.38
Introduction
Logging Group Stop Conditions
The Stop Conditions field contains the following options for stopping data collection.
On time. When On Time is checked, data logging and data collection for the selected group will
stop at a specified time in hours, minutes, and seconds.
On interval. When On Interval is checked, you can specify the time period (interval) during which
you want data logging and data collection to stop.
On condition. When On Condition is checked, you can define a specific condition for stopping
data logging. Once you check this box, you can click the Browse (…) button on the right. This
opens the Edit Expression dialog box. Refer to the Expression Editor documentation for more
information.
Logging Tab
The Logging tab in the Logging Group dialog box, shown below, determines the settings and
conditions for the storage of historical information to the database for the selected logging group. It
also provides excellent load-balancing capabilities when writing to disk.
Logging Tab
2.39
TrendWorX Logger Configurator
The manner in which the collected data are actually logged to the database by the Data Logger is
determined by the settings on the Logging tab. The On Time check box refers to a data-logging
time. On Interval refers to a selected time period during which data logging occurs (for example,
every 30 minutes). The logging subinterval is used for tags, which have this option enabled. It
basically averages samples, at the selected subinterval, prior to logging to disk. If the option for the
tag is not enabled, and the tag is not configured to log all values, only one averaged sample will be
data-logged.
Note: The fastest time allowed for logging data to disk is 5 seconds.
Enter the appropriate fields in this section as described below. Click Apply to implement the
settings.
On time. When On Time is checked, you can specify the data-logging time in hours, minutes, and
seconds.
On interval. When On Interval is checked, you can specify the time period (interval in hours,
minutes, and seconds) during which you want you want data logging to occur.
On condition. When On Condition is checked, you can define a specific condition for data logging.
Once you check this box, you can click the Browse (…) button on the right. This opens the Edit
Expression dialog box. Refer to the Expression Editor documentation for more information.
On records. When On Records is checked, every time the desired number of samples is collected
for any of the tags within the logging group, it will log the data to the server. Checking this check box
allows you to request data logging on records only.
Table Management Tab
The Table Management tab in the Logging Group dialog box, shown below, enables you to
configure the data-logging process such that a new table can created from the data when requested.
This allows a better overview of the data than a continuous stream of data would. Enter the
appropriate fields in this section as described below. Click Apply to implement the settings.
Table Management Tab
Each group of signals stores its data to a single table or a cyclic sequence of tables (userconfigurable). This allows for a controlled size of database storage. For example, you can set up the
data-logging configuration for a group such that the data are stored to multiple, sequential tables.
Trend clients may be configured to retrieve data from the most recent tables, while the other tables
are maintained for reporting and comparison with recent data. Although historical information is
retrieved by combining information from various historical tables, the ability to store data in multiple
2.40
Introduction
(sequential) tables can be used for database maintenance optimization as well as overall system
load balancing. By controlling the size of each historical table, you can avoid creating extremely
large tables, which may degrade overall data logging and database performance.
To accelerate data retrieval, TrendWorX SQL Server creates the necessary database schema to
maintain updated information with respect to the time interval for which each table logs data.
The Table Management tab configures how the data will be stored in terms of the number of tables
and when a new table will be started. The number entered in the Number of Tables field
determines the maximum number of tables that will be created. Therefore, when that number is
reached and the last table is full, the TrendWorX SQL Server will wipe out all information in the first
table to make room for new data. This is important to remember when configuring the settings in the
Create New Table field. The reason for limiting the number of tables is to save room in your system.
Table name. Enter the name of the table.
Number of tables. Use the "up" and "down" arrows to specify the number of tables you want
created. The maximum number of tables allowed in the Number of Tables field is 3000.
Startup table. Use the "up" and "down" arrows to specify the number of tables you want created at
startup.
Create new table. This section specifies certain conditions that will determine when a new table
should be created.
On time. When On Time is checked, you can specify a time in hours, minutes, and seconds when
you want a new table to be created.
On interval. When On Interval is checked, you can specify a time period (in days, hours, minutes,
and seconds) after which a new table should be created during the data-logging process.
On condition. When On Condition is checked, you can define a specific condition upon which the
creation of a new table is contingent. Once you check this box, you can click the Browse (…) button
on the right. This displays the Edit Expression dialog box. Refer to the Expression Editor
documentation for more information.
Any time logging starts. When option is checked, table management will occur the moment
logging starts.
Control Board for Groups
The Control Board is common to all dialog boxes used for group configuration. The Control Board
allows you to control the server status as well as activation and deactivation of data logging for the
selected logging group.
Status. This communicates the status of the server.
Activate. Clicking the Activate button activates a logging group. Once the logging group is
successfully activated, depending on its configuration, all data-logging and data-collection activity for
the selected group begins.
Deactivate. Clicking the Deactivate button tells the server to deactivate a logging group. Once the
logging group is successfully deactivated, all data-logging and data-collection activity for the
selected group stops.
Group Information
Clicking the Get Statistics button opens the Group Statistics dialog box, shown below. This dialog
box has two main sections: Current Timing and Overall Timing.
2.41
TrendWorX Logger Configurator
Group Statistics Dialog Box
Current timing. This section shows the time:
•
To get a database connection.
•
For a table to open.
•
For data preparation.
•
To log data.
•
Since the logging group last logged historical data to the database (in seconds).
Overall timing. This section shows the minimum and maximum time for the server to open a group.
It also shows the minimum and maximum time it took for data logging since the logging group
entered data-collection and data-logging mode.
Note: If the maximum time to open or log keeps increasing, there might be a problem with your
server or overall available system and hardware resources.
Creating a New Tag
To create a new tag:
1.
2.42
Right-click a logging group and select New > OPC Tag (you can also create a new expression)
from the pop-up menu.
Introduction
Creating a New Tag
2.
This opens the Unified Browser. (If you select Expression, the Edit Expression dialog box
will open.) The Unified Browser allows you to navigate all of the installed OPC servers on the
local computer or a network. Browse to the desired OPC tag, and then click OK. The tag you
have just added will be displayed in the Configurator screen at the Tag level and under the
Group level, as shown in the figure below.
3.
Configure the fields described below, and then click Apply to implement the configuration.
Note: TrendWorX SQL Data Logger does not support data logging of string type tags (signals).
Data Logging Tag Configuration
Configuring Tag Properties
You can configure the following tag settings using the tag configuration dialog box, as shown in the
figure below.
2.43
TrendWorX Logger Configurator
Data Logging Tag Configuration
Each group maintains a collection of individual tags. These signals can be OPC signals or
calculated signals. Each signal can be configured with respect to various attributes, such as
deadband and logging.
Signal name. The Signal Name field shows the actual signal (tag or point) name or expression.
When you click the tag name in the left-hand pane of the TrendWorX Configurator screen, the tag
name or ID, which uniquely identifies the tag, is displayed in the Signal Name field, as shown
above.
Description. This field contains a description of the actual signal. For Unicode applications, the
description can be language-aliased so that trend clients will use the translated description during
animation (runtime) mode. TrendWorX Reporting uses the Description text on a per-report tag
basis. This option, if used, will label the resulting data columns of the target report using the defined
Description entries in the TrendWorX Configurator. By default, when a signal is inserted in the
TrendWorX Configurator, the Description entry of the signal will be its logging name. You can
override the Description field, which will be used to label the resulting data column in the final
report. If the Description field in the TrendWorX Configurator is left empty, the logging name will be
used to label the resulting data column of the report. The TrendWorX Reporting application will still
display in the tree view or edit dialogs the report tags using their logging names.
In addition, for the Unicode version of TrendWorX Reporting, the Description field can be languagealiased to be used with various languages.
Logging name. Initially the signal’s Logging Name is set to match the actual tag’s (point) name.
You can override this setting and choose a more appropriate name such as “Temperature
Measurement”. This, in turn, will represent the “signal name” by which historian clients will access
the data logged for that signal. If the signal is an expression, its logging name should be replaced
with a description that does not include expression specific syntax.
Note: You can configure the same OPC tag for data logging multiple times under the same logging
group in order to log historical information for the tag using various data-logging filters. However, the
corresponding logging names must be different so that the historical replay will clearly identify the
related tags.
2.44
Introduction
Note: Avoid using long logging names. If reporting will be used, logging names should be a
maximum of 60 characters. If the tag is an expression, the logging name should be modified not to
contain expression symbols or mathematical symbols. In addition, avoid using special characters,
such as @, #, &, *, $, !, ^, %, ~, and ?.
Engineering units. This field allows you to enter engineering units that will be used. For a Unicode
application, the Eng. Units field can be language-aliased, and as a direct result, the trend clients will
scale the historical data upon switching to a new language.
When specifying a language alias in the Description and Eng. units fields, you can also select a
language alias from the Language Alias tab of the Unified Browser, which includes all language
aliases in the language database. This eliminates the need to manually type in the alias name.
Clicking the ... button opens the language alias browser. The browser includes all languages aliases
in the language configuration database. All language aliases that are configured in the Language
Configurator are conveniently available to choose from inside the browser. The tree control of the
Language Configurator is mimicked in the tree control of the language alias browser. Select a
language alias by double-clicking the alias name. The alias name appears at the top of the browser,
which automatically adds the /+ and +/ delimiters to the alias name. Click the OK button.
Deadband. Each group can also have an individual data-logging deadband and filter for each tag
(signal) it maintains. For instance, you may choose to log data for all values retrieved from a certain
OPC data server, or for the average of the values over a period of time. In addition, you can
configure a deadband value (absolute or percentage) for each signal.
The Deadband field allows you to specify a specific (absolute) operational value or a percentage of
operation value a signal must change before the server updates with the new value. The deadband
is always computed using the most recent sample value, and it is not based on the High/Low range
sample information. A deadband value of 0 results in storing all samples to the database.
Ranges. The Hi Limit field sets the values for the tag's high limit. The Lo Limit field sets the values
for the tag's low limit. In addition, if Update Ranges on Start is checked, the ranges for each tag will
be refreshed from the OPC server. This ensures that ranges for this tag will be updated at the start
of data logging.
Log to Disk
Clicking the Simple/Advanced button hides/shows the Log to Disk options. The Log to Disk field
allows you to select the value(s) of the signal to log to the disk. If All Samples is selected, the server
will log all values for that signal that were collected during that specific data-collection period. Max
will log the maximum of these values. Min will log the minimum of these values. Avg will log the
average of these values. Stnd. Dev. will log the standard deviation of these values. Totalizer will
run the totalizer function for these values. Running Max will log the running maximum of these
values. Running Min will log the running minimum of these values. Running Avg will log the
running average of these values (computed using an exponentially weighted moving average filter).
Moving Min will log the moving minimum of these values. Moving Max will log the moving
maximum of these values. Moving Avg will log the moving average of these values (computed
using a Moving Average filter). These functions are described below in greater detail.
Use calculation period. Checking this box ensures that the calculation period set at the Group
level settings will be used.
All samples. Writes to the database all samples collected for the specific tag within each logging-todisk period.
Maximum. Writes to the database the maximum value of all samples collected for the specific tag,
calculating the maximum value over the calculation period defined for the logging group (if enabled).
If the calculation period is not enabled, the entire maximum value for all the available samples at the
time of writing to disk will be logged to the database.
Minimum. Writes to the database the minimum value of all samples collected for the specific tag,
calculating the minimum value over the calculation period defined for the logging group (if enabled).
If the calculation period is not enabled, the entire minimum value for all the available samples at the
time of writing to disk will be logged to the database.
Average. Writes to the database the average value of all samples collected for the specific tag,
calculating the average value over the calculation period defined for the logging group (if enabled). If
2.45
TrendWorX Logger Configurator
the calculation period is not enabled, the entire average value for all the available samples at the
time of writing to disk will be logged to the database.
Standard deviation. Writes to the database the standard deviation value of all samples collected for
the specific tag, calculating the standard deviation value over the calculation period defined for the
logging group (if enabled). If the calculation period is not enabled, the entire standard deviation
value for all the available samples at the time of writing to disk will be logged to the database.
Totalizer. If the Totalizer data-logging filter is selected, there are additional options that you can
select or enable, as shown in the figure below.
Totalizer Field in Tag Configuration Dialog Box
The Totalizer field contains the following options:
•
The Units field sets the integration constant for the totalizer filter. It can be seconds, minutes,
hours, or days.
•
The Type field sets the type of totalizer filter, which can be "Continuous," "Preload," or
"Preset."
•
The Initial/Preset Value field sets the Initial (Pre-loaded) or Preset value based on the totalizer
type used.
•
The Autoreset field sets the autoreset mode and value of the totalizer. It can be value-based
or time-interval based, as shown in the figure below. Once the condition is met, the totalizer will
reset to the configured levels.
•
The Count Option field sets the integration direction of the totalizer. It can be "Upward" (from a
given value) or "Downward" (to a given value).
Autoreset Options
Running maximum. Writes to the database the running maximum value of all samples collected for
the specific tag, continuously calculating the maximum value over the entire data-logging period.
Running minimum. Writes to the database the running minimum value of all samples collected for
the specific tag, continuously calculating the minimum value over the entire data-logging period.
Running average. Writes to the database the running average value of all samples collected for the
specific tag, calculating the running average value over the entire data-logging period using an
exponentially weighted moving average (EWMA) filter equation.
2.46
Introduction
If the calculation period is enabled for the tag, and no new samples are received within the
calculation time period, the Data Logger will use the last known value to provide a more accurate
EWMA estimate. In addition, if new samples are being received irregularly, the Data Logger will try
to "backfill" missing samples (by using the last known value) in order to provide a more-accurate
EWMA estimate. This way the Data Logger accommodates slowly changing signals, which, due to
the event nature of OPC data updates, change less frequently than the desired data collection. If the
calculation period is not enabled, the Data Logger will still try to "backfill" missing samples (by using
the last known value), but no new historical values will be entered to the database until a new
(updated) sample arrives. The following EWMA filter equation used is:
EWMA(n) = coefficient * Measurement(n) + (1 -coefficient)*EWMA(n-1)
In this equation, n is the sample count, and coefficient is a constant typically chosen to be between 0
and 1. From this equation, we can view the EWMA estimate as a weighted average of all past and
current measurements, with the coefficients of each new measurement declining geometrically.
From this point of view, it is an ideal filter equation to use in the case of random individual
measurements. In order to accelerate the filter convergence, the Data Logger will use the following
equation:
EWMA(n) = (1/n+1) * Measurement(n) + (n/n+1)*EWMA(n-1)
Until n = 32 (i.e. using the first 32 samples). After the first 32 samples, the value of the coefficients in
the EWMA equation will stay constant.
Moving maximum. This option is similar to the moving average, except that it computes the moving
maximum value of the samples collected.
Moving minimum. This option is similar to the moving average, except that it computes the moving
minimum value of the samples collected.
Moving average. Writes to the database the moving
specific tag, calculating the moving average value
Moving Average filter equation similar to the one
average for each period is based on the average
preceding periods.
average value of all samples collected for the
over the entire data-logging period using a
used by Microsoft Excel, where the moving
value of the tag over a specific number of
If the calculation period is enabled for the tag, the Data Logger will use the calculation period to
define the order of the moving average filter. By default, it will use a fourth order filter, which means
that four previous samples will be used in computing a moving average estimate for each time
interval. Also, if no new samples are received within the calculation time period, the Data Logger will
use the last known value to provide a more accurate moving average estimate.
In addition, if new samples are being received irregularly, the Data Logger will try to "backfill"
missing samples (by using the last known value) in order to provide a more accurate moving
average estimate. This way, the Data Logger accommodates slowly changing signals, which, due to
the event nature of OPC data updates, change less frequently than the desired data collection. If the
calculation period is not enabled, the Data Logger will still try to "backfill" missing samples (by using
the last known value), but no new historical values will be entered to the database until a new
(updated) sample arrives.
Note: For all data-logging filters in which calculation is involved, the quality of the "calculated"
sample is based upon the qualities of the samples participating in the calculation. If any of them are
bad, the calculated sample will be marked with bad quality. For running averages, if the quality of the
new sample coming in is bad, the historical sample logged to the database will have the last EWMA
computed value, with updated time stamp (the time stamp of the actual sample) and uncertain
quality.
Note: TrendWorX SQL Server supports a variety of data-logging filters, which you can customize to
meet specific needs. These filters can also provide considerable levels of data-logging compression
and disk space savings. For example, if you are setting up a monitoring application at a high-speed
data-collection rate, where only certain statistical values are required to be historically archived,
using data-collection filters and calculation period can considerably save disk space used for data
storage and improve historical data replay performance.
2.47
TrendWorX Logger Configurator
Troubleshooting Data Logging
Using a technology that has been incorporated into all Smar products, TraceWorX provides online
diagnostics and tuning of applications running in the ProcessView system. TraceWorX is designed
expressly for systems integrators, OEMs and customers who want to have tools for doing their own
troubleshooting and diagnostics.
TraceWorX tracks the runtime activity for the TrendWorX SQL Data Logger and logs the runtime
data to a log file based on user-configured trace levels. The log file provides a thorough, color-coded
report detailing all activity for the application, including the time, the date, the severity level, and a
description of the event or problem.
TraceWorX also features several options for reporting issues to technical support. If you are
experiencing problems with any applications, the log file deployment options, such as compressing
and e-mailing log files, are ideal for tracking and archiving data and sending detailed reports to
technical support. Developers can use these reports to identify the source of the problems.
Please see the TraceWorX Help documentation for more information.
2.48
Chapter 3
SQL DATA LOGGER
Introduction
The primary purpose of TrendWorX 32-bit data logging is to provide both a data-collection system
and a data-retrieval station for historical data to trending and reporting clients. The TrendWorX SQL
Data Logger:
•
Collects real-time data from OPC servers.
•
Logs real-time data to a database.
•
Provides data-retrieval capability by implementing a draft of the OPC HDA (Historical Data
Access) specification.
•
Provides data-retrieval services locally and remotely across computer boundaries via DCOM.
The following diagram shows the internal system architecture of the TrendWorX SQL Data Logger:
Trending and Data Logging Architecture
The TrendWorX SQL Data Logger is a true 32-bit Windows application written from the ground up to
take advantage of 32-bit operating systems for multitasking and load distribution across multiple
threads and processors. The TrendWorX SQL Data Logger not only contains data-logging and dataretrieval historian services, but it also adds a scalable, client-server architecture to the ProcessView
trending software. This architecture ensures optimal load balancing and distribution, even for largescale applications.
The TrendWorX SQL Data Logger uses the most current data-access technology called (ActiveX
Data Objects) ADO. ADO is a database-access mechanism that provides a wrapper of the OLE DB.
OLE DB is a COM approach to database programming that can be used to program any database
(relational or not relational) as long as there is a dedicated OLE DB data provider for that database.
The end result is that applications based on ADO/OLE DB can potentially access any database
regardless of the underlying storage media, file system, and location. TrendWorX SQL Data Logger
currently uses ADO version 2.5, the Universal OLE DB ODBC data provider supplied by Microsoft,
as well as native OLE DB providers to access Microsoft Access, Microsoft SQL Server, MSDE, and
Oracle-compliant databases.
3.1
TrendWorX SQL Data Logger
Functional Diagram of TrendWorX SQL Data Logger
TrendWorX SQL Data Logger can be deployed using the same PC on which the database resides,
or using a different PC that is networked to the database. In addition, you can have TrendWorX SQL
Data Logger is deployed on multiple PCs data logging to the same (or different) databases,
therefore providing a scalable and distributed data-logging architecture.
TrendWorX SQL Data Logger Multiple Database Capability
A key feature of TrendWorX SQL Data Logger is its ability to handle data logging and data retrieval
with respect to multiple types of databases concurrently, therefore enabling you to develop a very
cost-effective data-logging and data-retrieval application.
TrendWorX SQL Data Logger will support data logging and data retrieval to or from:
3.2
•
Microsoft Access
•
Microsoft SQL Server 6.5, 7.0, and 2000
•
MSDE 7.0 and 2000
•
Oracle 8.0
Introduction
TrendWorX SQL Data Logger is a MFC/ATL free-threaded server application that performs data
logging and data retrieval by implementing a draft of the OPC HDA (Historical Data Access)
specification.
Configuration
The configuration layout of the TrendWorX SQL Data Logger is quite similar to that of an OPC
server configuration. The key concept here is the database group object, which replaces the
device of the OPC data server configuration.
A database group object represents a:
•
High-level grouping of groups of signals to data log.
•
Multithreaded object for managing data updates and logging-to-disk activities along with
extensive runtime user interface.
•
Physical connection to an underlying database.
In addition, each database maintains a list of recent errors for troubleshooting, which can be in the
TrendWorX Logger Configurator.
Each database group object is responsible for managing data-logging groups of signals. A datalogging group includes:
•
A logical collection of signals to be data-logged.
•
Common data-collection rate and data-logging table
•
Common data-logging configuration.
•
Group style management and editing capability for a collection of signals.
For more information, refer to the TrendWorX Logger Configurator Help documentation.
Features of the TrendWorX SQL Data Logger
Key features of the TrendWorX SQL Data Logger include:
•
Database connection dialog
•
Enhanced data-retrieval support
•
Microsoft ADO 2.7 support
•
TraceWorX debug support
•
Expression support
•
Daylight savings time support
Note: TrendWorX up to and including Version 6.1x is using the Windows-based APIs for converting
a time from local time to UTC or from UTC to local time. The Windows APIs do not correctly adjust
the conversion for the daylight savings time if the timestamp to be converted was obtained from a
different time period (i.e. it was obtained in "summer" time but now we have "winter" time).
TrendWorX Version 7.x introduced new time conversion utilities that account for this discrepancy.
There are, however, some things to consider:
•
These functions are used by default (no user enabling is required).
•
This is what they do in order to convert each time stamp:
o They check Windows for the PC Time Zone Settings and to see if automatic daylight savings is
enabled.
o They also obtain from Windows the times/dates for switching over. (These dates do not
change; they are in the form of, e.g., the first Sunday of April.)
3.3
TrendWorX SQL Data Logger
o Depending on the previous information, the new functions properly adjust the conversion times
to compensate for daylight savings time.
Other features include:
•
NT service support for TrendWorX SQL Data Logger.
•
Support for operator comments.
•
Support for batch and lot tracking.
•
Microsoft SQL 2000 and Microsoft MSDE 2000 support.
•
Data-logging filters
•
MSDE Manager application for managing MSDE-based data-logging applications.
•
ProcessView Tray support and integration.
•
Remote configuration support.
•
Data logging tuning parameters.
•
ADO 2.5 and 2.6 integration.
•
Support for logging tag descriptions.
•
TrendWorX SQL Data Logger Configurator.
•
Support for Oracle data logging.
•
Support for MSDE data logging.
•
Integration of native OLE DB providers for faster data replay.
•
Asynchronous historical data retrieval for faster updates of real-time historical trends.
•
UTC support for data logging. (See the note below.)
•
Condition/event-handling mechanism.
•
Scheduling for minimizing system load and fully decoupling data logging from data collection,
while supporting data-logging retrials in cases of failure.
•
Support for hot database switching during runtime mode without stopping data-logging activity.
In this scenario, you can use the TrendWorX Logger Configurator or OLE Automation to select
a new database for data logging. You have the option to redirect pending writes to the new
database or log them to the current one.
•
OLE Automation interface to data logging.
•
Integration of data-logging activity into the GenEvent Registrar.
•
Support for data logging the same OPC tags in the same data-logging group but under a
different-logging name.
•
Integration of native OLE DB providers for faster replay and decreased CPU usage.
Note: UTC support refers to data logging the time stamps of samples in the UTC time format.
However, all clients will replay historical data using the "local" (non-UTC) client time, unless they are
otherwise configured.
3.4
Introduction
Upgrading to Versions 6.00 and 6.10
Upgrading From Version 5.20 to Version 6.0
The biggest change in terms of upgrading an existing application of Version 5.20 to Version 6.0 is
the new approach to data-logging configuration and administration. Now the configuration
information of the TrendWorX SQL Data Logger server ("TWXSQLSvr.exe") is stored in a database
file. By default, this file is in a Microsoft Access (.mdb) file format. The TrendWorX Logger
Configurator tool configures data-logging and then downloads the configuration data to the datalogging server, which may be local and/or remote. The most important step here is upgrading an
existing 5.20 data-logging configuration to the new Configurator database. To upgrade from Version
5.20 to Version 6.00, use the procedure outlined in the following sections.
Note: It is suggested that you back up all-important historical data and or current (*.txd)
configuration files prior to upgrading to the new database Configurator tool.
Upgrading From Version 6.00 to Version 6.10
To upgrade from Version 6.00 to Version 6.10, you simply need to open the TrendWorX Logger
Configurator and select the configuration database file to be upgraded to the Version 6.10 format.
The TrendWorX Logger Configurator will automatically convert the configuration .mdb file to the
Version 6.10 format.
Upgrading From Version 5.20 to Version 6.00: Step 1
Start the TrendWorX SQL Data Logger from the Programs menu in Windows.
TrendWorX SQL Data Logger Screen
Upgrading From Version 5.20 to Version 6.00: Step 2
From the File menu, choose Open to open the file that you want to export to the new Configurator
database.
Upgrading From Version 5.20 to Version 6.00: Step 3
From the File menu, choose Export Configuration. This opens the Export Configuration dialog
box, shown below.
3.5
TrendWorX SQL Data Logger
Export Configuration Dialog Box
The updated installation for Version 6.0 will install the following files under the ProcessView "Bin"
directory:
•
"Twx32Cfg.src"
•
"Twx32.mdb"
The first file ("Twx32Cfg.src") is a "template" file for generating default ("empty") configuration
databases. The second file ("Twx32.mdb") is a configuration database file that is ready to use. Upon
proper installation, when the Export Configuration dialog is opened it should list the OLE DB
Provider and the Connection String to the default configuration database file ("Twx32.mdb"), as
shown in the figure above.
If this is not the case, select Microsoft Access as the OLE DB provider, and then click Set. This
opens the OLE DB Initialization Information dialog box, shown below. In the Data Source field, fill
in the correct pathway to the "Twx32.mdb" configuration file, including the ".mdb" Microsoft Access
file extension, to properly establish a configuration database connection. Then click OK.
OLE DB Initialization Information Dialog Box
3.6
Introduction
Click Export in the Export Configuration dialog box to export your configuration(s) to the
Configurator database. From this point on, the TrendWorX SQL Data Logger will:
•
Use as the current configuration the last-exported configuration, unless otherwise assigned by
the new Configurator tool.
•
Always load (upon startup) the most-recently assigned database configuration by the
Configurator application, or the most-recently exported database configuration.
Upgrading From Version 5.20 to Version 6.00: Step 4
When you have finished exporting databases, shut down the TrendWorX SQL Data Logger.
Upgrading From Version 5.20 to Version 6.00: Step 5
Start the TrendWorX Logger Configurator from the Programs menu in Windows. Choose Open
from the File menu to select the "Twx32.mdb" file. By default, the TrendWorX Logger Configurator
will load all of the exported configurations, as shown in the figure below. When a configuration is
selected, the TrendWorX Logger Configurator will start the TrendWorX SQL Data Logger through
OLE Automation.
Setting Up a Configuration Database
Note: The TrendWorX Logger Configurator is integrated into the TrendWorX SQL Data Logger
through a COM interface. This means that if the TrendWorX SQL Data Logger is started from within
the TrendWorX Logger Configurator, and if no other application is referencing the TrendWorX SQL
Data Logger, the TrendWorX SQL Data Logger will shut down after stopping data logging (if it is
enabled within the Configurator) once the TrendWorX Logger Configurator is exited. The exception
to this rule is when the TrendWorX SQL Data Logger is registered to run as an NT service.
Note: Since the ProcessView version 5.20 release, the database access tools used by TrendWorX
(such as OLE DB and ADO) have been updated by Microsoft. ProcessView installation will always
install the latest available version of these tools at the time of releasing the ProcessView product. It
is recommend that, once the existing Version 5.20 TrendWorX SQL Data Logger configurations
3.7
TrendWorX SQL Data Logger
have been successfully exported to the new TrendWorX Logger Configurator, you re-establish their
connections to the databases so that any new settings on the database connections are
automatically updated in the new Configurator database. In addition, you can test the new database
connections both for data writes and data reads by clicking the Perform Test button in the
TrendWorX Logger Configurator.
Choosing a Database
The TrendWorX SQL Data Logger supports the following databases as storage media for its data:
•
Microsoft Access
•
Microsoft SQL Server 6.5, 7.0, and 2000
•
Microsoft Data Engine (MSDE) 7.0 and 2000
•
Oracle 8.0
Note: The TrendWorX SQL Data Logger support for Oracle assumes that Oracle will be running on
an NT Server station and that the Data Logger will connect to an Oracle Database for data logging
using the latest ODBC driver for Oracle.
Note: Microsoft SQL Server 2000 performs better than Microsoft SQL Server 7.0 and uses less
memory and CPU capacity at the expense of increased use of hard-disk space. The same applies
when comparing MSDE 7.0 with MSDE 2000.
Data storage requirements refer to the size of the target database once data collection and data
storage begin. Again, the differences between Microsoft Access and Microsoft SQL Server arise
from the fact that Microsoft Access is a file-based database engine, while Microsoft SQL Server is a
server-based database. As a result, Microsoft Access databases are limited by the capacity of the
hard disk on which they reside, while Microsoft SQL Server databases can expand across multiple
hardware devices. In addition, Microsoft SQL Server can be configured to increase the database
size automatically, if needed, while data logging is activated. The size of MSDE databases is limited
to 2 GB, and the size of Microsoft Access databases is limited to 1 GB. To compute an estimate of
required database size, on a per-group basis, use the following equation:
Total Number of Records = (Number of Tags x Total Logging Period (in secs)) / (36 x DataCollection Rate (in secs))
Required Size = (Total Number of Records) x (1024 Bytes/Record) x (1.5) for Microsoft SQL Server
7.0 or MSDE 7.0
Required Size = (Total Number of Records) x (1024 Bytes/Record) x (2.0) for Microsoft SQL Server
2000 or MSDE 2000
The above size calculation does not include the transaction log space used by Microsoft SQL Server
or MSDE. Typically it should be a fraction of the data storage space.
Example
For example, assume you want to data log 100 tags with a data-collection rate of 1 second and a
total data-logging period of 24 hours (converted to seconds). This will require the following storage
for Microsoft SQL Server 7.0 or MSDE 7.0:
Total Number of Records = (100) x (24 hours x 60 min/hr x 60 sec/min) / (36 x 1 sec) =240,000
Records
Required Size = (240,000) x 1,024 x 1.5 = 360 MB per day
Note: When you are logging data to an Oracle database, you can expect a minimum 20 percent
increase in database size because of the data types supported by Oracle. Typically in a Microsoft
Access database historical data logging the fragmentation occurs even when historical data tables
are deleted or truncated. Microsoft Access will not reclaim the space the deleted data occupied, and
as such its size it will keep growing until the next time it is compacted.
Note, however, that the above example is a worst-case scenario that assumes all tags are updated
3.8
Introduction
every second from the OPC server. In reality, OPC servers are event-based, so they will update only
when the value of the tag changes. The TrendWorX SQL Data Logger also supports various datalogging filters, on a per-tag basis, as well as deadband. These can be used to reduce the databasestorage requirements effectively. When the targeted size of the database is more than 1 GB, it is
recommended that you use Microsoft SQL Server or MSDE (for up to 2 GB) instead Microsoft
Access.
To help you in maintaining the target database size and avoiding situations in which the database
size grows uncontrolled, the TrendWorX SQL Data Logger supports a cyclic database table
structure, which if configured will always maintain the configured number of tables into the database
by overwriting existing data as it rolls over each table. Refer to the TrendWorX Logger Configurator
documentation for more information.
In addition, keep in mind that ordinary database maintenance tasks, such as defragmentation,
compaction, and table index updates, may require additional space on the target device(s), which
can vary depending on the database tasks under operation. It is recommended that you allow for
additional device space in these cases.
The basic criteria for choosing a suitable database for the target application are:
•
Data-Logging Load
•
Data-Storage Requirements
•
Load of Client Connections
•
Database Backup and Maintenance
Data-Logging Load
The data-logging load refers to the total number of tags and the frequency of data-logging activity.
The TrendWorX SQL Data Logger has a hierarchical tag organization. In this hierarchy, the tags are
organized into groups, which belong to a specific database group that is logging data to a dedicated
database. Each tag within a group logs data to the same table. This is a great advantage to you in
terms of load-balancing a data-logging application by staggering data-collection or data-logging
activities over time.
File-Based Versus Server-Based Databases
Microsoft Access is a file-based database, whereas Microsoft SQL Server, MSDE, and Oracle are
server-based databases. The main difference is that Microsoft Access can handle data logging for
a small-to-medium load of tags, whereas Microsoft SQL Server and MSDE can handle data logging
for a much larger load of tags. When the total number of tags is less than 300, and the datacollection rates average 5 seconds or more, a Microsoft Access database can be a reasonable
choice. When the total number of tags is more than 300, Microsoft SQL Server or MSDE databases
are the only choice. Oracle has been shown to have less data-logging capability than Microsoft SQL
Server.
Microsoft Access may also be a valid choice for noncontinuous data logging that involves a small
number of tags with very fast data-collection rates. TrendWorX SQL Data Logger uses event-based
updates, and will only store the samples sent by the OPC server to the target database, thereby
reducing the overall data-logging load.
Microsoft SQL Server and MSDE can use hardware resources to yield great performance, even in a
multiuse environment. In addition, some other load-balancing strategies include:
•
Trading off slower writes to the database for a higher tag count or faster data-collection rates.
•
Having one hard drive for data logging and separate one for storing operator displays, program
files, and the operating system if graphics (HMI) displays are present on the actively datalogging PC.
Data-Storage Requirements
Data storage requirements refer to the size of the target database once data collection and data
storage begin. Again, the differences between Microsoft Access and Microsoft SQL Server arise
from the fact that Microsoft Access is a file-based database engine, while Microsoft SQL Server is a
server-based database. As a result, Microsoft Access databases are limited by the capacity of the
3.9
TrendWorX SQL Data Logger
hard disk on which they reside, while Microsoft SQL Server databases can expand across multiple
hardware devices. In addition, Microsoft SQL Server can be configured to increase the database
size automatically, if needed, while data logging is activated. The size of MSDE databases is limited
to 2 GB, and the size of Microsoft Access databases is limited to to 1 GB. To compute an estimate
of required database size, on a per-group basis, use the following equation
Total Number of Records = (Number of Tags x Logging Interval) / (36 x Data-Collection Rate)
Required Size = (Total Number of Records) x (1024 Bytes/Record) x (1.25)
Example
For example, assume you want to data log 100 tags with a data-collection rate of 1 second and a
logging interval of 24 hours (converted to seconds). This will require the following:
Total Number of Records = (100) x (24 hours x 60 min/hr x 60 sec/min) / (36 x 1 sec) = 240,000
Records
Required size = (240,000) x 1,024 x 1.25 = 295 MB per day
Note: When you are logging data to an Oracle database, you can expect a 20 percent increase in
database size because of the data types supported by Oracle. When logging to Microsoft SQL 2000
or MSDE 2000 databases, you can expect a 20 percent increase in database size.
Note, however, that the above example is a worst-case scenario that assumes all tags are updated
every second from the OPC server. In reality, OPC servers are event-based, so they will update only
when the value of the tag changes. The TrendWorX SQL Data Logger also supports various datalogging filters, on a per-tag basis, as well as deadband. These can be used to reduce the databasestorage requirements effectively. When the targeted size of the database is more than 1 GB, it is
recommended that you use Microsoft SQL Server or MSDE (for up to 2 GB) instead Microsoft
Access.
To help you in maintaining the target database size and avoiding situations in which the database
size grows uncontrolled, the TrendWorX SQL Data Logger supports a cyclic database table
structure, which if configured will always maintain the configured number of tables into the database
by overwriting existing data as it rolls over each table. Refer to the TrendWorX Logger Configurator
documentation for more information.
In addition, keep in mind that ordinary database maintenance tasks, such as defragmentation,
compaction, and table index updates, may require additional space on the target device(s), which
can vary depending on the database tasks under operation. It is recommended that you allow for
additional device space in these cases.
Load of Client Connections
The load of client connections refers to the capacity of the database to handle multiple users
connected to the database for reading or writing data. Typically, writing to a database is a much
more expensive and slower operation than reading data is. The TrendWorX SQL Data Logger uses
connections to the database for logging data, previewing historical data, providing data-logging
information, and performing some maintenance on the database. In addition, TrendWorX Reporting
tools use connections to the database.
The TrendWorX SQL Data Logger uses by default one constantly open connection to the underlying
database while the database group is in runtime mode and data collection is activated. Note that you
can modify this behavior in the TrendWorX Logger Configurator by disabling the Use Global
Connection option. In this case, the database connection will be opened only during the log-to-disk
process. It is recommended that the Use Global Connection option be disabled only when the logto-disk times are slow (e.g. about every 15 minutes) or the number of logging groups is small.
The TrendWorX SQL Data Logger will also open database connections on behalf of TrendWorX
Viewer ActiveX historical clients. There will be one database connection per client Viewer while
historical data are retrieved. Once the historical data read operation is completed, the TrendWorX
SQL Data Logger will close this database connection.
TrendWorX SQL Tool ActiveX Control, TrendWorX Reporting, and the TrendWorX OLE DB Provider
will also use database connections for configuration and data retrieval. These database connections
remain open while data are retrieved, and then they are closed by the applications that created them
when all historical data retrieval is completed.
3.10
Introduction
If you anticipate that more than 10 database connections will be open at any time, it is
recommended that you use Microsoft SQL Server instead of Microsoft Access. Microsoft Access
cannot handle a large number of simultaneous connections, whereas Microsoft SQL Server,
because of its Enterprise architecture, can. In addition, remember that MSDE performance
decreases with more than five active (open) connections to an MSDE database. However, both
Microsoft SQL Server and MSDE offer central, server-like memory management of all database
connections, thereby providing better system-resource management than Microsoft Access, which
manages each database connection independently (on a per-client basis).
Database Backup and Maintenance
Database backup and maintenance are key factors in choosing a suitable database for the target
application. You will need to back up historical data, perform periodic maintenance on the database,
and defragment the database after extended periods of use. Microsoft Access does not offer most of
the above while client database connections are open. In addition, it requires periodic shutdown and
maintenance to deal with data fragmentation issues. Typically in a Microsoft Access database
historical data logging the fragmentation occurs even when historical data tables are deleted or
truncated. Microsoft Access will not reclaim the space the deleted data occupied, and as such its
size it will keep growing until the next time it is compacted. In contrast, Microsoft SQL Server and
MSDE are self-maintaining database engines that can accommodate scheduled backups, periodic
maintenance tasks, defragmentation, and much more. Unlike Microsoft Access, Microsoft SQL
Server and MSDE databases do not require stopping all database activity in order to perform these
tasks.
To maintain your Microsoft Access database:
1. Shut down all data logging, data replay, and reporting applications.
2. Start the TrendWorX Logger Configurator.
3. From the Tools menu choose Compact/Repair MS Access Database, as shown in the figure
below.
Accessing Database Maintenance Tools
4. This opens the Compact/Repair MS Access Database dialog box, as shown in the figure
below. You can choose to compact the configuration database or any other historical Microsoft
Access database. Note that database compaction requires that you have available free hard
disk space equal to the size of the Microsoft Access database prior to compaction. It is a good
idea to always back up any database prior to compaction.
Microsoft Access database compaction should be done after several iterations through the cyclic
table creation configuration of TrendWorX data logging. For example, if the data-logging
configuration is set to create a new table every 1 day and maintain a total of 7 tables, a reasonable
choice for Microsoft Access database compaction should be about every 1 to 6 months, depending
on the volume of data logged.
3.11
TrendWorX SQL Data Logger
Compacting and Repairing Microsoft Access Databases
Setting Up Data Logging
Introduction to Data Logging
Configuring Microsoft Access Databases
Configuring Microsoft SQL Server and MSDE Databases
Configuring Oracle Server Databases
Introduction to Data Logging
To set up data logging, you must first configure the underlying database and set up ODBC data
sources. This can be done within the TrendWorX Logger Configurator by connecting a database
group to an existing database or a new database. It is very critical that the PCs on which the
TrendWorX SQL Data Logger resides have full access to the target database to create, add, delete,
and update tables. Otherwise, data logging cannot be accomplished. To set up a data-logging
source in the TrendWorX Logger Configurator, select a database group and then click the Browse
button in the Data Source Name field, as shown in the figure below.
3.12
Introduction
TrendWorX Logger Configurator
This opens the Select Data Source dialog box, shown below. Choose the Machine Data Source
tab and an existing database.
Select Data Source Dialog Box
Or you can create a new database by clicking New in the Machine Data Source tab of the Select
Data Source dialog box. This opens the Create New Data Source wizard, shown below, which
enables you to configure a new database.
3.13
TrendWorX SQL Data Logger
Create New Data Source Wizard
It is recommended that you configure the new database as a System Data Source so it is available
to any user logged into the specific PC. Click Next to select the corresponding ODBC driver, such
as Microsoft Access, Microsoft SQL Server, or Oracle. Refer to the TrendWorX Logger Configurator
Help documentation for more information on how to configure databases.
Configuring Microsoft Access Databases
To configure a Microsoft Access database, select Microsoft Access Driver (.mdb) in the Create
New Data Source wizard, as shown in the figure below.
Selecting a Microsoft Access ODBC Driver
When you have selected the Microsoft Access driver, click Next to proceed to the final dialog box in
3.14
Introduction
the Create New Data Source wizard, shown below.
Creating a New Microsoft Access Database Connection
Click Finish to configure your new Microsoft Access database. This opens the ODBC Microsoft
Access Setup dialog box, shown below. Enter the Data Source Name and the Description.
ODBC Microsoft Access Setup Dialog Box
Click Select to choose an existing .mdb file. This opens the Select Database dialog box, shown
below.
3.15
TrendWorX SQL Data Logger
Selecting an Existing Microsoft Access Database File
Click Create to create a new .mdb file. This opens the .mdb file directory in the New Database
dialog box, as shown below.
Creating a New Microsoft Access Database File
You can choose a local hard disk or a networked hard disk as the location of your new .mdb file.
Click OK to exit the configuration and establish the database connection.
Note: When creating a new .mdb file, the Microsoft Access configuration dialog box provides the
options of creating a Version 4.x or a Version 3.x compatible .mdb file. By default, Version 4.x is
selected, creating a Jet Engine 4.x compatible .mdb file, which can be opened only in Microsoft
Access 2000. If you have Microsoft Access 97, select the Version 3.x compatibility. In general,
Version 4.x is preferred because it offers greater functionality than the older versions.
Configuring Microsoft SQL Server and MSDE Databases
The TrendWorX SQL Data Logger includes native support for MSDE (Microsoft Data Engine), which
is a Microsoft SQL Server 7.0 or 2000 compatible database engine with the following limitations:
•
3.16
The Maximum database size is 2 GB.
Introduction
• Performance can decrease if more than five connections are open at one time.
However, MSDE is a Microsoft SQL Server compatible engine that can be directly upgraded to the
full Microsoft SQL Server. Thus, database connections to MSDE are identical to the database
connections to Microsoft SQL Server.
To establish an ODBC connection to this database, when configuring a new ODBC data source for
Microsoft SQL Server or MSDE, select the appropriate ODBC driver. To configure a Microsoft SQL
Server or MSDE database, select the SQL Server driver in the Create New Data Source wizard, as
shown in the figure below.
Selecting a Microsoft SQL or MSDE Server ODBC Driver
When you have selected the Microsoft SQL Server driver, click Next to proceed to the final dialog
box in the Create New Data Source wizard, shown below.
Creating a Microsoft SQL Server or MSDE Database Connection
3.17
TrendWorX SQL Data Logger
Click Finish to configure your new database. This opens the Create a New Data Source to SQL
Server dialog box, shown below. Enter the Data Source Name, the Description, and the name of
the Server on which the Microsoft SQL Server or MSDE engine resides.
Create a New Data Source to SQL Server Dialog Box
If it the engine resides on the same PC node as the TrendWorX SQL Data Logger, select "local."
Otherwise select or specify the appropriate server name. Click Next to continue with the Microsoft
SQL Server Security configuration and Connection type. It is recommended that you use the
Windows NT authentication mechanism, which eliminates the need for maintaining individual user
accounts and passwords.
Configuring a Microsoft SQL or MSDE Database Connection
3.18
Introduction
Click Next to continue with the selection of the default database for the connection. Make sure it is
not the master database, but the one created for the purpose of data logging.
Setting the Default Microsoft SQL Server or MSDE Database
Note: When connecting to an Microsoft SQL Server or MSDE database, make sure that the desired
database for historical data logging is selected in the Change the Default Database field, as shown
in the figure above. Otherwise, you will establish a connection to the master database, which is not
recommended.
Click Next to accept or modify the default settings, as shown in the figure below.
Configuring the Default Settings
3.19
TrendWorX SQL Data Logger
Complete the connection configuration by clicking Finish. It is recommended that you test the
established connection by clicking Test Data Source, as shown in the figure below.
Testing a Microsoft SQL Server or MSDE Database Connection
Note: Regardless of the database type, all ProcessView TrendWorX modules, which interact with
databases, will create, modify, drop, and update tables. Therefore, it is critical that the currently
logged-in user has permission to perform these tasks.
Configuring Oracle Databases
The TrendWorX SQL Data Logger includes support for logging data as well as replaying data to and
from Oracle databases. The support for Oracle was developed under the assumption that:
•
ODBC database connections to Oracle are established using the Oracle ODBC Driver 8.05.60,
which is provided by Oracle and is available on the Smar product CD under the Tools directory.
•
Oracle is running on a Microsoft Windows NT station.
To configure an Oracle database, select the Oracle ODBC Driver in the Create New Data Source
wizard, as shown in the figure below.
3.20
Introduction
Selecting the Oracle ODBC Driver
When you have selected the ODBC for Oracle driver, click Next to proceed to the final dialog box in
the Create New Data Source wizard, shown below.
Creating an Oracle Database Connection
Click Finish to configure your new database. This opens the Oracle ODBC Driver Setup dialog
box, shown below. Enter the Data Source Name, the Description, the Service Name, and the
User ID, and configure the other desired settings.
3.21
TrendWorX SQL Data Logger
Configuring an Oracle ODBC Database Connection
Performance Optimization and Evaluation
This section provides some insight into the options for optimizing a data-logging application. The
biggest (and most obvious) performance booster is the hardware available. For data logging, fast
processors, increased memory capacity, and fast hard disks accompanied by caching capabilities
increase performance tremendously. In addition, multiprocessor servers drastically increase
database performance and capacity.
Data-Compression Tools
TrendWorX SQL Data Logger supports a variety of data-compression tools, which can limit the
amount of data stored in the database.
Deadband
The TrendWorX SQL Data Logger supports absolute and relative deadband on a per-tag basis.
Using the TrendWorX Logger Configurator, you can configure this individually for each tag, as
shown below. Only those samples that are above the deadband will be actually data-logged.
3.22
Introduction
Logging Tag Configuration Dialog Box
Data-Logging Filters
The TrendWorX SQL Data Logger supports data-logging filters based on a statistical description of
the available samples. You can configure the desired filter, on a per-tag basis, by choosing the
desired type:
•
Min
•
Max
•
Avg
•
Standard Deviation
•
Running Min
•
Running Max
•
Running Avg
•
Moving Avg
•
Moving Min
•
Moving Max
•
Totalizer
For the selected data-logging filter, TrendWorX SQL Data Logger will only log one sample to disk,
which will be computed as follows:
•
If the Calculation Period option is used, then all samples within the calculation period will be
used to compute the actual sample that will be data-logged.
3.23
TrendWorX SQL Data Logger
•
If the Calculation Period option is not used, all samples within the log-to-disk interval will be
used to compute the actual sample that will be data-logged.
Using the data-logging filters can greatly improve performance and historical database size
requirements.
Database Access Scheduling
The TrendWorX SQL Data Logger has flexible options for controlling the frequency of data logging
to the database. Using these tools, you can control the frequency of database writes and spread
them in such a way that not all groups write to the database at the same time. Internally, TrendWorX
SQL Data Logger tries to achieve this to a certain degree, but the configuration gives you even more
flexibility in doing so. In terms of configuration, TrendWorX SQL Data Logger allows you to control
the interval at which data will be logged to the database, regardless of the data-collection interval.
Scheduling Database Access for Load Balancing
Using the Logging tab in the TrendWorX Logger Configurator, shown above, you can configure the
system:
•
On a per-group basis.
•
To write to the database when a certain number of records has been collected.
•
At a certain time.
•
On interval.
•
On a condition.
•
Using a combination of options.
This way, you can "spread out" the write activity to the database and balance the data-logging load
more successfully.
Note: TrendWorX SQL Data Logger can access the database for writes as fast as every 5 seconds.
3.24
Introduction
Data Logging Load Distribution
The TrendWorX SQL Data Logger tag database uses a hierarchical organization, which involves
database groups and logging groups within each database group. This enables you to organize
data-logging activity logically, in smaller loads, and in your desired areas of interest. It is
recommended that you do not add more than 500 tags per group (depending on available hardware
and the overall data-logging load, as well as the database type). This way the database tables will
become more manageable, and the data-logging activity will not require extensive system
resources. In general, for frequent data logging it is recommended that you configure your data
logging activity such that the historical tables created will not exceed a size of 80 MB.
Note: Microsoft SQL Server and MSDE have database-maintenance capabilities even when active
connections are open. In certain cases, for an above-average data-logging load it may be preferable
to create databases with a large initial size in order to avoid frequent database expansion
operations.
Multithreaded Architecture
TrendWorX SQL Data Logger has a multithreaded architecture. This yields more responsive
single-processor systems and increases the overall system performance of multiprocessor systems.
The multithreaded architecture of the TrendWorX SQL Data Logger is designed around the
database group. Each database group has a set of threads to log data to disk and to share the
cataloging load across multiple threads. In addition, you can have multiple database groups logging
data to the same database or a different database. Distributing the data-logging load across multiple
database groups can yield better performance.
Managing the Database Table Organization
TrendWorX SQL Data Logger provides a database organization and management scheme that
allows you to control the database storage and table creation for better performance. The Table
Management tab in the TrendWorX Logger Configurator, shown below, allows you to set up an
"archive" scheme, which can optimize historical replay and data logging.
Scheduling Historical Table Management for Load Balancing
For example, you could configure data-logging as follows:
•
The data-logging load is 250 tags per second.
3.25
TrendWorX SQL Data Logger
•
TrendWorX Viewer ActiveX historical viewers are configured to start up with an initial display
of 1 hour’s worth of data.
•
The historical data will be maintained for 7 days.
You can configure TrendWorX SQL Data Logger to create four tables per day by creating a new
table every 6 hours and maintaining a total of 28 tables. This approach will:
•
Speed up initial historical replay, because only the most recent table will be opened and the
size of each table will remain reasonable.
•
Speed up data logging, because each table will be a reasonable size.
•
Improve system maintenance and backup tasks by avoiding the creation of enormous
database tables.
In general, for frequent data logging it is recommend that you configure the data logging activity
such that the size of the historical tables will not exceed 80 MB.
Other Considerations
For non-networked applications in which all ProcessView software is running on a single node,
making sure that the database is not on the same hard drive as the HMI displays can improve
performance. Frequent display switching requires disk access, which can slow down data logging.
Data logging requires additional memory resources. In addition, databases allow you to control the
amount of memory used. In the case of Microsoft SQL Server and MSDE memory is handled in a
centralized fashion using the Microsoft SQL Server Enterprise manager for Microsoft SQL Server or
the Smar MSDE Manager for MSDE.
Configuring Memory Management for Microsoft SQL Server
Microsoft SQL Server and MSDE introduce a dynamic memory-management scheme that uses
system memory based on need and availability. In any case, it is recommended that for Microsoft
3.26
Introduction
SQL Server and MSDE data-logging applications you do not allocate more than two thirds of the
total physical RAM available for database server memory usage. In addition, it is critical that the PC
on which Microsoft SQL or MSDE is installed has virtual memory at least two times the total amount
of physical RAM available.
Microsoft Access is entirely different. It utilizes memory on a per-connection basis, and it can easily
consume a significant amount of system resources. For version 7.0, ProcessView modules and
applications will automatically adjust the Microsoft Jet Engine registry settings with default values.
For data logging applications to Microsoft Access that require a high tag count, please contact Smar
technical support on how to change these settings.
By setting a number other than 0 in the MaxBufferSize entry, you can limit the memory used by
Microsoft Jet Engine on a per-connection basis. A setting of 8192 KB (in decimal form) provides a
reasonable value for most Microsoft Access-based applications. Note that this setting may have to
be set at all registry settings relating to Jet 3.x as well as to Jet 4.x engines.
Note: It is very critical that you adjust the default setting for MaxBufferSize. Many of the newer
ProcessView modules use Microsoft Access (.mdb) files for configuration purposes, and they
interact with Microsoft Access while in runtime mode. Adjusting the MaxBufferSize setting can
greatly improve Microsoft Access/Jet Engine memory consumption.
Monitoring Performance
The TrendWorX Logger Configurator has runtime tools for monitoring data-logging performance.
This can help in determining whether the data-logging application is set up properly. You can view
the statistics collected on a per-group basis during data logging by clicking the Get Statistics button
in the TrendWorX Logger Configurator under each group. This opens the Group Statistics dialog
box, shown below.
Monitoring Data-Logging Performance
These statistics show the time to:
•
Connect to the database.
•
Open a table for logging data.
•
Prepare data for logging.
•
Log historical data.
3.27
TrendWorX SQL Data Logger
It also shows the total time of data logging.
In addition, the TrendWorX SQL Data Logger tracks the:
•
Minimum time to open the target database table.
•
Maximum time to open the target database table.
•
Minimum time to log data.
•
Maximum time to log data.
These times will vary. However, if the total time of data logging is constantly increasing and is much
larger than the configured time to access the database table for writes (set in the Logging tab of the
data-logging group configuration) you may need to re-evaluate the data logging and hardware
configuration.
Summary of Optimization for Microsoft SQL and MSDE
The TrendWorX SQL Data Logger supports data logging to Microsoft SQL Server. Support for
MSDE (Microsoft Data Engine), which is a Microsoft SQL Server compatible database server, was
introduced in Version 6.00. Version 6.10 introduced support for Microsoft SQL Server 2000 and
MSDE 2000.
The ProcessView product CD installs under the ProcessView program group a Tools directory,
which contains the MSDE Manager. MSDE Manager is an administrative tool to be used with MSDE
2000 and 7.0 databases. It has support to install MSDE 2000 (default) or MSDE 7.0.
In terms of performance, several tests have shown the following:
•
Best overall combination: Microsoft SQL Server 2000 (or MSDE 2000) and Windows 2000
•
Next best: Microsoft SQL Server 7.0 (or MSDE 7.0) and Windows 2000
•
Good performance: Microsoft SQL Server 7.0 (or MSDE 7.0), Win NT 4.0 with SP5 (or SP6)
Both Microsoft SQL Server 7.0 (or MSDE 7.0) and Microsoft SQL Server 2000 (or MSDE 2000)
perform better using Microsoft Windows 2000. Microsoft SQL Server 2000 (or MSDE 2000)
performs better than Microsoft SQL Server 7.0 (or MSDE 7.0). Data logging requires less table
maintenance, and memory use overall is more reasonable (Microsoft SQL Server 7.0 utilizes much
more memory). All this is done at the expense of hard disk space.
Microsoft SQL Server 2000 (or MSDE 2000) will achieve this performance by allocating much more
disk space ahead of time so that it will not have to expand the database continuously. In addition,
Microsoft SQL Server 2000 nor requires a minimum of 64 MB of RAM dedicated to it. However,
during data logging Microsoft SQL Server 2000 (or MSDE 2000) will use much less memory than
Microsoft SQL Server 7.0 (or MSDE 7.0).
Deploying Microsoft SQL Server 7.0 or Microsoft SQL Server 2000 (as well as MSDE) requires
several simple steps at startup that are very important to overall data logging and system
performance.
During Installation
When installing Microsoft SQL Server, (if possible) specify a different drive for the "masterdb" and
"tempdb" databases of Microsoft SQL Server from the location of the actual historical database. If
installing Microsoft SQL Server 7.0 or MSDE 7.0, please install the latest service pack, available on
the ProcessView Product CD, under the Tools directory.
Note: When installing Microsoft SQL Server 2000 (or MSDE 2000), remember that TrendWorX
Version works with Microsoft SQL Server 2000 in single-instance mode. Starting with Microsoft SQL
Server 2000, you can install multiple instances of Microsoft SQL Server 2000 on the same
computer. Each one is a separate install, having its own name (instance name). Thus, clients
connect to it via instance name or server name.
After Installation
After installing Microsoft SQL Server, go to the Microsoft SQL Enterprise Manager (this does not
apply to MSDE) and:
3.28
•
Set the "tempdb" size to 120 MB and the transaction log to 20 MB.
•
Set the "masterdb" size to 80 MB and the transaction log to 20 MB.
Introduction
The initial sizes of "tempdb" and "masterdb" are small. Microsoft SQL Server will increase them on
the fly, but it will consume resources. It is always better to start from a decent initial size. To perform
this task, select each database, right-click to display the context menu, and select Properties. This
opens the Master Properties dialog box, shown below, which enables you to adjust the database
sizes.
Master Properties Dialog Box
Once the sizes have been modified, click OK to apply the changes.
Note: You may have to edit the Microsoft SQL Server registration properties inside the Microsoft
SQL Enterprise manager to display all system objects so that the "masterdb" and "tempdb" are
visible in the tree view. To do this, start the Microsoft SQL Enterprise manager, select the Microsoft
SQL Server, right-click, and then select Edit SQL Server Registration Properties. This opens the
Registered SQL Server Properties dialog box, shown below. Make sure that the Show System
Databases option is checked.
3.29
TrendWorX SQL Data Logger
Registered SQL Server Properties
Setting Server Memory Options
By default, Microsoft SQL Server and MSDE will be configured to use all available PC memory,
which can cause problems with a heavy-duty load or an inadequately equipped PC.
You can use the Microsoft SQL Enterprise manager to adjust the server memory settings. For
Microsoft SQL Server installations, start the Microsoft SQL Enterprise manager, select the Microsoft
SQL Server, right-click, and then select Properties. This opens the SQL Server Properties dialog
box, shown below. You can modify the server memory settings using the Memory tab of the SQL
Server Properties dialog box.
3.30
Introduction
SQL Server Properties
It is recommended that you use as a maximum value no more than two thirds of the total physical
RAM available on the PC. For example, assume that the PC has 256 MB of RAM. Set the Microsoft
SQL Server (or MSDE) RAM to a maximum value of for 128-168 MB of RAM.
Note: You may have to stop and restart the Microsoft SQL or MSDE servers for these changes to
be applied.
Controlling Transaction Log size
For Microsoft SQL 2000 databases, go to the historical database Properties dialog box and select
the Options tab, as shown in the figure below. Under Recovery Model, select Simple from the dropdown list, as shown in the figure below. This enables Transaction Log truncation so that the log will
not increase in size.
3.31
TrendWorX SQL Data Logger
Limiting the Transaction Log Size
For Microsoft SQL 7.0 databases, make sure that the Truncate Log on checkpoint option is
checked in the Options tab of the database Properties dialog box, as shown in the figure below. In
addition, the Auto Close, Select into / bulk copy, Auto create statistics and Auto update
statistics options should be enabled.
3.32
Introduction
Limiting the Transaction Log Size
Adjusting Virtual Memory Settings
Make sure that the PC has adequate virtual memory (paging file) for Microsoft SQL Server (or
MSDE) and all other Windows applications. For example, assume that the PC has a total of 256 MB
of RAM. Set Microsoft SQL Server (or MSDE) to use a maximum of 128 MB RAM. Make sure the
paging file is at least 256 MB.
To adjust the virtual memory settings on your PC, select the My Computer icon on the desktop,
right-click and select Properties from the pop-up menu. Once the System Properties dialog box is
displayed, open the Advanced tab, as shown below.
3.33
TrendWorX SQL Data Logger
Windows System Properties Dialog Box
Then click Performance Options to open the Performance Options dialog box, shown below.
Performance Options Dialog Box
Click Change to display the Virtual Memory settings dialog box, shown below. Here you can modify
your virtual memory settings.
3.34
Introduction
Virtual Memory Settings Dialog Box
Microsoft SQL Server will use as much memory as it needs to boost its performance. However, if it
has to give back physical RAM, it will substitute with virtual memory. In some cases, it will use more
virtual memory than physical RAM. Also note that Microsoft SQL Server 2000 (or MSDE 2000) uses
less memory than Microsoft SQL Server 7.0 (or MSDE 7.0) and performs better, at the expense of
using more disk space.
Optimizing Data-Logging Configuration
To optimize the data-logging configuration:
•
Use deadband or a data-compression filter. This can drastically improve performance while
saving disk space usage
•
Log to disk as slowly as possible. That is, do not write to disk every sample, unless your datalogging rate is 15 minutes or so.
•
Create the historical database with a good initial size (30-50 percent of the estimated final
size). Microsoft SQL Server (MSDE) will increase the size on the fly, but it will consume
resources. It is always better to start from a decent initial size.
•
Avoid using many database groups to log to the same database. Each database group uses an
independent connection to the database, which consumes more resources.
•
Use fewer logging groups (with more tags per group) rather than many logging groups (with few
tags per group). Microsoft SQL Server (MSDE) will fewer tables to maintain, so performance
will be better.
•
Do not let the size of data-logging tables exceed 80 MB. Create a new table instead. The
bigger the tables get, the slower data logging will be.
•
Run Microsoft SQL Server in Windows Server rather than Windows Workstation to increase
performance.
3.35
TrendWorX SQL Data Logger
Managing Database Storage Requirements
Within Microsoft SQL Server Enterprise manager, you can set up maintenance plans that can
defragment the database and optimize and recompute table index information. Ideally, these plans
should be activated during inactive data-logging periods. When applied to a database on a periodic
basis, they can significantly improve database performance and reduce database disk space usage.
Example Configurations
Example 1. If you wanted to data log 100 signals per second, you would write to disk every minute
or 60 samples, creating a new table every 4-6 hours.
Example 2. If you wanted to data log 500 signals per minute, you would write to disk no faster than
every 5 minutes or five samples, creating a new table once a day or once a week.
Troubleshooting
This section provides some useful tips for troubleshooting data-logging applications.
Database Driver Errors
Using a technology that has been incorporated into all Smar products, TraceWorX provides online
diagnostics and tuning of applications running in the ProcessView system. TraceWorX is designed
expressly for systems integrators, OEMs and customers who want to have tools for doing their own
troubleshooting and diagnostics.
TraceWorX tracks the runtime activity for the TrendWorX SQL Data Logger and logs the runtime
data to a log file based on user-configured trace levels. The log file provides a thorough, color-coded
report detailing all activity for the application, including the time, the date, the severity level, and a
description of the event or problem.
TraceWorX also features several options for reporting issues to technical support. If you are
experiencing problems with any applications, the log file deployment options, such as compressing
and e-mailing log files, are ideal for tracking and archiving data and sending detailed reports to
technical support. Developers can use these reports to identify the source of the problems.
Please see the TraceWorX Help documentation for more information.
Inspecting Data-Logging Activity
The TrendWorX Configurator provides runtime information on a per-data-logging group basis,
identifying the last time that historical data were logged to the disk for the selected logging group, as
well as the currently active historical table for data logging. You can view the statistics collected on a
per-group basis during data logging by clicking the Get Statistics button in the TrendWorX Logger
Configurator under each group. This opens the Group Statistics dialog box, shown below.
3.36
Introduction
Monitoring Data-Logging Activity
GenEvent Registrar and NT Event Logger Integration
The TrendWorX SQL Data Logger is interfaced to the GenEvent Registrar Server and,
subsequently, to the NT Event Logger. Currently, the following events are posted:
•
Started Logging (Severity 500)
•
Stopped Logging (Severity 500)
•
Error Starting Data Logging (Severity 800)
•
Activated Database Group (Severity 600)
•
Deactivated Database Group (Severity 600)
•
Activated Logging Group (Severity 600)
•
Deactivated Logging Group (Severity 600)
•
Switched Database Connection (Severity 650)
•
Failed to Activate (Severity 750)
•
Failed to Deactivate (Severity 750)
•
Errors in Loading Configuration (Severity 650)
3.37
TrendWorX SQL Data Logger
•
Failed to Switch Database (Severity 750)
•
Missing Logging Tag (Severity 650)
•
Lost Database Connection (Severity 800)
•
Got Database Connection (Severity 500)
•
Maximum Number of Logging Packets Reached (Severity 650)
•
Lost Logging Packet (Severity 750)
•
Retried to Log Data (Severity 650)
•
Not Enough Client Units for Database Switching (Severity 500)
To activate the NT Event Logger, you need to enable this option under the ProcessView License
Monitor, shown below, by checking Always Write to Local NT Event Log.
Enabling NT Event Logging for Data Logging
TrendWorX SQL Data Logger has both a data-logging retrial mechanism and a databasereconnection mechanism. If data logging fails, it puts the current data-logging packet back in the
queue of packages to data log. It will retry (by default) three times to data log the packet prior to
aborting. In the TrendWorX Logger Configurator, there is a user-configurable maximum number of
3.38
Introduction
data-logging packets to maintain in memory for data logging on a per-group basis, as shown in the
figure below. The default value is 12.
Data-Logging Retrials Settings
The Max Logging Packets value controls the maximum number of data-logging packets to maintain
in memory. The Retrials value controls the number of times the TrendWorX SQL Data Logger will
retry data logging data in case of a failure. The Max Samples value controls the maximum number
of samples to maintain in memory on a per-data-logging tag basis. The Retrial Delay value is the
time between successive retrials.
By default, the TrendWorX SQL Data Logger will establish a connection to the database for logging
and leave that connection open for the duration of the data-logging activity. To have the TrendWorX
SQL Data Logger open a database connection only for the duration of writing a new logging packet
to disk, you can change the Global Connection setting to 0. However, this is not recommended for
high volume or frequent data-logging activity.
Note: The Max Logging Packets default value is set to 12. This assumes a small data-logging
load. For larger data-logging applications, it may have to be reduced to a lesser value.
Security Integration
The TrendWorX SQL Data Logger is interfaced to the Smar Security Server, and it provides
support for the following security actions, as shown in the figure below.
3.39
TrendWorX SQL Data Logger
Smar Security Server
In data-logging mode, you can log in to the Smar Security Server by choosing Login from the
Security submenu of the Tools menu. The login function is only available in data-logging mode.
This opens the Smar Security Login dialog box, shown below.
Smar Security Login
If you already have a user name and password, enter them and then click OK. Otherwise click
Cancel. The Smar Security Login window opens, as shown below.
Smar Security Login Window
3.40
Introduction
It is possible to log in from the User menu of the Smar Security Login Window. You can also
change your password and your security preferences in this window. In configuration mode, you can
access the Smar Security Server by choosing Configuration from the Security submenu of the
Tools menu.
Smar Security Login
To configure your security settings, you must first have Smar security clearance. Enter an
administrator user name and password, and then click OK.
Database Schema
Key features of the TrendWorX SQL Data Logger data-logging engine include:
•
Multiple databases support.
•
Automatic data buffering.
•
Extensive data-logging configuration.
•
Data retrieval from OPC servers.
•
Use of multithreading techniques.
For the actual data-logging mechanism, TrendWorX SQL Data Logger uses client/server database
technology to perform compact batch updates to the underlying database, resulting in optimal use of
available hardware and software resources. The database locks are placed in an optimal fashion,
and the related tables can respond much better in multi-user scenarios.
Note: Batch updates are not currently supported for Oracle databases.
TrendWorX SQL Data Logger creates the necessary database schema to accommodate a various
data-logging needs. For each physical database connection it will create the following database
schema:
3.41
TrendWorX SQL Data Logger
TrendWorX SQL Data Logger Database Schema
Tables
The application must have complete access to the database in order to edit or delete tables. If you
change the name of the table on a per-group basis, TrendWorX SQL Data Logger will not delete the
existing tables; this is left to the database administrator. In addition, under no circumstances should
you change the order or the data type of the columns that are already created. With this in mind, it
should be noted that you can append new columns at the end of existing ones. For each configured
group, each of the tables is named after the user-selected table name.
For example, using Microsoft Access, opening the database will bring up the following list of
database tables for each group of signals formed by TrendWorX SQL Data Logger:
Microsoft Access Database With Tables
3.42
Introduction
Notice that there are various tables for each group, which will be described later. Double-clicking any
of these tables from the database list opens the actual table so that you can view all of the
corresponding data.
Tags Table
The Microsoft Access database "_Tags" table, shown below, contains all of the information required
by data logging and reporting for the tags (signals) within the data-logging group.
Tags Table
Info Table
The Microsoft Access database "_Info" table, shown below, contains all of the information required
by data logging and reporting for the cyclic table creation of the historical data-logging process within
the data-logging group.
Info Table
Notes Table
The Microsoft Access database "_Notes" table, shown below, contains all of the operator
comments and batch/lot entries within the data-logging group.
3.43
TrendWorX SQL Data Logger
Notes Table
Numbered Tables
The Microsoft Access database Numbered tables ("_1," "_2," etc.), shown below, are the actual
data-logging tables, which contain information for up to 36 samples per second.
Numbered Table
Global Table
In addition, for each physical database, TrendWorX SQL Data Logger creates a Microsoft Access
database Global table called "TWX_GLOBAL," shown below, that will be used to maintain database
integrity across multiple data-logging nodes by ensuring that no two different groups will have data
entered into the same table.
3.44
Introduction
Global Table
Regardless of the end database choice, the TrendWorX SQL Data Logger can be deployed in
various scenarios:
TrendWorX SQL Data Logger and Physical Database
Residing on the Same Node
3.45
TrendWorX SQL Data Logger
TrendworX SQL Data Logger Residing on a Different
Node From the Database Server
Distributed TrendWorX SQL Data Logger Deployment
3.46
Introduction
TrendWorX SQL Data Logger OLE Automation Interface
The TrendWorX SQL Data Logger supports a dual COM interface for data logging manipulation
through OLE Automation or DCOM. To use this new interface within a Visual Basic application
(VBA), you must ensure that the VBA project has References to the Smar TrendWorX SQL library,
as shown below.
Adding References to the TWX_SQL Type Library
Then you can use the methods and properties exposed. A simple call to create an instance of the
server object within Visual Basic is as follows:
Dim mylog As TWXLogger
Set mylog = CreateObject("Smar.TWXLogger.1")
The Data Logger exposes the following OLE automation methods and properties:
[propget, id(1), helpstring("property LoggerStatus")]
HRESULT LoggerStatus([out, retval] short *pVal);
[propget, id(2), helpstring("property CurrentTime")]
HRESULT CurrentTime([out, retval] DATE *pVal);
[propget, id(3), helpstring("property StatusString")]
HRESULT StatusString([out, retval] BSTR *pVal);
[propget, id(4), helpstring("property StartTime")]
HRESULT StartTime([out, retval] DATE *pVal);
[id(5), helpstring("method GetDatabaseGroupStatus")]
HRESULT GetDatabaseGroupStatus([in] BSTR bstrDBaseGroupName,
[out] short * pStatus,
[out] DATE * pCurrentTime,
[out] BSTR * bstrStatusString
);
[id(6), helpstring("method GetGroupStatus")]
HRESULT GetGroupStatus([in] BSTR bstrDBaseGroupName,
[in] BSTR bstrGroupName,
[out] short * pStatus,
[out] DATE * pCurrentTime,
[out] BSTR * bstrStatusString);
[id(7), helpstring("method GetGroupStatistics")]
3.47
TrendWorX SQL Data Logger
HRESULT GetGroupStatistics([in] BSTR bstrDBaseGroupName,
[in] BSTR bstrGroupName,
[out] long * pConnectionTime,
[out] long * pTableOpenTime,
[out] long * pDataPreparationTime,
[out] long * pDataWriteTime,
[out] long * pTotalLogTime,
[out] long * pTotalLogMinTime,
[out] long * pTotalLogMaxTime,
[out] long * pTableOpenMinTime,
[out] long * pTableOpenMaxTime,
[out] long * pTotalAvgWriteTime,
[out] DATE * pLastWriteTime,
[out] BSTR * bstrTableName);
[id(8), helpstring("method LoadConfiguration")]
HRESULT LoadConfiguration([in] long lConfigID,
[in] BSTR bstrConfigurationName);
[id(9), helpstring("method SetConfigurationDatabase")]
HRESULT SetConfigurationDatabase([in] BSTR bstrConnectionString);
[id(10), helpstring("method StartLogging")]
HRESULT StartLogging();
[id(11), helpstring("method StopLogging")]
HRESULT StopLogging();
[id(12), helpstring("method ActivateDatabaseGroup")]
HRESULT ActivateDatabaseGroup([in] BSTR bstrDBaseGroupName);
[id(13), helpstring("method DeActivateDatabaseGroup")]
HRESULT DeActivateDatabaseGroup([in] BSTR bstrDBaseGroupName);
[id(14), helpstring("method ActivateGroup")]
HRESULT ActivateGroup([in] BSTR bstrDBaseGroupName,
[in] BSTR bstrGroupName);
[id(15), helpstring("method DeActivateGroup")]
HRESULT DeActivateGroup([in] BSTR bstrDBaseGroupName,
[in] BSTR bstrGroupName);
[id(16), helpstring("method Switch Database")]
HRESULT SwitchDatabase([in] BSTR bstrDBaseGroupName,
[in] BSTR bstrODBCConnString,
[in] BSTR bstrOLEDBConnString,
[in] short nDBType,
[in] BOOL bReDirect);
[id(17), helpstring("method ReloadConfiguration")]
HRESULT ReloadConfiguration([in] long lConfigID,
[in] BSTR bstrConfigurationName);
[id(18), helpstring("method AdjustLoggingParameters")]
HRESULT AdjustLoggingParameters([in] DWORD dwMaxRetrials,
[in] DWORD dwMaxPackets);
[id(19), helpstring("method GetCurrentConfiguration")]
HRESULT GetCurrentConfiguration([out] long * lConfigID,
[out] BSTR * bstrConfigurationName,
[out] BSTR * bstrConnectionString);
[id(20), helpstring("method ResetConfiguration")]
HRESULT ResetConfiguration();
[id(21), helpstring("method TestConnection
3.48
Introduction
HRESULT TestConnection([in] BSTR bstrConnectionString
);
[id(22), helpstring("method AdjustLoggingParameters2")]
HRESULT AdjustLoggingParameters2(
[in] DWORD dwMaxRetrials,
[in] DWORD dwMaxPackets,
[in] DWORD dwMaxSamples,
[in] DWORD dwRetrialDelay,
[in] BOOL bUseGlobalConnection
);
[id(23), helpstring("method QueryLoggingParameters")]
HRESULT QueryLoggingParameters(
[out] DWORD * dwMaxRetrials,
[out] DWORD * dwMaxPackets,
[out] DWORD * dwMaxSamples,
[out] DWORD * dwRetrialDelay,
[out] BOOL * bUseGlobalConnection
);
In addition, the following enumerations are used:
Data Logger status:
•
TWXSQL_UP = 1
•
TWXSQL_DOWN
•
TWXSQL_INDETERMINATE
Database group status:
•
TWXSQL_DBASEGROUP_ACTIVATED = 1
•
TWXSQL_DBASEGROUP_DEACTIVATED
•
TWXSQL_DBASEGROUP_INDETERMINATE
Logging group status:
•
TWXSQL_GROUP_ACTIVATED = 1
•
TWXSQL_GROUP_DEACTIVATED
•
TWXSQL_GROUP_STANDBY
•
TWXSQL_GROUP_EXITING
•
TWXSQL_GROUP_INDETERMINATE
Database connection type:
•
TWXSQL_DBASE_NONE = 1,
•
TWXSQL_DBASE_ACCESS
•
TWXSQL_DBASE_SQLSVR
•
TWXSQL_DBASE_ORACLE
In the method calls listed above:
•
bstrDBaseGroupName: Refers to the database group name, as it would appear in the
Configurator database.
3.49
TrendWorX SQL Data Logger
•
bstrGroupName: Refers to the logging group name, as it would appear in the Configurator
database.
•
lConfigID: Refers to the configuration ID, as it would appear in the Configurator database.
•
bstrConfigurationName: Refers to the configuration name, as it would appear in the
Configurator database, corresponding to the "lConfigID."
•
bstrODBCConnString: Refers to the ODBC connection string passed to the OLE DB provider
for ODBC, as it would appear in the Configurator database.
•
bstrOLEDBConnString: Refers to the OLE DB connection string passed to the OLE DB
provider for Microsoft Access, Microsoft SQL Server (MSDE), or Oracle, as it would appear in
the Configurator database.
•
bstrConnectionString: Refers to the OLE DB connection string passed to the OLE DB
provider for Microsoft Access used in establishing a configuration database connection for the
TrendWorX SQL Data Logger.
Note: The "SwitchDatabase" method call can be used while during data logging to perform a hot
database switch operation with the option to redirect pending writes to the new database connection.
If the Data Logger cannot establish a database schema information on the new database, or the
new database type requires more Client Units, which are not available due to the current level of
Smar Licensing, this operation will fail.
3.50
Introduction
OPC HDA COM Interface
The TrendWorX SQL Data Logger Version 7.x was updated to be compliant with the latest OPC
HDA specification. In general, the OPC HDA specification is an extended OPC specification, which
includes an increased number of interfaces and methods, not all of them being mandatory.
Critical Note: Because of the compliance changes in historical replay and reporting, version 7.x or
later historical replay or reporting may not produce identical results to existing 6.1x version reports
and or historical replay screen captures for the same signals and time periods.
In addition to the Data Logger interface, the TrendWorX SQL Data Logger also implements the OPC
Historical Data Access (HDA) interface. The following interfaces and methods are supported,
including connection point support.
Version 7.x included an enhanced data-retrieval system, which utilizes a new approach to creating
historical reports. The following is a summary of the changes for version 7.x:
•
Data filter selection other than Raw will result in data time stamped at the beginning of each
subinterval.
•
When retrieving data using data filters other than Raw, subintervals for which there are no data
because of no data-logging activity will be marked as “empty” slots at the corresponding time
with an empty (VT_EMPTY) value. You can check the returned qualities for further processing.
•
The historical qualities supported are as follows:
o
OPCHDA_EXTRADATA
More data may exist
0x0001
o
OPCHDA_INTERPOLATED
Interpolated data value
o
OPCHDA_RAW
Raw data value
o
OPCHDA_CALCULATED
Calculated data value
o
OPCHDA_NOBOUND
No data found to provide upper or lower bound
o
OPCHDA_NODATA
No data collected. Archiving not active
0x0002
0x0004
0x0008
0x0010
0x0020
o
OPCHDA_DATALOST
Calculation started/stopped/lost
0x0040
o
OPCHDA_CONVERSION
Scaling / conversion error
o
OPCHDA_PARTIAL
Aggregate value is for an incomplete interval
0x0080
0x0100
l
Interfaces
The following OPC HDA COM interfaces are supported:
•
interface IOPCHDA_Server
•
interface IOPCHDA_Browser
•
interface IOPCHDA_SyncRead
•
interface IOPCHDA_AsyncRead
•
interface IOPCHDA_SyncAnnotations
3.51
TrendWorX SQL Data Logger
Methods
The TrendWorX SQL Server supports the following OPC HDA Interfaces and methods:
•
9
HRESULT GetItemAttributes
9
HRESULT GetAggregates
9
HRESULT GetHistorianStatus
9
HRESULT GetItemHandles
9
HRESULT ReleaseItemHandles
9
HRESULT ValidateItemIDs
9
HRESULT CreateBrowse
•
HRESULT GetEnum
9
HRESULT ChangeBrowsePosition
9
HRESULT GetItemID
9
HRESULT GetBranchPosition
interface IOPCHDA_SyncRead
9
HRESULT ReadRaw
9
HRESULT ReadProcessed
9
HRESULT ReadAtTime
9
HRESULT ReadModified
9
HRESULT ReadAttribute
•
interface IOPCHDA_AsyncRead
9
HRESULT ReadRaw
9
HRESULT ReadProcessed
9
HRESULT ReadAtTime
9
HRESULT ReadModified
9
HRESULT ReadAttribute
9
HRESULT Cancel
•
3.52
interface IOPCHDA_Browser
9
•
MSDE Support
interface IOPCHDA_Server
interface IOPCHDA_SyncAnnotations
9
HRESULT QueryCapabilities
9
HRESULT Read
9
HRESULT Insert
Introduction
TrendWorX SQL Data Logger supports MSDE (Microsoft Data Engine), which is a fully compatible
Microsoft SQL Server engine, with the following limitations:
•
The maximum database size is 2 GB.
•
Performance may decrease if more than five connections are open to the database.
MSDE has the full core server functionality of Microsoft SQL Server, and MSDE databases can
easily be upgraded to full Microsoft SQL Server databases. To install MSDE, you can use the
ProcessView MSDE Manager or browse the ProcessView CD to get to the Tools folder, which has
both MSDE 7.0 and MSDE 2000 installations.
The "setup.exe" can be used to install MSDE, create an empty database, and verify installation.
Once you install MSDE, you should create an ODBC data source associated with this database. The
key advantages of MSDE include:
•
Fully compatible Microsoft SQL Server database engine
•
Central and dynamic memory management across all database connections
•
On-the-fly index maintenance and management
•
Optimized query processing
•
Automatic database space management
•
Microsoft SQL Server database upgrade path
•
Ability to use Microsoft Access 2000 as a front-end configuration tool
Note: Since MSDE has intelligent online maintenance features, including database expansion and
contraction, it is recommended that physical writes to the database be spread over time to allow for
better performance. For example, when the data-collection rate is 5 seconds, writing to disk can be
set to 30 seconds (or every six samples).
Refer to the ProcessView MSDE Manager Help documentation for additional information.
Running TrendWorX SQL Data Logger as a NT Service
You can register and run the TrendWorX SQL Data Logger as an NT Service. When TrendWorX
SQL Data Logger is installed and running as a service, its functionality is modified with respect to the
case where it is registered as a stand-alone COM server.
In general, TrendWorX SQL Data Logger can be registered and run as an NT service (under
Windows NT and Windows 2000) as well as a stand-alone COM server. However, the following
differences apply:
1.
2.
There will be only one instance (per node) of TrendWorX SQL Data Logger running under any condition.
If TrendWorX SQL Data Logger runs as stand-alone COM server:
•
If it is started from the desktop and clients are connected to it, and if the user (through the
application menus) chooses to exit, TrendWorX SQL Data Logger will "hide" its window, but will
keep serving its clients. When the last client goes away, TrendWorX SQL Data Logger will shut
down.
•
If you try to double-click on TrendWorX SQL Data Logger executable from the Windows
desktop while its application window is not visible and clients are connected to it, TrendWorX
SQL Data Logger will not launch a second application instance, but it will show the existing
window and, from there, it will close only from the menus.
3.
If the TrendWorX SQL Data Logger is registered and running as an NT service:
•
It will use as the service display name the "OEM" product name (if available).
•
If you double-click on TrendWorX SQL Data Logger executable, it will not launch a second
instance.
•
Once TrendWorX SQL Data Logger starts as an NT Service, it will go into runtime (data
logging) mode.
3.53
TrendWorX SQL Data Logger
To configure TrendWorX SQL Data Logger to run as an NT Service, do the following:
1. Install ProcessView or TrendWorX.
2. Use the TrendWorX Logger Configurator to configure your data-logging application.
3. Use the TrendWorX Logger Configurator to test data logging.
4. Once the application setup is completed, use the ProcessView Tray to register TrendWorX
SQL Data Logger as an NT Service. To do this, start ProcessView Tray from the Smar
ProcessView program group, under the Tools menu, as shown below.
Starting ProcessView Tray from the Programs Menu
A purple triangle appears in the task bar, as shown below.
Task Bar
Place the mouse pointer within the triangle, and then right-click to open the ProcessView Tray menu.
Then, do the following:
1.
Register TrendWorX SQL Data Logger to run as an NT Service by clicking the purple
triangle. Select TrendWorX > SQL Server > NT Service from the pop-up menu, as
shown in the figure below.
Registering the Data Logger as a NT Service
2.
3.54
TrendWorX SQL Data Logger will appear in the Services window, as shown below.
Introduction
Services Window
3.
Use ProcessView Tray to set TrendWorX SQL Data Logger to start automatically as an
NT service the next time the PC is rebooted. Click the purple triangle in the task bar. This
opens a pop-up menu, as shown below. Select TrendWorX > SQL Server > Automatic
from the pop-up menu, as shown in the figure below.
Automatic Setting in ProcessView Tray
When running the TrendWorX SQL Data Logger as an NT Service, special consideration must be
given to ensure that, when it starts up as an NT service, TrendWorX SQL Data Logger has rights to
access the database where the historical data logging will take place. When using ProcessView Tray
to register TrendWorX SQL Data Logger as an NT Service, it is configured to run under the local
system account. If remote historical replay is to be used, it may require adjusting DCOM settings for
the account under which TrendWorX SQL Data Logger will run as an NT Service, as well as adding
rights to the historical database for the specific account. This can be done by having TrendWorX
SQL Data Logger run in the context of a dedicated account and making sure that the same account
has access to the database. (In the case of Microsoft SQL it will need to have database
administrator rights to the historical database). The above account also must have rights to log in to
the target client PC, where the historical replay will take place.
3.55
TrendWorX SQL Data Logger
3.56
Chapter 4
INTRODUCTION TO TRENDWORX
EXAMPLES
The ProcessView installation includes a set of examples for the TrendWorX Viewer ActiveX. The
examples are located in the C:\Program Files\Smar\ProcessView\Examples\TrendWorX
Examples directory. The "TrendWorX Examples" directory contains the following folders:
•
Aliasing
•
Excel Templates
•
Real-Time Trend Configuration
•
TrendWorX Backgrounds
•
TrendWorX VBA Examples
•
TrendWorX Data Logging and Reporting
•
VBScript Examples
Note: Each of these folders contains a text file that provides a quick reference to the examples in
the folders.
Aliasing
The files in the "Aliasing" folder are example files that demonstrate the use of the OLE Automation
interface of the TrendWorX Viewer ActiveX within a VBA-enabled application, such as GraphWorX,
to do aliasing. To use this demo, do the following:
1. Open GraphWorX from the Windows Programs > Smar ProcessView > ProjectWorX menu.
2. Open the "TrendAliasMain.gdf" display in the "Aliasing" folder.
3. Enter the display into runtime mode.
4. Click on the buttons in the GraphWorX display to see the effects of aliasing.
Aliasing Example
Excel Templates
The "EXCEL Templates" folder contains example Microsoft Excel templates that can be used when
creating Excel workbooks to be used with TrendWorX Reporting:
•
Production Daily Yield
•
Production Down Time
•
Production Schedule
4.1
TrendWorX Examples
Real-Time Trend Configuration
The files in the "Real Time Trend Configuration" folder demonstrate the use of the OLE Automation
interface of the TrendWorX Viewer ActiveX within a VBA-enabled application, such as GraphWorX.
It demonstrates how to add pens "on the fly" by reading the pen configuration from a Microsoft
Access database (.mdb) file and utilizing the OLE Automation properties of the TrendWorX ActiveX
through VBA scripts.
To use this demo:
1. Make sure that none of the files in this folder has a read-only attribute.
2. Open GraphWorX from the Windows Programs > Smar ProcessView > ProjectWorX menu.
3. Load the "StartDemo.gdf" display.
4. Enter the display into runtime mode.
5. Click on the buttons in the GraphWorX display to switch displays and dynamically configure
trend displays.
Real Time Trend Configuration Example
TrendWorX Backgrounds
The "TrendWorX Backgrounds" folder contains several image files that can be used as backgrounds
for the TrendWorX Viewer ActiveX display.
TrendWorX Data Logging and Reporting
The "TrendWorX Data Logging and Reporting" folder contains sample TrendWorX data-logging
configurations, a sample historical database, as well as sample reporting and historical replay
displays.
To prepare for the examples, you must:
•
Set the ProcessView working directory to be "TrendWorX Examples\TrendWorX Data Logging
and Reporting," where the examples are installed. (For example, you can use the Set Working
Directory command in the Tools menu of the TrendWorX Container.
•
Make sure that none of the files in this folder has a read-only attribute.
To use the data-logging example, do the following:
1. Create an ODBC Microsoft Access system data source called "TWX32DEMO," and select the
"Twx32demo.mdb" file in this folder without specifying any password or login ID.
2. Start the TrendWorX Configurator.
3. Select Open from the File menu and load the "Twx32DemoCfg.mdb" in this folder. TrendWorX
will try to start the Data Logger, and a message box may appear.
4. Select Cancel.
4.2
Introduction to TrendWorX Examples
5.
6.
7.
8.
In the TrendWorX Configurator, set the Computer Node Name to your Computer Name or leave
it set as "local."
Click on the Connect button to connect to the Data Logger.
Click on the Download Configuration button to download the demo configuration to the Data
Logger.
From here, you can start data logging, stop data logging, modify the sample configuration, etc.
Note: The sample data-logging configuration is configured so that a new data table is created every
hour or whenever data logging starts with a maximum of 12 historical tables. The sample historical
database has data between 12/1/2000, 9:15:00 AM and 12/1/2000, 10:10:00 AM.
Historical Replay Demo
To use the TrendWorX historical replay demo:
1. Start the TrendWorX Container.
2. Load the "TrendHistReplay.t32" display.
3. Enter the display into animation mode.
4. Click on the various buttons to retrieve TrendWorX historical data.
5. You can now start data logging, stop data logging and do historical replay.
Historical Replay Demo
TrendWorX OLE DB Provider Demo
In order to provide a sample application using the ProcessView TrendWorX OLE DB Provider, Smar
has created a sample VBA application to demonstrate its use. It is located in the "TrendWorX Data
Logging and Reporting" folder, and it is called "TrendOleDB.t32." This file consists of a main form,
which is shown below. Click Connect to connect to a TrendWorX SQL Server historical database.
Click Signal Info to retrieve the data-logged signal for a particular group. You can also build a trend
query and execute it to retrieve historical data.
1.
2.
3.
4.
5.
6.
Start the TrendWorX Container.
Load the "TrendOleDB.t32" display.
Enter the display into animation mode.
Click the various buttons to retrieve TrendWorX historical data using the TrendWorX OLE DB
Provider.
When prompted, you can select Microsoft Access as the historical database type and enter
"Twx32Demo.mdb."
You can now start data logging, stop data logging, and retrieve historical data.
4.3
TrendWorX Examples
OLE DB Provider Example
Reporting Tools Examples
TrendWorX includes VBA-based examples to demonstrate the use of the Reporting tools. In the
"TrendWorX Data Logging and Reporting" folder, there is a new TrendWorX display called
"TrendSQLTool.t32," shown in the figure below, which uses VBA forms to demonstrate the use of
the TrendWorX SQL Tool ActiveX control.
1. Start the TrendWorX Container.
2. Load the "TrendSQLTool.t32" display.
3. Enter the display into animation mode.
4. Click on the various buttons to retrieve TrendWorX historical data using the TrendWorX SQL
Tool ActiveX control.
5. When prompted, you can select Microsoft Access as the historical database type and enter
"Twx32Demo.mdb."
TWXSQLTool ActiveX Control Demo
4.4
Introduction to TrendWorX Examples
TrendWorX VBA Examples
The "TrendWorX VBA Examples" folder contains various examples that demonstrate the use of the
OLE Automation interface of the various TrendWorX modules and components. To use these
examples, do the following:
1.
2.
3.
4.
Start the TrendWorX Container.
Load each TrendWorX display in the folder.
Enter the display into animation mode.
Click on the various buttons of each display to run the examples.
TrendCustomPen1.t32
This example display uses VBA code to add a custom pen to a Trend ActiveX. The custom pen is
updated via timer-based calls to the Trend ActiveX to add new samples to the pen's buffer. The
Trend ActiveX is used in freeze mode.
Custom Pen Example in Freeze Mode
TrendCustomPen2.t32
This example display uses VBA code to add a custom pen to a Trend ActiveX. The custom pen is
updated via timer-based calls to the Trend ActiveX to add new samples to the pen's buffer. The
Trend ActiveX is used in auto-update mode.
4.5
TrendWorX Examples
Custom Pen Example in Real Time Mode
TrendPrint.t32
This example display uses VBA code to print just the Trend ActiveX utilizing various options. In
addition, it shows how to do a print while saving ink by not filling the background color of the Trend
ActiveX area.
Trend Display Print Example
TWXScreenNavigation.t32
This example display demonstrates how to create a Trend Navigation screen within a TrendWorX
display and how to dynamically configure Trend ActiveXs. It also demonstrates how to navigate
between the various displays.
4.6
Introduction to TrendWorX Examples
Screen Navigation
TrendVBADemo.t32
This example display demonstrates some of the OLE automation methods of the Trend Viewer
ActiveX. It shows sample code on providing a user interface for the Trend ActiveX via VBA calls. It
also shows how to retrieve individual sample information directly from the pen buffers or the trend
cursor in freeze mode.
Trend Viewer VBA Demo
PersistentTrendVBADemo.t32
This example display demonstrates how to interface to the Persistent Trend OLE Automation server
from any VBA-capable application. It demonstrates how to build a user interface and a browsing
interface, as well as how to retrieve individual samples for a signal from Persistent Trending.
4.7
TrendWorX Examples
Persistent Trend VBA Demo
VBScript Examples
The "VB Script Examples" folder contains a TWX-VBScriptEx.gdf display that uses VB scripting.
Open this file in GraphWorX and go into runtime mode, as shown in the figure below. Click on the
various buttons to see how the VBScript functions work. In configuration mode, you can click on the
buttons to see how the script pick actions are configured.
VBScript Examples
4.8
Chapter 5
Persistent Trending
Introduction to Persistent Trending
The primary purpose of Persistent Trending is to provide a real-time OLE automation server for data
collection in memory (RAM) with simultaneous data-logging capability to a user-defined CSV file.
Client applications can request access from the Persistent Trending server (through OLE
automation) to its buffered data in order to enhance their functionality. The TrendWorX Viewer
ActiveX is already interfaced to the Persistent Trending server, and (if the server is installed on the
client PC and is running) the TrendWorX Viewer will connect to Persistent Trending to initialize its
pens. Persistent Trending targets small to medium load applications, which require trending displays
to be populated with available data upon initialization.
In general, Persistent Trending is responsible for:
•
Collecting real-time data from OPC servers in memory (RAM).
•
Supplying automation clients with the above buffered data.
•
Logging data to a user-configurable .csv or .txt file.
•
Managing a sophisticated, multithreaded data-buffering system to guarantee data
integrity with support for customer-configurable data-collection rates.
In terms of implementation, the Persistent Trending OLE automation server’s main features include:
•
A highly customizable server.
•
Fast data retrieval from memory buffers.
•
Independent data-collection rates for each group of points.
•
A full set of exposed OLE automation methods.
•
Built-in buffering system.
•
Security integration.
•
Support for calculated variables.
•
Interface to OPC real-time servers.
•
Easy Visual Basic integration.
•
Embedded signal simulator.
The internal architecture of Persistent Trending allows the data to be collected at a different rate and
logged to disk at a multiple of the data-collection rate in order to minimize the overall system load.
Currently the minimal scan rate is set to be 10 milliseconds, and all data-collection rates that you set
must be an integer multiple of the minimal scan rate. In addition, you can configure the desired
number of samples to buffer (up to a maximum of 12,000) and the desired logging-to-disk interval. In
addition, you can configure the file-management system for logging to disk.
New Features in TrendWorX Persistent Trending
TrendWorX contains many new features that make the use of Persistent Trending much easier.
These features include:
•
Improved buffering management for load balancing.
•
Faster client data-retrieval mechanism.
•
Support for the Unicode version.
•
OLE automation methods to retrieve data in universal time coordinates (UTC) time
format.
•
Enhanced expression support
•
Daylight savings time switch-over support
5.1
TrendWorX Persistent Trending
Note: TrendWorX up to and including Version 6.1x is using the Windows-based APIs for converting
a time from local time to UTC or from UTC to local time. The Windows APIs do not correctly adjust
the conversion for the daylight savings time if the time stamp to be converted was obtained from a
different time period (i.e. it was obtained in "summer" time but now we have "winter" time).
TrendWorX Version 7.0 introduced new time conversion utilities that account for this discrepancy.
There are, however, some things to consider:
•
These functions are used by default (no user enabling is required).
•
This is what they do in order to convert each time stamp:
o
They check Windows for the PC Time Zone Settings and to see if automatic daylight savings
is enabled.
o
They also obtain from Windows the times/dates for switching over. (These dates do not
change; they are in the form of, e.g., the first Sunday of April.)
o
Depending on the previous information, the new functions properly adjust the conversion
times to compensate for daylight savings time.
Persistent Trend OLE Automation Object Design
The Persistent Trending application exposes, through OLE automation, its document as a singleinstance shared object. The object’s name is TWXBgTrend.Document, and it is registered in the
system registry. Once launched, the Persistent Trending server will register its document as the
Active Object with the OLE Running Object Table (ROT), and therefore all client applications can
access this instance rather than create a new instance each time they desire to connect to the
Persistent Trending server. In Visual Basic code, this is equivalent to:
Every client application should always try to get the running instance of the server rather than create
a new instance (except for the first time connection). The TWXBgTrend.Document OLE automation
object supports the following OLE automation properties and methods:
OLE Automation Properties
5.2
BOOL Visible
TRUE if the application window is visible; supports SET/GET
BSTR FullName
Returns the Full path and file name of the currently loaded file in
TWXBgTrend; supports GET only
BOOL Maximized
TRUE if the application is maximized; supports GET/SET
BSTR Name
Returns the file name of the current file loaded in Persistent Trending;
supports GET only
BSTR Path
Returns the path for the currently loaded Persistent Trending file;
supports GET only
BOOL ReadOnly
Returns TRUE if the application does not allow any modifications;
supports GET only
BOOL Runtime
Returns TRUE if the application is in runtime mode; supports GET only
BOOL Saved
Returns TRUE if all pending changes are saved or no new changes
have been made; supports GET only
long GroupCount
Returns the number of groups configured in Persistent Trending;
supports GET only
Introduction to Persistent Trending
OLE Automation Methods
1.
void Close(BOOL SaveChanges, BSTR File)
Call this method to shut down the application. If "SaveChanges" is TRUE, the last changes
made will be saved to the user-supplied file.
2.
void Open(BSTR File)
Call this method to open the user-supplied File in Persistent Trending.
3.
void SaveAs(BSTR File)
Call this method to save the current Persistent Trending configuration file in "File."
4.
void EnterRuntime()
Call this method to commit the Persistent Trending server into runtime mode. Data collection
will start (if desired) automatically for the group, and data logging (if configured) will also be
enabled.
5.
void ExitRuntime()
Call this method to exit runtime mode.
6.
void ActivateGroup(BSTR GroupName)
Call this method to activate a specific group (i.e. start data collection and data logging if
configured). Note that each group configured in the Persistent Trending server can start data
collection automatically upon entering runtime mode or when you desire by using this OLE
automation method.
7.
void DeActivateGroup(BSTR GroupName)
Call this method to deactivate a group. This will stop data collection and buffering in memory. If
data logging is enabled for this group, all collected data up to the time of application of this
method will be logged to disk.
8.
long GetGroupRate(BSTR GroupName)
Call this method to obtain the data-collection rate for a specific group.
9.
long GetGroupSamples(BSTR GroupName)
Call this method to obtain the number of samples the group is currently buffering in memory.
10. BOOL GetGroupActivate(BSTR GroupName)
Call this method to find out if the specific group has been configured to activate data collection
and buffering upon Persistent Trending entering runtime mode.
11. long GetGroupPointCount(BSTR GroupName)
Call this method to obtain the number of signals configured for the specific group.
12. BOOL GetPointData(BSTR PointName, long Rate, long Samples, BOOL Stamp,
VARIANT* Values, VARIANT* TDates, VARIANT* MSecs, VARIANT* Quality)
Call this method to retrieve buffered data in memory from Persistent Trending for a specific signal
("PointName"). "Rate" is the desired time resolution of the returned samples. "Samples" is the
desired number of samples to be returned. The variants "Values," "TDates," "MSecs," and "Quality"
represent variant arrays (of element types VARIANT), which contain the values, time and date
stamps, millisecond resolution, and quality information about the retrieved samples.
"Values" variants utilize double values (VT_R8), and "TDates" variants utilize "DATE" types
5.3
TrendWorX Persistent Trending
(VT_DATE). "Msecs" and "Quality" variants utilize VT_I4 types.
The Persistent Trending will allocate memory for these arrays, and the caller of this method must
always FREE the associated memory. Also, if no samples are retrieved, the method will return
FALSE and the variants will be empty.
Upon executing this method, the Persistent Trending server will search all groups configured, for the
first group, which has the "PointName" signal configured. Once found, it will perform a time-stamped
search to retrieve all values buffered in memory that satisfy the desired data-collection rate and
number of returned samples, starting from the most current one. Persistent Trending will search for
the requested data at time intervals reflecting the desired data resolution. The last valid sample
within each search interval will be returned to the caller. If "bStamp" is set to TRUE, the actual time
and date stamp of the retrieved sample will be modified to reflect the time and date stamp of the
search interval.
13. BOOL GetGroups(VARIANT* GroupNames)
Call this method to obtain all the group names configured in the Persistent Trending server. They
are returned in the array of BSTR’s "GroupNames," as before Persistent Trending will allocate
memory for these arrays, the caller of this method must always FREE the associated memory. If no
groups are configured, the method returns FALSE.
14. BOOL GetGroupPoints(BSTR GroupName, VARIANT* GroupPoints)
Call this method to retrieve the signal names configured for a given group. They are returned in
the array of BSTR’s "GroupPoints," and before Persistent Trending will allocate memory for
these arrays, the caller of this method must always FREE the associated memory. If no signals
are configured, the method returns FALSE.
15. BOOL GetGroupLogging(BSTR GroupName)
Call this method to find whether data logging has been enabled for a specific group. The
method returns TRUE if data logging is enabled.
16. BSTR GetGroupFile(BSTR GroupName)
Call this method to retrieve the current "FileName" to which a specific group is data logging.
17. BOOL GetGroupPointData(BSTR GroupName, BSTR PointName, long Rate, long
Samples, BOOL Stamp, VARIANT* Values, VARIANT* TDates, VARIANT* MSecs,
VARIANT* Quality)
Call this method to retrieve buffered data in memory from Persistent Trending for a specific signal
("PointName"). "Rate" is the desired time resolution of the returned samples. "Samples" is the
desired number of samples to be returned. The variants "Values," "TDates," "MSecs," and "Quality"
represent variant arrays (of element types "VARIANT"), which contain the values, time and date
stamps, millisecond resolution, and quality information about the retrieved samples. "Values"
variants utilize double values (VT_R8), "Tdates" variants utilize "DATE" types (VT_DATE), and
"Msecs" and "Quality" utilize VT_I4 types.
Persistent Trending will allocate memory for these arrays, and the caller of this method must always
FREE the associated memory. Also, if no samples are retrieved, the method will return FALSE and
the variants will be empty.
Upon executing this method, the Persistent Trending server will search all Persistent Trend groups
for a group called "GroupName," and then it will search for the "PointName" signal in the requested
group. Then it will perform a time-stamped search to retrieve all values buffered in memory that
satisfy the desired data-collection rate and the number of returned samples, starting from the most
current one. Persistent Trending will search for the requested data at time intervals reflecting the
desired data resolution. The last valid sample within each search interval will be returned to the
caller. If "bStamp" is set to TRUE, the actual time and date stamp of the retrieved sample will be
modified to reflect the time and date stamp of the search interval.
18. BOOL GetPointStat(BSTR GroupName, BSTR PointName, VARIANT* StatValues)
5.4
Introduction to Persistent Trending
Call this method to retrieve statistical information about a specific signal belonging to a specific
group. The returned array of variants "StatValues" will have the following as "VARIANT"
elements:
•
Min value
•
Max value
•
Average value
•
Standard deviation
•
Starting time for statistics
•
Ending time for statistics
Persistent Trending will allocate memory for these arrays, and the caller of this method must
always FREE the associated memory. Also, if no samples are retrieved, the method will return
FALSE and the variants will be empty.
19. BOOL GetGroupPointAt(BSTR GroupName, BSTR PointName, DATE TDateAt, VARIANT*
Value, VARIANT* TDateFound, VARIANT* Qual)
Call this method to retrieve a sample for a given time and date from Persistent Trending. All
the returned information is in variants, and if the method succeeds, it returns TRUE.
20. BOOL GetGroupPointDataAt(BSTR GroupName, BSTR PointName, long Rate, long
Samples, BOOL Stamp, DATE TDateFrom, VARIANT* Values,VARIANT* TDates,
VARIANT* MSecs, VARIANT* Quality)
This method is the same as "GetGroupPointData," with the exception that now you can specify a
starting time and date stamp in "TDateFrom" to retrieve data from Persistent Trending’s memory
buffers.
21. BOOL GetPointDataAt(BSTR PointName, long Rate, long Samples, boolean Stamp,
DATE TDateFrom, VARIANT* Values, VARIANT* TDates, VARIANT* MSecs, VARIANT*
Quality)
This method is the same as "GetPointData," with the exception that now you can specify a
starting time and date stamp in "TDateFrom" to retrieve data from Persistent Trending’s
memory buffers.
22. void Refresh()
Call this method to refresh the Persistent Trending window. This method should be
called only once.
23. boolean GetPointDataUTC(BSTR GroupName, BSTR PointName, long Rate, long
Samples, BOOL Stamp, VARIANT* Values, VARIANT* TDates, VARIANT* MSecs,
VARIANT* Quality)
Call this method to retrieve buffered data in memory from Persistent Trending for a specific
signal ("PointName"). "Rate" is the desired time resolution of the returned samples. "Samples"
is the desired number of samples to be returned. The variants "Values," "TDates," "MSecs,"
and "Quality" represent variant arrays (of element types "VARIANT"), which contain the values,
time and date stamps, millisecond resolution, and quality information about the retrieved
samples. "Values" variants utilize double values (VT_R8), "Tdates" variants utilize "DATE"
types (VT_DATE), and "Msecs" and "Quality" utilize VT_I4 types.
Persistent Trending will allocate memory for these arrays, and the caller of this method must always
FREE the associated memory. Also, if no samples are retrieved, the method will return FALSE and
the variants will be empty.
Upon executing this method, the Persistent Trending server will search all Persistent Trend groups
for a group called "GroupName," and then it will search for the "PointName" signal in the requested
group. Then it will perform a time-stamped search to retrieve all values buffered in memory that
satisfy the desired data-collection rate and the number of returned samples, starting from the most
current one. Persistent Trending will search for the requested data at time intervals reflecting the
5.5
TrendWorX Persistent Trending
desired data resolution. The last valid sample within each search interval will be returned to the
caller. If "bStamp" is set to TRUE, the actual time and date stamp of the retrieved sample will be
modified to reflect the time and date stamp of the search interval. Time stamps are returned in UTC
time format.
24. boolean GetGroupPointDataUTC(BSTR GroupName, BSTR PointName, long Rate, long
Samples, BOOL Stamp, VARIANT* Values, VARIANT* TDates, VARIANT* MSecs,
VARIANT* Quality);
Call this method to retrieve buffered data in memory from Persistent Trending for a specific signal
("PointName"). "Rate" is the desired time resolution of the returned samples. "Samples" is the
desired number of samples to be returned. The variants "Values," "TDates," "MSecs," and "Quality"
represent variant arrays (of element types "VARIANT"), which contain the values, time and date
stamps, millisecond resolution, and quality information about the retrieved samples. "Values"
variants utilize double values (VT_R8), "Tdates" variants utilize "DATE" types (VT_DATE), and
"Msecs" and "Quality" utilize VT_I4 types.
Persistent Trending will allocate memory for these arrays, and the caller of this method must always
FREE the associated memory. Also, if no samples are retrieved, the method will return FALSE and
the variants will be empty.
Upon executing this method, the Persistent Trending server will search all Persistent
Trend groups for a group called "GroupName," and then it will search for the "PointName"
signal in the requested group. Then it will perform a time-stamped search to retrieve all
values buffered in memory that satisfy the desired data-collection rate and the number of
returned samples, starting from the most current one. Persistent Trending will search for
the requested data at time intervals reflecting the desired data resolution. The last valid
sample within each search interval will be returned to the caller. If "bStamp" is set to
TRUE, the actual time and date stamp of the retrieved sample will be modified to reflect
the time and date stamp of the search interval. Time stamps are returned in UTC time
format.
25. boolean GetPointStatUTC(BSTR GroupName, BSTR PointName, VARIANT* StatValues);
Call this method to retrieve statistical information about a specific signal belonging to a specific
group. The returned array of variants "StatValues" will have the following as "VARIANT"
elements:
•
Min value
•
Max value
•
Average value
•
Standard deviation
•
Starting time for statistics
•
Ending time for statistics
Persistent Trending will allocate memory for these arrays, and the caller of this method must
always FREE the associated memory. Also, if no samples are retrieved, the method will return
FALSE and the variants will be empty. Time stamps are returned in UTC time format.
26. boolean GetGroupPointAtUTC(BSTR GroupName, BSTR PointName, DATE TDateAt,
VARIANT* Value, VARIANT* TDateFound, VARIANT* Qual)
Call this method to retrieve a sample for a given time and date from Persistent Trending. All
the returned information is in variants, and if the method succeeds, it returns TRUE. Time
stamps are returned in UTC time format.
27. boolean GetGroupPointDataAtUTC(BSTR GroupName, BSTR PointName, long Rate,
long Samples, boolean Stamp, DATE TDateFrom, VARIANT* Values, VARIANT* TDates,
VARIANT* MSecs, VARIANT* Quality)
This method is the same as "GetGroupPointData," with the exception that now you can specify a
starting time and date stamp in "TDateFrom" to retrieve data from Persistent Trending’s memory
buffers. Time stamps are returned in UTC time format.
5.6
Introduction to Persistent Trending
28. boolean GetPointDataAtUTC(BSTR PointName, long Rate, long Samples, boolean
Stamp, DATE TDateFrom, VARIANT* Values, VARIANT* TDates, VARIANT* MSecs,
VARIANT* Quality)
Call this method to retrieve buffered data in memory from Persistent Trending for a specific signal
("PointName"). "Rate" is the desired time resolution of the returned samples. "Samples" is the
desired number of samples to be returned. The variants "Values," "TDates," "MSecs," and "Quality"
represent variant arrays (of element types VARIANT), which contain the values, time and date
stamps, millisecond resolution, and quality information about the retrieved samples.
"Values" variants utilize double values (VT_R8), and "TDates" variants utilize "DATE" types
(VT_DATE). "Msecs" and "Quality" variants utilize VT_I4 types.
The Persistent Trending will allocate memory for these arrays, and the caller of this method must
always FREE the associated memory. Also, if no samples are retrieved, the method will return
FALSE and the variants will be empty.
Upon executing this method, the Persistent Trending server will search all groups configured, for the
first group, which has the "PointName" signal configured. Once found, it will perform a time-stamped
search to retrieve all values buffered in memory that satisfy the desired data-collection rate and
number of returned samples, starting from the most current one. Persistent Trending will search for
the requested data at time intervals reflecting the desired data resolution. The last valid sample
within each search interval will be returned to the caller. If "bStamp" is set to TRUE, the actual time
and date stamp of the retrieved sample will be modified to reflect the time and date stamp of the
search interval. Time stamps are returned in UTC time format.
29. boolean GetGroupPointInfo(BSTR GroupName, BSTR PointName, VARIANT*
HighRange, VARIANT* LowRange, VARIANT* EngUnits, VARIANT* Description);
This method returns point information for a given signal, such as "HighRange" and "LowRange,"
"EngUnits," and "Description," given a Persistent Trend "GroupName."
30. boolean GetPointInfo(BSTR PointName, VARIANT* HighRange, VARIANT* LowRange,
VARIANT* Description, VARIANT* EngUnits);
This method returns point information for the first signal, such as "HighRange" and "LowRange,"
"EngUnits," and "Description," that matches "PointName."
5.7
TrendWorX Persistent Trending
ProjectWorX Support
Several OLE automation methods facilitate ProjectWorX deployment and WebHMI enhanced
support:
1. ReplaceStringInString(
StringToReplace as String,
OldSubstring as String,
NewSubstring as String
) as String
2. ReplaceHost(
OldHostName as String,
NewHostName as String
) as Long
3. ReplaceFilePath(
OldSubstring as String,
NewSubstring as String
) as Long
4. ReplaceTag(
OldSubstring as String,
NewSubstring as String
) as Long
5. ReplaceHostEx(
OldHostNameSubstring as String,
NewHostNameSubstring as String
MatchCase as Boolean,
MatchWholeWord as Boolean
) as Long
The ReplaceHostEx with parameters MatchCase=False & MatchWholeWord=True works
exactly the same as the ReplaceHost() function.
5.8
Introduction to Persistent Trending
Configuring the Persistent Trending OLE Automation Server
The Persistent Trending OLE automation server can be easily configured to request data from
various OPC servers, and can evaluate expressions as well as internal simulation points.
To start the Persistent Trending configuration:
1.
From the Windows Start menu select Programs > Smar ProcessView > ProjectWorX >
TrendWorx > Persistent Trending.
2.
This opens the Configurator, as shown in the figure below. The screen consists of a single
window with a tree control view. The Configurator provides a standard format for the
configuration database, as well as a sample (default) configuration project. The Configurator
also includes a toolbar and menus with many command functions.
TrendWorX Persistent Trending
Toolbars
To show or hide the toolbar, select Toolbar from the View menu. The toolbar, shown below,
contains the following command buttons.
New: Creates a new configuration.
Open: Opens an existing configuration.
Save: Saves the current configuration.
Add Group: Inserts a new group into the configuration.
Edit Group: Opens the properties dialog box for the selected group.
Duplicate Group: Makes a copy of the selected group.
Delete Group: Deletes the selected group from the configuration.
Add Tags: Deletes current selection, sending it to the clipboard.
Delete Tags: Copies the current selection to the clipboard.
Global Search: Pastes the current contents of the clipboard.
Start/Stop Data Logging: Starts/stops data logging to the database.
Security: Launches the ProcessView Security Configurator.
Menus
5.9
TrendWorX Persistent Trending
The menu bar of TrendWorX Persistent Trending contains the following menus:
•
File
•
Edit
•
View
•
Actions
•
Tools
•
Help
File Menu
The File menu commands are listed in the table below.
File Menu Commands
Command
Shortcut Keys
New
CTRL+N
Open
CTRL+O
Save
CTRL+S
Save As
Exit
Function
Creates a new configuration.
Opens an existing configuration.
Saves the current configuration.
Saves the current configuration under a different name as
a (.b32) file.
Closes Persistent Trending.
Edit Menu
The Edit menu commands are listed in the table below.
Edit Menu Commands
Command
Shortcut Keys
Add Group
CTRL+G
Function
Makes a copy of a Persistent Trending group. Persistent Trending
will duplicate the group by inserting a new group and appending
_x to the group’s name, in addition to duplicating all of the signals
that are already configured.
Deletes a Persistent Trending group.
Opens the Group Status dialog box information for a selected
group. Right-clicking a group and selecting Group Status from
the menu also opens this dialog box.
Adds a group to the opened Persistent Trend.
Edit Group
CTRL+E
Opens the group properties dialog box for the group, which enables you to
change any of the original configuration settings.
Duplicate
CTRL+D
Delete
DEL
Group Status
Add Tags
Delete Tags
Copy Tags
Paste Tags
Group Search
Global Search
5.10
Enables you to create signal connections to already configured
Persistent Trending groups. From the Add Persistent Tags
dialog box, you can add OPC tags by clicking OPC Tags, or add
CTRL+P
expressions and simulated variables by clicking Tags Menu.
Once you add all the tags you wish to configure, click OK to add
these tags to the selected Persistent Trending group.
Enables you to delete signals from already configured Persistent
CTRL+SHIFT+ Trending Groups. From the Delete Persistent Tags dialog box,
P
you can choose which signals to delete. Clicking OK to remove
these tags from the selected Persistent Trending group.
Opens the Copy Tags dialog box, which lists all of the tags
available in the selected group. After you select tags, they are
copied to be pasted into another group.
Pastes all tags existing on the clipboard in the selected group.
Opens the Search and Replace dialog box. You can select all the
tags to which you want to apply the search and replace. Define a
CTRL+H
search string (which can be the fully configured tag or a portion of
it), define a replacement string, and then click Replace.
Activates the Global Search and Replace dialog box. You can
search for a given string across all or selected configured groups
CTRL+F
by clicking Find Groups. Select a replacement string and the
groups to which you want to apply the new string, and then click
the Replace button to continue.
Introduction to Persistent Trending
View Menu
The View menu commands are listed in the table below.
View Menu Commands
Command
Shortcut Keys
Toolbar
CTRL+T
Status Bar
CTRL+B
Select
Language
Logging
Preferences
Function
Shows/hides the configuration toolbar.
Toggles the status bar.
CTRL+ALT+U
Opens the Select Language dialog box (see below). Choose the
language you wish to use for your system (Unicode version only) and
click OK. For navigation purposes, use the buttons and check boxes
in the List section.
SHIFT+L
Opens the Logging Preferences dialog box, which enables
you to log to a .csv file or a .txt file. When using the .csv file,
decimal places will be indicated by the ‘.’.When using the .txt
file, decimal places will be indicated by the’,’. This is useful
for those using Persistent Trending on systems set up for
European standards (using ‘,’ as a decimal separator).
Selecting Languages
The Select Language function on the View menu allows you to choose which language to use in
your display. Choosing Select Language from the View menu opens the Select Language dialog
box, shown in the figure below.
Note: A language resource .dll is required for language switching.
Select Language Dialog Box
Define the parameters listed in the table below. Then click OK to return to the work area.
Select Language Parameters
Parameter
Description
Lists available languages. Depending on which item you have
selected, the view on the left will change. If English is checked,
the languages will appear as their English name. If Localized is
List
checked, the languages will appear with the native country in
parentheses (for languages with several dialects only). When
Native is checked, the languages are displayed the way they would
be written in that language.
Installed Locales Only
If this is checked, local languages appear in the box.
Available Language
Checking this box allows you to choose from available language
Translations Only
translations only.
Logging Preferences
5.11
TrendWorX Persistent Trending
Selecting Logging Preferences from the View menu opens the Logging Preferences dialog box,
shown below, which enables you to log to a .csv file or a .txt file. When using the .csv file, decimal
places will be indicated by the ‘.’.When using the .txt file, decimal places will be indicated by the’,’.
This is useful for those using Persistent Trending on systems set up for European standards (using
‘,’ as a decimal separator).
Logging Preferences Dialog Box
Actions Menu
The Actions menu commands are listed in the table below.
Actions Menu Commands
Command
Shortcut Keys
Start Logging
CTRL+R
Stop Logging
CTRL+L
Activate Group
CTRL+A
Function
Starts data logging. This command is only available when the
Persistent Trend is not logging.
Stops data logging. This command is only available when the
Persistent Trend is currently logging.
Depending on the current state of a particular group, activates
or deactivates the selected group. This will start or stop all
data collection and logging for the selected group. A check
mark indicates that the group is activated.
Tools Menu
The Tools menu commands are listed in the table below.
Tools Menu Commands
Command
Shortcut Keys
Security Login
F6
Security
F7
Configuration
Working
F8
Directory
Function
Prompts for login to the ProcessView Security Server.
Opens the ProcessView Security Configurator.
Sets the working directory where all files associated with
Persistent Trending are kept.
Setting the Working Directory
Selecting Set Working Directory from the Tools menu opens the Set Working Directory dialog
box, shown below, which enables you to configure a custom directory in which all application
configuration files will be stored and retrieved. Click Browse to select the directory.
Set Working Directory Dialog Box
5.12
Introduction to Persistent Trending
Help Menu
The Help menu commands are listed in the table below.
Help Menu Commands
Command
Shortcut Keys
Help Topics
F1
About
Application
Function
Launches the online Help for Persistent Trending.
Launches the About Box, which contains information about
the product version number, copyright, and available disk
space. It also contains contact information.
Groups
The key concept in the configuration of the Persistent Trending server is the Group. A group
represents a logical collection of signals for common processing and buffering.
Adding and Configuring Groups
To add a group, select Add Group from the Edit menu, or press the shortcut keys CTRL+G. This
opens the Persistent Trending dialog box, which enables you to configure a new Persistent
Trending group and (optionally) data logging for that group to a .csv or .txt file. The Persistent
Trending dialog box contains two tabs: the Group Configuration tab and the Logging
Configuration tab.
Group Configuration Tab
The Group Configuration tab of the Persistent Trending dialog box, shown in the figure below,
specifies a name for the new Persistent Trending group, the desired data-collection rate, and the
number of samples to buffer in memory for each signal of the group. The Activate On Start option,
if enabled, automatically starts data collection for the specific group, when the Persistent Trending is
committed to runtime mode. Otherwise, you can start data collection by activating the group during
runtime mode through the Persistent Trending User Interface or through OLE automation.
Group Configuration Tab
5.13
TrendWorX Persistent Trending
Logging Configuration Tab
The Logging Configuration tab of the Persistent Trending dialog box, shown in the figure below,
allows you to configure the Persistent Trending server to log the buffered data to a .csv or .txt file. At
this point, you can:
1.
Enable data logging.
2.
Choose a .csv or .txt file to log using the Browse command.
3.
Choose a .csv or .txt file system maintenance scheme. You may choose to append all data to
the same file (if Never is selected), create a new file every time logging starts (if When
Logging Starts is selected), create a new file every time Persistent Trending writes to disk (if
When Writing to File is selected), or create a new file after a certain interval of time has
passed (if On Interval is selected and an interval is set).
4.
Write more samples to each row using the Compact Logging feature.
5.
Specify the frequency at which data will be written to disk.
6.
Select the desired number format for the .csv or .txt file data.
7.
Select the desired date format.
8.
Select the maximum number of .csv or .txt files to maintain.
If you want to log to multiple files, the Persistent Trending server will create the files by appending to
the file name the corresponding extension for the current file number. Once it reaches the maximum
number of files, it will start overwriting from the first created file.
Logging Configuration Tab
Group Status
Selecting Group Status from the Edit menu opens the Group Status dialog box, shown in the
figure below. The Group Status dialog box displays information for a selected group, such as its
activation state, logging status, logging rate, and number of samples. Right-clicking a group and
selecting Group Status from the menu also opens this dialog box.
5.14
Introduction to Persistent Trending
Group Status Dialog Box
Tags
The Unified Browser enables multiple-tag connections in Persistent Trending. In the configuration,
you can:
•
Add Tags
•
Delete Tags
•
Copy Tags
Adding Persistent Tags
The Unified Browser enables multiple-tag connections in Persistent Trending. Selecting Add Tags
from the Edit menu opens the Add Persistent Tags dialog box, shown in the figure below, which
enables you to create signal connections to already configured Persistent Trending groups. From
the Add Persistent Tags dialog box, you can add OPC tags by clicking OPC Tags, or add
expressions and simulated variables by clicking Tags Menu. Once you have added all the tags you
wish to configure, click OK to add these tags to the selected Persistent Trending group.
Adding Persistent Tags
Deleting Persistent Tags
Selecting Delete Tags from the Edit menu opens the Delete Persistent Tags dialog box, shown in
the figure below, which enables you to delete signals from already configured Persistent Trending
Groups. Choose which signals to delete, and then click OK to remove these tags from the selected
Persistent Trending group.
5.15
TrendWorX Persistent Trending
Deleting Persistent Tags
Copying Persistent Tags
Selecting Copy Tags from the Edit menu opens the Copy Tags dialog box, shown in the figure
below, which lists all of the tags available in the selected group. After you select tags, they are
copied to be pasted into another group.
Copying Persistent Tags
Search and Replace
The Persistent Trending configuration enables you to perform two different kinds of search and
replace functions:
•
Group search
•
Global search
Group Search
Selecting Group Search from the Edit menu opens the Search and Replace dialog box, shown in
the figure below. Click the Tags Menu button to select all the tags to which you want to apply the
search and replace. Define a search string (which can be the fully configured tag or a portion of it),
define a replacement string, and then click Replace.
5.16
Introduction to Persistent Trending
Group Search and Replace Dialog Box
Global Search
Selecting Global Search from the Edit menu opens the Search and Replace dialog box, shown in
the figure below. You can search for a given string across all or selected configured groups by
clicking Find Groups. Select a replacement string and the groups to which you want to apply the
new string, and then click the Replace button to continue.
Global Search and Replace Dialog Box
Using the Persistent Trending OLE Automation Server
The purpose of the Persistent Trending OLE automation server is to function primarily as a memorybased data-logging engine, which buffers data for user-configured signals at desired data-collection
rates in memory. In addition, the buffered data can be configured to be data-logged in a .csv or .txt
file.
The Persistent Trending automation server is a stand-alone (EXE) server, which registers as the
active running object with the tables maintained by OLE. This means that there is only one instance
of Persistent Trending running per computer, and all interested clients should get an interface
pointer to that running instance (rather than create a new Persistent Trending object, which will fail if
Persistent Trending is already running).
The Persistent Trending server should be started and running at the time of committing a process
control/HMI application to runtime mode, so it will have enough time to buffer data before any client
requests are processed. There are several ways this can be done.
5.17
TrendWorX Persistent Trending
You can start the Persistent Trending server manually, from the Program Group, or place it in the
StartUp Folder. In either case, the Persistent Trending server will load the most-recent configured
file. Then it can be committed into runtime mode by choosing Start Logging from the Actions
menu, or clicking the Traffic Light button on the toolbar.
You can evoke the Persistent Trending server programmatically. The following is a small Visual
Basic code sample used to initiate the Persistent Trending server, to load a desired configuration
file, and to enter runtime mode:
Dim myTrend As Object
‘ Create Persistent Trending Server Object
Set myTrend = CreateObject("TWXBgTrend. Document")
‘ load configuration file
myTrend.Open "D:\MyDirFE32\sim10.b32"
‘ Show Persistent Trending Window
myTrend.Visible = True
‘ Refresh Persistent Trending Window
myTrend.Refresh
‘ Enter Runtime
myTrend.EnterRuntime
Once this code is executed, Persistent Trending will initiate, load the desired configuration file, show
its window, and enter runtime mode. At this point, any automation client of the Persistent Trending
server should be able to get an instance to the running TWXBgTrend object, and it will be able to
interact with the server completely.
Here is another Visual Basic code sample used to actually retrieve data from Persistent Trending’s
buffers:
Dim myTrendObject As Object
‘ Get Running Object
Set myTrendObject = GetObject(, "TWXBgTrend.Document")
‘ string sPoint is the desired Point Name for which data will be
‘ retrieved
' Set up variables to receive data from Background Trending Server
‘ A variant array for sample values
Dim Values As Variant
‘ A variant array for Time and Date stamps
Dim TDates As Variant
‘ A variant array for Msecs timestamps
Dim MSecs As Variant
‘ A variant array for OPC quality flags
Dim Qual As Variant
‘ Index used for iteration
Dim l As Long
‘ RateVal is a long representing the desired data resolution rate
5.18
Introduction to Persistent Trending
‘ SamplesVal is a long representing the desired number of
‘ samples to retrieve
Dim sPointVal As String
Dim vEntry As Variant
Dim bRet As Boolean
Dim strValue As String
' Call Background Trending automation method
bRet = myTrendObject.GetPointData(sPoint, RateVal, SamplesVal, FALSE, Values, TDates,
MSecs, Qual)
' Fill In Values in a listbox control called PointValues
PointValues.Clear
'Fill In !!!
For l = LBound(Values) To UBound(Values)
vEntry = Values(l)
strValue = TypeName(vEntry)
sPointVal = Str(vEntry)
PointValues.AddItem sPointVal
Next l
Note that error-checking code is omitted for clarity. The caller should always check for empty arrays,
in case there were no data to return.
Persistent Trending OLE Automation Examples
The ProcessView installation directory Program Files\Smar\ProcessView\Examples\TrendWorX
Examples\TrendWorX VBA Examples contains a sample TrendWorX file, called
PersistentTrendVBADemo.t32, that demonstrates how to use Persistent Trending's OLE
automation properties. There is also a readme.txt file that explains how to use this sample Visual
Basic application.
Security
The Persistent Trending Server is interfaced to the ProcessView Security Server, which you can
access by choosing Security from the Tools menu. It currently supports the security actions shown
in the dialog box below:
•
Activate Group
•
Deactivate Group
•
Edit Group
•
Exit Application
•
Exit Data Logging
5.19
TrendWorX Persistent Trending
Actions/Users Association Dialog Box
•
ProcessView Tray: Autostart
•
ProcessView Tray: Autostop
•
Save File
Persistent Trending is a very flexible OLE automation server to configure and use. Its main
advantage is that it allows you to define and configure custom client-side groups, with individual
data-collection rates and number of samples to configure. Persistent Trending is interfaced to the
ProcessView OLExpress thin-layer OPC wrapper .dll, which transfers requests for data to the
underlying OPC server.
You can take some steps to optimize Persistent Trending performance and system resource usage.
Defining tags (signals) from the same OPC server in Persistent Trending groups can improve
system resource usage by Persistent Trending. Also, avoid requesting the same tags in different
Persistent Trending groups to speed up performance. Although Persistent Trending does not require
you to adhere to these optimizations, using them has many benefits, including enhanced
performance and load balancing.
Persistent Trending also has support for calculating expressions. The time resolution of the
expressions is not as granular as that of ordinary OPC server tags. Under a heavy data-logging
load, expressions may not get enough time to evaluate. In any case, Persistent Trending cannot
evaluate expressions faster than 250 milliseconds, assuming no data-logging load and a reasonable
number of points overall (about 50 OPC tags).
5.20
Chapter 6
REPORTING
Features in TrendWorX Reporting
TrendWorX Reporting includes the following key features:
•
Microsoft Excel reporting password support
•
Microsoft Excel reporting performance tuning
•
Enhanced data retrieval support
•
Microsoft ADO 2.7 support
•
Updated Microsoft Excel date handling
•
Microsoft Excel FDA password support. TrendWorX Reporting supports creating Microsoft
Excel reports where a random password will be created to lock the worksheet if desired. The
password is not stored anywhere, therefore providing added security for FDA reports. This
support is on a per-report basis.
•
Report tag reordering
•
Report time span enabled for periodic reports
•
TraceWorX debug tracing support
•
Enhanced expression support
•
Daylight savings time support
Note: TrendWorX up to and including Version 6.1x is using the Windows-based APIs for converting
a time from local time to UTC or from UTC to local time. The Windows APIs do not correctly adjust
the conversion for the daylight savings time if the timestamp to be converted was obtained from a
different time period (i.e. it was obtained in "summer" time but now we have "winter" time).
TrendWorX Version 7.x introduced time conversion utilities that account for this discrepancy. There
are, however, some things to consider:
•
These functions are used by default (no user enabling is required).
•
This is what they do in order to convert each time stamp:
o
They check Windows for the PC Time Zone Settings and to see if automatic daylight savings
is enabled.
o
They also obtain from Windows the times/dates for switching over. (These dates do not
change; they are in the form of, e.g., the first Sunday of April.)
o
Depending on the previous information, the functions properly adjust the conversion times to
compensate for daylight savings time.
TrendWorX also includes the following features:
•
Data-retrieval filters
•
Scheduling and load-balancing support
•
Microsoft Excel integration and template support
•
HTML and e-mail support for Microsoft Excel-based reporting
•
Unicode version support
•
Report integration to historical database, operator comments, and batch information
•
Multiple database support
•
Easy-to-use report configuration wizard
•
Microsoft SQL 2000 support
•
Tag column description support
6.1
TrendWorX Reporting
Introduction
TrendWorX has the capability to log data to a relational database. In addition to the standard tools
available for accessing these data, TrendWorX has built-in capability for historical data utilities and
reporting. The tools available to perform historical data utilities and reporting are:
•
TrendWorX SQL Tool ActiveX Control
•
TrendWorX SQL Reporting
Starting TrendWorX Reporting
To start the application within the TrendWorX Container, select Reporting from the Tools menu, as
shown below. To start from Windows Explorer, double-click the program icon for "TWXReport.exe."
TrendWorX Container Tools Menu
TrendWorX Reporting will be launched with the last configured file (.rtw), as shown below. If this is
the first time using TrendWorX Reporting, a blank configuration is displayed.
TrendWorX Reporting Configured File
TrendWorX Reporting displays a two-pane screen. The left-hand pane contains a "tree" of all the
configured reports and the tags for each report. The right-hand pane is a list view providing report
6.2
Features in TrendWorX Reporting
configuration and status information. TrendWorX Reporting can execute reports containing multiple
database groups and/or logging groups. The tree in the left pane sorts all signals by database type.
Note: Clicking a column heading in the right pane of the display, such as "Report," "Enabled," or
"Report Type," sorts the list of reports by that category.
Reporting Modes
TrendWorX Reporting supports two modes of operation:
1. A configuration mode in which you can configure reports without any report processing.
2. A runtime mode in which all reports are processed and full configuration is available.
TrendWorX SQL Tool ActiveX Control
Version 7.x included an enhanced data-retrieval system, which utilizes an updated approach to
creating historical reports:
•
Data filter selection other than Raw will result in data time stamped at the beginning of each
subinterval.
•
When retrieving data using data filters other than Raw, subintervals for which there are no
data because of no data-logging activity will be marked as “empty” slots at the corresponding
time with an empty (VT_EMPTY) value. You can check the returned qualities for further
processing.
•
The historical qualities supported are as follows:
o
OPCHDA_EXTRADATA
More data may exist
o
OPCHDA_INTERPOLATED
Interpolated data value
o
OPCHDA_RAW
Raw data value
o
OPCHDA_CALCULATED
Calculated data value
0x0001
0x0002
0x0004
0x0008
o
OPCHDA_NOBOUND
No data found to provide upper or lower bound
0x0010
o
OPCHDA_NODATA
No data collected. Archiving not active
0x0020
o
OPCHDA_DATALOST
Calculation started/stopped/lost
o
OPCHDA_CONVERSION
Scaling / conversion error
o
OPCHDA_PARTIAL
0x0040
0x0080
0x0100
Aggregate value is for an incomplete interval
The TrendWorX SQL Tool, which is invisible during runtime mode, is an ActiveX control that you can
use to browse the TrendWorX data-logging database and to retrieve time-based historical data using
various data filter types. You can access this tool through the Insert Object dialog box, as shown
below, or directly from the ActiveX toolbar of the TrendWorX Container.
6.3
TrendWorX Reporting
Insert Object Dialog Box
During configuration, you can place this component inside TrendWorX displays, VBA forms, or any
other container.
Use the TWXSQL Tool Control Properties dialog box, shown below, to configure the component.
This dialog box has only one tab, the General tab shown below, which prompts you to complete the
configuration.
TWXSQL Tool Control Properties Dialog Box
To configure the SQL Tool control, do the following:
6.4
1.
From the Provider Type list box in the TWXSQL Tool Control Properties dialog
box, select the OLE Database (DB) Provider type relating to the TrendWorX
historical database. Currently, the following OLE DB Providers are supported:
•
Microsoft Access
•
Microsoft SQL Server
•
Oracle
Features in TrendWorX Reporting
When you select a database type and then click Connect, the corresponding OLE DB Provider
configuration dialog box opens, as shown below.
For Microsoft SQL Server, select a server name, an authentication type (Windows NT Integrated
Security or user name and password), and the desired historical database, as shown in the figure
below.
OLE DB Provider Configuration for SQL Server Databases
For Microsoft Access connections, simply navigate to the desired .mdb file by clicking on the
browser button, as shown in the figure below.
6.5
TrendWorX Reporting
OLE DB Provider Configuration for Microsoft Access Databases
To connect to an Oracle database, fill in the appropriate information, as shown in the figure below.
OLE DB Provider Configuration for Oracle Databases
6.6
Features in TrendWorX Reporting
2.
Select the database group object name by clicking DBGroup in the TWXSQL Tool
Control Properties dialog box. This opens the Select Database Object list box, as
shown in the figure below, which lists all of the database group objects configured
for data logging in the selected database connection. To select a specific object,
double-click the group object name.
Select Database Object List Box
3.
Select the logging group name by clicking Group in the TWXSQL Tool Control
Properties dialog box. This opens the Select Group Object list box, shown below,
which displays all configured groups for data logging under this database. Again,
you can select a desired group by double-clicking the group name in the list.
Select Group Object List Box
4.
Select the signal name by clicking Signal in the TWXSQL Tool Control Properties
dialog box. This opens the Select Group Signal list box. Select a signal name from
the list of all the signals configured in the group, and then click OK.
6.7
TrendWorX Reporting
Select Group Signal List Box
5.
Choose the data filter type to be used in historical data retrieval from the
corresponding list in the Filter field of the TWXSQL Tool Control Properties dialog
box, as shown below.
TWXSQL Tool Control Filters
The following filters are currently supported:
6.8
•
Raw (actual samples stored in the database)
•
Average
•
Min
•
Max
Features in TrendWorX Reporting
•
StDev (standard deviation)
•
MinTime (returns actual time for Min value)
•
MaxTime (returns actual time for Max value)
•
Last (last sample in averaging interval)
•
AllStat (all statistical values averaged through the entire period)
•
Running Max
•
Running Min
•
Running Average (exponentially weighted moving average)
•
Moving Average
•
Moving Max
•
Moving Min
If the data filter selected is Moving Average, Moving Max, or Moving Min, the data will be
retrieved using a sliding statistics window, taking the last number of samples into consideration.
6.
Select the maximum number of samples to retrieve from the Samples field of the
TWXSQL Tool Control Properties dialog box. This is used mostly in the case of a
Raw data filter to avoid returning an excessive number of samples.
7.
Select the data time resolution (in msec) to be used for data filtering (averaging)
from the Rate (msec) field of the TWXSQL Tool Control Properties dialog box. This
interval is used in the case of selecting a data filter other than Raw. It divides the
search interval into subintervals of the entered resolution (in msec) and averages
all samples within that subinterval. If the value is set to 0, the TrendWorX SQL Tool
will retrieve the desired average across the entire time-search interval.
During runtime mode, you can use the OLE Automation methods of the TrendWorX SQL Tool to
perform the following tasks:
•
Set a start time and date for historical data retrieval.
•
Set an end time and date for historical data retrieval.
•
Set the desired data filter (or use the configured one).
•
Set the desired time resolution for the historical data (or use the configured one).
•
Retrieve historical data for the signal selected during configuration or any other signal.
The TrendWorX SQL Tool has OLE Automation methods to set a new database connection by
specifying the corresponding OLE DB Provider connection string. In addition, TrendWorX SQL Tool
supports OLE Automation methods to return all database objects configured for a given database
connection, all database object groups, and all tags for a given group. The OLE Automation
methods are as follows:
6.9
TrendWorX Reporting
Definition Type
Constant definitions
Database type
definitions
TrendWorX SQL Tool
error codes
Definitions
enum {
Raw
Average = 1
Minimum
Maximum
StDev
MinTime = 5
MaxTime
Last
AllStat
Running Max
Running Min
Running Avg
Moving Avg
Moving Max
Moving Min
} TWXSQLTOOLFILTER
enum {
None
MSAccess
MSSQLServer
Oracle
Functions
=0
=2
=3
=4
=6
=7
=8
=9
= 10
= 11
= 12
= 13
= 14
=0
=1
=2
=4
} TWXSQLTOOLDBASE
enum {
ErrNone = 0
ErrInvalidFilter
=1
ErrDBaseType = 2
ErrConnFailed
=3
ErrQueryFailed = 4
ErrNoResults
=5
ErrNotEnabled = 6
ErrInvalidParam = 7
ErrInvalidRate
=8
ErrInvalidMaxSamples = 9
ErrProcessing
= 10
ErrInvalidTDate = 11
ErrInvalidTableName = 12
ErrInvalidSignal = 13
ErrNoData
= 14
ErrInvalidFilterOrder = 15
ErrUnableToLoadLangServer = 16
ErrTranslationFailed
= 17
ErrOccuredInTranslation = 18
} TWXSQLTOOLERROR
Used in specifying a data
filter
Used in specifying
database types
Identifies the various
error codes
TrendWorX SQL Tool ActiveX Control: Properties
BSTR GroupName
BSTR GroupSignal
TWXSQLTOOLFILTER
DataFilter
BSTR DatabaseObject
long Rate
long MaxSamples
BSTR OLEDBString
short DatabaseType
short FilterOrder
Data logging-group name.
Signal name within data-logging group.
Data-retrieval filter.
Database group name.
Data-retrieval rate (in msec).
Maximum number of samples to retrieve.
OLE DB connection string to historical database.
Database type (e.g. Microsoft Access, Microsoft SQL, and Oracle).
Filter order to use for "Moving Average," "Moving Max," and "Moving
Min."
Notes
The "Rate" value is specified in milliseconds, and it can have a maximum value of 1814400000
(about 21 days). Note that this is the maximum sample-to-sample resolution in the returned historical
data. If the rate is set to "0," all the historical data within the search interval will be averaged.
6.10
Features in TrendWorX Reporting
The "MaxSamples" value specifies the maximum number of samples to be retrieved when the data
filter is set to "Raw." It can range from 3 to 3600.
TrendWorX SQL Tool ActiveX Control: Methods
boolean GetDBases(VARIANT*
DBNames)
boolean GetGroups(VARIANT*
GroupNames)
BSTR GetGroupTable()
void SetStartTimeDate(DATE
StartDate)
void SetEndTimeDate(DATE
EndDate)
boolean
GetGroupSignals(VARIANT*
SignalNames)
boolean
GetSignalValues(VARIANT*
Values, VARIANT* TDates,
VARIANT* MSecs, VARIANT*
OPCQualities, VARIANT*
HDAQualities)
TWXSQLTOOLERROR
GetLastError()
void SetLangID(long langID)
long GetLangID()
Returns all TrendWorX SQL Server database objects for
a given database connection.
Returns all group objects for a given TrendWorX SQL
Server S database object.
Returns the name of the table that the current group is
data-logging.
Sets the start time and date for historical data retrieval.
Sets the end time and date for historical data retrieval.
Returns the signal names for the currently selected
group.
Retrieves the historical data based on the selected
ODBC data source name, TrendWorX SQL Server
database object, group object, selected signal, desired
time resolution, desired data filter, start time and date,
and end time and date.
Returns the most current error code, if any operation
failed.
Sets the LCID for the language resources and support.
Returns the currently selected LCID.
Notes
The "VARIANT*" notation in the method parameters refers to a safe array of data. If the return code
is "TRUE," TrendWorX SQL Tool will allocate a "SafeArray" of data of the appropriate data type and
returned it with the values. The caller MUST free this array of data.
A typical VB type code segment for retrieving data from the returned arrays, and converting them to
a string might look like the following:
Dim strEntry As String
For i = LBound(values) To UBound(values)
strEntry = "Sample#" + Str(i) + " "
strEntry = strEntry + "Val: " + Str(values(i)) + " "
strEntry = strEntry + "Time: " + Str(TDates(i)) + " "
strEntry = strEntry + "Msec: " + Str(MSecs(i))
The "MSecs" array holds the milliseconds time stamp of the sample.
If the data filter is set to "AllStat," the returned array will have the following ordered results:
•
Maximum Value
•
Maximum Actual Time
•
Minimum Value
•
Minimum Actual Time
•
Average Value
•
Standard Deviation
•
Last Value
A total of seven values will be computed during the entire interval spanning start time and date up to
end time and date.
6.11
TrendWorX Reporting
TrendWorX SQL Tool ActiveX Control: Events
StartedTask
Fired to indicate that historical data retrieval has
started.
FinishedTask
Fired to indicate that historical data retrieval has
finished.
AbortedTask
Fired to indicate that historical data retrieval has been
aborted due to error.
TrendWorX includes VBA-based examples to demonstrate the usage of the Reporting tools. Under
the \Smar\ProcessView\Examples\TrendWorX Examples\TrendWorX Data Logging and Reporting
folder, there is a TrendWorX display called "TrendSQLTool.t32," shown in the figure below, which
utilizes VBA forms to demonstrate the usage of TrendWorX SQL Tool ActiveX control. In the same
folder, there is also a "Readme.txt" file, which contains instructions on how to use the example.
TrendWorX SQL Tool ActiveX Control Example
TrendWorX SQL Reporting
This application is a stand-alone OLE Automation server capable of generating reports from the
TrendWorX SQL Data Logging Server databases. It is integrated within the TrendWorX container,
and it can be used as a stand-alone application.
Toolbar
All actions associated with TrendWorX Reporting can be accessed through the menu commands
and the toolbar, shown in the figure below.
6.12
Features in TrendWorX Reporting
TrendWorX Reporting Toolbar
The TrendWorX Reporting toolbar contains the following command buttons. For more information
about these commands, refer to the Menus section.
•
New
•
Open
•
Save
•
Add report
•
Edit report
•
Delete report
•
Report status
•
Cancel report
•
Duplicate report
•
Start reports
•
Stop reports
•
Security configuration
•
About
•
Help
Menus
The TrendWorX Reporting menu bar contains the following menus:
•
File menu
•
Edit menu
•
View menu
•
Actions menu
•
Tools menu
•
Help menu
Some of the commands available on these menus are standard Windows options. However, some
options are specific to TrendWorX Reporting.
File Menu
The File menu contains the following commands:
Command
Shortcut Keys
Function
New
CTRL+N
Creates a new report.
Open
CTRL+O
Opens an existing report.
Save
CTRL+S
Saves the open report to file.
Save As
Saves the report under a different name.
Recent
Opens the most recently used file(s).
Exit
Closes the application.
For further explanations of these commands, please refer to your Microsoft Windows
documentation.
6.13
TrendWorX Reporting
Edit Menu
The Edit menu contains the following commands:
Command
Shortcut Keys
Function
Add report
CTRL+A
Adds a report to the configuration.
Edit report
CTRL+E
Edits an already-configured report.
Enable report
CTRL+SHIFT+E
Makes a report available for execution.
Duplicate
CTRL+D
Duplicates the selected report.
Delete report
DEL
Deletes the selected report.
View Menu
The View menu contains the following commands:
Command
Shortcut Keys
Function
Toolbar
CTRL+T
Toggles the toolbar
Status bar
CTRL+B
Toggles the status bar.
Prompts you to select a language. If a language resource
.dll is present in the TrendWorX "Bin" directory,
Select
TrendWorX will automatically load it, convert its menus
CTRL+ALT+U
language
and dialog boxes to the chosen language, start up in that
language.
Reporting
SHIFT+R
Opens the Reporting Preferences dialog box.
preferences
Reporting Preferences
The Report Threads field in the Reporting Preferences dialog box, shown below, specifies the
number of threads on which to run reports. Because TrendWorX Reporting is a multithreaded
application, you can choose to run up to 20 reports simultaneously.
Reporting Preferences Dialog Box
You can select to log to a .csv file or a .txt file. When you are using a .csv file, decimal places will be
indicated by the ‘.’ When you are using the .txt file, decimal places will be indicated by the’,’. This is
useful if you are using the TrendWorX Reporting on systems set up for European standards, which
use ‘,’ as a decimal separator).
6.14
Features in TrendWorX Reporting
You can also indicate whether you want to show Microsoft Excel after a report has run. This option is
selected by default but may be deselected if you do not wish to view your report after each instance.
A temporary path is used for intermediate table creation. When you click Temp Path in the
Reporting Preferences dialog box, TrendWorX Reporting will use a temporary database table to
create the report and then populate Microsoft Excel, .csv files, or the target database. Prior to
Version 6.00, this temporary table was created in the source historical database. Thus, it added an
additional load to the database while the database was actively data logging and retrieving historical
data for clients. Now this temporary table is created inside a temporary Microsoft Access (.mdb) file
in the chosen temporary path, and it is deleted as soon as the report is completed.
If Make Thread Priority Below Normal is checked in the Reporting Preferences dialog box,
TrendWorX Reporting will start its background report processing threads at a lower priority than
normal, so that the system will be able to spend more time executing other more important tasks.
Note: By default, TrendWorX Reporting uses only a single thread. This allows for lower usage of
CPU on single-processor systems. In general, it is suggested that you increase the number of
threads to more than one only if the TrendWorX Reporting tool is running on a dedicated node.
In the Unicode version, the Language and Subset fields in the Reporting Preferences dialog box
allow you to select a desired language set from the Language Server. To select a language, click the
... button to the right of the Language field.
Actions Menu
The Actions menu contains the following commands:
Command
Shortcut Keys
Function
Opens the Report Status dialog box, which
Report status
SHIFT+S
provides you with pertinent information about the
report.
Cancels the report that is currently selected and
Cancel report
SHIFT+A
running.
Start reports
CTRL+R
Starts previously configured reports.
Stop reports
CTRL+SHIFT+R
Stops the reports that are currently running.
Tools Menu
The Tools menu contains the following commands:
Command
Shortcut Keys
Function
Opens the Security Login dialog box. Enter your
Security login
F6
user name and password to access the Security
Server.
Opens the Security Configurator. If a proper login
Security
F7
has not occurred, you will be prompted for one at
configuration
this time.
Opens the Set Working Directory dialog box,
which allows you to set the directory in which all files
Working directory
F8
associated with this report will be located. Click
Browse to select the directory.
Help Menu
The Help menu contains the following commands:
Command
Shortcut Keys
Function
Launches the online Help for TrendWorX
Help Topics
F1
Reporting.
Launches the About Box, which contains
information about the product version
About Application
number, copyright, and available disk space.
It also contains contact information.
Report Configuration
In configuration mode, you can add, edit, or delete reports without report processing taking place. To
add a report, select Add Report from the Edit menu or the toolbar. This opens the Report
Configuration Wizard, which is a series of dialog boxes that guide you through the report
6.15
TrendWorX Reporting
configuration.
•
General
•
Tags
•
Report
•
Target
•
Schedule
•
Range
Note: For TrendWorX Reporting to run properly on your machine, the TrendWorX SQL Data Logger
must be running.
General
The first step in configuring a report is to pick the database from which the report data will be
retrieved. There are two ways that the report will be referenced: in the report window and in the
actual report. In the General dialog box, shown below, the Report Name is what will appear in the
window, and the Target Name is what will appear in the report. While both of these names are
somewhat arbitrary, you must enter a name in both fields. If either field is left blank, you will not be
able to continue with the configuration of the report.
General Dialog Box
The Enabled check box controls whether the report will be scanned for processing within runtime
mode. Any report that is enabled is removed from the active scan list of reports to be processed. All
reports that are not enabled will show up with an “X” mark on the left-hand pane tree structure. If you
do not select a report to be enabled upon creation, you can select it by using the right-click menu or
by selecting Edit Report from the Edit menu.
Note: If an error is encountered during the adding or editing of an existing report, the report will
automatically reset the "Enabled" flag if it is properly configured. In addition, if a report copy is
inserted its "Enabled" flag will be reset by default.
6.16
Features in TrendWorX Reporting
Note: If you choose to include qualities, the maximum number of tags to be included in the report is
reduced to a total of 55. If qualities are not selected, the maximum number of tags to be included in
the report is 110 tags.
To enter an expression for the Target Name, click the Expr button. This opens the Expression
Editor. When you are finished, click Next to continue the Report Configuration Wizard. This opens
the Tags dialog box.
Note: For information about the Expression Editor, please see the Expression Editor help
documentation.
Tags
The next step in the Report Configuration Wizard is the Tags dialog box, shown below, which
prompts you to select the database group, group, and tags used for the report.
TrendWorX Reporting supports the use of a Description text on a per-report-tag basis. This option, if
used, will label the resulting data columns of the target report using the defined Description entries in
the TrendWorX Configurator. By default, when a signal is inserted in the TrendWorX Configurator,
the Description entry of the signal will be its logging name. You can override the Description field,
which will be used to label the resulting data column in the final report. If the Description field in the
TrendWorX Configurator is left empty, the logging name will be used to label the resulting data
column of the report. The TrendWorX Reporting application will still display in the tree view or edit
dialogs the report tags using their logging names.
In addition, for the Unicode version of TrendWorX Reporting, the Description field can be languagealiased to be used with various languages.
Note: TrendWorX Reporting also supports report generation across multiple database groups. The
Tags dialog box lists and sorts all report signals based on database group, type, etc. You can use
following procedure for each database group:
1.Click the DSN button to establish a connection to the source historical database.
2.Click the DBase Group button to select a database group.
3.Click the Group button to select a logging group.
4.Click the Tags button to select report signals (tags) from the data-logging group for each individual
database group and/or logging group. If you have selected multiple tags, you can change the order
of the tags for reporting. Simply the desired tags to move up or down by clicking on the Up and
Down arrow buttons to the right of the tags list, as shown below.
Tags Dialog Box
6.17
TrendWorX Reporting
Selecting a Data Source
In the Data Source field of the Tags dialog box, you can select the source from which the data for
the report will come. Click the DSN (Data Source Name) button to open the Select Data Source
dialog box, shown below.
Select Data Source Dialog Box
Select the desired database. This should be a database where the TrendWorX SQL Data Logger is
configured to log data. As soon as the selection is made, the TrendWorX Reporting will fill in the
type of the source database, the user ID, and name. When you have selected the data source, click
OK. To continue the Report Configuration Wizard, click Next in the Tags dialog box.
Note: If TrendWorX Reporting is running on a PC other than the one on which the TrendWorX SQL
Data Logger is running, you will have to configure an ODBC data source by connecting to the
databases on which TrendWorX SQL Data Logger is logging data.
Selecting a Database Group
You must choose a database group from those configured for the database you selected in the
Select Data Source dialog box. Click DBase Group in the Tags dialog box. Then select the desired
database from the Select Database Group list box, as shown below.
Select Database Group List Box
Selecting a Group Object
You must select a configured group within the selected database group. Click Group in the Tags
dialog box. This opens the Select Group Object list box, shown below, which contains a list of all
groups configured for the specific database group. Then select a desired group from the list.
6.18
Features in TrendWorX Reporting
List of Available Groups
Selecting a Group Signals
You must also select the tags that will be used for the basis of the report. Click Tags in the Tags
dialog box. This opens the Select Group Signals list box, shown below. Then select the appropriate
tags from the list.
List of Available Tags
Once you have made all your selections, click Next to continue the Report Configuration Wizard.
This opens the Report dialog box.
Report
The next step in the Report Configuration Wizard is the Report dialog box, shown below. This
allows you to select which data filter to use when creating the report, as well as how often to process
data.
Version 7.0 introduced an enhanced data-retrieval system, which utilizes an updated approach to
creating historical reports:
•
Data filter selection other than Raw will result in data time stamped at the beginning of each
subinterval.
•
When creating reports using data filters other than Raw, subintervals for which there are no
data because of no data-logging activity will be marked as “empty” slots at the corresponding
time stamp within the database, .csv or Microsoft Excel target report.
•
The historical qualities supported are as follows:
o
OPCHDA_EXTRADATA
More data may exist
o
OPCHDA_INTERPOLATED
Interpolated data value
0x0001
0x0002
6.19
TrendWorX Reporting
o
OPCHDA_RAW
Raw data value
o
OPCHDA_CALCULATED
Calculated data value
0x0004
0x0008
o
OPCHDA_NOBOUND
No data found to provide upper or lower bound
0x0010
o
OPCHDA_NODATA
No data collected. Archiving not active
0x0020
o
OPCHDA_DATALOST
Calculation started/stopped/lost
o
OPCHDA_CONVERSION
Scaling / conversion error
o
OPCHDA_PARTIAL
Aggregate value is for an incomplete interval
0x0040
0x0080
0x0100
Report Dialog Box
Note: When running an "AllStats" report for every month or year, the report should return the Min,
Max, Avg (and StDev) for the last month or year for the specified tags. Also, only one value for each
of the stats should be reported per tag. To do this properly set all values in the Process Data Every
field of the Report dialog box to "0."
The following table describes the different Data Filter types listed in the Data Filter field of the
Report dialog box.
Filter Type
Description
All of the actual (raw) samples stored in the database will be retrieved and
time-aligned to produce the report. If no samples were stored for a specific
time interval, a "NULL" value will be stored. You can override this by
Raw
enabling the Backfill Empty Cells option. As a result, TrendWorX
Reporting will copy over the previous sample value (if it is available). This is
6.20
Features in TrendWorX Reporting
Average
Min
Max
StDev
Last
All Statistics
RunningMax
RunningMin
RunningAvg
Moving Average
Moving Max
Moving Min
Totalizer
a time-intensive and CPU-consuming report type that may increase
hardware requirements or prolong report execution times.
Divides the overall time range of the report into subintervals, and provides
the computed average sample.
Divides the overall time range of the report into subintervals, and provides
the computed minimum sample.
Divides the overall time range of the report into subintervals, and provides
the computed maximum sample.
Divides the overall time range of the report into subintervals, and provides
the computed standard deviation sample.
Divides the overall time range of the report into subintervals, and provides
the computed the computed last value sample.
The columns of the report will be the statistical quantities "Average," "Min,"
"Max," "StDev," etc. computed for every subinterval.
Running maximum value.
Running minimum value.
Exponentially weighted moving average.
Average computed over a sliding time window.
Maximum computed over a sliding time window.
Minimum computed over a sliding time window.
Performs totalizer function.
If Include Qualities is checked in the Report dialog box, values, OPC Data Access and historical
data qualities will be retrieved.
The Filter Order field becomes available when the Moving Average, Moving Max, or Moving Min
filter is selected under Data Filter. If Filter Order = X, then X samples in the past from the current
time will be used to calculate the Moving Average, Moving Max, or Moving Min.
Other Options
The following table lists the functions of the Input Signal and Totalizer Type fields in the Report
dialog box.
Function
Description
Amount per second
The signal represents data in seconds.
Amount per minute
The signal represents data in minutes.
Amount per hour
The signal represents data in hours.
Amount per day
The signal represents data in days.
When Continuous is checked, the Totalizer will keep counting,
starting from 0 until it comes to the end of the trend period, or
Continuous
until the integrated value exceeds the Auto Reset Level (a
maximum limit).
When Preload is checked, the Totalizer commences counting
from any value. This is especially useful when totalizing must be
Preload
“held” (suspended) while a necessary operation is being
performed. For example, the pipes are being cleaned and then
started from a known value.
When Preset is checked, you simply specify a preset value.
If you are counting upwards, the value will obviously be positive.
If you are counting downwards, the preset value will be negative.
A negative value would be relevant in a situation where a
reservoir is being drained, for example. Then the Totalizer
function, if enabled for a circular chart, would help monitor the
flow rate.
Preset
When counting upwards, when the total exceeds the preset
value, it is reset.
When counting downwards, the preset value is reset at a point
when it becomes negative.
Auto reset level
Sets the level at which the system will automatically reset,
returning to its initial value and disabling everything else.
Once you have made all your selections, click Next to continue the Report Configuration Wizard.
This opens the Target dialog box.
6.21
TrendWorX Reporting
Target
The next step in the Report Configuration Wizard is the Target dialog box, shown below. The target
name that you entered will be used as the basis of the generated target report database table, .csv
file, .txt file, or Excel worksheet.
Target Dialog Box
The Target dialog box has several options for logging a report, including:
•
Logging to a database
•
Logging to a .txt or .csv file
•
Logging to an Excel file
In addition, you can select to:
•
Overwrite the report.
•
Create a new report with a date.
If you overwrite the report, the target report table or file will be named using the selected target
name, and any previous data will be overwritten. If you create a new report, a new table or file will be
generated every time the report is run, and its name will consist of the report name and a string
representation of the time and date when the report was created.
TrendWorX Reporting can also generate a report table within the same database in which the
historical data reside. The selection process is identical to the one described earlier.
Note: TrendWorX Reporting currently supports only Microsoft Access, Microsoft SQL Server, and
Oracle databases as targets configured as machine data sources, not file data sources. Refer to the
Tagssection as needed.
Note: When you are creating reports to Excel or to a .txt or .csv file, remember that Excel 2000 can
handle a maximum of about 65,000 rows. Make sure that your report will not exceed this amount so
that the report will be completed without errors.
6.22
Features in TrendWorX Reporting
Note: When you are creating reports to Excel, the target report file name will always be appended
by the time and date extension at the time the report was executed.
TrendWorX Reporting will create a table in the target database. The table name will be produced
from the target name. If Create Report with Date is selected, the time and date of the report
creation will be appended to the name. If Overwrite Report is selected, the table name will be the
same as the report name, and all the existing data will be overwritten.
Now that you have selected the Target Type and location, click Next to continue the Report
Configuration Wizard. This opens the Schedule dialog box.
Logging to a Database
If you choose to create a report that will write to a database, you must configure a database that will
contain all the resulting data from the report. Click the DSN button in the Target dialog box to open
the Select Data Source dialog box. You can select an existing database, or you create a new
database by selecting New and following the Report Configuration Wizard. When you make your
selection, TrendWorX Reporting will fill in the type of the source database, user ID, and name.
Note: If TrendWorX Reporting is running on a PC other than the one on which the TrendWorX SQL
Data Logger is running, you will have to configure an ODBC data source by connecting to the
databases on which the TrendWorX SQL Data Logger is logging data.
Logging to a Text File
To configure the report to log to a .txt or .csv file, select Text File on the Target dialog box, as
shown in the figure below. Then click Report Path to select the directory in which the file will be
created. After you have selected the location for the file, select the Number Format for the data
from the report. If Add Header is checked, TrendWorX Reporting will add a report header to the file.
Logging to a Text File in the Target Dialog Box
Logging to an Excel File
To configure the report to log to an Excel file, select Excel File from the Target dialog box, as
shown in the figure below.
6.23
TrendWorX Reporting
Logging to an Excel File in the Target Dialog Box
TrendWorX Reporting has the following integration with Microsoft Excel:
•
Microsoft Excel template support.
•
HTML output support.
•
Report header support.
•
E-mail support.
•
Enhanced directory management.
•
Enhanced performance integration with Microsoft Excel, which greatly reduces the time
required to populate an Excel spreadsheet with the report data. This functionality may require
the utilization of more memory resources.
•
Date format support, which includes the month name for international support.
•
TrendWorX Reporting now supports an internally created password for creating Microsoft
Excel reports. Based on this internal password, the resulting Microsoft Excel worksheet will
be locked and no data changes will be allowed.
When creating reports in Microsoft Excel, you need to create and customize (if desired) a source
Excel workbook, which should be saved as a template. TrendWorX treats each Excel workbook
selected from the Template button as an Excel template, and it creates an Excel-based report using
the user-configured format and layout in the source workbook. To configure an Excel report, you
need to do the following:
1. Create an Excel workbook to be the source of the report formatting and layout.
6.24
2.
3.
Click Template in the Target dialog box to select the workbook.
4.
Select Publish if HTML output of the Microsoft Excel-based report is desired.
Click Report Path in the Target dialog box to assign a path where the generated reports will
be created.
Features in TrendWorX Reporting
5.
If the Publish option is checked, click HTML Path to select a target directory for the HTML
output of the report.
6.
If you want to select a specific worksheet from the source workbook, you should enable the
WSheet option and then click Select to display a list of all workbooks available. Then select
the desired workbook.
7.
You can specify the starting cell of the Excel workbook in which the report will be stored by
supplying the desired values for the Row and Column fields.
In addition to the above, you have the following options:
•
Auto Print. If enabled, the generated report will be sent automatically to the current Windows
default printer.
•
Add Header. If enabled, TrendWorX Reporting will add an informative header to the
generated report.
•
Format. If enabled, TrendWorX Reporting will automatically format the generated report and
adjust the column width so that the values within the column cells will be readable. If you
want to provide a custom format and layout, this option should not be checked. As an
example, to hide a certain column in the generated report, calculate its location and make its
width zero within Microsoft Excel.
•
Protect. Enables password protection based on an internally created password for Microsoft
Excel reports. The resulting Microsoft Excel worksheet will be locked and no data changes
will be allowed.
•
Create Report with Date. This is the only option for Microsoft EXCEL reporting. If enabled,
the target worksheet will use the report name, and the time and date extension will be
appended to the name.
•
Overwrite Report. Not available for Excel reporting.
•
E-Mail. If enabled, you can fill a subject and a recipient e-mail address list, such as
"[email protected]; [email protected]" (with the list items separated
by a semicolon). TrendWorX Reporting, upon completing the report, will attach it to an e-mail
message and send the message to all listed recipients.
Schedule
The next step in the Report Configuration Wizard is the Schedule dialog box, shown below.
Schedule Dialog Box
Reports can be configured to execute:
• Immediately
• One time
• Periodically
• On event
6.25
TrendWorX Reporting
If the report is configured to run Immediately, it will execute as soon as possible within runtime, and
after completion its enabled flag will be reset. All immediate reports have their priority of execution
boosted internally by TrendWorX Reporting over periodic reports.
If the report is configured to run One Time, you must pick the desired time and date for the report to
run by clicking on Set in the Schedule dialog box to enable time and date selection. To select the
date, click the down arrow in the Date field, and then choose a date from the calendar. After
completion, the report’s enabled flag and time field will be reset.
Clicking Set opens the standard Microsoft Calendar control. Select a desired date by double-clicking
on the date.
If the report is configured to be Periodic, you must select the reports periodic schedule by clicking
Change. This opens the Edit Periodic Report dialog box shown below.
Edit Periodic Report Dialog Box
Periodic reports can run:
•
Hourly
•
Daily
•
Weekly (on a desired day of the week)
•
Monthly (on the first and/or last day of month)
You can select the desired time of the report for execution. In addition, you can select a report
execution offset interval, which will add a delay between consecutive report executions. You can
also run reports faster than one hour.
Note: Daily, weekly, and monthly reports will automatically create a report based on the last day’s,
week’s, or month’s data from the report execution time. Hourly reports will span data based on how
many hours they are configured to run, while event-based reports can be configured to retrieve data
spanning a selected report time span.
If the report is configured to run on an event, you must configure an event expression by clicking the
Expr, which opens the Edit Expression dialog box, shown below.
Note: For information about the Expression Editor, please see the Expression Editor help
documentation.
6.26
Features in TrendWorX Reporting
Expression Editor
Event-based reports provide finer control over timing of report execution. The event scan time is
currently 1 second.
Once you have configured the report schedule, click Next to continue the Report Configuration
Wizard. This opens the Range dialog box, which enables you to pick the time range of the report.
This is basically the time interval over which historical data will be retrieved and processed. It is
available for immediate and one time report types.
Range
The next step in the Report Configuration Wizard is the Range dialog box, shown below.
Range Dialog Box
If the report is configured to execute Immediately or One Time, you can configure the single
execution start and end times by clicking Set Start and Set End.
6.27
TrendWorX Reporting
If the report is configured to run On Event, you can configure the Report Time Span for which
historical data should be processed. In addition, if Start From Last Time Run is checked, the
starting time for data retrieval of the report will be the last time the report was executed.
You can also enable the Report Time Span for Periodic reports. This way you will be able to select
a time span different from the one determined by the periodic frequency of the report alone.
Clicking on Set Start or Set End in the Range dialog box opens the Set Time and Date dialog box,
shown below. Within this dialog, the you can click the down arrow in the Date field to open the
Calendar control for selecting a desired date, adjust the desired time in the time picker control or
select the time based on a given historical table or operator comment and batch entry.
Set Time and Date Dialog Box
Clicking Select From Comment/Batch in the Set Time and Date dialog box opens the Select
Comment/Batch (Lot) dialog box, shown below. This enables you to:
•
Select a start time and date. To select the date, click the down arrow in the Date field, and
then choose a date from the calendar.
•
Select an end time and date.
•
Click Search to initiate the search.
•
Scroll through multiple operator comments and batch entries once the search is completed;
use the << and >> buttons. Once you locate the desired one, click OK.
Set Comment/Batch (Lot) Dialog Box
6.28
Features in TrendWorX Reporting
Note: Selecting View Batch Only filters out the historical operator comments to display only the
related batch (lot) entries.
Clicking Select From Table in the Set Time and Date dialog box opens the Group Tables Info
dialog box, shown below. This displays the table entries for the last-accessed database connection
so that you can select a starting and ending time and date based on the available historical tables.
Group Tables Info
Note: The Unicode version has enhanced language-aliasing support, including automatic value
scaling. You need to configure the Language Server as well as configure language aliases in the
TrendWorX Configurator. Once all language aliases are configured, TrendWorX Reporting will
automatically scale all historical values to those corresponding to the startup language. While
TrendWorX Reporting is in runtime mode, all subsequent events generated by you selecting a
different language will result only in updating the user interface to match the currently selected
language, but not the scaling equations used in the report generation.
Finally, clicking Finish will complete the new report configuration and addition. If any errors are
found, the new report’s enabled flag will be reset and will be marked with an “X”.
Editing a Report
In configuration mode, you can also edit, delete, and copy a report using the Edit menu commands
or the toolbar. Alternatively, you can select a report and right-click to display the configuration mode
report inspector menu, as shown below.
The editing tabs in the TWXReport dialog box, shown below, are identical to the series of dialog
boxes in the Report Configuration Wizard.
6.29
TrendWorX Reporting
Editing a Report
To copy a report, select an existing report and click Duplicate on the Edit menu or the main toolbar.
This will copy all the configuration data of the original report, modify the original report name, and
reset the enabled flag, as shown below.
Copying a Report
Runtime Mode
To enter runtime mode, select Start Reports from the Actions menu. TrendWorX Reporting will
enable scanning of all reports and process them accordingly. In addition, both the right-hand and
left-hand panes will be updated to reflect the latest status of reports. In runtime mode, you can:
•
6.30
Add new reports.
Features in TrendWorX Reporting
•
Edit existing reports.
•
Duplicate reports.
•
Delete reports.
•
Cancel reports.
•
Get report status information.
You can fully edit or delete reports in runtime mode, as long as they are not running. If the reports
are currently running, or are in "stand by" mode, they need to be cancelled first and then edited (or
deleted). In addition, you can get runtime status information by clicking Report Status on the
Actions menu. This opens the Report Status dialog box, shown below.
Report Status Dialog Box
TrendWorX Reporting is a multithreaded OLE Automation server, which allows for concurrent report
processing. Within runtime, it allocates a pool of threads for simultaneous report scanning and
processing. The number of threads can be adjusted via a registry setting. The default thread pool
number is one worker thread. Note that if the target of all reports is an Excel worksheet, the reports
will be serialized such that only one report accesses Excel at a time. In this case, you should not
increase the thread number used by TrendWorX Reporting in the registry. In addition, TrendWorX
Reporting implements its own scheduling mechanism, which boosts the priority of reports when they
are configured to run immediately.
Since TrendWorX Reporting may use the source database for creating temporary tables and actual
report generated tables, it is very important that you allow for the source database to have enough
disk space for TrendWorX Reporting to perform its table creation.
TrendWorX Reporting Security
TrendWorX Reporting is interfaced to the ProcessView Security Server and currently supports the
following security actions within runtime mode, as shown in the figure below.
6.31
TrendWorX Reporting
Security Server
GenEvent Registrar Integration
TrendWorX Reporting is interfaced to the GenEvent Registrar Server. If it is enabled within the
GenEvent Registrar configuration tools, it will post events to the GenEvent Registrar and
subsequently to the NT Event Logger. The following events will be posted:
•
Started Reports (Severity 500 - Normal Event)
•
Stopped Reports (Severity 500 - Normal Event)
•
Error in Starting Reports (Severity 800 - Abnormal Event)
•
Report Deleted (Severity 650 - Warning Event)
•
Report Cancelled (Severity 650 - Warning Event)
•
Report Executed (Severity 500 - Normal Event) if no errors occurred
•
Report Executed (Severity 650 - Warning Event) if errors occurred
OLE Automation
The TrendWorX Reporting Application registers with the OLE ROT (Running Object Table) as a
single-instance OLE Automation server. If it has started, all clients can connect to it by using a
"GetObject" call (i.e. connecting to the running instance of reporting). The TrendWorX Reporting
OLE Automation server currently supports the following OLE Automation properties and methods.
OLE Automation Properties
boolean Visible
boolean Maximized
6.32
Shows/hides application window.
Maximizes/minimizes application window.
Features in TrendWorX Reporting
OLE Automation Methods
void Refresh()
void Open(BSTR FileName)
void StartReports()
void StopReports()
booleanAreReports
Running()
voidClose(boolean
SaveChanges, BSTR file)
Redraws the view.
Opens a configuration file.
Starts runtime mode.
Exits runtime mode.
Returns true if in runtime mode.
Exits the report.
A set of OLE automation methods has been added to allow for flexible report manipulation. For
these OLE automation methods to be used effectively, you should call first the GetReportNames
method to get a listing of all the currently available reports and then use automation to set the
desired time span, etc. Depending on the status of each report or the periodic schedule, a VBAenabled application can filter which reports will be available to the operator for manipulation. Note
that the best way to make use of operator-based triggering of report execution within a VBA-enabled
application, such as GraphWorX, is to configure immediate report types, and do not enable the
desired reports. Then, the operator through the newly added OLE Automation support will be able to
start or stop existing reports.
These methods are:
VARIANT GetReportNames()
Returns a Safearray with all the report names.
Returns an enumerated type TWXREPORTSTATUS with
the report status for each report by name, which can be of
the following enumerated values:
short GetReportStatus(BSTR
ReportName)
short
GetReportScheduleType(BST
R ReportName)
boolean
SetReportTimeSpan(BSTR
ReportName, DATE
StartDateTime, DATE
EndDateTime)
boolean
SetReportTarget(BSTR
ReportName, BSTR
ReportTarget)
short RunReport(BSTR
ReportName)
short StopReport(BSTR
ReportName)
short AddNewReport(BSTR
ReportName, BSTR
RptStatusOk
RptStatusEditing = 1
RptStatusDeleting
RptStatusExecuting
RptStatusExiting = 4
RptStatusPaused = 5
RptStatusCancelled
RptStatusStandby
RptStatusNotFound
RptStatusConfigErrors
RptStatusConfigure
=0
=2
=3
=6
=7
=8
=9
= 10
Returns an enumerated type TWXREPORTSCHEDULE
with the desired report schedule type:
RptNotFound = 0
RptImmediate = 1
RptOnce
=2
RptPeriodic
=3
RptEvents
=4
Sets the report time range for immediate type of reports which
currently are not executing.
Sets the report target name for the desired report. The
report has to be disabled first using the DisableReport
method if necessary.
Executes the desired report returning a
TWXREPORTSTATUS status enumeration with the status
of the report. Works only in runtime mode.
Stops execution of the desired report. Works only in
runtime mode. It returns a TWXREPORTSTATUS status
enumeration with the status of the report.
Adds a new report with basic configuration settings. The
report is initially disabled. It returns a TWXREPORTEDIT
6.33
TrendWorX Reporting
ReportTargetName, long
ReportDataFilter, long
ReportFilterOrder, boolean
Qualities, boolean CopyOver,
long ProcessDataSecs, long
ProcessDataMSecs)
short
SetReportCSVTarget(BSTR
ReportName, BSTR
ReportCSVPath, BSTR
ReportCSVNumberFormat,
boolean AddHeader, boolean
CreateNewWithDate)
short
SetReportEXCELTarget(BSTR
ReportName, BSTR
ReportXLSTemplate, BSTR
ReportXLSPath, boolean
PublishHTML, BSTR
ReportHTMLPath, boolean
UseXLSWKSheet, BSTR
ReportWKSheetName, long
ReportXLSRow, long
ReportXLSColumn, boolean
ReportAutoprint, boolean
AddHeader, boolean
ReportAutoFormat, boolean
ReportXLSProtect, boolean
ReportXLSEmail, BSTR
ReportXLSEmailAddress,
BSTR
ReportXLSEmailSubject)
short
SetReportDBTarget(BSTR
ReportName, BSTR
DBConnString, long DBType,
boolean CreateNewWithDate)
short
SetReportImmediate(BSTR
ReportName, DATE
StartTime, DATE EndTime)
short SetReportOnce(BSTR
ReportName, DATE
DateToRun, DATE StartTime,
DATE EndTime)
short SetReportEvent(BSTR
ReportName, BSTR
EventCondition, long
ReportRangeSecs, boolean
StartFromLastTime)
short SetReportHourly(BSTR
ReportName, DATE
TimeToRun, long Hours, long
Minutes, long OffSetMinutes,
boolean UseReportTimeSpan,
long ReportTimeSpanSecs)
short SetReportDaily(BSTR
ReportName, DATE
TimeToRun, long
OffSetMinutes, boolean
UseReportTimeSpan, long
6.34
edit status code. The ReportDataFilter is of type
GFWREPORT_DATA_FILTERS. The ReportFilterOrder
parameter is used only in Moving filters, and the
ProcessDataSecs, ProcessDataMSecs define the report
processing interval for non-Raw reports
Sets the target of an existing report to be a .csv file. The
report needs to be disabled first, and the ReportCSVPath
refers only to the file path. It returns a TWXREPORTEDIT
edit status code.
Sets the target of an existing report to be an Microsoft
Excel workbook. The report needs to be disabled first, and
the ReportXLSPath refers only to the file path. It returns a
TWXREPORTEDIT edit status code.
Sets the target of an existing report to be a database table.
The report needs to be disabled first, and the
DBConnString refers to an ADO ODBC connection string.
It returns a TWXREPORTEDIT edit status code. The
DBTYpe is of TWXREPORTSDBTYPE enumeration.
Sets the schedule of an existing report to be of Immediate
type. The report needs to be disabled. It returns a
TWXREPORTEDIT edit status code.
Sets the schedule of an existing report to be of Single
execution type (Once). The report needs to be disabled. It
returns a TWXREPORTEDIT edit status code.
Sets the schedule of an existing report to be of Event
execution type. The report needs to be disabled. It returns
a TWXREPORTEDIT edit status code. The
EventCondition represents an OPC tag-based expression.
Sets the schedule of an existing report to be of periodic
(Hourly) execution type. The report needs to be disabled.
It returns a TWXREPORTEDIT edit status code. The
UseReportTimeSpan enables the time range of the report
not to be defined by the periodic interval but to be set by
the user. The TimeToRun is the desired time of the first
report execution.
Sets the schedule of an existing report to be of periodic
(Daily) execution type. The report needs to be disabled. It
returns a TWXREPORTEDIT edit status code. The
UseReportTimeSpan enables the time range of the report
not to be defined by the periodic interval but to be set by
Features in TrendWorX Reporting
ReportTimeSpanSecs)
short SetReportWeekly(BSTR
ReportName, DATE
TimeToRun, long
DayOfTheWeek, long
OffSetMinutes, boolean
UseReportTimeSpan, long
ReportTimeSpanSecs)
short
SetReportMonthly(BSTR
ReportName, DATE
TimeToRun, boolean
FirstDayOfWeek, long
OffSetMinutes, boolean
UseReportTimeSpan, long
ReportTimeSpanSecs)
short EnableReport(BSTR
ReportName)
short DisableReport(BSTR
ReportName)
short AddReportTag(BSTR
ReportName, BSTR
TagLoggingName, BSTR
TagDescrText, BSTR
TagEngUnits, BSTR
TagDBConnString, long
DBType , BSTR
TagDBaseGroupName, BSTR
TagLogGroupName, long
TagDBHandle)
short DeleteReport(BSTR
ReportName)
short
SetReportTotalizerParams(BS
TR ReportName, long
TotalizerUnits, long
TotalizerType, long
TotalizerDirection, double
TotalizerValue, double
TotalizerAutoResetLevel)
the user. The TimeToRun is the desired time of the first
report execution.
Sets the schedule of an existing report to be of periodic
(Weekly) execution type. The report needs to be disabled.
It returns a TWXREPORTEDIT edit status code. The
UseReportTimeSpan enables the time range of the report
not to be defined by the periodic interval but to be set by
the user. The TimeToRun is the desired time of the first
report execution. The DayOfTheWeek refers to the day of
the week for the report to execute (with Sunday = 1 and
Saturday = 7).
Enables a given report for execution.
Disables a given report for execution.
Adds a a new report tag to an existing report. The report
needs to be disabled. It returns a TWXREPORTEDIT edit
status code. The TagLoggingName is the one defined in
the TrendWorX Configurator, while the TagDBConnString
parameter refers to the ADO ODBC connection string for
the historical database. The TagDBHandle parameter is
the index of the specific tag in the _Tags table of the
historical database.
This method deletes a report. The report needs to be
disabled. It returns a TWXREPORTEDIT edit status code.
This method sets the Totalizer filter related parameters.
The TotalizerUnits can be any of:
Seconds = 0
Minutes = 1
Hours = 2
Days = 3
The TotalizerType can be of type:
Continuous
=0
PreLoad
=1
Preset
=2
The TotalizerDirection can be 0, for counting upwards, or 1
for counting downwards
The Totalizer value is simply the Preload or Preset value
depending on the Totalizer type.
For these OLE automation methods to be used effectively, you should call first the
GetReportNames method to get a listing of all the currently available reports and then use
automation to set the desired time span, etc. Depending on the status of each report or the periodic
schedule, a VBA-enabled application can filter which reports will be available to the operator for
manipulation. Note that the best way to make use of operator-based triggering of report execution
within a VBA-enabled application, such as GraphWorX, is to configure immediate report types, and
6.35
TrendWorX Reporting
do not enable the desired reports. Then, the operator through the newly added OLE Automation
support will be able to start or stop existing reports.
Example
The sample code below adds a simple MS EXCEL Report:
Private Sub cmdReports_Click()
Dim reports As TWXReport.Document
Set reports = GetObject(, "TWXReport.Document")
'Add a report
reports.AddNewReport TextBox1.Text, TextBox1.Text, TWXReport.Raw, 8, False, False, 60, 0
reports.SetReportImmediate TextBox1.Text, Now, Now - 1
reports.SetReportEXCELTarget
TextBox1.Text,
"D:\Logging
Tests\TWX
EXCEL
Templates\Production -- Daily Yield.xlt", "D:\Logging Tests\Test Reports", False, "", False, "", 3, 3,
False, True, True, False, False, "", ""
'Add a tag
reports.AddReportTag TextBox1.Text, "SimulatePLC.Random", "SimulatePLC.Random", "",
"Provider=MSDASQL.1;Extended
Properties=""DSN=TWXREPORT_MSJET;DBQ=D:\Logging
Tests\Logging
Data\TWXREPORT_MSJET.mdb;DriverId=25;FIL=MS
Access;MaxBufferSize=2048;PageTimeout=5;UID=admin;""", 1, "MSJET", "JetGroup", 3
'Execute Report
reports.StartReports
reports.EnableReport TextBox1.Text
reports.RunReport TextBox1.Text
ProjectWorX Support
Several OLE Automation methods have been added to facilitate ProjectWorX deployment and
WebHMI enhanced support:
1. ReplaceStringInString(
StringToReplace as String,
OldSubstring as String,
NewSubstring as String
) as String
2. ReplaceHost(
OldHostName as String,
NewHostName as String
) as Long
3. ReplaceFilePath(
OldSubstring as String,
NewSubstring as String
) as Long
4. ReplaceTag(
OldSubstring as String,
NewSubstring as String
) as Long
5. ReplaceHostEx(
OldHostNameSubstring as String,
NewHostNameSubstring as String
MatchCase as Boolean,
6.36
Features in TrendWorX Reporting
MatchWholeWord as Boolean
) as Long
The ReplaceHostEx with parameters MatchCase=False & MatchWholeWord=True works
exactly the same as the ReplaceHost() function.
The following is a simple example of using the OLE automation methods of TrendWorX Reporting
added for Version 7.x. It assumes that the TrendWorX Reporting application is already running. If
not, a Shell command can be used to start it.
Private Sub cmdReports_Click()
Dim reports As TWXReport.Document
Set reports = GetObject(, "TWXReport.Document")
'Add a report
reports.AddNewReport “MyReport”, “MyReport”, TWXReport.Raw, 8, False, False, 60, 0
reports.SetReportImmediate “MyReport”, Now, Now - 1
'reports.SetReportEXCELTarget “MyReport”, "D:\Logging Tests\TWX EXCEL Templates\Production
-- Daily Yield.xlt", "D:\Logging Tests\Test Reports", False, "", False, "", 3, 3, False, True, True,
False, False, "", ""
reports.SetReportCSVTarget “MyReport”, "D:\Logging Tests", "x.xxxxx", False, False
'Add tags
reports.AddReportTag
“MyReport”,
"SimulatePLC.Random",
"SimulatePLC.Random",
"",
"Provider=MSDASQL.1;Extended
Properties=""DSN=TWXREPORT_MSJET;DBQ=D:\Logging
Tests\Logging
Data\TWXREPORT_MSJET.mdb;DriverId=25;FIL=MS
Access;MaxBufferSize=2048;PageTimeout=5;UID=admin;""", 1, "MSJET", "JetGroup", 3
' Get Report Names
Dim ReportNames As Variant
ListBox1.Clear
ReportNames = reports.GetReportNames
For i = LBound(ReportNames) To UBound(ReportNames)
ListBox1.AddItem ReportNames(i)
Next i
'Execute Report
reports.StartReports
reports.EnableReport “MyReport”
reports.RunReport “MyReport”
'Delete Report
'reports.DeleteReport MyReport
End Sub
TrendWorX OLE DB Provider
OLE DB is the dominant data access methodology from Microsoft that allows high-performance data
access from any data source. Any tabular data is viewable through OLE DB regardless of whether it
came from a database. This flexibility gives developers a tremendous amount of power.
In version 7.x, the TrendWorX OLE DB Provider included the following new features:
•
New database connection dialog
•
Enhanced data retrieval support
6.37
TrendWorX Reporting
OLE DB Architecture
The design of OLE DB includes the concept of consumer and provider. The figure above shows a
graphical representation of the OLE DB system. The consumer represents the traditional client. The
provider places data into a tabular format and returns it to the client. A provider is a set of COM
components that contains a series of interfaces. Because these are standard interfaces, any OLE
DB consumer can access data from any provider. Since providers are COM objects, consumers can
access them in any language (C++, Basic, Java, and so on).
ADO is a lightweight object set for accessing data from any OLE DB provider, using a consistent API
within any programming language and or environment.
The TrendWorX SQL Server application, which is Smar' next-generation enterprise data-logging and
historical data server, uses relational databases as storage media to log process historical data. The
historical data can be accessed through a variety of methods, such as:
•
Using the OPC Historical Data Access interface which is supported in TrendWorX SQL
Server
•
Using the TrendWorX SQL Tool ActiveX Control to retrieve process data in a VBA-scripting
environment
•
Using the TrendWorX Reporting, which creates a variety of historical data reports in
databases, .csv and .txt files, and Excel
•
Using ADO within any programming environment to parse TrendWorX SQL Server historical
tables
The TrendWorX OLE DB Provider, which encapsulates all the work needed to retrieve historical data
spanning multiple historical data tables, interpolate and or extrapolate for missing values, and
perform custom averaging of data over desired time periods.
OLE DB providers are a set of COM objects that transfer data from a durable source to a consumer.
The OLE DB provider places those data in a tabular format in response to calls from a consumer.
Providers can be simple or complex. A provider may return a table, allows the client to determine the
format of that table, or perform operations on those data. Each provider implements a standard set
of COM objects to handle requests from the client. A provider may implement optional COM objects
to provide additional functionality. The figure below shows the different COM objects a provider may
implement.
COM Components in an OLE DB Provider
6.38
Features in TrendWorX Reporting
COM Components and Their Uses
Component
Interfaces
Comments
[mandatory] IDBCreateSession
[mandatory] IDBInitialize
[mandatory] IDBProperties
Data Source
[mandatory] IPersist
[optional] IDBDataSourceAdmin
[optional] IDBInfo
Connection from the consumer to the provider. The object
is used to specify properties on the connection, such as
user ID, password, and data source name. The object
can also be used to administer a data source (create,
update, delete, tables, and so on).
[optional] IPersistFile
[optional] ISupportErrorInfo
[mandatory] IGetDataSource
[mandatory] IOpenRowset
[mandatory] ISessionProperties
[optional] IDBCreateCommand
[optional] IDBSchemaRowset
Session
[optional] IIndexDefinition
[optional] ISupportErrorInfo
[optional] ITableDefinition
[optional] ITransaction
The session object represents a single conversation
between a consumer and provider. It is somewhat similar
to the ODBC HSTMT in that many sessions can be active
simultaneously.
The session object is the primary link to get to OLE DB
functionality. In order to get to a command, transaction, or
rowset object, you go through the session object.
[optional] ITransactionJoin
[optional] ITransactionLocal
[optional] ITransactionObject
[mandatory] IAccessor
[mandatory] IColumnsInfo
[mandatory] ICommand
[mandatory] ICommandProperties
[mandatory] ICommandText
Command
[mandatory] IConvertType
[optional] IColumnsRowset
[optional] ICommandPrepare
[optional]
ICommandWithParameters
The command object handles operations on data such as
queries. It can handle statements with or without
parameters.
The command object is also responsible for handling
bindings for parameters and output columns. A binding is
a structure that contains information about how a column,
in a rowset, should be retrieved. It contains information
such as ordinal, data type, length, status, and so on.
[optional] ISupportErrorInfo
[mandatory] IAccessor
[mandatory] IColumnsInfo
[mandatory] IConvertType
[mandatory] IRowset
[mandatory] IRowsetInfo
[mandatory] IRowsetIdentity
Rowset
[optional] IColumnsRowset
[optional]
IConnectionPointContainer
The rowset object represents the data from the data
source. The object is responsible for the bindings of that
data and any basic operations (update, fetch, movement,
and so on) on the data. You will always have a rowset
object to contain and manipulate data.
[optional] IRowsetChange
[optional] IRowsetLocate
[optional] IRowsetResynch
[optional] IRowsetScroll
6.39
TrendWorX Reporting
[optional] IRowsetUpdate
[optional] ISupportErrorInfo
[mandatory]
IConnectionPointContainer;
Transaction
[mandatory] ITransaction
[optional] ISupportErrorInfo
The transaction object defines an atomic unit of work on a
data source and determines how those units of work
relate to each other. This object is not directly supported
by the OLE DB provider templates. That is, you create
your own object.
Each COM component represents a series of COM interfaces. Some COM interfaces are
mandatory, while others are optional. By implementing the mandatory interfaces, a provider
guarantees a minimum level of functionality that any client should be able to use. By implementing
the optional interfaces, a provider can have more functionality and a richer feel to the client. The
client should always call "QueryInterface" to determine whether a provider supports a given
interface.
The TrendWorX OLE DB Provider is a simple read-only provider, which implements all of the
mandatory interfaces listed in the table above, with the exception of the transaction-based
component. TrendWorX OLE DB Provider supports, among others, the following:
•
Similar historical replay functionality to the OPC Historical Data Access specification
•
Raw or time-processed data-retrieval over a user-defined time interval
•
Multiple historical tag data retrieval
•
Dedicated "trend SQL" query parsing and execution capability
•
Historical database browsing/prompting capability
•
Schema information support for the "Recordset" structure it returns
•
Support for a "MaxRecords" property to limit the total number of returned samples
•
Multiple historical data filter support
The TrendWorX OLE DB Provider internally uses a high-speed data-retrieval mechanism based on
the native OLE DB providers for the historical databases configured in the TrendWorX SQL datalogging server.
Using the TrendWorX OLE DB Provider
In this section, we will discuss how the TrendWorX OLE DB Provider can be used to retrieve data
from the TrendWorX SQL Server historical database capability.
Connecting to TrendWorX OLE DB Provider
To connect to the TrendWorX OLE DB Provider, you must set the corresponding properties or ask
the provider to prompt and provide database navigation and browsing tools.
In order to have the provider prompt, a typical VBA type of code would be:
Dim twx As New ADODB.Connection
' Set Provider
twx.Provider = " Smar.TWXOLEDB "
' Set up for Prompting
twx.Properties("Prompt") = 1
'Open Connection
twx.Open
Use the TWXSQL Tool Control Properties dialog box, shown below, to connect to a database.
This dialog box has only one tab, the General tab shown below, which prompts you to complete the
configuration.
6.40
Features in TrendWorX Reporting
TWXSQL Tool Control Properties Dialog Box
To configure the SQL Tool control, from the Provider Type list box in the TWXSQL Tool Control
Properties dialog box, select the OLE Database (DB) Provider type relating to the TrendWorX
historical database. Currently, the following OLE DB Providers are supported:
•
Microsoft Access
•
Microsoft SQL Server
•
Oracle
When you select a database type and then click Connect, the corresponding OLE DB Provider
configuration dialog box opens, as shown below.
For Microsoft SQL Server, select a server name, an authentication type (Windows NT Integrated
Security or user name and password), and the desired historical database, as shown in the figure
below.
6.41
TrendWorX Reporting
OLE DB Provider Configuration for SQL Server Databases
For Microsoft Access connections, simply navigate to the desired .mdb file by clicking on the
browser button, as shown in the figure below.
OLE DB Provider Configuration for Microsoft Access Databases
To connect to an Oracle database, fill in the appropriate information, as shown in the figure below.
6.42
Features in TrendWorX Reporting
OLE DB Provider Configuration for Oracle Databases
To increase speed and efficiency, the TrendWorX OLE DB Provider establishes a connection on a
per-data-logging group basis and retrieves data for the historical tags in that group. You can always
close an existing connection, set different properties and reopen the connection to retrieve data for a
different group of historical tags.
Alternatively, you can set the required properties for opening a connection of the TrendWorX OLE
DB Provider individually. These properties are:
Data source. For a Microsoft Access historical database, the data source is the complete path
(including the file name) of the Microsoft Access .mdb file. For a Microsoft SQL Server historical
database, the data source is the server name used for local SQL server installation. If the Microsoft
SQL Server is installed locally, the server name will be "(local)."
Password. The required password. If the underlying historical database is a Microsoft SQL Server
database, and no password is defined, the Smar TrendWorX OLE DB Provider will attempt to use
NT integrated security.
User ID. The user ID name (if required).
Location. If the underlying historical database is a Microsoft SQL Server database, this property will
be used for storing the initial catalog (i.e. the default SQL server database) for the connection to the
historical database.
Extended properties. This is a dedicated Smar TrendWorX OLE DB Provider string that is
formulated as follows:
TWXPROVIDER=provider;TWXDBASE=database group;TWXGROUP=group;
"Provider" is the internal OLE DB Provider name (i.e. SQL OLE DB for Microsoft SQL Server, or
6.43
TrendWorX Reporting
Microsoft.Jet.OLEDB.4.0 for Microsoft Access historical database)
"Database group" is the historical database group.
"Group" is the desired group of historical tags under the database group for which the provider will
retrieve data.
Using the properties listed above, you can also connect to the Smar TrendWorX OLE DB Provider
through ADO in the following ways:
Dim twx As New ADODB.Connection
' Set Provider
twx.Provider = " Smar.TWXOLEDB "
' Set up Properties
twx.Properties("Prompt") = 0
twx.Properties("Data Source") = “(local)”
twx.Properties("Password")=””
twx.Properties("User ID")=””
twx.Properties("Extended Properties")=
”TWXPROVIDER=sqloledb;TWXDBASE=MyFirstDBase;TWXGROUP=LoopX;”
twx.Properties("Location")=”TWXSQL_TEST_1”
'Open Connection
twx.Open
This code assumes the following:
•
The historical database is a Microsoft SQL Server database.
•
A trusted connection is used.
•
The SQL Server database where the historical data are logged is called "TWXSQL_TEST_1."
•
The Microsoft SQL Server is located on the local workstation.
In addition to the above properties, the Smar TrendWorX OLE DB Provider supports language
aliasing by making its resources available in a resource .dll. When translating the resources, do not
translate the strings related to the default properties of the provider.
Retrieving Historical Data
TrendWorX Reporting has been updated to be compliant with the latest OPC HDA specification 1.2.
Although TrendWorX Reporting is not a direct OPC HDA client or server, it creates reports with data
outputs as specified by the OPC HDA specification.
Version 7.x introduced an enhanced data-retrieval system, which utilizes an updated approach to
creating historical reports:
6.44
•
Data filter selection other than Raw will result in data time stamped at the beginning of each
subinterval.
•
When retrieving data using data filters other than Raw, subintervals for which there are no
data because of no data-logging activity will be marked as “empty” slots at the corresponding
time with a zero value. You can check the returned qualities for further processing.
•
The historical qualities supported are as follows:
o
OPCHDA_EXTRADATA
More data may exist
o
OPCHDA_INTERPOLATED
0x0001
0x0002
Features in TrendWorX Reporting
Interpolated data value
o
OPCHDA_RAW
Raw data value
o
OPCHDA_CALCULATED0x0008
Calculated data value
o
OPCHDA_NOBOUND
No data found to provide upper or lower bound
o
OPCHDA_NODATA
No data collected. Archiving not active
o
OPCHDA_DATALOST
Calculation started/stopped/lost
0x0004
0x0010
0x0020
0x0040
o
OPCHDA_CONVERSION
Scaling / conversion error
0x0080
o
OPCHDA_PARTIAL
Aggregate value is for an incomplete interval
0x0100
Critical Note: Because of the new compliance changes in historical replay and reporting, a version
7.x and subsequent versions historical replay or reporting may not produce identical results to
existing 6.1x version reports and or historical replay screen captures for the same signals and time
periods.
The TrendWorX OLE DB Provider supports a minimal set of “trend SQL” keywords that can be used
to formulate “trend” queries in order to retrieve historical data. A typical “trend” SQL statement may
look like the following:
Select=Device1.Group.Tag1,Device1.Group.Tag10;Filter=MaxTime;
SubInterval=10000; Start=1999/6/16, 18:00:00; End=1999/6/16, 18:10:00;
Select=tag1,tag2,…,tagn
This specifies the desired historical tags to participate in the query. If the `*' is used instead (e.g.
Select=*,), without other keywords, the Smar TrendWorX OLE DB Provider will return information
relating to the properties of the historical tags, such as device point name, logging name, and units.
Note that in this query the logging names of the historical points should be used.
Filter=filter type;
This specifies the desired historical data-processing filter to be used when retrieving data historical
data. The supported filter types are:
•
Raw (all values are retrieved)
•
Average
•
Min
•
Max
•
StDev
•
MinTime (minimum values with actual time stamp)
•
MaxTime (minimum values with actual time stamp)
•
Last (decimated value)
•
All Statistics (maximum, minimum, standard deviation, and average over entire time span)
•
Total (summary of values)
6.45
TrendWorX Reporting
•
Running Min
•
Running Max
•
Running Average (exponentially weighted moving average)
•
Moving Average
•
Moving Min
•
Moving Max
If no "Filter" value is specified, the TrendWorX OLE DB Provider will retrieve all raw data-logged
values.
SubInterval=interval;
This specifies the interval (in msec) between processed samples. The TrendWorX OLE DB Provider
will process all samples, which have time stamps within a time interval to compute the
corresponding sample with the desired filter. It is ignored if the data-retrieval filter is set to "Raw" or
"AllStat." If it is set to 0, all historical samples within the search time interval will be included in
creating a “processed” sample, which will be returned to the user.
Note that when the data filter is set to "Raw," the Smar TrendWorX OLE DB Provider will return all
historical samples, which fall within the search time interval using the original time stamp that was
data-logged. On the other hand, if it is not set to "Raw," the Smar TrendWorX OLE DB Provider will
divide the search time interval into subintervals of "SubInterval" duration and “process” all samples
that fall within each subinterval to calculate a “processed” sample to return.
Start=yyyy/mm/dd, hh:mm:ss;
This specifies the starting time for retrieving historical data, and it has to match the indicated format.
If it is not specified, the time search will include all historical values starting at the beginning of the
historical data
End=yyyy/mm/dd, hh:mm:ss;
This specifies the ending time for retrieving historical data, and it has to match the indicated format.
If it is not specified, the time search will include all historical values up to the most recent ones
Important Notes
If any or both of the start and end dates are not specified, the TrendWorX OLE DB Provider will
perform an exhaustive database search to retrieve all samples in the database, or those samples
starting from the start date or ending prior to the end date. Because this can be an extremely timeconsuming operation, it is suggested that you use the "MaxRows" property of the provider to
establish a limit to the total number of retrieved samples.
Note: The Unicode version has enhanced language aliasing support, including automatic value
scaling. You need to configure the Smar Language Server, as well as configure language aliases in
the TrendWorX Configurator. Once all language aliases are configured, you can use the LCID
property of the TrendWorX OLE DB Provider connection to set the desired language settings.
Returned Recordset Structure
The TrendWorX OLE DB Provider returns the following recordset structure (column names):
TagLoggingName
A variable length text column displaying the logging name of the tag.
TagPointName
A variable length text column displaying the actual point name of the
tag.
TimeDate
A "date" type showing the time stamp.
Msecs
A "long" type indicating the msec accuracy of the time stamp.
Value
A "double" type indicating the value of the sample.
OPCDataQuality
A "long" type indicating the OPC data access quality of the sample.
OPCHDAQuality
A "long" type indicating the OPC data access quality of the sample.
QualityText
6.46
A variable-length "text" type indicating the quality string related to
Features in TrendWorX Reporting
the combined data and historical quality values.
DataFilter
A variable-length "text" type indicating the data filter type, such as
"Raw," used in retrieving the data.
EngUnits
A variable-length "text" type indicating the "EngUnits" of the tag.
Important Note
In the case that only the tags under the desired logging group are returned (that is, when Select=*)
the "DataFilter" column will contain the data-logging filter for the tag. See the TrendWorX SQL
Server documentation for more information.
A code sample for opening a recordset to return all tags data-logged in a particular group and to
display their logging name might be as follows:
Dim rstwx As New ADODB.Recordset
Dim strLoggingName As String
' Set Recordset properties
rstwx.CursorType = adOpenForwardOnly
rstwx.LockType = adLockReadOnly
' Set cache size
rstwx.CacheSize = 100
' Open Recordset
rstwx.Open "Select=*;", twx, , , adCmdText
‘ Process Records
Do While Not rstwx.EOF
strLoggingName = rstwx!TagLoggingName
rstwx.MoveNext
Loop
' Close Recordset
If rstwx.State = adStateOpen Then
rstwx.Close
End If
End Sub
In this case, "twx" is the Smar TrendWorX OLE DB Provider ADO connection object we just opened.
Example Application Using TrendWorX OLE DB Provider
In order to provide a sample application using the TrendWorX OLE DB Provider, has created a
sample VBA application to demonstrate its use. It is located under the ProcessView "Examples"
directory in the "TrendWorX Examples\TrendWorX Data Logging and Reporting" folder, and it is
called "TrendOleDB.t32." This file consists of a main form, which is shown below. Click Connect to
connect to a TrendWorX SQL Server historical database. Click Signal Info to retrieve the datalogged signal for a particular group. You can also build a trend query and execute it to retrieve
historical data.
To prepare for the example, you must:
•
Set the ProcessView working directory to be "TrendWorX Examples\TrendWorX Data
Logging and Reporting," where the examples are installed. (For example you can use the Set
Working Directory command in the Tools menu of the TrendWorX Container.
•
Make sure that none of the files in this folder has a read-only attribute.
Once you have completed these steps, do the following:
1.
Start the TrendWorX Container.
2.
Load the TrendOleDB.t32 display into TrendWorX.
3.
Enter animation mode.
6.47
TrendWorX Reporting
4.
Click the various buttons to retrieve TrendWorX historical data using the TrendWorX OLE DB
Provider.
5.
When prompted, you can select Microsoft Access as the historical database type and enter
"Twx32Demo.mdb."
6.
You can now start data logging, stop data logging, and retrieve historical data.
Sample Visual Basic Application for the TrendWorX OLE DB Provider
6.48
Chapter 7
VIEWER ACTIVEX
Introduction
The TrendWorX Viewer ActiveX is an OPC client application that provides both real-time trending as
well as historical data trending within the ProcessView product family. It can also be used with thirdparty OPC server applications to provide excellent trending features.
Features of the TrendWorX Viewer include:
•
Real-time data displays.
•
Historical data displays.
•
Data utility functions.
•
Sophisticated, multithreaded data buffering to guarantee data integrity with support for
customer-configurable data-collection rates.
TrendWorX Viewer is interfaced to display memory-based historical data from the ProcessView
Persistent Trending memory-based data-logging OLE Automation server, as well as historical
servers supporting the OPC HDA (Historical Data Access) Interface, such as the TrendWorX SQL
Server.
TrendWorX Viewer ActiveX Features
TrendWorX Viewer ActiveX includes the following features:
•
Highly customizable component
•
Fast data replay
•
Independent data collection/screen refresh mechanism
•
Full exposure through OLE Automation objects, such as:
∗
Title
∗
X-grids
∗
Y-grids
∗
Ranges/x-axis ranges (for XY plots)
∗
Details
∗
Time settings
∗
Statistics
∗
Pens
•
Extensive runtime configuration
•
Built-in buffering system
•
Integration with the Smar Security Server
•
Support for custom imported data
•
Multilingual support
•
Interface to OPC Real-Time servers
•
Easy Visual Basic integration
•
Drag-and-drop support during runtime
•
Extensive real-time signal information (including signal quality)
•
Expression handling
•
Real-time statistical information with .csv file support
•
User-configured alarm levels for signals
7.1
TrendWorX Viewer ActiveX
•
User-defined global or relative signal ranges
•
Fixed location or scrolling grids
•
Embedded signal simulator
•
Support for multiple plot types, including:
∗
Time plots
∗
XY-plots
∗
Bar plots
∗
Logarithmic plots
∗
Strip charts
∗
Circular charts
•
Custom data displaying
•
Global aliasing with browsing support
•
Language aliasing with browsing support
•
Latest HDA compliance support
•
Global aliasing with browsing support
•
Language aliasing with browsing support
•
Latest HDA compliance support
•
Enhanced daylight savings time support for historical replay
•
Reordering on Trend pens
•
TraceWorX debug tracing support
•
Enhanced expression support
•
Progress indicator dialogs for potentially time consuming pen connections or historical
updates
Note: TrendWorX up to and including Version 6.1x uses the Windows-based APIs for converting a
time from local time to UTC or from UTC to local time. The Windows APIs do not correctly adjust the
conversion for the daylight savings time if the timestamp to be converted was obtained from a
different time period (i.e. it was obtained in "summer" time but now we have "winter" time).
TrendWorX Version 7.x or later has time conversion utilities that account for this discrepancy. There
are, however, some things to consider:
•
These functions are used by default (no user enabling is required).
•
This is what they do in order to convert each time stamp:
They check Windows for the PC Time Zone Settings and to see if automatic daylight savings is
enabled.
They also obtain from Windows the times/dates for switching over. (These dates do not change;
they are in the form of, e.g., the first Sunday of April.)
Depending on the previous information, the new functions properly adjust the conversion times to
compensate for daylight savings time.
New Features
The TrendWorX Viewer ActiveX has many new features, including:
7.2
•
Support for stacking of multiple trend plots
•
Support for background images
•
Customizable background printing option
•
Improves the x/y axes auto-size feature
Introduction
•
Tick mark interval support on x/y axes
•
Customizable time stamp spacing in trend display
•
Plot title support on y-axis
•
Font-sensitive auto-size support on chart title
•
Improved grid animation control for the new plot style
•
Improves the user-friendliness and readability of configuration panel and trend displays
•
Fully backward compatible with the previous plot style
•
Support for VCRWorX data replay
Using the TrendWorX Viewer ActiveX
The TrendWorX Viewer ActiveX component integrates easily into Visual C++ or Visual Basic
container applications. The ProcessView containers, such as GraphWorX, provide Toolbar support
for inserting the TrendWorX Viewer ActiveX. Once inserted into a document or a form, the
TrendWorX Viewer ActiveX can be resized and configured.
Within the ProcessView containers and in Visual Basic forms, the component is initially placed in
design mode. In design mode, you can configure the TrendWorX Viewer ActiveX using the
TWXView ActiveX Properties dialog box. Once the application is committed to runtime mode, the
Trend Viewer toolbar is activated. In addition, it becomes a drop target for text and therefore can
establish signal connections through drag-and-drop.
The TrendWorX Viewer ActiveX configuration data are saved directly in the container form or within
its own streamed file format with the file extension .v32. You must provide a valid file name before
the data are serialized and saved. TrendWorX Viewer uses the concept of a “working directory,”
defined in the ProcessView containers (such as GraphWorX). This represents the working directory
where project files and configuration files will be stored. TrendWorX Viewer will use this directory as
a starting point for saving and loading its configuration files.
Connections
The TrendWorX Viewer can display data from real-time signals connected to OPC servers,
calculated variables (using expressions), Smar simulated data and custom (user-fed) data through
OLE Automation, or historical data connected to OPC HDA servers (such as Smar TrendWorX SQL
Server).
Signal connections can be established in various ways:
•
In configuration mode, through the Pens tab of the TWXView ActiveX Properties dialog
box
•
In runtime mode, through the Edit Pens button on the Trend Viewer toolbar
•
Using OLE Automation methods (such as "AddRealTimePen" and "AddHistoryPen") and
VB Script/VBA
•
Using drag-and-drop (text format), in runtime mode only
Once a signal is connected to a TrendWorX Viewer pen, the TrendWorX Viewer adds the pen to its
buffering system manipulation and starts data collection and data display. To configure a pen to
display a calculated variable, click Tags Menu and select Expression Editor. This opens the Edit
Expression dialog box. In the Edit Expression dialog box, click Tags to open the Unified
Browser, which enables you to connect pens to real-time OPC server signals.
To connect a real-time pen to a signal using drag-and-drop, the TrendWorX Viewer must be
activated and in runtime mode. The drag-and-drop object should be of text type.
The TrendWorX Viewer ActiveX utilizes the Smar thin wrapper OLExpress to communicate to OPC
servers, therefore providing a very fast and efficient mechanism for real-time data acquisition and
display.
7.3
TrendWorX Viewer ActiveX
To display only historical data, select History Only in the Pens tab of the TWXView ActiveX
Properties dialog box. Connections to the historical signals can be made by selecting History Tag
from the Tags Menu to view all of the available OPC HDA servers. In addition to real-time and
historical data, the TrendWorXViewer also supports the custom pen type through OLE Automation.
This pen can be fed with user data using OLE Automation methods.
Runtime Mode Operations
The Trend Viewer toolbar, shown below, enables you to modify the trend display during runtime
mode.
Trend Viewer Toolbar
During runtime mode, the TrendWorX Viewer provides support for the following functions:
•
Adding, deleting, and editing a pen.
•
Freezing or unfreezing the Trend display (does not halt data collection).
•
Editing trend options, such as grids, ranges, cursor step, and language resources.
•
Editing the trend period or data-collection rates. Note that by changing data period,
TrendWorX Viewer may modify the data- collection rate in order not to exceed the
configured number of samples.
•
Displaying statistical information for all the pens regarding the displayed values. This
statistical information can be stored in a .csv file. You first need to provide a valid file
name for the function to work.
•
Zooming on a specific region of a trend when the trend is in Freeze Mode. You can zoom
by pressing the left mouse button while holding down the SHIFT key and selecting the
area you on which you would like to zoom. Clicking the left mouse button on the trend
display undoes the zoom. In addition, there is Point and Click support for zooming by
clicking the Zoom Trend button on the Trend Viewer toolbar.
•
Scanning the range of a trend by using the cursor to view specific sample values.
•
Selecting the focus pen, which is the pen whose details and (if desired) range information
will be displayed first in the TrendWorX Viewer.
•
Retrieving and replaying from the TrendWorX Persistent Trending server.
•
Paging forward and backward in time.
•
Time shifting for comparison of pens.
•
Docking the toolbar in the Trend Viewer (available only with the new plot style; “old plot
style” must be unchecked).
VCRWorX Data Replay
The TrendWorX Viewer ActiveX includes support for VCRWorX, which is a powerful tool in
ProcessView that enables the replay and reanimation of graphical, historical and alarm data.
VCRWorX replays trend pen data that have been logged to a trend logger database. If you are using
a trend viewer display to view replayed data in VCRWorX, only pens that have been data-logged will
be viewable in VCRWorX playback mode. If multiple pens are shown in the trend display and only
some of those pens have been logged to a trend logger database, in playback mode you will see
only those pens that have been data-logged. Any pens that have not been data-logged will not be
displayed.
For complete information about configuring VCRWorX, please see the VCRWorX Help
documentation.
7.4
Introduction
Functions Not Supported in Runtime Mode
The following functions are not supported in runtime mode:
•
Replacing point names (You should use delete/add, or within the VBA environment, use
the "FormLoad" event for replacing point names.)
•
Changing the trend plot type
•
Getting to the Time Settings object through the OLE interface
•
Modifying the x-axis of XY plots
•
Modifying file name for saving statistics
•
Modifying preference for global ranges
•
Modifying preference for shifting grids
•
Modifying preference for startup value
•
Modifying preference for restoring range values
Security
The TrendWorX Viewer ActiveX is interfaced to the ProcessView Security Server through
OLExpress. The security system is enabled within runtime mode to provide a very flexible security
mechanism. The TrendWorX Viewer supports the security actions shown in the dialog box below.
If you do not have the appropriate security actions for the functions you want to perform, an error
message box will appear indicating that you do not have the security level required by the action.
ProcessView Security Server
7.5
TrendWorX Viewer ActiveX
Asynchronous Downloading Features
The TrendWorX Viewer supports asynchronous downloading of configuration data when used inside
ProcessView ActiveX document servers, such as GraphWorX, to produce documents, which can be
viewed using Microsoft Internet Explorer.
To enable this feature, select URL Path from the General tab of the TWXView ActiveX Properties
dialog box, shown below, and supply a URL path. In the case of viewing ActiveX documents within
an intranet setup, you can supply a server name and directory specifying the location of the
TrendWorX Viewer configuration data (must be a shared directory), by using the convention
"file:\\Server Name\Directory\File Name.v32."
You can also enable the Use Local Settings option, which, if checked, stores runtime changes to a
local copy of the remote configuration file. It will use this local file every time the HTML page that
hosts the Viewer is loaded inside the Web browser.
TrendWorX Viewer ActiveX Properties: General Tab
Language-Aliasing Support
The TrendWorX Viewer ActiveX component has all of its strings saved in the resource file, which
can be modified to provide custom versions. In addition, it provides real-time support for loading a
resource-only .dll to support international languages. This .dll file is compiled as a standard Win32
.dll, and it is made up of all the resources and the .odl file of the TrendWorX Viewer module. Any
time the ProcessView applications settings are switched to a different language, TrendWorX Viewer
will load the corresponding resource .dll.
The resource-only .dll file name uses the TrendWorX Viewer component, followed by the three
characters used in Windows NT as the abbreviation for a language name (e.g., the abbreviation
"deu" stands for German, and the .dll should be named "TWXViewer_deu.dll"). In addition, using the
OLE automation property language ID, you can control this functionality through OLE automation.
In addition, the Unicode version of the TrendWorX Viewer ActiveX supports language aliasing with
automatic range and value scaling, as well as unit conversions, formatting, and font selection. For
more information about configuring Unicode version language-aliasing support, please refer to the
ProcessView Language Configurator documentation. The TrendWorX Viewer ActiveX supports the
following language-aliased strings:
•
Pen description
7.6
•
Pen engineering units (with scaling support)
•
Pen details format
•
Title string of viewer
•
Format strings of details
•
Detail window column names
Introduction
Note: The TrendWorX Viewer requires the following additional language- aliasing configuration
work. If any expression is to be used for range, alarm limits, or unit scaling, you need to define both
a "Read Expression" and a "Write Expression" in the Language Configurator. By doing so, the
Viewer will be able to function properly between language switches.
Note: To enhance language-aliasing performance, select the Microsoft Arial Unicode font, which
contains all Unicode characters. The Arial Unicode MICROSOFT font must be selected separately
within the Properties dialog box of each ActiveX component.
Sample Language Configuration
The Unicode version of ProcessView installs a sample Language Server configuration, called
LangSupSample.mdb, under the Program Files\Smar\ProcessView\Examples\Languages folder of
the ProcessView product installation "tree." In addition, this folder includes a sample GraphWorX
display, called LanguagesDemo.gdf, which includes a sample Viewer configuration. The figure
below shows this sample display during runtime mode. Notice that you can switch between
languages in this display by simply clicking the buttons in the Change Language field.
Language-Aliasing Demo in Runtime Mode
The figure below shows this same language-aliasing demo in configuration mode. This display
incorporates ActiveX objects from GraphWorX, TrendWorX, and AlarmWorX.
7.7
TrendWorX Viewer ActiveX
Language-Aliasing Demo in Configuration Mode
For example, if you click on the "Water System" time plot trend in the language-aliasing
configuration shown above, you can view the properties of the trend in the TrendWorX Viewer Active
X. The Edit Trend Pen dialog box, shown below, displays the language-aliasing configuration of the
"Tank Level" pen in the time plot trend for the water-monitoring system.
Language Aliasing Pen Configuration
When specifying a language alias, you can also select a language alias from the Language Alias
Browser, which includes all language aliases in the language database. This eliminates the need to
manually type in the alias name. Clicking the ... button opens the Language Aliases tab of the
Unified Browser, which includes all language aliases in the language database. This eliminates the
need to manually type in the alias name. Clicking the ... button opens the language alias browser.
The browser includes all languages aliases in the language configuration database. All language
aliases that are configured in the Language Configurator are conveniently available to choose from
inside the browser. The tree control of the Language Configurator is mimicked in the tree control of
the language alias browser. Select a language alias by double-clicking the alias name. The alias
7.8
Introduction
name appears at the top of the browser, which automatically adds the /+ and +/ delimiters to the
alias name, as shown in the figure below. Click the OK button.
Selecting a Language Alias From the Unified Browser
Delimiters. For the example above, the trend display appears as shown in the figure below. Note
that the strings within a "/+" and "+/" delimiter pair define a language-aliased string. During animation
(runtime) mode, the TrendWorX Viewer ActiveX interfaces to the Language Server and tries to
resolve the language-aliased strings. If successful, it displays the translated strings in the trend
screen. In addition, if the Units language alias string has an equation defined in the Language
Configurator, it autoscales the pen values based on the scaling equation supplied by the Language
Server.
Language-Aliased Trend Display
Note: The Unicode version language aliasing is independent of the resource .dll selection, which
relates mostly to the text in the dialog boxes and other user interface elements.
7.9
TrendWorX Viewer ActiveX
Global Aliasing Support
The TrendWorX Viewer supports Global Aliasing by interfacing to the Global Aliasing Server. The
following strings can be aliased:
Viewer Title
o Title
Ranges
o Hi Tag, Lo Tag, Format, Format XY
Details
o Format
Pen
o Point Name, Hi Tag, Low Tag, Description, Units, Details Format, Ranges Format, Persistent
Group Name
URL Path
o Configured in the General tab of the TrendWorX Viewer ActiveX Properties dialog box.
Expressions
o In the Expression Editor, click the Tags button and select Global Aliases from the pop-up menu
to open the Global Alias Browser.
Currently the TrendWorX Viewer supports machine-level and process-level aliasing. All fields, which
support aliasing, have been interfaced to the Global Alias Browser dialog, which is evoked by
clicking on the … button.
In addition, the TrendWorX Viewer has integrated Language Aliasing and Global Aliasing browsers.
The user first connects a real time, persistent, or historical tag and then has the option to alias the
entire pen string or part of it. Global aliasing is also supported also for drag-and-drop operations as
well as related OLE automation methods.
What is NOT supported:
o Runtime editing of aliased fields
o Aliases resulting in new global aliases (ie a resolved alias is also an alias)
o Local settings saving if Global Aliases are used.
Global Aliasing Pen Configuration
7.10
Introduction
Clicking the ... button opens the Global Alias Browser, as shown in the figure below. Select a global
alias from the Unified Browser, which includes all global aliases in the global alias database. This
eliminates the need to manually type in the alias name. All global aliases that are configured in the
Global Alias Engine Configurator are conveniently available to choose from inside the browser. The
tree control of the Global Alias Engine Configurator is mimicked in the tree control of the Global
Alias Browser. Select a global alias by double-clicking the alias name (e.g. "Floor" in the figure
below). The alias name appears at the top of the browser, which automatically adds the <# and #>
delimiters to the alias name. Click the OK button.
Selecting a Global Alias From the Unified Browser
Internal Architecture of ActiveX
The internal architecture of the TrendWorX Viewer ActiveX is composed of three individual object
managers:
•
A Point manager (used to store point name information)
•
A Variable manager (used to store data buffers and server updates for each point)
•
A Pen manager (used to represent the visual aspect of the collected data points)
In addition, TrendWorX Viewer has the following threading mechanism:
•
A Main (primary) thread
•
A Worker thread used for data updates and buffer management
The internal architecture of the TrendWorX Viewer allows the data to be collected at a different rate
and graphically drawn at a multiple of the data-collection rate in order to minimize overall system
load. Currently the minimum scan rate is set to be 10 milliseconds, and it is required that all datacollection rates that you set be an integer multiple of 10 milliseconds.
In addition, you can configure the desired number of samples to view on the screen (up to a
maximum of 7200) and the desired window time period. Furthermore, all objects exposed by the
TrendWorX Viewer ActiveX can be accessed directly through OLE Automation, and their associated
properties can be manipulated directly through C++ clients (which support OLE containment) or
Visual Basic applications. The fastest display refresh (redraw) rate is 50 milliseconds.
TrendWorX Object Capability
This section describes the objects exposed through OLE Automation used in TrendWorX Viewer
ActiveX. These can be easily viewed in Visual Basic's Object Browser, shown below.
7.11
TrendWorX Viewer ActiveX
Visual Basic Object Browser
Using Visual Basic To View Title Objects
Title manages title information, such as the title name, font options, and drawing of the title. The
Title Object serializes all title-specific information.
Using Visual Basic To View Grid Objects
Grid manages grid options and drawing of the grid. The Grids Object serializes all grid-specific
information. There are individual objects for X-grids and Y-grids.
Using Visual Basic To View Ranges Objects
Ranges manages range information, such as border options, and drawing of the ranges according
to plot type. The Ranges Object serializes all range-specific information.
Using Visual Basic To View Time Settings Objects
Time Settings manages time information, such as border options, font options, and drawing of the
time field. The Time Settings Object serializes all time field-specific information.
Using Visual Basic To View Details Objects
Details manages detail information, such as border options, and drawing of the Details field. The
Details Object serializes all detail-specific information.
7.12
Introduction
Using Visual Basic To View Pen Objects
Pen manages all visual aspects of the signal being trended, including display management,
statistics, and curve style. The Pen Object serializes all pen-specific information.
Circular Charts
A circular chart is a trend type that plots signal values in a circular field. The signal value is
represented by the distance from the center of the chart. The angular position of the points on the
line represents time.
To create a circular chart ActiveX, select Circular Chart from the Add Trend submenu of the Edit
menu, or press the shortcut keys CTRL+6. This will display the circular chart ActiveX in the
TrendWorX Container, as shown below.
Circular Chart
Open the TWXView ActiveX Properties dialog box by double-clicking the circular chart ActiveX, or
by selecting Properties from the container Edit menu. This will enable you to set the properties for
the circular chart.
Set the trend period and the data-collection rate using the Rates tab in the TWXView ActiveX
Properties dialog box, shown in the figure below. The thickest line on the circular chart, prominent
because of its bold appearance, represents the point of origin for the trend period. Notice that the
time labels go counter-clockwise in conformity to the industry standards.
7.13
TrendWorX Viewer ActiveX
Properties Dialog Box: Rates Tab
Once all the data points are plotted within the trend period during runtime mode, one of the following
will occur:
•
All data points will disappear, and a new trend period will begin.
•
All data points will remain and continuously scroll as old data points are replaced by new data
points.
You can control these conditions using the Settings tab of the TWXView ActiveX Properties dialog
box. When Reset Circular Chart is checked in the Settings tab, all data points will disappear at the
beginning of each new trend period. In addition, you can choose to have the circular chart auto print
upon resetting after a full trend period has elapsed.
Altering the Appearance of a Circular Chart
You can change the appearance of a circular chart using the tabs in the TWXView ActiveX
Properties dialog box. Particularly relevant to the appearance of the circular charts are the
Appearance tab and, to a lesser extent, the Ranges tab. For more information on how to use these
tabs, please see the appropriate sections.
7.14
Introduction
Circular Charts in Runtime
The following figure is an example of how a circular chart looks during runtime mode.
Circular Chart in Runtime Mode
ActiveX Properties
This section describes the user interface for TrendWorX Viewer ActiveX. The TwxView ActiveX
Properties dialog box (also called the Properties dialog box), shown below, is the configuration
user interface for the ActiveX. Double-clicking the ActiveX during configuration mode opens the
Properties dialog box, which as you can see contains the following tabs:
•
General tab
•
Appearance tab
•
Ranges tab
•
Pens tab
•
Rates tab
•
Settings tab
7.15
TrendWorX Viewer ActiveX
TWXView ActiveX Properties Dialog Box
General Tab
The General tab, shown below, is the default tab of the Properties dialog box. The General tab
handles the following functions:
•
Viewer title
•
File selection
•
Web configuration
•
Plot type
Properties Dialog Box: General Tab
To select an alias to use for the Viewer Title, click the ... button to the right of the text box and
select either Global Aliases or Language Aliases from the Unified Browser. This opens the
respective alias browsers, allowing you to choose from a list of available aliases.
You should always choose the Plot Type first because this choice determines which options will
also be available later on. The TrendWorX Viewer component can save its configuration data on a
serialized file using the file extension .v32. By default, its configuration is saved in the container.
You must configure this parameter (by clicking Save As) for all configuration data to be saved.
7.16
Introduction
Clicking About launches the About Box, which displays information about the application.
By default, information is stored as part of the container application's document file. You can also
store information as part of a separate (.v32) file. To save the .v32 file, under Configuration File
click Save As to open the Save TWXViewer Display dialog box. Enter a name for the .v32 file in
the File Name field, and then click Save.
You can also open an existing configuration file by clicking the Load button on the General tab and
browsing for the file. The ActiveX will attempt to load the configuration file. If URL Path is selected,
the ActiveX will use the specified network URL path upon loading the file.
Note: The ActiveX cannot be saved to a URL path. To create a URL file, save a configuration to a
local file and copy the file to the desired network location. When the URL Path option is selected,
you can also enable the Use Local Settings option, which, if checked, stores runtime changes to a
local copy of the remote configuration file. It will use this local file every time the HTML page that
hosts the Viewer is loaded inside the Web browser.
You can also select aliases to use for the configuration file. Clicking the ... button opens the Global
Aliases tab of the Unified Browser, as shown in the figure below. Select a global alias from the
Unified Browser, which includes all global aliases in the global alias database. This eliminates the
need to manually type in the alias name. All global aliases that are configured in the Global Alias
Engine Configurator are conveniently available to choose from inside the browser. The tree control
of the Global Alias Engine Configurator is mimicked in the tree control of the Global Alias Browser.
Select a global alias by double-clicking the alias name (e.g. "Floor" in the figure below). The alias
name appears at the top of the browser, which automatically adds the <# and #> delimiters to the
alias name. Click the OK button.
Selecting a Global Alias from the Unified Browser
Appearance Tab
The Appearance tab of the Properties dialog box, shown below, sets the appearance properties for
the following items:
•
Workspace
•
Details
•
Ranges
•
Time
•
Grids
7.17
TrendWorX Viewer ActiveX
Properties Dialog Box: Appearance Tab
Change Font
The Appearance tab sets the font type for the Workspace, Details, Ranges, and Time Settings
sections of the Trend window. Click the Change Font button to choose a font. The standard
Windows Font dialog box appears, and you can select the font type, size, and style.
Appearance: Workspace
The Workspace section of the Appearance tab, shown below, configures various cosmetic aspects
of the trend display, such as colors, background, and borders. To display the viewer title in the trend
display, check the Show Title check box.
Appearance Tab: Workspace Settings
Backgrounds
The TrendWorX Viewer ActiveX supports the use of background images in trend displays. To enable
the background, check the Show Background check box, as shown in the figure above. Click the
Browse button to select an image file to use as your background. The ProcessView installation
provides several background images that you can use in your displays. Or you can create and use
your own images. Once you have selected your image, click the Apply button, and the image will
appear in the trend background.
Choosing the Centered option centers the background image in the trend display and preserves the
aspect ratio of the original image. Choosing the Stretched option stretches the background image
across the entire area of the trend display. Stretching may cause some images to become distorted.
7.18
Introduction
Colors
In the Colors section of the Workspace settings, you can choose the colors for the Background,
Title (the title and text displaying the type of trend), and Foreground (the actual chart). To change
the color, simply click the box corresponding to the area that you want to change. This opens a
Color dialog box, which enables you to select a predetermined color. You may also select the
Define Custom Colors button to create a color.
Border Style (available only with the old plot style)
The Border Style section of the Workspace settings defines the type of border and placement the
display will have. There are four options for the Trend Border Style: Bumped, Etched, Raised, and
Sunken. In the bumped style, only the border looks raised, while the etched style is mostly flat. In the
raised style, the border looks as if it is coming out of the window. In the sunken style, the border
looks as if it is going into the window. The Trend Border Options list enables you to select where
you want the border to be placed: Bottom, Bottom Left, Bottom Right, Left, Rectangle, Right, Top,
Top Left, or Top Right.
You can select which components of the trend you want to appear on the display. Additionally, you
can select Trend Border Style and the Trend Border Options. To enable the trend border, check
the Border check box. To give the border a three-dimensional appearance, check the 3D Edge
check box.
Appearance: Details
The Details section of the Appearance tab, shown below, manages the detail display information
area, and the enabled choices closely match the selected plotting type.
Appearance Tab: Details Settings
Colors
In the Colors section of the Details settings, you can choose the colors for the Text and
Background. To change the color, simply click the box corresponding to the area that you want to
change. This opens a Color dialog box, which enables you to select a predetermined color. You
may also select the Define Custom Colors button to create a color.
Border Style
The Border Style section of the Details settings defines the border attributes for the Details
window. There are four options for the Border Style: Bumped, Etched, Raised, and Sunken. In the
bumped style, only the border looks raised, while the etched style is mostly flat. In the raised style,
the border looks as if it is coming out of the window. In the sunken style, the border looks as if it is
going into the window.
Columns
Clicking the Columns button on the Details tab opens the Detail Window Columns dialog box, as
shown in the figure below. This dialog specifies the column names for the details section of the
Trend Viewer, and also enables you to choose which columns to display in the Details window. Both
the column names and descriptions are listed, but you can only modify column names. To change a
7.19
TrendWorX Viewer ActiveX
column name, right-click on the name and select Rename from the pop-up menu, as shown in the
figure below. Your changes are reflected in the Viewer.
Note: When you right-click on a column name, you can also select a language alias (Unicode
version only) from the Language Alias Browser.
Setting the Column Names for the Viewer
Spacing
Clicking the Spacing button allows you to configure a default column spacing for the Details window
to be recalled during runtime mode. This opens the Details Entry Spacing dialog box, as shown in
the figure below. As you can see, the column spacing corresponds to the spacing the trend viewer
display. Adjust the spacing according to the number of columns that are displayed.
Details Window Spacing
Other Options
The Number of Entries field displays the number of pens in the Details window of the Viewer. If
more pens exist, the Details window will show a scroll bar for scrolling up or down. If Show Header
is checked, the Details window header will be displayed. If Show Tool Tips is checked, tool tips
indicating the sample values will be displayed as the cursor moves across the display area in freeze
mode.
If Show Msecs is checked, the Details window will append the milliseconds value to each time
stamp displayed. If Show Pen Style is checked, the Details window will draw a line in front of the
pen description text in the same style, width, and color as the pen curve. This way, signals drawn
with different pen styles can be easily identified in monochrome printouts.
Appearance: Ranges
The Ranges section of the Appearance tab, shown below, manages the Ranges Configuration for
the trend display. Depending on the selected plot type, some options may or may not be available.
To display ranges in the trend display, check the Show Ranges check box.
The Size field indicates the size of the entire ranges field in the trend display. The Align field
determines where the ranges field will be placed in the trend window (right or left), with the exception
of the Strip Chart, in which the only range values are x-ranges that cannot be moved from left to
right. The Visible Ranges sets how many range scales will be visible in the trend display.
7.20
Introduction
Appearance Tab: Ranges Settings
Colors
In the Colors section of the Ranges settings, you can choose the colors for the Text of global
ranges and Background of the range box when the “old plot style” option is checked. To change the
color, simply click the box corresponding to the area that you want to change. This opens a Color
dialog box, which enables you to select a predetermined color. You may also select the Define
Custom Colors button to create a color.
Border Style (available only with the old plot style)
The Border Style section of the Ranges settings defines the border attributes for the Details
window. There are four options for the Border Style: Bumped, Etched, Raised, and Sunken. In the
bumped style, only the border looks raised, while the etched style is mostly flat. In the raised style,
the border looks as if it is coming out of the window. In the sunken style, the border looks as if it is
going into the window. The Border Options list enables you to select where you want the border to
be placed: Bottom, Bottom Left, Bottom Right, Left, Rectangle, Right, Top, Top Left, or Top Right.
Format
The Format field determines how the numbers representing the ranges will appear (decimals or
integers). To select an alias to use for the Format, click the ... button to the right of the drop-down
list. This opens the respective alias browsers, allowing you to choose from a list of available aliases.
Appearance: Time
The Time section of the Appearance tab, shown below, configures the style of the time display
inside the trend (e.g. the x-axis labels on a time plot). You can select the border and size
parameters, as well as the text and fill colors. You can also choose to show or not to show the date,
seconds, and milliseconds during runtime mode.
To display time information in the trend display, check the Show Time check box. To display the
date in the trend display, check the Show Date check box. To display seconds in the trend display,
check the Show Seconds check box. To display milliseconds information in the trend display, check
the Show Millisecs check box.
7.21
TrendWorX Viewer ActiveX
Appearance Tab: Time Settings
Time Stamp Gap
The Time Stamp Gap determines how many time stamps to remove between time labels in a trend
plot. In the time plot shown in the figure below, the time stamp labels appear at fixed intervals along
the x-axis. If you resized the trend window to make it smaller, the time labels would collide and
overlap, making the time stamps impossible to read. However, if you remove some of the time
stamp labels on the plot, the labels will not collide and will still be readable. Click the arrow buttons
to change the spacing between time stamps as needed.
Note: The Time Stamp Gap setting does not affect the actual time data of the trend; it only affects
how much space appears between the time labels.
Spacing Between Time Stamps
Colors
In the Colors section of the Time settings, you can choose the colors for the Background of the
time box when the “old plot style” option is checked and Text (the title and text displaying the type of
trend). To change the color, simply click the box corresponding to the area that you want to change.
This opens a Color dialog box, which enables you to select a predetermined color. You may also
select the Define Custom Colors button to create a color.
Border Style (available only with the old plot style)
The Border Style section of the Time settings defines the type of border and placement the display
will have. There are four options for the Border Style: Bumped, Etched, Raised, and Sunken. In the
bumped style, only the border looks raised, while the etched style is mostly flat. In the raised style,
the border looks as if it is coming out of the window. In the sunken style, the border looks as if it is
going into the window. The Border Options list enables you to select where you want the border to
be placed: Bottom, Bottom Left, Bottom Right, Left, Rectangle, Right, Top, Top Left, or Top Right.
7.22
Introduction
Appearance: Grids
The Grids section of the Appearance tab, shown below, configures the appearance of the grid on
the display. If the Show boxes are checked, the respective x-axis and y-axis grid lines are displayed
in the trend display.
Appearance Tab: Grids Settings
TrendWorX conveniently provides for separate configuration for the x-axis and y-axis, with the
exception of the bar plot, which does not support x-axis grids. You can select a Line Style for the
line from the following options: Dashed, Dotted, Dotted Dash, or Solid. The Line Width field
specifies how wide the grid lines are for each axis. You can select a color for the grid by clicking the
color box and choosing a color. The Number of Lines field specifies the number of grid lines you
want to appear for each axis. The Ticks Between Lines field specifies the number of ticks (i.e.
intervals) between any two grid lines.
Circular Charts
If you are using a circular chart, the following dialog box appears. Select the Grids tab to modify the
color and style of the radial grids and circular grids.
Grids Tab for Circular Charts
Click More to open the Grids Options dialog box, shown below, which enables you to change the
number, width, style, and color of the radial and circular subgrids. You can elect to show or not to
show (enable or disable) the radial and circular subgrids. You can choose the number, width, style
and color of the radial and circular subgrids. You can also set the number of grids to be shown
between value labels, whether they are grids or subgrids. You can set the position of the drawing
heads by selecting one of the options from the Drawing Heads Position drop-down list. You can
also select the edge thickness of the circle.
7.23
TrendWorX Viewer ActiveX
Grids Options Dialog Box for Circular Charts
Ranges Tab
The Ranges tab of the Properties dialog box, shown below, manages the global ranges
configuration for the trend display. Depending on the selected plot type, some options may or may
not be available.
Properties Dialog Box: Ranges Tab
The Global Ranges section of the Ranges tab sets the ranges for the trend display. If Global
Ranges is checked, all pens will be drawn using the same set of ranges. These can be constants,
expressions, OPC tags, or global aliases. To select an OPC tag for the low or high ranges, click the
Tags button. To select an expression, click the = button to open the Expression Editor. To select a
global alias, click the ... button and select Global Aliases from the pop-up menu. This opens the
Global Alias Browser, allowing you to choose from a list of available aliases.
In the Unicode version of the TrendWorX Viewer, if Global Ranges are enabled, the Format field
can be language-aliased to produce the desired number formatting, font, and scaling (if a scaling
expression is available in the Language Configurator).
If you are using an XY plot, the Set X-Range button will be available. Clicking this button opens the
Ranges Configuration dialog box, which specifies the High and Low ranges, as well as the
Format, for the x-axis.
7.24
Introduction
Ranges Configuration for XY Plots
Pens Tab
The Pens tab of the Properties dialog box, shown below, handles the signal connection, editing,
and configuration for the data displayed in the trend. Clicking OPC Tags opens the Unified
Browser.
Properties Dialog Box: Pens Tab
To display only historical data, in freeze mode you must check History Only. Then you can make
connections to OPC HDA servers. If this option is not set, you can make both real-time and historical
tag connections on the same TrendWorX ActiveX Viewer. You can connect signals to pens, which
are coming from an OPC server or are the result of a calculated expression to show the real-time
data. This is illustrated in the following sections:
•
OPC Tags
•
Tags Menu
•
Edit Button
You can also delete, modify, and replace pens. To delete one or more pens, select the pen and then
click Delete on the Pens tab. Then click Yes to delete the pen. To replace or modify the pen, click
Replace on the Pens tab. This opens the Search and Replace dialog box, shown below. You can
search for and replace text as needed to modify the pen.
7.25
TrendWorX Viewer ActiveX
Search and Replace Dialog Box
Reordering Trend Pens
The TrendWorX Viewer ActiveX supports reordering of pens in configuration mode. In the Pens tab,
select the trend pen(s) you would like to reposition, as shown in the figure below.
Reordering Trend Pens
Then click the up or down arrow buttons to reposition the selected pen(s). The pens move up or
down, as shown in the figure below.
Trend Pens Repositioned
7.26
Introduction
Rates Tab
In the Rates tab of the Properties dialog box, shown below, you can select the desired DataCollection Rate and the number of Samples, among other variables. Currently the fastest datacollection rate is 10 milliseconds (ms). The update rate is calculated by inserting the variables on the
Rates tab into an equation. Therefore, if you change one of these variables, all other variables will
be updated automatically. Notice also that the data-collection rate is configured independently of the
drawing action. The fastest display update rate is 50 ms, with the exception of bar plots, in which the
display rate matches the data-collection period.
Properties Dialog Box: Rates Tab
The Display Refresh Rate controls the speed at which the signal curves will be drawn. If, for
example, the data-collection rate is set to 250 ms and the Display Refresh Rate is set to 4, the
samples will be collected at 250 ms, but the signal curve will be updated every second without loss
of data. This is a great option to minimize system-resource usage.
The History Refresh Rate controls the frequency at which the historical pens will be refreshed with
new historical data from the TrendWorX Historical Database. This can be used as an optimization
and load-balancing tool. For example, if the TrendWorX SQL Server is configured to log to the
database every 1 min., then the History Refresh Rate should be set to a maximum of 1 min.
Settings Tab
The Settings tab of the Properties dialog box, shown below, manages various aspects of the trend
configuration.
Properties Dialog Box: Settings Tab
7.27
TrendWorX Viewer ActiveX
If Autostart is checked, the TrendWorX Viewer ActiveX will automatically enter animation mode
when the container application switches from design mode to use mode. Note that in the TrendWorX
and AlarmWorX containers, this option is disabled, and both applications will start the ActiveX
Viewers through OLE Automation.
If Main Toolbar is checked, you can access the Trend Viewer toolbar during runtime mode.
When Shift Grids is checked, the relative location of the grids on the axis is time-scale based. You
can also enable the restoration of range information that may have been changed during runtime
mode. Choosing startup determines a relative plot of each signal on the display based on the
Location % value. The default value is 0, and the pen curve will begin plotting from the far right side
of the trend display.
Under the Statistics File section, you can click the Browse button and select a .csv file for saving
statistical information during runtime. Check Append if you want to append the statistical information
to the .csv file or overwrite the existing one.
Selecting Save Ink will conserve ink while printing by not using the configured background color fill
of the individual areas within the trend display. The curves and text, however, will be printed in the
configured colors. Also, if you select Print Circular Chart on Reset, and the Reset Circular Chart
after full period option is enabled, the TrendWorX Viewer will automatically print the circular chart
display.
TrendWorX Version 8.0 introduced a new look and feel to the trend viewer display. To revert to the
style TrendWorX versions prior to Version 8.0, check the Old Plot Style check box.
If you have inserted background images into your trend display, you have the option of printing the
background when printing trend displays. If you do not want to print the background image with trend
display in order to conserve ink, uncheck the Print Background check box.
Click the Scroll Bar button to set the time range for how far back you will be able to scroll while in
freeze mode. This opens the Trend Scroll Bar Configuration dialog box, as shown below. If
Display Scrollbar is checked, you must select a range for how far back you can scroll. By default,
the scroll range is set at 3 hours, but the options of 10 seconds, 30 seconds, 1 minute, 2 minutes, 10
minutes, 30 minutes, 1 hour, 8 hours, 1 day, 5 days, 1 week, 1 month, 3 months, 6 months and 1
year are also available from this list. If you wish to enter a more-specific range you can check
Custom Range and select the range in years, months, days, hours, minutes, and seconds.
Trend Scroll Bar Configuration Dialog Box
OPC Tags
To make real-time connections from the Pens tab of the Properties dialog box, click the OPC Tags
button. This opens the Unified Browser, which enables you to browse all available OPC servers
and their signals, as shown below.
You can make multiple tag connections through the Unified Browser. To do so, first expand the
server "tree" and then double-click the tags you wish to connect from the expanded tree view. Once
all selections are made, click OK to establish the connections.
7.28
Introduction
Unified Browser
Tags Menu
Clicking Tags Menu in the Pens tab of the Properties dialog box opens the following menu, as
shown in the figure below.
Tags Menu
The Tags menu contains the following basic options:
•
Expression editor
•
Simulation variables
•
Persistent trend
•
History tag
7.29
TrendWorX Viewer ActiveX
In addition to these options, the following global alias options allow for global aliasing connections:
•
OPC Tag Alias
•
Persistent Trend Alias
• History Tag Alias
You can select these options to connect to various alias types.
Selecting OPC Tag Alias opens the Global Alias Browser, where you can select from a list of
configured global aliases.
If you select Persistent Trend Alias, you will be asked to edit the pen, after the alias connection is
made, and alias the Persistent Trend group for proper operation.
If you select a History Tag Alias pen, you will be prompted to first pick a historical tag from an OPC
HDA server and then select the alias to use. After the connection is made, you will be asked to edit
the pen and select the remaining aliases.
Expression Editor
Selecting Expression Editor from the Tags Menu in the Pens tab of the Properties dialog box
launches the Edit Expression dialog box, shown in the figure below. The Expression Editor,
shown below, is available to assist you in creating expressions for your ProcessView applications.
The window is resizable and can be stretched as well as maximized or minimized. The drop-down
list at the top of the Edit Expression dialog box keeps track of the last 50 expressions you have
entered. The expression entered most recently is the first one in the drop-down list.
Note: For more information about the Expression Editor, please see the Expression Editor help
documentation.
Expression Editor
Editing the Trend Pen
Once you have configured a pen, you can double-click the pen in the Pens tab list, as shown below.
This opens the Edit Trend Pen dialog box, which allows you to edit many options specific to that
pen.
7.30
Introduction
Selecting Pens to Edit
Simulation Variables
Selecting Simulation Variables from the Tags menu in the Pens tab of the Properties dialog box
launches the TrendWorX Simulated Values dialog box, shown below, which lists all available
simulated variables. Selecting one of these variables will create a pen attached to the simulated
variable. These variables are helpful in testing the setup of your pens.
For simulation variables within an expression, use the following syntax:
{{simulation_variable_name}}
x={{gfwsim.random.long}}
Simulated Values Dialog Box
Persistent Trend
If the ProcessView Persistent Trending Automation Server is installed, configured, and running,
selecting Persistent Trend from the Tags menu in the Pens tab of the Properties dialog box
enables direct connections to the Persistent Trending server. A new dialog box appears, as shown
below, showing all groups configured in the Persistent Trending server.
7.31
TrendWorX Viewer ActiveX
Persistent Trend Dialog Box
Double-clicking a group displays all signals configured for that specific group. You can select which
signals to connect from the Persistent Trending server and click Connect. TrendWorX Viewer fills its
buffer from the data existing in Persistent Trending prior to drawing.
History Tag
Selecting History Tag from the Tags menu in the Pens tab of the Properties dialog box opens the
Unified Browser. Then you can browse for OPC HDA tags.
Browsing for Historical Tags
7.32
Introduction
Editing Pens
Clicking Edit in the Pens tab of the Properties dialog box (when a pen is selected) opens the Edit
Trend Pen dialog box, shown below, which contains the following tabs:
•
General tab
•
Alarms tab
•
Ranges tab
•
Totalizer tab
•
Ideal Pens tab
Edit Trend Pen Dialog Box
General Tab
The General tab, shown below, is the default tab of the Edit Trend Pen dialog box. This tab allows
you to change the tag with which the selected pen is associated, the description of the pen, and the
units assigned to the pen. It also provides various options and style settings for the pen.
Note: In the new plot style, the pen description is used as the pen identifier/title in the ranges field in
a stacked plot.
In the Unicode version of TrendWorX Viewer, the Description (Desc), Units, and Details Format
fields can be language-aliased. If the language alias for the units also has a related equation, this
will result in the automatic range and value scaling for the pen upon switching languages.
To select an alias to use, click the ... button to the right of the Tag, Desc, Units, Persistent Group,
or Details Format fields and select either Global Aliases or Language Aliases from the respective
alias browsers, which enable you to choose from a list of available aliases.
7.33
TrendWorX Viewer ActiveX
Edit Trend Pen Dialog Box: General Tab
General Tab Functions
Function
Description
Indicates whether the plot of the selected pen will be visible. If Visible is not
Options - Visible
checked, the Viewer will still buffer data for the pen, but it will not draw it.
Describes how the plot will appear. The stair plot uses a stepwise draw
Options - Stair Plot method to plot the trend. It is ideal for plotting slowly changing signals or
setpoints.
If the pen being edited is a historical pen, then the Pen Comments check box
Options - Pen
will be enabled. If checked, when the TrendWorX Viewer ActiveX is in freeze
Comments
mode, it will retrieve and display all related historical comments and batch
information (if any).
Options - Pen
Provides a marker for the pen on the right-hand side of the trend display
Marker
indicating the last data point drawn on the graph.
Inserts a shape of your choice (e.g. square, circle, triangle, or diamond)
Options - Show
around every point on the graph that represents an actual data point. The
Samples
default shape is a square.
Options - X-Axis
Indicates the horizontal axis selection for XY plots.
This option applies to real-time pens. If enabled, it will shift the time axis of the
pen so that the curve will be plotted within the current time frame of the
Options - Auto Sync Viewer. This option should be used when real-time pens are connected to
remote OPC Data servers and there no network synchronization facility is
applied.
Select a line style for the plot from the drop-down list: Solid, Dashed, Dotted,
Style - Line
or Dotted Dash.
Determines the width of the plot line. If the line width is greater than 1, the Line
Style - Width
field will be unavailable, and the Solid line style will be applied.
Used only for circular charts, determines the size of the plotter for the selected
Style - Plotter
pen: small, medium, big, and huge.
Clicking the Color box opens the Color dialog box, from which you can select
Style - Color
the color of the pen or define a custom color.
Specifies how data will be displayed in the Details window of the Trend
Details Format
Viewer.
The Filter selection is mostly used for historical replay and corresponds to the
averaging method used in retrieving historical data. For example, if Filter is set
Filter
to Last Sample, the last sample of the historical data within each subinterval
will be retrieved.
The TrendWorX Viewer supports the Raw Data filter for historical replay as
7.34
Introduction
follows:
Select the Raw Data filter for a historical pen.
Select the Max. Samples to retrieve.
The upper value of the Max. Samples is taken from the registry setting:
"HKEY_LOCAL_MACHINE\SOFTWARE\Smar\TWXView\Data Properties\Max
Pen Samples"
As a result, the TrendWorX Viewer will ask the TrendWorX SQL Server to
retrieve the Max. Samples number of raw samples (no
interpolated/extrapolated) from the historical data. If more data exist for the
time interval for which the data were requested, an X mark will appear at the
ends of the curve to indicate that not all samples were retrieved for the time
interval of the request. This feature does require some configuration in order to
prevent usage of large amounts of memory.
A typical way to estimate the maximum number of samples data-logged for a
period of time is to divide the time period by the data-collection rate of the
signal configured in the data logger. If no dead band is configured, and the
signal that is data-logged changes frequently, the result indicates an upper
limit of samples data-logged for that period.
Alarms Tab
The Alarms tab of the Edit Trend Pen dialog box, shown below, sets the levels at which alarm lines
will be drawn (if desired).
Edit Trend Pen Dialog Box: Alarms Tab
The TrendWorX Viewer ActiveX allows the connection of OPC Data Access tags to its alarm limits.
The OPC-enabled alarm limits will hold the most current value of the alarm limits. The alarm limits
can be a constant value, an OPC Data Access tag, or an expression.
In addition, the alarm limits are interfaced to the Global Alias and Language Alias servers. This
functionality is not available in History Trend mode due to the nature of this specific historical replay
mode. Several OLE automation methods support this functionality:
void SetPenLoAlarmString(BSTR PenName, BSTR AlarmString, BSTR PenType)
void SetPenLoLoAlarmString(BSTR PenName, BSTR AlarmString, BSTR PenType)
void SetPenHiAlarmString(BSTR PenName, BSTR AlarmString, BSTR PenType)
void SetPenHiHiAlarmString(BSTR PenName, BSTR AlarmString, BSTR PenType)
7.35
TrendWorX Viewer ActiveX
If Show Alarm Lines is checked, dashed lines at the Low, LowLow, High and HighHigh marks
will be inserted into the trend. A sample of this is shown below.
Note: If you desire buffering of alarm values, historical replay functionality, etc., you should not use
the alarm lines support of the TrendWorX Viewer ActiveX, but rather use individual pens to
represent each alarm line (limit).
Alarm Lines Shown
Ranges Tab
The Ranges tab of the Edit Trend Pen dialog box, shown below, deals with the field to the left of
the trend display and the relative scaling of the pen curves for drawing. This tab is available only if
the Global Ranges option is not enabled.
The range values can be constants, expressions, OPC tags, or global aliases. To select an OPC tag
for the low or high ranges, click the Tags button. To select an expression, click the = button to open
the Expression Editor. To select a global alias, click the ... button to open the Global Alias browser,
which enables you to choose from a list of available aliases.
In the Unicode version of TrendWorX Viewer, the Format field can be language-aliased. The
language alias will be used to determine the ranges format on the range scale, if the Global Ranges
option is not selected. To select an alias to use, click the ... button to the right of the Format text box
and select either Global Aliases or Language Aliases from the respective alias browsers, which
allow you to choose from a list of available aliases.
Edit Trend Pen Dialog Box: Ranges Tab
7.36
Introduction
Ranges Tab Functions
Function
Low
High
Tags Button
= Button
... Button
Text Color
Fill Color
Format
Autoscale
Update From
Server on
Animate
Description
Sets the lowest visible point.
Sets the highest visible point.
Launches the Unified Browser.
Launches the Expression Editor.
Opens the alias browsers.
Clicking the Text Color box opens the Color dialog box so that you can
select/define a color for the text of the field.
Clicking the Fill Color box opens the Color dialog box so that you can
select/define a color for the background of the field.
Specifies how data will be displayed in the Ranges section of the Trend
Viewer.
Disables the Low and High fields, and sets these limits automatically
according to the values for the pens. Autoscaling, if checked, adjusts the
range if the actual value is above or below the set limits. For example, if
autoscaling is selected and the ranges are set from 0 (Low) to 200 (High) and
the actual value is 250, then the ranges will autoscale to 0 to 280. The
adjustment will be around 20 percent above the actual value.
If this option is enabled, the ranges of the pen are automatically updated from
the OPC Data server or the OPC Historical servers upon entering animation
mode.
Totalizer Tab
The Totalizer tab of the Edit Trend Pen dialog box, shown below, enables the totalizer function,
which calculates the total amount covered within a certain time period based on the rate represented
by the signal; for example, flow (gallons per minute) and speed (miles per minute). The TrendWorX
Viewer has Totalizer support on a per-pen basis, even for non-circular chart plot types.
Edit Trend Pen Dialog Box: Totalizer Tab
7.37
TrendWorX Viewer ActiveX
Totalizer Tab Functions
Function
Input Signal - Amount Per
Second
Input Signal - Amount Per
Minute
Input Signal - Amount Per
Hour
Input Signal - Amount Per Day
Totalizer Type - Continuous
Totalizer Type - Preload
Totalizer Type - Preset
Description
The signal represents data in seconds.
The signal represents data in minutes.
The signal represents data in hours.
The signal represents data in days.
When Continuous is selected, the Totalizer will keep counting,
starting from 0 until it comes to the end of the trend period, or
until the integrated value exceeds the Auto Reset Level (a
maximum limit).
When Preload is selected, the Totalizer commences counting
from any value. This is especially useful when totalizing must be
“held” (suspended) while a necessary operation is being
performed. For example, the pipes are being cleaned and then
started from a known value.
When Preset is selected, you simply specify a preset value.
If you are counting upwards, the value will obviously be positive.
If you are counting downwards, the preset value will be negative.
A negative value would be relevant in a situation where a
reservoir is being drained, for example. Then the Totalizer
function, if enabled for a circular chart, would help monitor the
flow rate.
When counting upwards, when the total exceeds the preset
value, it is reset.
When counting downwards, the preset value is reset at a
point when it becomes negative.
Initial Value
Enable Totalizer
Manual Reset
Auto Reset Level
Specifies a counting option.
When Enable Totalizer is checked, the Totalizer will run
according to the other configurations on this tab.
In runtime mode, the Manual Reset button is available in the
Totalizer tab. When it is reset, the system returns to its initial
value, and everything else is disabled.
Sets the level at which the system will automatically reset,
returning to its initial value and disabling everything else.
If you select two pens connected to the same OPC tag and enable the Totalizer function for one, you
can view the details—namely that the Totalizer function is enabled—in the output window.
When the signal is 0, the Totalizer will remain at the same value. When it is on, it will show the
cumulative value.
The TrendWorX Viewer has Totalizer support on a per-pen basis, even for non-circular chart plot
types.
Trend Viewer Toolbar
The Trend Viewer toolbar is the runtime user interface for the ActiveX. The toolbar offers you
access to various runtime TrendWorX Viewer ActiveX functions and operations. To view or hide the
toolbar, double-click the TrendWorX Viewer during runtime. You cannot view the toolbar in
configuration mode.
Trend Viewer Toolbar
The Trend Viewer toolbar contains the following buttons:
•
7.38
Edit pens
Introduction
•
Edit trend
•
Edit period
•
Freeze mode
•
Statistics
•
Zoom trend
•
Page back
•
Cursor back
•
Cursor forward
•
Page forward
•
Set right time
•
Show comments
•
Print trend
•
Save trend
•
Dock toolbar
Edit Pens
Clicking the Edit Pens button, shown at left, on the Trend Viewer toolbar opens the Trend Pen
Configuration dialog box, shown below.
Trend Pen Configuration Dialog Box
The Trend Pen Configuration dialog box contains the following buttons:
•
OPC tags
•
Tags menu
•
Edit
•
Delete
OPC Tags
To make real-time connections from the Trend Pen Configuration dialog box, click the OPC Tags
button. This opens the Unified Browser, which enables you to browse all available OPC servers
and their signals.
7.39
TrendWorX Viewer ActiveX
Tags Menu
Clicking Tags Menu in the Trend Pen Configuration dialog box opens the Tags menu, which
contains the following options:
•
Expression editor
•
Simulation variables
•
Persistent trend
•
History tag
Editing Pens
Clicking Edit in the Trend Pen Configuration dialog box opens the Edit Trend Pen dialog box,
which contains the following tabs:
•
General tab
•
Alarm tab
•
Ranges tab
•
Totalizer tab
•
Ideal tab
Please refer to the Editing Pens section above for complete information about the Edit Trend Pen
dialog box.
Delete Button
You can also delete, modify, and replace pens. To delete one or more pens, select the pen and then
click Delete on the Trend Pen Configuration dialog box. Then click Yes to delete the pen.
Edit Trend
Clicking the Edit Trend button on the Trend Viewer toolbar opens the Edit Trend dialog box,
shown below.
Edit Trend Dialog Box
The Global High/Low Ranges fields show the ranges that were assigned in the Ranges tab of the
Properties dialog box. If the Global Ranges box was not checked on that tab, then this section of
the Edit Trend dialog box will be unavailable.
The Scroll Bar button sets the time range for how far back you will be able to scroll while in freeze
mode, as shown in the figure below.
7.40
Introduction
Trend Scroll Bar Configuration Dialog Box
To select the appropriate settings for the Zoom Trend button, click Zooming on the Edit Trend
dialog box. This opens the Zoom Preferences dialog box, shown below. You can select how closely
you want to zoom and which axis you want to use as a base for the zoom when you are using the
point-and-click zoom function. If you use the "rubber band" zooming feature, these options will be
ignored. In addition, these options take global effect for all the TrendWorX Viewers, and they are not
saved on a per-individual Viewer ActiveX basis.
Zoom Preferences Dialog Box
The Grids section of the Edit Trend dialog box determines how many lines along the x-axis and yaxis make up the grid displayed in the Trend window.
Edit Period
Clicking the Edit Period button on the Trend Viewer toolbar opens the Trend Edit Period dialog
box, shown below.
Trend Edit Period Dialog Box
7.41
TrendWorX Viewer ActiveX
The Data-Collection Rate, Display Refresh Rate, and Samples fields are set according to the
settings made on the Rates tab of the Properties dialog box.
You can set the trend period and/or the data-collection rate using the Trend Edit Period dialog box.
If you want to select a custom period, the Custom Trend Period option should be checked first.
Otherwise, the Period field will be activated, and by default this field is set at 2 minutes. But the
options of 10 seconds, 30 seconds, 1 minute, 10 minutes, 30 minutes, 1 hour, 3 hours, 8 hours, 1
day, 5 days, 1 week, 1 month, 3 months, 6 months, and 1 year are also available from this list.
During the Period Change operation, the TrendWorX Viewer ActiveX will try first to increase the
number of samples on a per-pen basis to produce a higher trend time period frame for viewing data.
If upon doing so it exceeds its maximum number of samples per pen, which is currently set to 7200,
it will try to adjust the data resolution (data-collection rate) to produce the desired trend period.
Freeze Mode
Clicking the Freeze Mode button on the Trend Viewer toolbar halts the trend display without
stopping data collection in the TrendWorX Viewer. To unfreeze the display, simply click the Freeze
Mode button again. While the display is in freeze mode, you can click on the display, and a black
vertical cursor line will appear with circles in the color of the each pen where the line intersects the
closest sample of the plot for that pen. By holding the left mouse button down, you can move the
cursor line and view the sample values, time stamps, and other parameters in the Details window.
In freeze mode, additional trending functions, such as zooming and paging, are available.
Note: If the TrendWorX Viewer has historical pens for which the Show Comments option has been
enabled, freezing the display will also retrieve the historical comments and batch information (if
available).
Statistics
Clicking the Statistics button on the Trend Viewer toolbar opens the Trend Statistics dialog box,
shown below.
Trend Statistics Dialog Box
The Trend Statistics dialog box shows relative statistics for all pens in a trend. In the case of bar
plots, the statistics window shows the statistics profile of all signals combined. When the Save or
Save As buttons are clicked, the Save As dialog box opens, and you are prompted to enter a file
name for the statistics. The statistics will be saved in a .csv file. Checking Include Samples
includes each pen's samples in the saved statistics file, along with any historical comments for the
history pens (if available).
Zoom Trend
When you click the Zoom Trend button on the Trend Viewer toolbar in freeze mode, you can zoom
in on the Trend window and perform the point-and-click zoom function. This enables you to zoom in
on the trend display about the current location of the cursor line, using the desired settings for
zooming configured in the Edit Trend dialog box. Clicking the left mouse button while pressing the
SHIFT key or right-clicking the mouse inside the trend display zooms out of the trend display.
7.42
Introduction
In addition to the point-and-click zoom function, the TrendWorX Viewer ActiveX also supports a
"rubber band" or box zoom approach to zooming. While in freeze mode, you can press the SHIFT
key and press the left mouse button to select a desired area on which to zoom. Clicking the left
mouse button while pressing the SHIFT key, or right-clicking the mouse inside the trend display,
zooms out of the trend display.
Cursor Back/Cursor Forward
Clicking the Cursor Back and Cursor Forward buttons on the Trend Viewer in freeze mode move
the cursor line back and forth over the trend display. You can also move the cursor by clicking the
left mouse button on the trend display, or by pressing the left and right arrow keys on the keyboard.
The cursor function is available only when the trend display is in freeze mode.
The cursor enables you to select specific sample data points on the trend display. To get a detailed
description about a specific sample data point in the trend, or to view historical comments and batch
information, point to the sample using the mouse pointer, as shown in the figure above. Pressing the
SHIFT key while clicking the Cursor Back and Cursor Forward buttons moves the cursor left or
right, respectively, 10 samples (by default).
Page Back
Clicking the Page Back button on the Trend Viewer toolbar shifts the trend display back from the
cursor line by one trend period. This function is available only when the trend display is in freeze
mode. The TrendWorX Viewer retrieves and displays historical and persistent trend data from the
TrendWorX Persistent Trending memory buffers.
Page Forward
Clicking the Page Forward button on the Trend Viewer toolbar shifts the trend display forward from
the cursor line by one trend period. This function is available only when the trend display is in freeze
mode. The TrendWorX Viewer retrieves and displays historical and persistent trend data from the
TrendWorX Persistent Trending memory buffers.
Set Right Time
Clicking the Set Right Time button on the Trend Viewer toolbar opens the Set Trend Top/Right
Time dialog box, shown below. This dialog box enables you view a specific historical trend period. In
freeze mode, this causes the TrendWorX Viewer to retrieve and display the selected historical and
persistent trend data from the TrendWorX Persistent Trending memory buffers.
Set Trend Top/Right Time Dialog Box
To select a desired date for the trend period you want to view, click the down arrow in the Date field,
and then choose a date from the calendar, as shown in the figure below. To select a desired time,
highlight the hours, minutes, or seconds in the Time field. You can either type the desired hours,
minutes, and seconds or click the arrows to scan the highlighted time field.
7.43
TrendWorX Viewer ActiveX
Choosing a Date From the Calendar
The Set Trend Top/Right Time dialog box has time and date pick controls as well as an interface to
the historical operator comments and batch information. To use this feature:
1. Select a history pen from the details window.
2. Click the Set Right Time button on the Trend Viewer toolbar to open the Set Trend Top/Right
Time dialog box. Click the Select Comment/Batch button.
3. This opens the Select Comment/Batch (Lot) dialog box, shown below, which allows you to
search for a specific batch entry or operator comment within a time range.
Select Comment/Batch (Lot) Dialog Box
In the Select Comment/Batch (Lot) dialog box:
1. Select a start time and date. To select the date, click the down arrow in the Date field, and then
choose a date from the calendar.
2. Select an end time and date.
3. Click Search to initiate the search.
4. Once the search is completed, use the << and >> buttons to scroll through multiple operator
comments and batch entries.
5. When you locate the desired one, click OK.
Note: Selecting the View Batch Only option filters out the historical operator comments so that only
the related batch (lot) entries are displayed.
Show Comments
If historical pens are configured in the TrendWorX Viewer, clicking the Show Comments button on
the Trend Viewer toolbar places the Viewer in freeze mode and retrieves all historical operator
comments and batch information available. You can then select a historical pen from the Details
window or double-click the comment icon to display the following the Comment(s) Entry dialog box,
shown below.
7.44
Introduction
Comment(s) Entry Dialog Box
If more than one comment exists in the same area, the << and >> buttons will be enabled. These
buttons allow you to scroll through all available comments.
Note: Historical comments are not supported for XY plots and bar plots. Historical comments are
integrated into the ToolTip support as well as the historical replay and ideal pen functionality.
Print Trend
Clicking the Print Trend button on the Trend Viewer toolbar opens the Windows Print dialog box,
which allows you to print the currently selected TrendWorX Viewer. The printout will also include a
header that provides some information about the trend, such as the settings and the name of the
computer in which the trend originated.
Note: If you have inserted background images into your trend display, you have the option of
printing the background when printing trend displays. If you do not want to print the background
image with trend display in order to conserve ink, uncheck the Print Background check box. This
option is in the Settings tab of the Trend Viewer Properties dialog box.
Save Trend
If the TrendWorX Viewer is configured to save its configuration into a .v32 file, independently of the
container, WebHMI users will have the option in runtime mode to save current settings into the
preconfigured file using the Save Trend button on the Trend Viewer toolbar. In the case of a
WebHMI application, this also will be the configuration file to be loaded whenever the HTML page is
refreshed.
Note: The Save Trend function on the Trend Viewer toolbar is integrated into the Security Server
and is ONLY available to WebHMI users. It is not supported in displays that use global aliases.
Dock Toolbar
Clicking the Dock Toolbar button on the Trend Viewer toolbar docks (embeds) the toolbar in the
Trend Viewer display, as shown in the figure below, so that the toolbar is always visible during
runtime mode.
Note: The toolbar docking option is available only in the new plot style, as shown in the figure below.
7.45
TrendWorX Viewer ActiveX
Trend Viewer Toolbar Docked in Trend Display
Historical Replay
The TrendWorX Viewer is interfaced through the OPC Historical Data Access specification to the
ProcessView TrendWorX SQL Server, as well as to other third-party historical servers supporting the
specification.
The TrendWorX Viewer ActiveX is compliant with the latest OPC HDA release specification 1.2. In
general, the OPC HDA specification is an extended OPC specification, which includes an increased
number of interfaces and methods, not all of them being mandatory. On the other hand, the
TrendWorX Viewer ActiveX trend client requires an advanced HDA server implementation to support
its rich user interface. Since not all OPC HDA servers will support the TrendWorX Viewer's required
advanced interface set, and since there is currently no available way to classify OPC HDA server
functionality (or equivalently, compliance levels), the TrendWorX Viewer ActiveX has integrated
minimal OPC HDA server capability information, which will either modify its user interface or warn
the user if the third-party OPC HDA server does not support the required interfaces. However, the
TrendWorX Viewer ActiveX will not compensate for the lack of implementation of used OPC HDA
interfaces or methods by combining supported method calls to produce the same end result. The
following additional OPC HDA compliance development effort has been done:
•
Detection of Connection Point Support: The TrendWorX Viewer ActiveX supports
two methods of historical replay. In Auto Updating mode (default), mixed real time
and historical signals can be configured and updated in real time via asynchronous
methods calls. In History Only mode, only historical signals can be configured and
they are updated via user interface requests (or VBA automation) and no
asynchronous requests will be processed. If the OPC HDA server does not support
connection points, then the second historical replay mode should be used.
•
Detection of Max Returned Samples: If the OPC HDA server does not support return
of the number of historical samples configured in the TrendWorX Viewer ActiveX
based on data collection and the trend display period, a warning message will notify
the user to change the trend period settings.
•
Detection of OPC HDA Aggregates: Each historical pen can utilize a historical data
retrieval filter (called "aggregate"). The TrendWorX Viewer will retrieve the OPC
HDA server supported aggregates and allow editing of the historical pen to select
the desired aggregate. If the OPC HDA server does not support any aggregates,
the only historical data retrieval filter supported will be the Raw Data filter.
•
7.46
Detection of OPC HDA Server Annotation Support: The TrendWorX Viewer ActiveX
trend client will detect if OPC HDA servers support annotations, and it will modify its
user interface accordingly.
Introduction
In terms of historical replay and reporting, the following key changes have been made:
•
Data filter selection other than Raw will result in data time stamped at the beginning of each
subinterval.
•
When retrieving data using data filters other than Raw, subintervals for which there are no
data because of no data-logging activity will be marked as “empty” slots at the corresponding
time with an empty (VT_EMPTY) value. You can check the returned qualities for further
processing.
•
The historical qualities supported are as follows:
o
OPCHDA_EXTRADATA
More data may exist
0x0001
o
OPCHDA_INTERPOLATED
Interpolated data value
0x0002
o
OPCHDA_RAW
Raw data value
o
OPCHDA_CALCULATED
Calculated data value
o
OPCHDA_NOBOUND
No data found to provide upper or lower bound
0x0004
0x0008
0x0010
o
OPCHDA_NODATA
No data collected. Archiving not active
0x0020
o
OPCHDA_DATALOST
Calculation started/stopped/lost
0x0040
o
OPCHDA_CONVERSION
Scaling / conversion error
o
OPCHDA_PARTIAL
Aggregate value is for an incomplete interval
0x0080
0x0100
Critical Note: Because of the new compliance changes in historical replay and reporting, a version
7.x or later historical replay or reporting may not produce identical results to existing 6.1x version
reports and or historical replay screen captures for the same signals and time periods.
Two modes of historical replay are supported:
1. Mixed replay of signals
2. History only replay (in freeze mode)
Mixed Replay
In mixed replay, which is the default mode, you can connect real-time OPC signals, persistent
trending signals, and historical signals. All the signals will auto update, and the historical signals will
be refreshed with new historical data as they become available. You can control the frequency of
historical data updates by modifying the History Refresh Rate option in the Rates tab of the
Properties dialog box of the TrendWorX Viewer. This should be set close to the data-logging
frequency (i.e. the Log to Disk option in the TrendWorX Configurator).
History Only Replay
To configure the Viewer for History Only Replay, you must first check History Only in the Pens
tab of the Properties dialog box, as shown in the figure below, prior to making any signal
connections. In this mode, you can only connect to historical data. Once the Viewer is committed to
animation (runtime) mode, it will populate the screen with the historical data and automatically set
the Viewer into freeze mode. You can then retrieve historical data by scrolling back using the scroll
bar. In addition, for finer control over historical replay, you can double-click the time window or click
the Set Right Time button on the Trend Viewer toolbar to set the Viewer’s right historical time of
reference.
7.47
TrendWorX Viewer ActiveX
Historical Signal Connections
Adding historical pens. To add historical pens, click Tags Menu and select History Tags to open
the Unified Browser, which allows you to browse all of the installed historical servers locally or
remotely, as shown in the figure below.
Browsing for Historical Tags
If the TrendWorX Viewer is in runtime mode, click the Edit Pens button on the Trend Viewer
toolbar to open the Trend Pen Configuration dialog box for historical pens, as shown below.
7.48
Introduction
Configuring Historical Pens
Editing historical pens. To edit historical pens, select a pen and then click Edit in the Trend Pen
Configuration dialog box. This opens the Edit Trend Pen dialog box, as shown below. When
editing a historical pen, you can configure the averaging mechanism used in retrieving historical
data. You can always change this option within runtime mode, either through the user interface or
OLE Automation, to focus on various aspects of the historical replay.
Editing Historical Pens
Pen Filters
The various choices of the pen filter determine how historical data will be retrieved. For example, if
the Viewer is configured to replay data for one hour, with a data resolution of 1 min., the historical
data retrieval mechanism will divide one hour’s worth of data into bins of 1 min. each, and then it will
average the data according to the desired filter. If Filter is set to Average, it will compute the
average of all samples per bin to yield a single pen sample to be drawn on the screen. If Filter is set
to Last Sample, the last sample that falls within each bin will be plotted on the screen.
In addition to the standard data filters, the TrendWorX Viewer supports the Raw Data filter for
historical replay as follows:
1. Select the Raw Data filter for a historical pen.
7.49
TrendWorX Viewer ActiveX
2. Specify the Max. Samples to retrieve.
3. The upper value of the Max. Samples is taken from the following registry setting:
HKEY_LOCAL_MACHINE\SOFTWARE\Smar\TWXView\Data Properties\Max Pen Samples
As a result, the TrendWorX Viewer will ask the TrendWorX SQL Server to retrieve the Max.
Samples number of raw samples (no interpolated/extrapolated) from the historical data. If more data
exist for the time interval for which the data were requested, an X mark will appear at the ends of the
curve to indicate that not all samples were retrieved for the time interval of the request. This feature
does require some configuration in order to prevent usage of large amounts of memory. A typical
way to estimate the maximum number of samples data-logged for a period of time is to divide the
time period by the data-collection rate of the signal configured in the data logger. If no dead band is
configured, and the data-logged signal changes frequently, the result indicates an upper limit of
samples data-logged for that period.
In the case of bar plots, the historical replay results in a time-averaged sample across the
preconfigured trend period in configuration mode. That is, if the period is set to one hour, the bar plot
type will display the averaged sample over the last hour.
Ideal Pens
Any historical pen can be configured as an ideal pen, and there is no limitation on the number of
ideal pens per TrendWorX Viewer. As shown in the figure below, an Ideal Pen configuration tab is
automatically inserted in the Edit Trend Pen dialog box to allow you to select ideal pens and to set
their starting time and date. Upon entering animation mode, the TrendWorX Viewer will populate the
ideal pens with historical data starting at the selected time and date, while all other nonideal
historical pens will update with current data from the TrendWorX historical databases. To select a
desired date for the trend period you want to view, click the down arrow in the Date field, and then
choose a date from the calendar. This feature allows for powerful comparisons of past historical data
with current historical data for the same historical pen.
Ideal Pen Configuration
You can set (or reset) any historical pen as an ideal pen at any time during animation mode, and you
can modify its starting time and date. The Ideal Pen has time and date pick controls as well as an
interface to the historical operator comments and batch information. To use this feature:
1. Select a history pen from the Details window of the trend display.
2. Right-click to display the pop-up menu.
3. Select Edit to display the Edit Trend Pen dialog box.
7.50
Introduction
Alternatively, you can:
1. Click the Edit Pens button on the Trend Viewer toolbar to open the Trend Pen Configuration
dialog box.
2. Select a historical pen from the list.
3. Click Edit to display the Edit Trend Pen dialog box.
In the Select Comment/Batch (Lot) dialog box:
1. Select a start time and date. To select a desired date for the trend period you want to view, click
the down arrow in the Date field, and then choose a date from the calendar.
2. Select an end time and date.
3. Click Search to initiate the search.
4. Once the search is completed, use the << and >> buttons to scroll through multiple operator
comments and batch entries.
5. When you locate the desired one, click OK.
Note: Selecting the View Batch Only option filters out the historical operator comments so that only
the related batch (lot) entries are displayed.
Editing Historical Pens
During runtime mode, you can edit a historical pen and change the filter type to obtain a different
plot. For example, you can use Max to view the trend at its peaks. Note that the MaxTime and
MinTime options retrieve the actual maximum and minimum values within the resample interval, as
well as the actual time stamps at which these maximum and minimum values occurred.
Quality Status
The Viewer has integrated quality status support for both Historical Data Access and OPC Data
Access tags. If the Quality column is checked in the Details section of the Appearance tab of the
Properties dialog box, the Viewer will display quality status information for each sample in the
Details window of the trend display, as shown in the figure below.
Quality Status in the Details Window
In addition to the standard OPC Data Access qualities, the Viewer supports the Historical Data
Access quality specification to indicate time intervals where data logging stopped, actual (raw) data
samples, or calculated samples. During runtime mode, the Details window supports extended
functionality on a per-pen basis or a group of pens (if selected).
7.51
TrendWorX Viewer ActiveX
Details Window Menu
Options for Pens
As shown in the figure above, you can select single or multiple pens from the Details window. When
you right-click a pen, a pop-up menu opens, as shown in the figure above. The Options submenu
lists the following trend display options and actions for the selected pen:
Visible: Shows/hides the pen in the Details view of the Trend Viewer.
Samples: Retrieves historical data samples.
Pen marker: Shows/hides the pen marker in the Details view of the Trend Viewer.
Alarm lines: Shows/hides the dashed alarm lines at the Low, LowLow, High and HighHigh in the
Details view of the Trend Viewer.
Stair plot: Uses a stepwise draw method to plot the trend. This is ideal for plotting slowly changing
signals or setpoints.
Show range: Displays the range values for the pen in the Trend Viewer. In the old plot style, there
is a range scroll bar (available only in old plot style) that enables you to switch between ranges of
multiple pens. In stackable plots, you can simply click on the pen to switch ranges.
7.52
Introduction
Autoscale range: Disables the Low and High fields, and sets these limits automatically according
to the values for the pens. Autoscaling, if checked on the Ranges tab, adjusts the range if the actual
value is above or below the set limits. For example, if autoscaling is selected and the ranges are set
from 0 (Low) to 200 (High) and the actual value is 250, then the ranges will autoscale to 0 to 280.
The adjustment will be around 20 percent above the actual value.
Show comments: If historical pens are configured in the TrendWorX Viewer, selecting Show
Comments places the Viewer in freeze mode and retrieves all historical operator comments and
batch information available.
Insert comments: Displays the Comment(s) Entry dialog box for historical pens. This option is
available only in freeze mode.
Note that the same functionality is also available for real-time trending.
Time Shifting
One feature of historical replay is the time shifting of pens in freeze mode. This allows for direct
comparison of pens regardless of the time axis settings. To use time shifting, select the desired
pen(s) from the Details window. Then right-click and select Time Shift from the pop-up menu. This
opens the Set Pen(s) Time Shift dialog box, shown below.
Set Pen(s) Time Shift Dialog Box
You can then choose the interval and direction for the time shift. When you click OK, the selected
pens will be redrawn to display refreshed historical or real-time data. The time shift operation can be
undone at any time by clicking Undo Time Shift.
Graphical time shifting. There is also a graphical interface for performing time shifting. Again, you
need to select the desired pen(s) from the Details window. To perform graphical time shifting, press
the CTRL key and move the mouse within the trend display area while pressing the left mouse
button. The time shifting cursor appears, and you can shift backward or forward in time based on
which direction you move the mouse.
7.53
TrendWorX Viewer ActiveX
Graphical Time Shifting
Formatting Pens
If you do not select any pens but still right-click inside the Details window, the formatting options
appear in the pop-up menu, as shown in the figure below. You can elect to restore the default
settings for the pens.
Pen Formatting
7.54
Introduction
Operator Comments
As an operator, you can insert historical comments (operator comments) into any historical pen or
group of pens. To perform this task, do the following:
1. Move the cursor to where you want the comment to be inserted.
2. Select a historical pen in the Details window.
3. Right-click to open the pop-up menu.
4. From the Options submenu, select Insert Comment. This opens the Comment(s) Entry dialog
box, shown below.
5. Type in a comment (it can be multiline).
6. Type in a name for the operator entering the comment (by default is the currently logged-in user).
7. Select Insert As Group Comment, if desired, to enter the comment for all the historical tags that
belong to the same TrendWorX Configurator logging group as the currently selected historical
pen.
8. Click OK.
Note: Historical comments are integrated into the ProcessView Security Server. When the operator
opens the Comment(s) Entry dialog box, the Viewer ActiveX will get the currently logged-in user(s)
within the Security Server. If users are logged in, the Viewer ActiveX will set the author of the
comment to be the logged-in user(s), and it will not allow the operator to modify the author field. If
there are no logged-in users, the Comment(s) Entry dialog box will use the current Windows user
and Node name, and it will allow the operator to modify the comment author field.
Comment(s) Entry Dialog Box
If the Show Comments option is enabled for the historical pen, the inserted comment will be visible
on the screen, as shown below.
7.55
TrendWorX Viewer ActiveX
Operator Comments in the Trend Display
Editing Pens During Runtime Mode
To edit a pen during runtime mode, right-click on the pen in the Trend Viewer and select from the
following pop-up menu items, as shown in the figure below:
Options: Specifies various options and actions for viewing the selected pen during runtime mode.
Formatting: Restores the default settings for the pen during runtime mode.
Edit: Opens the Edit Trend Pen dialog box.
Stack Plot: Displays multiple pens in a trend display in separate, stacked plots.
Time Shift: Sets the interval and direction for the time shift.
Delete: Removes the pen from the Trend Viewer.
Editing Pens During Runtime Mode
Pen Options During Runtime Mode
To view the options for pens during runtime mode, right-click the desired pen(s) in the Details
window and select Options from the pop-up menu, as shown in the figure below.
7.56
Introduction
Setting Pen Options in Runtime Mode
The Options submenu lists the following trend display options and actions for the selected pen:
•
Visible: Shows/hides the pen in the Details view of the Trend Viewer.
Samples: Retrieves historical data samples.
Pen marker: Shows/hides the pen marker in the Details view of the Trend Viewer.
•
Alarm lines: Shows/hides the dashed alarm lines at the Low, LowLow, High and
HighHigh in the Details view of the Trend Viewer.
•
Stair plot: Uses a stepwise draw method to plot the trend. This is ideal for plotting
slowly changing signals or setpoints.
•
Show range: Displays the range values for the pen in the Trend Viewer. In the old
plot style, there is a range scroll bar (available only in old plot style) that enables
you to switch between ranges of multiple pens. In stackable plots, you can simply
click on the pen to switch ranges.
•
Autoscale range: Disables the Low and High fields, and sets these limits
automatically according to the values for the pens. Autoscaling, if checked on the
Ranges tab, adjusts the range if the actual value is above or below the set limits.
For example, if autoscaling is selected and the ranges are set from 0 (Low) to 200
(High) and the actual value is 250, then the ranges will autoscale to 0 to 280. The
adjustment will be around 20 percent above the actual value.
•
Show comments: If historical pens are configured in the TrendWorX Viewer,
selecting Show Comments places the Viewer in freeze mode and retrieves all
historical operator comments and batch information available.
•
Insert comments: Displays the Comment(s) Entry dialog box for historical pens. This
option is available only in freeze mode.
Note: The same functionality is available for real-time and historical trending.
Formatting Pens During Runtime Mode
To restore the default settings for a pen during runtime mode, right-click the desired pen(s) in the
Details window and select Formatting from the pop-up menu, as shown in the figure below. Choose
from the following:
•
Set As Default Pen Order: Restores the default order (arrangement) of the pen in the
Details window during runtime mode.
7.57
TrendWorX Viewer ActiveX
•
Set As Default Spacing: Restores the default spacing parameters format for the pen
in the Details window during runtime mode.
Note: The TrendWorX Viewer ActiveX supports reordering of pens in configuration mode. In the
Pens tab, select the trend pen(s) you would like to reposition, as shown in the figure below. The
Spacing button in the Details section of the Appearance tab in the Properties dialog box allows
you to configure a default format for the Details window to be recalled during runtime mode.
Formatting Pens During Runtime Mode
Stacking Trend Plots During Runtime Mode
If you have multiple pens displayed in a trend plot display, normally the two pens overlap each other
inside the same plot. Now you can display multiple pens in a trend display in separate, stacked
plots. To stack a plot, right-click the desired pen in the Details window and select Stack Plot >
Insert New Plot from the pop-up menu, as shown in the figure below.
Note: Stacked plots are supported only in the new plot style. If you are viewing stacked plots (time
plots), switch to a different type of plot (e.g. an XY plot), and then revert to the time plots, the time
plots will no longer be stacked.
Stacking Trend Plots During Runtime Mode
The pens are stacked vertically, displaying the pens in two separate plots, as shown in the figure
below.
7.58
Introduction
Stacked Trend Plots
Switching Pen Ranges in Stacked Plots
If you have multiple pens displayed in a single stacked plot, the ranges for only one of the pens will
be displayed in the stacked plot. To switch to the ranges view for a different pen in the same stacked
plot, simply click on the pen name in the Details window.
Combining Pens in a Stacked Plot
To combine or aggregate pens into a single stack plot, right-click a pen in the Details window and
select Stack Plot > [pen name] from the pop-up menu, as shown in the figure below. The selected
pen will be combined into a single stack plot with the pen name you selected.
Note: You can also combine pens into stacked plots by dragging and dropping pens into the trend
plots.
7.59
TrendWorX Viewer ActiveX
Combining Pens in a Stacked Plot
Time Shifting Pens During Runtime Mode
One feature of historical replay is the time shifting of pens in freeze mode. This allows for direct
comparison of pens regardless of the time axis settings. To enable time shifting:
Right-click the desired pen(s) in the Details window and select Time Shift from the pop-up menu,
as shown in the figure below.
Time Shifting Pens During Runtime Mode
7.60
Introduction
This opens the Set Pen(s) Time Shift dialog box, as shown below. Choose the interval and
direction for the time shift. When you click OK, the selected pens will be redrawn to display
refreshed historical or real-time data. The time shift operation can be undone at any time by clicking
Undo Time Shift.
Setting the Time Shift Parameters for Pens
You can then choose the interval and direction for the time shift. When you click OK, the selected
pens will be redrawn to display refreshed historical or real-time data. The time shift operation can be
undone at any time by clicking Undo Time Shift.
Graphical Time Shifting
There is also a graphical interface for performing time shifting. Again, you need to select the desired
pen(s) from the Details window. To perform graphical time shifting, press the CTRL key and move
the mouse within the trend display area while pressing the left mouse button. The time shifting
cursor appears, and you can shift backward or forward in time based on which direction you move
the mouse.
Graphical Time Shifting
7.61
TrendWorX Viewer ActiveX
OLE Automation
This section describes the OLE Automation interfaces for the TrendWorX Viewer.
Interfaces
Each ActiveX exposes a set of objects, which are used to configure and automate the control. Each
object categorizes an area of functionality. The following objects are exposed by the TrendWorX
Viewer ActiveX:
7.62
•
IOTitle
•
IORanges
•
IOTimeSettings
•
IODetails
•
IOPen
•
IOGrids
Introduction
Properties and Methods for the TrendWorX Viewer ActiveX
The following properties and methods are categorized by the object in which they exist.
Viewer: Properties
boolean AutoStartRuntime
boolean ShowTitle
boolean ShowRanges
boolean ShowDetails
BSTR PlotType
BSTR BorderEdge
BSTR BorderOptions
OLE_COLOR DispColor
OLE_COLOR BackColor
LPFONTDISP TimeFont
LPFONTDISP DetailsFon
LPFONTDISP MainFont
boolean ShowTimeInfo
boolean MainToolbar
boolean FreezeMode
short NumberOfPens
LPFONTDISP RangesFont
BSTR FileName
boolean URLPathUsed
BSTR URLPathName
BSTR StatisticsFile
boolean StatFileAppend
boolean GlobalRanges
boolean ShiftGrids
double StartUp
short CursorStep
LPDISPATCH Title
LPDISPATCH Details
LPDISPATCH Ranges
LPDISPATCH TimeSettings
LPDISPATCH XGrids
Toggles the runtime mode when the container application
switches from design mode to active mode.
Default: TRUE
Determines whether the main title is displayed.
Default: FALSE
Determines whether the ranges field is displayed.
Default: TRUE
Determines whether the details field is displayed.
Default: TRUE
Determines plot type.
Values are: time plot, XY plot, logarithmic plot, strip chart,
bar plot, and circular chart.
Default: time plot
Determines trend border area settings.
Values are: sunken, raised, etched, and bumped.
Default: Sunken
Determines trend border area options.
Values are: rectangle, left, bottom, right, top, top left, top
right, bottom left, and bottom right.
Default: Rectangle
Determines trend curve area color.
Determines background color.
Dispatches interface to the time field font.
Dispatches interface to the detail field font.
Dispatches interface to the main (title) font.
Determines if the time field is displayed. Default: TRUE
Enables/disables Trend Viewer toolbar.
Default: TRUE
Enables/disables freeze mode.
Returns number of currently configured pens.
Dispatch interface to the range field font.
Gets/sets file name for saving configuration data.
"Set" is not supported while in runtime mode.
Enables/disables use of URL path for asynchronous
downloads.
Default: FALSE
Gets/sets URL path name.
Gets/sets the .csv/.txt file used for statistical information
storage.
"Set" is not supported while in runtime mode.
Enables/disables append mode for statistical file.
Default: FALSE
Enables/disables the use of global ranges.
Not supported in runtime (animation) mode.
Default: FALSE
Enables/disables the shifting of grids during runtime
Not supported in runtime (animation) mode.
Default: TRUE
Gets/sets initial offset for plotting of curves.
Default: 0
Gets/sets the cursor step for stepping in freeze mode.
Default: 10
Dispatch interface to Title object.
Dispatch interface to Details object.
Dispatch interface to ranges object.
Dispatch interface to Time Settings object.
Dispatch interface to X Grids object.
7.63
TrendWorX Viewer ActiveX
LPDISPATCH YGrids
boolean RestoreRanges
long LanguageID
boolean FillBackColor
long ScrollBarRange
boolean FullChartReset
long ReadyState
short Appearance
short BorderStyle
OLE_COLOR ForeColor
boolean UseLocalSettings
BOOL PrintBkg
BOOL OldPlotStyle
BOOL ShowBackgnd
Dispatch interface to Y Grids object.
Enables/disables restoring of ranges modified during
runtime.
Not supported in runtime (animation) mode
Default: FALSE
Gets/sets the Language ID for loading a multilingual
resource .dll.
Enables/disables the color fill of trend display areas.
This should be used prior to and after printing (within the
container) to conserve color ink on the printer.
Sets the range of the scrollbar (in seconds).
Default: 10,800 seconds (3 hours)
Resets Circular Chart after a full trend period elapses.
"Set" is not supported while in runtime mode.
Default: FALSE
Signals controls state changes in loading configuration data.
Used for asynchronous download of configuration data
Determines TrendWorX Viewer ActiveX appearance (3D
edge or not).
Default: TRUE
Determines TrendWorX Viewer ActiveX appearance (border
or not).
Default: TRUE
Determines title color and main display text color.
Sets the Local Settings support.
If the TrendWorX Viewer is configured to save its
configuration into a .v32 file, independently of the container,
you will have the option in runtime mode to save current
settings into the preconfigured file. In the case of a Web
HMI application, this will also be the configuration file to be
loaded whenever the HTML page is refreshed.
Default: FALSE
Toggles the background printing.
Toggles the old plot style.
Toggles the background image.
Viewer: Methods
Adds a real-time pen, which can be an OPC data
tag, expression tag, and internal simulation point.
For OPC data tags, the "PenName" has to match
boolean AddRealTimePen(BSTRPenName)
exactly the string that the Tag Browser would
produce for the same tag.
Used in XY plots to select a pen for x-axis.
The "PenName" here represents the description text
boolean SetXAxis (BSTR PenName)
for the desired pen, as it would appear in the Details
window.
Returns a variant string array of all pen description
VARIANT GetPenNames()
text as it appears in the Details window of the
Viewer ActiveX.
Enters runtime (Animate) mode.
boolean EnterAnimate()
Exits runtime (Animate) mode.
boolean ExitAnimate()
Returns TRUE if the Viewer is currently in animation
boolean GetAnimateMode()
mode. Otherwise it returns FALSE.
Deletes the pen that has "PenName" as its
boolean DeletePen (BSTR PenName, BSTR
description text. Valid types are: real time, history,
PenType)
and custom.
Sets the point name for high range of the pen with
void SetPenHiRangeString (BSTR PenName,
description text matching "PenName."
BSTR RangeString, BSTR PenType)
Not supported for historical pens
Sets the point name for low range of the pen with
void SetPenLoRangeString (BSTR PenName,
description text matching "PenName."
BSTR RangeString, BSTR PenType)
Not supported for historical pens
7.64
Introduction
Returns dispatch interface of the pen with
description text matching "PenName."
You must release the interface when done. Valid
types are: real time, history, and custom.
Populates details information from the pen with
boolean SetDetailsFromPen (BSTR
description text matching "PenName."
PenName, BSTR PenType)
Valid types are: real time, history, and custom.
Computes and stores statistical info for the pens
configured in the Viewer ActiveX.
boolean ComputeStat()
Supported only in runtime (animation) mode.
Sets point name for high range of range object.
void SetHiRangeString (BSTR RangeString )
Not supported in history-only mode.
Sets point name for low range of range object.
void SetLowRangeString (BSTR RangeString )
Not supported in history-only mode.
Use to replace pen point names and pen
descriptions if desired ("DoPenText" set to TRUE).
"PointName" is the actual (existing) point name.
boolean ReplacePoint(BSTR PointName,
"OldString" is a substring of the "PointName."
BSTR OldString, BSTR NewString, boolean
"NewString" is its substitute string, and if
DoPenText)
"DoPenText" is set to TRUE, the corresponding pen
description text will be replaced as well.
Not supported in runtime (animation) mode.
Use to feed custom data for an assigned pen.
void SetPointValue(BSTR PointName, double "PointName" is the full point name by which the pen
connection was made.
PointValue, DATE PointTDate)
Supported only in runtime (animation) mode.
Changes the trend period into the desired
"NewPeriod," given in seconds.
void ChangeWinPeriod (long NewPeriod)
Not supported for bar plots and XY plots.
boolean SetTrendRightTDate (DATE
In freeze mode, sets the trend’s right time and date.
RightTDate)
Adds a real-time pen from Persistent Trending,
which can be an OPC data tag, expression tag, and
internal simulation point.
For OPC data tags, the "PenName" has to match
boolean AddRealTimeBgPen(BSTR
exactly the string that the Tag Browser would
PenName, BSTR TWXBgGroupName)
produce for the same tag.
"TWXBgGroupName" is the name of the configured
Persistent Group.
Deletes all pens from the TrendWorX Viewer
void DeleteAllPens ()
ActiveX.
Adds a custom pen for displaying custom data.
You are responsible for supplying data to be
boolean AddCustomPen (BSTR PenName)
displayed by the pen, using the "SetPenValues"
method.
Fills a custom pen with user data. "PenName" is the
description text of the pen, as it appears in the
Details window.
Boolean SetPenValues (BSTR PenName,
"PenValues" is an array of doubles.
VARIANT* PenValues, VARIANT*
"PenTDates" is an array of date values
PenTDates, VARIANT* PenMSecs,
corresponding to the "PenValues."
VARIANT* PenQuality)
"PenMSecs" is an array of milliseconds subdivisions
corresponding to the "PenTDates" values.
"PenQuality" is an array of OPC-defined qualities.
Returns the Viewer ActiveX "right" time and date.
DATE GetRightTime()
Supported only in runtime (animation) mode.
Toggles history-only mode of the Viewer ActiveX.
boolean SetHistTrendMode(Boolean Mode)
Supported only in configuration mode.
Retrieves the status of history replay mode of the
boolean GetHistTrendMode()
Viewer ActiveX.
Adds a history pen to the Viewer ActiveX.
The "PenName" string should be the same as the
boolean AddHistoryPen(BSTR PenName)
one produced by the Tag Browser when browsing
historical servers.
Forces an update of all historical signals. Typically
boolean UpdateHistoryPens()
7.65
LPDISPATCH GetPen (BSTR PenName,
BSTR PenType)
TrendWorX Viewer ActiveX
boolean SetPenFilter(BSTR PenName, short
PenFilter)
void RefreshDetails()
void ShowStat()
boolean DoZoom(short nPercent, boolean
bYaxis, boolean bXaxis)
boolean LoadSaveFile(BSTR FileName,
short Load)
void SetFirstUpdateMode(boolean bMode)
long GetPenCount()
LPDISPATCH GetPenByIndex(long
PenIndex)
boolean ShowPenInRanges(long
PenIndex)
long AddRealTimePen2(BSTR PenName)
long AddHistoryPen2(BSTR PenName)
long AddRealTimeBgPen2(BSTR
PenName, BSTR TWXBgGroupName)
long AddCustomPen2 (BSTR PenName)
7.66
this would be called after setting the Viewer’s right
reference time.
Supported only in freeze mode
Sets the data filter type for a pen with description
text matching "PenName."
Used for historical pens.
Valid "PenFilter" types are:
OHDA_RAW
=0
OHDA_AVG
=1
OHDA_MIN
=2
OHDA_MAX
=3
OHDA_STDEV= 4
OHDA_LAST
=5
OHDA_MINTIME = 6
OHDA_MAXTIME = 7
Forces a refresh of the Details window. Since each
pen is an individual object, any change in the pen’s
properties through OLE Automation may not be
directly updated in the Details window. Using this
ensures that all pen property changes will be
reflected properly in the Details window.
It is supported only in runtime (animate) mode
Shows the statistical window of the Viewer.
Supported only in runtime (animation) mode.
Zoom in on the Viewer. If both "bYAxis" and
"bXAxis" are set, then the zoom action will be
applied to both axes. For an ordinary time plot, this
means both range and time zooming. The
"nPercent" parameter controls the zoom factor. If set
to 0 (zero), it zooms out of the Viewer.
Supported only in freeze mode.
Loads or saves a Viewer ActiveX configuration file.
If "bMode" is TRUE, in freeze mode the Viewer
ActiveX will not update historical pens upon
connection. You will have to call the
"UpdateHistoryPens" method.
Returns the number of configured pens.
Returns the pen object, where "PenIndex" is the
order of the pen as it appears in the Details window.
Fills in the ranges display with the ranges of the pen,
where "PenIndex" is the order of the pen as it
appears in the Details window.
Not supported if Global Ranges option is enabled.
Adds a real-time pen, which can be an OPC data
tag, expression tag, and internal simulation point.
For OPC data tags, the "PenName" has to match
exactly the string that the Tag Browser would
produce for the same tag. It returns the index of the
pen added.
Adds a history pen to the Viewer ActiveX.
The "PenName" string should be the same as the
one produced by the Tag Browser when browsing
historical servers. It returns the index of the pen
added.
Adds a real-time pen from Persistent Trending,
which can be an OPC data tag, expression tag, and
internal simulation point. For OPC data tags, the
"PenName" has to match exactly the string that the
Tag Browser would produce for the same tag.
"TWXBgGroupName" is the name of the configured
Persistent Group. It returns the index of the pen
added.
Adds a custom pen for displaying custom data. It
returns the index of the pen added.
Introduction
Sets the time shift for the pen with index "PenIndex"
by "TimeShift" seconds.
Not supported for XY plots.
Supported only in freeze mode.
Returns the time shift for the pen with index
"PenIndex" in seconds.
long GetPenTimeShift(long PenIndex)
Not supported for XY plots.
Supported only in freeze mode.
Refreshes the ideal pen, with index "PenIndex," with
boolean RefreshIdealPen(long PenIndex)
new historical data based on its ideal pen settings.
Deletes the pen with index "PenIndex."
boolean DeletePen2(long PenIndex)
Sets the data filter type for a pen with index
"PenIndex."
Used for historical pens.
Valid "PenFilter" types are:
OHDA_RAW
=0
OHDA_AVG
=1
boolean SetPenFilter2(long PenIndex, short
OHDA_MIN
=2
PenFilter)
OHDA_MAX
=3
OHDA_STDEV= 4
OHDA_LAST
=5
OHDA_MINTIME = 6
OHDA_MAXTIME = 7
Toggles Trend Viewer toolbar if enabled.
void ToggleMainToolbar()
Supported only in runtime (animation) mode.
Toggles Trend Viewer toolbar if enabled and
void ToggleMainToolbar2(long top, long
positions it at the top, left coordinates.
left)
Supported only in runtime (animation) mode.
Displays the Viewer's About Box.
void AboutBox().
Standard refresh method. Call after visual
void Refresh()
modifications.
Prints the TrendWorX Viewer display.
If "bShowPrinterDlg" is set to TRUE, the Windows
boolean PrintTrend(boolean
Print dialog box will be evoked. Otherwise, the
bShowPrinterDlg)
default Windows printer will be used.
Sets the ink saving mode during printouts. If TRUE,
boolean SetInkSaveMode(boolean bMode) during the printing process all of the Viewer
background area colors will be ignored to save ink.
Returns the current status of the ink-saving mode.
boolean GetInkSaveMode()
Resets a pen's Totalizer function support. The
boolean ResetPenTotalizer(long PenIndex)
"PenIndex" is the order of the pen.
Sets the UTC historical replay mode.
Supported only for a history chart Viewer.
void SetUTCReplayMode(boolean bMode)
If TRUE, all curves are drawn using UTC time
stamping.
Returns TRUE if the Viewer is replaying historical
boolean GetUTCReplayMode()
data in UTC mode.
boolean GetSampleInfo(long PenIndex,
VARIANT* SampleValue, DATE*
Returns sample information for the current location
SampleTDate, VARIANT* SampleMSecs,
of the cursor in freeze mode or zoom mode for the
VARIANT* SampleQual, VARIANT*
pen with index "PenIndex."
SampleHDAQual, VARIANT*
HistoricalSample)
boolean GetSampleInfo2(long PenIndex,
VARIANT* SampleValue, VARIANT*
Returns sample information for the current location
SampleTDate, VARIANT* SampleMSecs,
of the cursor in freeze mode or zoom mode for the
pen with index "PenIndex.".
VARIANT* SampleQual, VARIANT*
It returns the date as variant
SampleHDAQual, VARIANT*
HistoricalSample);
boolean SetPenTimeShift(long PenIndex,
long TimeShift)
void SetCircularPrintMode(boolean
bAutoPrint)
Sets the automatic print mode of circular charts upon a
full trend period reset. If "bAutoPrint" is set to TRUE,
the Viewer will print trend display upon full chart reset.
boolean GetCircularPrintMode()
Returns the current automatic print mode of circular
charts.
7.67
TrendWorX Viewer ActiveX
void MoveCursorForward()
void MoveCursorBackwards()
boolean MoveCursorToTime(DATE
timeDate)
long ChangeTrendDataRate(long
trendDataRate)
boolean GetPenValues(BSTR PenName,
VARIANT* PenValues, VARIANT*
PenTDates, VARIANT* PenMSecs,
VARIANT* PenQuality)
In freeze mode, moves the cursor one step forward
in time.
In freeze mode, moves the cursor one step
backward in time.
In freeze mode, moves the cursor to a particular
position on the time axis.
Changes Viewer data-collection rate in animation
(runtime) mode.
"TrendDataRate" is the desired data-collection rate
in milliseconds.
Returns in variant arrays the current samples in
memory buffers of the pen with point name (or
description) "PenName."
Sets the historical comment and batch information
mode of a historical pen with index "PenIndex."
If "Mode" is TRUE, it enables the display of historical
comments.
Retrieves the associated (if any) historical operator
boolean GetPenComments(long PenIndex, comments and batch information with the pen having
VARIANT* SourceTDates, VARIANT*
index "PenIndex."
Returns variant arrays with all the information,
SourceMsec, VARIANT* Notes, VARIANT*
including authors.
NoteTDates, VARIANT* NoteMSecs,
Supported only in animation runtime mode and for a
VARIANT* Authors)
history pen.
Inserts a historical comment for the historical pen
boolean InsertPenComment(long
with index "PenIndex." If "GroupComment" is set to
PenIndex, DATE CommentTDate, BSTR
TRUE, the inserted comment will be visible by all
Author, boolean GroupComment, BSTR
historical signals of the same data-logging group as
CommentText)
the historical pen.
Toggles in animation (runtime) mode and batch
information. If used, the Viewer will be placed in
freeze mode, and all historical comments as well as
boolean ShowComments()
batch information for the historical pens will be
retrieved.
The
TrendWorX Viewer ActiveX allows the
void SetPenLoAlarmString(BSTR
connection of OPC Data Access tags to its alarm
PenName, BSTR AlarmString, BSTR
limits. The OPC-enabled alarm limits will hold the
PenType)
most current value of the alarm limits. The alarm
void SetPenLoLoAlarmString(BSTR
limits can be a constant value, an OPC Data Access
PenName, BSTR AlarmString, BSTR
tag, or an expression. In addition, the alarm limits
PenType)
are interfaced to the Global Alias and Language
void SetPenHiAlarmString(BSTR PenName,
Alias servers. This functionality is not available in
BSTR AlarmString, BSTR PenType)
History Trend mode due to the nature of this specific
void SetPenHiHiAlarmString(BSTR
historical replay mode. These OLE automation
PenName, BSTR AlarmString, BSTR
methods have been added to support this
PenType)
functionality.
void SetPenComments(long PenIndex,
boolean Mode)
ProjectWorX Support
Several OLE Automation methods have been added to facilitate ProjectWorX deployment and
WebHMI enhanced support:
1. ReplaceStringInString(
StringToReplace as String,
OldSubstring as String,
NewSubstring as String
) as String
2. ReplaceHost(
OldHostName as String,
NewHostName as String
7.68
Introduction
) as Long
3. ReplaceFilePath(
OldSubstring as String,
NewSubstring as String
) as Long
4. ReplaceTag(
OldSubstring as String,
NewSubstring as String
) as Long
5. ReplaceHostEx(
OldHostNameSubstring as String,
NewHostNameSubstring as String
MatchCase as Boolean,
MatchWholeWord as Boolean
) as Long
The ReplaceHostEx with parameters MatchCase=False & MatchWholeWord=True works
exactly the same as the ReplaceHost() function.
Events Fired
ReadyStateChange
InAnimateMode
UnableToCreateThread
OutOfAnimateMode
DatabaseChanged
ErrorInLoadingData
RightTimeChanged
void CursorChangedPos()
Fired when the Viewer has finished initializing
its state.
Fired when the Viewer has entered
automation mode.
Fired when the Viewer cannot create a
background trend upon entering animation
mode.
Fired when the Viewer exits automation
mode.
Fired when there are configuration changes,
such as adding or deleting a pen.
Fired when the Viewer encounters errors
upon loading its configuration data through a
.v32 file.
Fired when the "right" reference time of the
Viewer changed while in freeze mode.
Fired in freeze mode as the cursor changes
position. You can call the "GetSampleInfo"
method to retrieve detailed sample
information on a per-pen basis.
7.69
TrendWorX Viewer ActiveX
Properties and Methods for Supporting Objects
Title Objects
Time Settings Objects
Ranges Objects
Pen Objects
Details Objects
Grids Objects
Title Objects
Title Objects: Properties
Title Objects: Methods
Using Visual Basic To View Title Objects
Title Objects: Properties
boolean ShowTitle
Determines whether the main title is displayed.
Default: TRUE
BSTR TitleText
The main title of the Viewer ActiveX.
Title Objects: Methods
None
Time Settings Objects
Time Settings Objects: Properties
Time Settings Objects: Methods
Using Visual Basic To View Time Settings Objects
Time Settings Objects: Properties
boolean ShowDate
Determines whether date information is displayed in the Viewer's
time field.
Default: TRUE
boolean ShowMSecs
boolean ShowTimeInfo
Shows milliseconds divisions on time axis.
Default: FALSE
Determines whether the time field is displayed.
Default: TRUE
Visual appearance of time display.
BSTR BorderEdge
Values are: sunken, raised, etched, and bumped.
Default: Sunken
Visual appearance options of time display.
BSTR BorderOptions
Values are: rectangle, left, bottom, right, top, top left, top right,
bottom left, and bottom right.
Default: Rectangle
BSTR DateFormat
BSTR Size
long DataUpdatePeriod
long DataTotalPeriod
long Samples
7.70
Not used in the current version.
Size for time display. It can be large, normal, or small.
Default: Normal
This is the data-collection rate in milliseconds.
"Set" is not supported in runtime (animation) mode.
This is the trend period in seconds.
"Set" is not supported in runtime (animation) mode.
This is the number of samples per pen.
Introduction
"Set" is not supported in runtime (animation) mode.
long DataDisplayMult
Gets/sets drawing intervals relative to data collection.
OLE_COLOR FillColor
Color for filling time area.
OLE_COLOR TextColor
Color for text displayed.
long
HistoryRefreshRate
Gets/sets the history refresh rate for which historical pens will be
refreshed, regardless of the data-collection rate. Ideally, it should
be configured to be as close as possible to the logging-to-disk
interval set in the TrendWorX Configurator.
short TimeStampGap
Gets/sets the time stamp gap.
short MinorTick
Gets/sets the number of minor ticks in the time area.
Time Settings Objects: Methods
None
Ranges Objects
Ranges Objects: Properties
Ranges Objects: Methods
Using Visual Basic To View Ranges Objects
Ranges Objects: Properties
boolean OverHighRange
Gets/sets override for high range. If set TRUE, the highrange value will be computed from a tag or expression.
boolean OverLowRange
Gets/sets override for low range. If set TRUE, the low-range
value will be computed from a tag or expression.
Short VisiblePens
Gets/sets the number of visible pen ranges on the ranges
display area (if the Global Ranges option is not selected).
boolean ShowRanges
Determines whether the range field is displayed.
Default: TRUE
Visual appearance of range display.
BSTR BorderEdge
Values are: sunken, raised, etched, and bumped.
Default: Sunken
Visual appearance options of range display.
BSTR BorderOptions
Values are: rectangle, left, bottom, right, top, top left, top
right, bottom left, and bottom right.
Default: Rectangle
BSTR NumberFormat
Gets/sets number format for range values.
BSTR Position
Gets/sets position of range display. It can be right or left.
BSTR XNumberFormat
Gets/sets number format for x-axis range values in XY
plots.
double XHigh
Gets/sets high-range value for x-axis in XY plots.
double XLow
Gets/sets low-range value for x-axis in XY plots.
double High
Gets/sets high-range value.
double Low
Gets/sets low-range value.
OLE_COLOR FillColor
Gets/sets fill color of range display.
OLE_COLOR TextColor
Gets/sets text color of range display.
BSTR Size
short MinorTick
Size for time display. It can be large, normal, or small.
Default: Normal
Gets/sets the number of minor ticks in the range area.
7.71
TrendWorX Viewer ActiveX
Ranges Objects: Methods
None
Pen Objects
Pen Objects: Properties
Pen Objects: Methods
Using Visual Basic To View Pen Objects
Pen Objects: Properties
boolean Autoscale
Autoscales the pen.
boolean EnableAlarmLines
Enables drawing of alarm lines.
boolean OverHighRange
Gets/sets override for high range. If set TRUE, the highrange value will be computed from a tag or expression.
boolean OverLowRange
Gets/sets override for low range. If set TRUE, the lowrange value will be computed from a tag or expression.
boolean PenVisible
Determines whether a pen is to be drawn.
boolean PenXAxis
Gets/sets a pen x-axis in XY-plots.
boolean ShowMarkers
If TRUE, a triangular marker is displayed at the position
of the last known sample value.
boolean ShowSamples
Indicates real samples.
boolean Stairplot
Enables step-wise plotting mode.
boolean UpdateServerRanges
Controls the initial update of the ranges from the server.
BSTR DetailsFormat
The format type for the details.
BSTR PenPointName
The pen signal point name.
BSTR PenStyle
Gets/sets the pen style, (e.g. solid, dotted, dashed).
BSTR PenText
Pen description.
BSTR PenUnits
Pen engineering units.
BSTR RangeFormat
The format type for showing ranges.
BSTR TWXBgGroupName
The Persistent Trend group name.
double AlarmHigh
High alarm value for pen.
double AlarmHiHi
High-high alarm value for pen.
double AlarmLoLo
Low-low alarm value for pen.
double AlarmLow
Low alarm value for pen.
double HighLimit
High limit value.
double LowLimit
Low limit value.
long NumberOfSamples
Gets number of samples for the pen.
OLE_COLOR DetailColor
The fill color to be used in the Details window.
OLE_COLOR PenColor
Gets/sets the color associated with the pen.
OLE_COLOR RangeColor
The fill color to be used in the range window.
OLE_COLOR RangeTextColor
The color to be used for text in the range window.
short HistoryFilter
Returns the filter type for the historical data.
short PenWidth
BSTR PenType
The width of the pen in logical units.
Default: 1
Returns the type of the pen, such as real-time, history,
and custom.
Read only property.
7.72
Introduction
Returns the history filter for the pen.
Possible values are:
Raw = 0
Average = 1
short HistoryFilter
Minimum = 2
Maximum = 3
Standard deviation = 4
Last sample = 5
Minimum with actual time = 6
Maximum with actual time = 7
double AutoResetLevel
Gets/sets the autoreset value for a pen in configuration
mode, if the totalizer mode is enabled.
double PreLoadValue
Gets/sets the preload value for a pen in configuration
mode, if the totalizer mode is enabled.
double PresetValue
Gets/sets the preset value for a pen in configuration
mode, if the totalizer mode is enabled.
Gets/sets the Integration factor value for a pen in
configuration mode, if the totalizer mode is enabled.
Possible values are:
double IntegrationFactor
1.0 (integration constant computed in seconds)
60.0 (integration constant computed in minutes)
3660.0 (integration constant computed in hours)
86400.0 (integration constant computed in days)
Gets/sets the integration direction value for a pen in
configuration mode, if the totalizer mode is enabled.
long IntegrationDir
Possible values are:
0 (Totalizer counts upward from 0.)
1 (Totalizer counts downward to 0.)
Gets/sets the totalizer mode value for a pen in
configuration mode if the totalizer mode is enabled.
Possible values are:
long TotalizerMode
0 (continuous mode)
1 (preload mode)
2 (preset)
boolean EnableTotalizer
Enables/disables the totalizer mode for a pen in
configuration mode.
Gets/sets the totalizer plotter mark size for the pen's
curve, if the totalizer mode is enabled.
Possible values are:
No marker = 0
long PlotterMark
Tiny = 1
Small = 2
Medium = 3
Big = 4
Huge = 5
long TotalizerUnits
Gets/sets the totalizer units value for a pen in
configuration mode, if the totalizer mode is enabled.
Possible values are:
7.73
TrendWorX Viewer ActiveX
0 (integration factor computed in seconds; units are
seconds)
1 (integration factor computed in minutes; units are
minutes)
2 (integration factor computed in hours; units are hours)
3 (integration factor computed in days; units are days)
boolean IdealPenMode
Gets/sets the ideal pen mode for a historical pen.
boolean AutoTimeSync
Gets/sets the autosync mode for a real time pen.
Pen Objects: Methods
boolean GetPenStat(double*
Max, double* Min, double* Avg,
double* StdDev, long*
NumSamples)
Returns the associated statistical values for the pen
using the visible samples at the current state of the pen.
boolean IsHistoryPen()
Returns TRUE if the pen is historical.
boolean SetIdealDate(DATE
Date)
Sets the ideal date for a historical ideal pen. This is the
reference starting time of the ideal pen.
DATE GetIdealDate()
Sets the Ideal date for a historical ideal pen. This is the
reference starting time of the ideal pen.
Details Objects
Details Objects: Properties
Details Objects: Methods
Using Visual Basic To View Details Objects
Details Objects: Properties
boolean ShowDetails
boolean ShowPenDate
boolean ShowPenHiHiLoLoAlarm
boolean ShowPenHiLo
boolean ShowPenHiLoAlarm
boolean ShowPenPoint
boolean ShowPenText
boolean ShowPenTime
boolean ShowPenUnits
boolean ShowPenValidity
boolean ShowPenValue
boolean ShowTooltips
boolean ShowXAxis
BSTR BorderEdge
BSTR BorderOptions
Short Visible Pens
BSTR NumberFormat
BSTR Size
OLE_COLOR FillColor
7.74
Determines whether the details field is displayed.
Default: TRUE
Determines whether a pen's date information is
displayed.
Determines whether a pen's "HiHi" and "
"LoLo" alarm information is displayed.
Determines whether a pen's "Hi/Lo" information is
displayed.
Determines whether a pen's "Hi/Lo" alarm
information is displayed.
Determines whether a pen's information is displayed.
Determines whether a pen's text is displayed.
Determines whether a pen's time information is
displayed.
Determines whether a pen's units are displayed.
Determines whether signal quality will be displayed.
Determines whether a pen's value is displayed.
TRUE if plot ToolTips are to be shown for the
currently focused pen (when in freeze mode).
Determines whether x-axis values are shown for XY
plots.
Visual appearance of the Details window.
Visual appearance of the Details window.
Gets/sets the number of visible pen details to be
drawn in the Details window.
Gets/sets the number format of the pen.
Gets/sets the size of the Details window.
The background color of the Details window.
Introduction
OLE_COLOR TextColor
boolean ShowHeader
boolean ShowFilter
boolean ShowMSecs
boolean ShowPenStyle
The color of all text in the Details window.
Enables/disables the display of the header in the
Details window.
Enables/disables the display of the data filter in the
Details window.
Enables/disables the display of milliseconds in the
time column of the details window.
Enables/disables the display of the pen's style in the
Details window, rather than the squares filled in the
color of the pen.
Details Objects: Methods
None
Grid Objects
Grid Objects: Properties
Grid Objects: Methods
Using Visual Basic To View Grid Objects
Grid Objects: Properties
boolean ShowGrids
BSTR GridStyle
OLE_COLOR GridColor
short GridNumber
short GridWidth
short SubGridNumber
short SubGridWidth
BSTR SubGridStyle
boolean ShowSubGrid
OLE_COLOR SubGridColor
short GridsBetweenLabels
short CircularEdgeMode
Determines whether grids are displayed in the
Viewer's main display area.
Default: TRUE.
Gets/sets grid style, such as solid, dotted, and
dashed.
The color of the grid.
Gets/sets grid number
The grid width in logical units.
Gets/sets the subgrid number for the Viewer in
configuration mode, if the circular chart mode is
enabled.
Gets/sets the subgrid width for the Viewer, if the
circular chart mode is enabled.
Gets/sets the subgrid style for the Viewer, if the
circular chart mode is enabled.
Enables/disables the display of the subgrids number
for the Viewer, if the circular chart mode is enabled.
Gets/sets the subgrid color the for Viewer, if the
circular chart mode is enabled.
Gets/sets the grids between labels value in the
Viewer, if the circular chart mode is enabled.
Gets/sets the circular edge appearance for the
Viewer, if the circular chart mode is enabled.
Possible values are:
0 (No edge)
1 (Default)
2 (Thick)
Grid Objects: Methods
None
7.75
TrendWorX Viewer ActiveX
Code Samples
Using the Component Inside Visual Basic
The TrendWorX Viewer ActiveX easily integrates into any Visual C++ or Visual Basic container
application. The following are some code samples for using the TrendWorX Viewer ActiveX inside
Visual Basic:
a. Disable Global Ranges and animate the component
With TWXViewer1
.GlobalRanges = False
.EnterAnimate
End With
b. Freeze the Trend
With TWXViewer1
.FreezeMode = True
End With
c. Unfreeze the Trend
With TWXViewer1
.FreezeMode = False
End With
d. Modify X- axis Grid Style
Dim xGrids As Object
'Get XGrids Interface
Set xGrids = TWXViewer1.xGrids
With xGrids
.GridStyle = "Dotted"
.GridNumber = 8
End With
' Call Refresh method
TWXViewer1.Refresh
'Release Interface
Set xGrids = Nothing
e. A full script
' Get Pen Names
Dim penNames As Variant
Dim Count As Integer
Dim penDel As String
penNames = TWXViewer1.GetPenNames
'Show to the user
For Count = 1 To UBound(penNames)
penDel = penNames(Count)
MsgBox (penDel)
Next Count
' Now disable pen drawing for last pen
Dim pen As Object
'Get Pen's Interface
Set pen = TWXViewer1.GetPen(penDel, "Real Time")
MsgBox ("Hiding Last Pen !")
'Hide Pen
With pen
.PenVisible = False
End With
'Call refresh method
TWXViewer1.Refresh
MsgBox ("Showing Last Pen !")
'Show pen again
With pen
.PenVisible = True
End With
'Call Refresh method
TWXViewer1.Refresh
MsgBox ("Deleting Last Pen !")
'Now delete this pen
'Release Pen Interface
Set pen = Nothing
'Delete pen
TWXViewer1.DeletePen penDel, "Real Time"
7.76
Introduction
f.
'Call refresh method
TWXViewer1.Refresh
Exit Runtime (Animate Mode)
With TWXViewer1
.ExitAnimate
End With
Note: All of the OLE Automation objects exposed by the TrendWorX Viewer ActiveX are already
created when the component is installed. The programmer should get the interfaces and not try to
create them.
When you programmatically obtain an interface to one of the TrendWorX objects, the reference
count for that interface is increased. Therefore, you should always release the corresponding
interface once it is not needed anymore. In addition, you should always check for "null" (or "nothing"
in Visual Basic) interface pointers. Depending on the state of the TrendWorX Viewer component and
the configured security settings, you may not have access to a certain object, and the returned
interface in this case is a "null" interface.
VBA Examples
Note:
TrendWorX
includes
a
set
of
VBA
examples
under
the
"\Smar\ProcessView\Examples\TrendWorX Examples" directory. The following folders located inside
the "Examples" directory are associated with the Viewer.
Aliasing. The files in this folder demonstrate the use of the OLE Automation interface of the
TrendWorX Viewer ActiveX within a VBA-enabled application, such as GraphWorX, in aliasing.
Excel Templates. The files in this folder are example Excel templates that can be used when
creating Excel workbooks to be used with TrendWorX Reporting.
Real-Time Trend Configuration. The files in this folder demonstrate the use of the OLE
Automation interface of the TrendWorX Viewer ActiveX within a VBA-enabled application, such as
GraphWorX. It demonstrates how to add pens "on the fly" by reading the pen configuration from a
Microsoft Access database (.mdb) file and utilizing the OLE Automation properties of the TrendWorX
ActiveX through VBA scripts.
TrendWorX Data Logging and Reporting. This folder contains sample TrendWorX data-logging
configuration, a sample historical database, as well as sample reporting and historical replay
displays.
TrendWorX Backgrounds. This folder contains several image files that can be used as
backgrounds for the TrendWorX Viewer ActiveX display.
TrendWorX VBA Examples. This folder contains various examples that demonstrate the use of the
OLE Automation interface of the various TrendWorX modules and components.
VB Script Examples. This folder contains a TWX-VBScriptEx.gdf display that uses VB scripting.
7.77
TrendWorX Viewer ActiveX
7.78
Chapter 8
INTRODUCTION TO DATABASE
UPSIZING
You can upsize your TrendWorX Logger databases from Microsoft Access (.mdb) to MSDE,
allowing you to take advantage of the powerful relationship database technology in MSDE. MSDE
supports databases up to 2 GB with up to five concurrent users. This document provides
instructions for upsizing databases from Microsoft Access to MSDE.
Though the default TrendWorX Logger database is a Microsoft Access database
("TWX32.mdb.mdb" file), the TrendWorX Logger is designed to work with SQL Server databases as
well.
In some cases, the transition to a SQL Server database is required to make use of the better
memory management, database security, robustness, and higher performance of SQL Server or
MSDE.
Auto-Starting the SQL Service
When upsizing databases, you must set the SQL service to auto-start:
1. Double click on the SQL Server icon in the Windows task bar to open the SQL Server Service
Manager, as shown in the figure below.
2.
Make sure that Auto-start service when OS starts check box is checked.
3.
Close the SQL Server Service Manager dialog.
Auto-Start Enabled for SQL Service
Using the TrendWorX Database Upsize Utility
To run the TrendWorX Database Upsize Utility:
1. Open the TWXSQLUpsize.exe file in the Program Files\Smar\ProcessView\Bin directory.
2.
This launches the TrendWorX Database Upsize Utility dialog box, as shown in the figure
below. The first step in upsizing is to select a Microsoft Access to convert to SQL. Under
Select Source Microsoft Access Database, click the Browse button.
8.1
TrendWorX Database Upsize Utility
TrendWorX Database Upsize Utility
3.
This opens the Data Link Properties dialog box, as shown in the figure below. Click the …
button to browse for a Microsoft Access database.
Data Link Properties: Selecting a Microsoft Access Database
4.
8.2
Select a TrendWorX Logger Microsoft Access database, as shown in the figure below. The
.mdb file must be a valid historical database. Click Open.
Introduction to Database Upsizing
Selecting a Microsoft Access Database to Convert
5.
Your selection appears in the TrendWorX Database Upsize Utility dialog box, as shown in
the figure below. The next step in upsizing is to select a destination SQL Server database.
Under Select Destination SQL Database, click the Browse button.
Source Access Database Selected
6.
This opens the Data Link Properties dialog box, as shown in the figure below. Specify the
SQL Server name and the database name. Click OK.
8.3
TrendWorX Database Upsize Utility
Data Link Properties: Selecting a SQL Server Database
7.
Your selection appears in the TrendWorX Database Upsize Utility dialog box, as shown in
the figure below. Click the Upgrade button to begin the upsizing operation. You will see a
progress bar during the conversion.
Destination SQL Database Selected
8.4