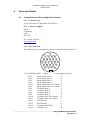
1
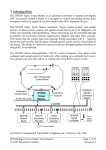
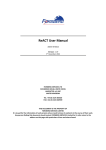
3D Remote Profiling Sonar User Manual
15th March 2010
User Manual
for the
3D Sand Ripple Profiling
Remote Sonar
Issue 1.1
15 March 2010
th
Marine Electronics Ltd.,
Unit 10,
Barras Lane Industrial Estate,
Vale,
Guernsey,
Channel Islands,
GY6 8EQ
Tel: +44 (0)1481 253181
Fax: +44 (0)1481 253182
Email: [email protected]
___________________________________________________________________________
©Copyright Marine Electronics Ltd.
Page 1 of 27
3D Remote Profiling Sonar User Manual
15th March 2010
Table of Contents
TABLE OF CONTENTS ........................................................................................................2
1.
SCOPE ..............................................................................................................................4
1.1
1.2
1.3
1.4
IDENTIFICATION ..........................................................................................................4
INTRODUCTION............................................................................................................4
SYSTEM OVERVIEW ....................................................................................................4
DOCUMENT OVERVIEW ...............................................................................................5
2.
APPLICABLE DOCUMENTS.......................................................................................6
3.
SYSTEM HARDWARE..................................................................................................7
3.1
SCANNING SONAR UNIT ..............................................................................................7
3.2
ELECTRONICS PROCESSING UNIT ................................................................................7
3.2.1
Mains Power Supply ..........................................................................................7
3.2.2
Microcontroller PCB EP01A0106.....................................................................7
3.2.3
Transmitter/Receiver PCB CR02A0206 ............................................................8
3.3
UMBILICAL CABLE ......................................................................................................9
3.4
SERIAL USB CABLE ....................................................................................................9
3.5
RS485 TO USB ADAPTER ...........................................................................................9
3.6
ALTERNATE SYSTEM CONFIGURATION ........................................................................9
4.
SYSTEM SOFTWARE AND SETUP..........................................................................10
4.1
INSTALLATION...........................................................................................................10
4.2
COMMUNICATIONS PORT SETUP SCREEN ..................................................................10
4.3
MAIN SCREEN ...........................................................................................................11
4.3.1
File Menu .........................................................................................................12
4.3.1.1 New Survey..................................................................................................12
4.3.1.2 Open….........................................................................................................12
4.3.1.3 Save…..........................................................................................................13
4.3.1.4 Print Preview................................................................................................13
4.3.1.5 Print..............................................................................................................13
4.3.1.6 Exit...............................................................................................................13
4.3.2
View Menu .......................................................................................................13
4.3.2.1 Control Panel ...............................................................................................13
4.3.2.2 Plan View.....................................................................................................13
4.3.2.3 Swath View..................................................................................................13
4.3.2.4 3D View .......................................................................................................13
4.3.2.5 Graticule.......................................................................................................14
4.3.2.6 Cursor...........................................................................................................14
4.3.2.7 Tank Walls ...................................................................................................14
4.3.2.8 Filter Image ..................................................................................................14
4.3.2.9 Fill Mesh ......................................................................................................14
4.3.3
Options Menu...................................................................................................14
4.3.3.1 Comm Port… ...............................................................................................14
4.3.3.2 Colour… ......................................................................................................14
4.3.3.3 Tank Setup… ...............................................................................................15
___________________________________________________________________________
©Copyright Marine Electronics Ltd.
Page 2 of 27
3D Remote Profiling Sonar User Manual
15th March 2010
4.3.4
Window Menu ..................................................................................................15
4.3.4.1 Tile Horizontally..........................................................................................15
4.3.4.2 Tile Vertically ..............................................................................................16
4.3.4.3 Cascade ........................................................................................................16
4.3.4.4 Arrange Icons ...............................................................................................16
4.3.4.5 1 3D View ....................................................................................................16
4.3.4.6 2 Plan View..................................................................................................16
4.3.4.7 3 Swath View...............................................................................................16
4.3.4.8 4 Control ......................................................................................................16
4.3.5
Help..................................................................................................................16
4.4
CONTROL WINDOW ...................................................................................................16
4.4.1
Maximum Range Slider....................................................................................17
4.4.2
Start Depth .......................................................................................................17
4.4.3
Stop Depth........................................................................................................17
4.4.4
Colour Scale.....................................................................................................17
4.4.5
Swath Arc .........................................................................................................18
4.4.6
Advanced… (Button) ........................................................................................18
4.5
ADVANCED SONAR PARAMETERS .............................................................................18
4.5.1
Velocity of Sound .............................................................................................18
4.5.2
Transmit Pulse .................................................................................................18
4.5.3
Filter Window ..................................................................................................18
4.5.4
Detection Threshold.........................................................................................19
4.5.5
Swath Step Size ................................................................................................19
4.5.6
Rotation Step Size ............................................................................................19
4.5.7
Sample Delay ...................................................................................................19
4.5.8
Sample Interval ................................................................................................19
4.5.9
Number of Samples ..........................................................................................19
4.6
SWATH VIEW ............................................................................................................19
4.7
PLAN VIEW ...............................................................................................................21
4.8
3D VIEW ...................................................................................................................21
5.
STORED FILE FORMATS..........................................................................................23
5.1
XYZ DATA FILE STRUCTURE ....................................................................................23
5.1.1
ASCII Header...................................................................................................23
5.1.2
ASCII XYZ data................................................................................................24
5.2
RAW DATA FILE STRUCTURE......................................................................................24
6.
CONNECTION DETAILS ...........................................................................................26
6.1
19 WAY ELECTRONICS PROCESSING UNIT CONNECTOR.............................................26
6.2.1
Connector Type................................................................................................26
6.2.2
Connector Supplier ..........................................................................................26
6.2.3
Pin Connections ...............................................................................................26
6.2
2 WAY WET SENSOR CONNECTOR .............................................................................27
6.2.1
Connector Type................................................................................................27
6.2.2
Connector Supplier ..........................................................................................27
6.2.3
Pin Connections ...............................................................................................27
6.3
RS485 (9 WAY 'D' TYPE) ...........................................................................................27
___________________________________________________________________________
©Copyright Marine Electronics Ltd.
Page 3 of 27
3D Remote Profiling Sonar User Manual
15th March 2010
1.
Scope
1.1
Identification
This document is the user manual for the 3D Remote Profiling Sonar (3DRPS)
repackaged for Florida University with additional water sensor.
1.2
Introduction
The 3D Remote Profiling Sonar is a dual axis mechanically scanning sonar
underwater unit connected via a 30m underwater umbilical cable to a surface mounted
Electronics Processing Unit (EPU). The EPU is powered from the a.c. mains supply
locally and connects to a remote computer via a USB. An internal optically isolated
RS485 to USB adapter is used to connect the sonar system to the p.c. If the distance
between the P.C. and the EPU needs to be extended then by removing the internal
RS485 to USB converter the RS485 link may be run over up to 100m of twisted pair
cable with the RS485 to USB converter mounted next to the P.C. Consult Marine
Electronics for details.
The sonar has an oil-filled hemi-spherical plastic Peek "boot" providing protection for
its internally rotated transducer which operates at 1.1MHz with a narrow conical beam
pattern. Typically the sonar is mounted vertically, looking down at the sea-bed, and
captures a sequence of profiles of the sea-bed over a pre-programmed sector and
range. The sonar gathers a single swath of data in the horizontal plane and then rotates
the transducer through a pre-programmed angle around the vertical axis and repeats
the process until a circular area underneath the sonar has been scanned in a sequence
of radial spokes.
The movement of the sonar head and the transmission/reception of the acoustic data is
performed by the EPU acting as a slave to a Windows program running on a P.C. The
raw acoustic echo data is telemetred to the p.c. via the RS485/USB link at a baud rate
of 1Mb per second. The raw data represents the signal amplitude of the envelope of
the returned echoes with logarithmic compression to achieve an overall dynamic
range of greater than 90dB. The Windows program processes the raw data to generate
a line profile for each swath and then combines the swaths to construct a 3D model of
the area scanned. The model data may be saved in an ASCII x,y,z format for
importing into other third party software such as CAD or spreadsheet programs.
1.3
System Overview
The 3D Remote Profiling Sonar comprises the following items as shipped from the
factory:1. Scanning Sonar Unit which contains the acoustic transducer, rotation motor, tilt
motor, position reference sensor and pressure balancing mechanism. No
semiconductors are incorporated into the Sonar Unit so that it may be deployed in
areas where there is significant radioactivity. A nineteen pin underwater connector
provides a connection for the umbilical cable to connect to the EPU.
2. Electronics Processing Unit which contains the acoustic transmitter/receiver
board, microcontroller board, power supply (110VAC/240VAC), mains inlet filter
and RS485 to USB converter.
___________________________________________________________________________
©Copyright Marine Electronics Ltd.
Page 4 of 27
3D Remote Profiling Sonar User Manual
15th March 2010
3. 30m underwater cable to join item 1 to item 2
4. 2m USB A/B cable to join item 2 to the host P.C. running Windows recommended minimum specification for the host P.C. is Pentium 1GHz, 64Mb
Ram, 1024x768 3D graphics accelerator with DirectX8 compatibility, CDROM,
hard disk with minimum 100Mb free space, parallel printer port and a free USB
port.
5.
3D Profiler Software on CDROM for Windows (98SE, XP compatible).
6.
User manual (this document)
1.4
Document Overview
The purpose of this document is to provide user instructions for setting up and
operating the 3D Remote Profiling Sonar.
This section, Section 1, provides an overview and general introduction
Section 2 details the documents applicable to this document
Section 3 details the system hardware
Section 4 details the system software
Section 5 explains the Stored File Formats
Section 6 shows the connection details
___________________________________________________________________________
©Copyright Marine Electronics Ltd.
Page 5 of 27
3D Remote Profiling Sonar User Manual
15th March 2010
2.
Applicable Documents
The following documents are applicable to this document:Installation Guide of Hi-Speed Vscom USB Industrial I/O Adapter
___________________________________________________________________________
©Copyright Marine Electronics Ltd.
Page 6 of 27
3D Remote Profiling Sonar User Manual
15th March 2010
3.
System Hardware
3.1
Scanning Sonar Unit
The Scanning Sonar Unit contains the acoustic transducer, rotation motor with
gearbox, tilt motor, position reference sensor and pressure balancing mechanism. The
complete sonar unit is oil filled and must not be opened except by the manufacturer.
There are no user serviceable parts inside the sonar unit. If the sonar unit is physically
damaged or non-functional then it must be returned to the manufacturer or their
appointed agent for repair/replacement.
3.2
Electronics Processing Unit
The Electronics Processing Unit contains the acoustic Transmitter/Receiver PCB, the
Microcontroller PCB, the a.c. mains power supply and fused mains inlet filter with
voltage select switch and the RS485 to USB converter.
3.2.1 Mains Power Supply
The power supply has transformer taps for either 110VAC or 220/240VAC
which are switched by the voltage select switch mounted on the chassis plate
inside the EPU enclosure. WARNING – Ensure that the voltage select switch
is set correctly for the local mains voltage otherwise serious damage to the
equipment or fire could result. Also mounted on the chassis plate is a mains
fuse, for operation on 110VAC input this should be rated at 2A anti-surge and
for operation on 220/240VAC should be rated at 1A anti-surge.
The output of the power supply is 12VDC, which connects directly to the
microcontroller PCB.
3.2.2 Microcontroller PCB EP01A0106
The 12VDC power for the microcontroller PCB connects to TB1 and is
filtered by FL1 before being converted to +/-5VDC by PSU1. All the control
functions for this PCB originate from the microcontroller IC5, a PIC18F452.
The microcontroller is clocked from an 8MHz crystal XTAL1 and internally
quadruples this frequency to run at 32MHz.
The logarithmically compressed envelope of the acoustic receive signal is
connected to PL5 pin 4 from where it is buffered by the TL082 op-amp IC2
before being digitised by an AD775 eight bit flash A/D converter (IC1). The
digital output of the AD775 is buffered by an AM7204 digital FIFO buffer
(IC4) which can hold 4096 bytes. The sample clock for the A/D and write
clock for the FIFO is generated by the pulse width modulated (PWM) output
from the PIC18F452 and can be programmed from 1usec to 100usec which
specifies the sample interval. The A/D is scaled such that a 1.5v peak signal on
the input reaches full scale or 0xFF. Data from the FIFO is read via PortD of
IC5 from where it is output from the microcontrollers internal UART via the
MAX485 RS485 transceiver (IC3). Each acoustic “ping” worth of data is
transmitted at 1Mb/sec via IC3 before the sonar can transmit again.
The stepper motor which rotates the acoustic transducer is connected through a
10:1 gearbox, thus 10 motor steps are needed for each acoustic transmission to
give an angular resolution of 0.9°. The four phase hybrid stepper motor is
___________________________________________________________________________
©Copyright Marine Electronics Ltd.
Page 7 of 27
3D Remote Profiling Sonar User Manual
15th March 2010
driven via buffer transistors TR1 to TR4 from port RB4 to RB7 of the
PIC18F452.
The Tilt stepper motor which sweeps the transducer through each swath is
similarly driven via transistors TR5 to TR8 from port RB0 to RB3 of IC5.
The position of the transducer head is determined by locating the transducer to
a zero reference position which is determined by a metal arm containing a
small magnet passing a reed switch sensor which is connected to PL7.
PL6 provides 4 uncommitted input/output port lines from the microcontroller
for future expansion. PL1 provides a connection for in-circuit programming of
IC5 via a suitable adapter.
Two LED’s are driven from the microcontroller which are mounted on the
side of the EPU. The Blue LED lights when the EPU is processing a command
from the host P.C. The Red LED lights when the EPU is transmitting data to
the host P.C. Together these two LED’s verify the correct operation of the
RS485 data link.
PL5 connects the Transmitter/Receiver PCB.
3.2.3 Transmitter/Receiver PCB CR02A0206
The Transmitter/Receiver PCB is mounted in a 100mm by 50mm screened
metal box to decouple the sensitive receive input from the microprocessor
clock signals. The Transmitter oscillator frequency is generated by the 4047
astable IC5 and the frequency is adjusted to suit the acoustic transducer with
VR1. Normally the oscillator is disabled by a high level at its enable pin 4.
The TXGATE signal is an active high (+5v) pulse of width set by the transmit
pulse width parameter applied to PL1 pin 1. The oscillator IC5 then generates
anti-phase clocks at pins 10 and 11 which drive the dual emitter followers TR3
to TR6. The push pull outputs of the emitter followers have their rising edge
delayed by the D4/R14 and D5/R16 networks to ensure there is no overlap in
the pulses fed to the gates of the MOSFET transistors TR1 and TR2. The
drains of TR1/TR2 are connected to the centre tapped toroidal output
transformer T1 which steps up the transmit pulse to drive the transducer.
Capacitors C11, C14 and C15 and the inductance of T1 combine to tune the
waveform applied across the transducer to an approximation of a sine-wave.
Diode networks D7/D8 and D1/D6 provide the transmit/receive gating
function such that high voltages are not applied across the receiver input and
low level receive signals are not shunted by T1.
The receiver has an input low-pass filter (L6/C19) to limit the input bandwidth
to less than 4MHz and a clamping circuit around TR8 to shunt the input to
ground during the MUTE pulse which limits the overload caused by the
transmit pulse. The receiver input pre-amplifier stage is an AD603 (IC3)
which is a voltage controlled variable gain amplifier with up to 40dB of gain
and very low input noise into its 100ohm input impedance. The output of the
IC3 is coupled through a bandpass filter around L3,L4 and L5 to the AD8307
logarithmic amplifier. The AD8307 output is the logarithm of the signal
envelope amplitude, a portion of which is tapped off via R6, R5 and R12 to
provide the AGC control voltage for the AD603. The TL081 op-amp IC1
___________________________________________________________________________
©Copyright Marine Electronics Ltd.
Page 8 of 27
3D Remote Profiling Sonar User Manual
15th March 2010
buffers the detected signal output and scales it to 20mV per dB, therefore if the
input signal changes by 40dB the output voltage will change by 0.8v.
3.3
Umbilical Cable
The 30m underwater cable is moulded on one end to connect to the sonar and a 19way Metal-lok Bantam connector is required to join to the EPU. Care should be taken
to ensure that the connectors are correctly aligned before turning the locking ring to
secure them. The 19 way connector has a larger keyway adjacent to Pin 1.
3.4
Serial USB Cable
The system is supplied with a 2m USB A/B cable to connect the EPU to the host P.C.
via the RS485/USB interface. The system runs at a baud rate of 1Mb.
3.5
RS485 to USB Adapter
The supplied RS485/USB adapter allows easy connection of the high speed RS485
telemetry to a host P.C. as it is powered via the USB socket. The adapter connects to
the P.C. via a short USB “A” to “B” lead and is normally mounted inside the EPU
enclosure. The RS485/USB adapter is supplied with a driver disk to install under
either Windows ’98 or Windows XP. The USB adapter should be plugged in to the
P.C. and then the driver loaded when Windows recognizes that new hardware is
attached. Updated drivers can be downloaded from the www.ftdichip.com website.
3.6
Alternate System Configuration
If the RS485/USB adapter is removed from the EPU then it is possible to extend the
distance between the EPU and the host PC by interconnecting the system components
as shown in the diagram below.
___________________________________________________________________________
©Copyright Marine Electronics Ltd.
Page 9 of 27
3D Remote Profiling Sonar User Manual
15th March 2010
4.
System Software and Setup
4.1
Installation
The system software is supplied on a CDROM disk. To install the software run the
“setup.exe” program in the root directory of the CD. The Windows P.C. should
already have a version of DirectX installed, the 3D Profiler software requires at least
version 8 of DirectX to function correctly. The version number and the status of the
installed DirectX can be checked by running the “dxdiag.exe” program which is in
either the “C:\windows\system” directory for Windows ’98 or C:\windows\system32
for Windows XP. The latest version of DirectX is available for download from the
official Microsoft website.
4.2
Communications Port Setup Screen
When the Profiler3D program is run, the first screen that appears is the
Communications Port Setup screen as shown below.
The RS485/USB adapter will install to a virtual Comm Port on the P.C. where there is
no conflict with existing hardware. The Comm port chosen by the USB driver will be
after any existing Comm Port Drivers. To find out which Comm Port the driver has
selected you can use the Windows “Device Manager” to look at the list of available
serial ports as shown in the screenshot below. To access the Device Manager from
Windows XP, select “Control Panel” followed by “System” then “Hardware”. In this
instance the USB Comm Port has installed as Comm5.
___________________________________________________________________________
©Copyright Marine Electronics Ltd.
Page 10 of 27
3D Remote Profiling Sonar User Manual
15th March 2010
4.3
Main Screen
When the OK button on the Comm Port select screen is clicked the main program
screen is loaded. The main program screen consists of a main window containing the
system menu options with several “child” windows contained within it. The child
windows currently available are “Control”, “Swath View”, “Plan View” and “3D
View”. If the program is being run for the first time after installation then the child
windows are shown in “cascade” mode.
By clicking on the “Window” menu option followed by “Tile Horizontally” the screen
layout will look like the screenshot below. The software is best viewed at a screen
resolution of at least 1024 x 768 pixels with either 16 or 32 bit colour depth. Graphics
cards using the 24 bit colour mode are not recommended as DirectX is not as quick in
this graphics mode as it is in either 16 or 32 bit mode. Any of the child windows can
be “maximized” to fill the main window for viewing images in greater detail.
___________________________________________________________________________
©Copyright Marine Electronics Ltd.
Page 11 of 27
3D Remote Profiling Sonar User Manual
15th March 2010
4.3.1 File Menu
4.3.1.1
New Survey
The New Survey menu option should be selected before starting a new
sonar scan. When a scan is complete or when a saved dataset is loaded the
Scanning Parameters on the Control Screen are disabled so that the on
screen measurements cannot be changed. Selecting the New Survey option
will unlock the controls and erase all data from memory. To prevent
unwanted data loss a warning message box appears when the New Survey
option is selected to give the user the opportunity to cancel the operation.
4.3.1.2
Open…
The Open… menu option allows previously stored ASCII x,y,z files and
raw data files to be loaded back into the system memory for viewing,
analysis and printing. Note that only files that have been saved by the
Profiler3D software may be loaded back into the program. When loading
raw data files the current Tank Setup is used to clip the data if the “Clip to
Tank” option is checked. This option is useful to trim edge effects from the
data to present a clean 3D image.
___________________________________________________________________________
©Copyright Marine Electronics Ltd.
Page 12 of 27
3D Remote Profiling Sonar User Manual
15th March 2010
4.3.1.3
Save…
The Save… menu option gives the user the facility to save the current
survey data to disk in either an ASCII x,y,z format or the systems raw
binary format. The ASCII x,y,z files are much smaller in size than the raw
binary files which can be as large as 40Mb. The raw binary files contain
each “ping” (acoustic transmit/receive cycle) of the sonar and as they are
loaded in the data is presented as if the sonar is scanning, i.e. the
individual swaths are displayed and the plan display builds up. The ASCII
x,y,z files only contain the data for the plan display and so no swaths are
drawn when an ASCII file is loaded. Both file formats display the plan and
3D views when subsequently loaded.
4.3.1.4
Print Preview
The Print Preview option shows the screen area that will be output to the
printer with subsequent print operations. The printing function is a simple
screen capture and so the aspect ratio of the print preview window may
need adjusting by dragging the window to view the image without
distortions. By maximizing a particular window before selecting print or
print preview then a single display mode may be printed rather than all of
the displayed windows.
4.3.1.5
Print
The Print option send the contents of the main display screen to the
currently selected Windows printer.
4.3.1.6
Exit
The Exit option closes the program. A message is displayed asking for
confirmation to close the program allowing the user to cancel the
operation.
4.3.2 View Menu
4.3.2.1
Control Panel
If this option is checked the Control Window is visible within the main
screen window.
4.3.2.2
Plan View
If this option is checked the Plan View Window is visible within the main
screen window.
4.3.2.3
Swath View
If this option is checked the Swath View Window is visible within the
main screen window.
4.3.2.4
3D View
If this option is checked the 3D View Window is visible within the main
screen window.
___________________________________________________________________________
©Copyright Marine Electronics Ltd.
Page 13 of 27
3D Remote Profiling Sonar User Manual
15th March 2010
4.3.2.5
Graticule
A graticule may be displayed over either of the Plan or Swath windows.
The graticule is displayed if the option is checked by left clicking with the
mouse, similarly the graticule is erased if there is no check mark.
4.3.2.6
Cursor
If this option is checked then a cursor is overlaid on the Plan View window
allowing horizontal distance measurements to be made. There are two
“end point” cursors, a “+” which is moved by holding the left mouse
button down and dragging or clicking at a point of interest on the plan
view and a “x” which is moved by dragging or clicking with the right
mouse button. The positions of the two end points is shown along with the
distance and bearing between the two cursors.
4.3.2.7
Tank Walls
If this menu option is checked then the current tank outline is overlaid on
the Plan View Window.
4.3.2.8
Filter Image
The Filter Image option is used to remove isolated “spikes” from the data
in both the Plan View and 3D View windows. Each click of the Filter
Image option applies a single pass of a median filter over the data. If there
are a lot of spikes in the data due to mid-water echoes from fish or
suspended sediments then several applications of the filter may be
necessary to reduce the effect the spikes have on the overall image. The
filtering process does not affect either the raw or x,y,z data so if a survey is
filtered then saved, when it is reloaded the data will not be filtered.
4.3.2.9
Fill Mesh
When checked the Fill Mesh option uses Gouraud shading to represent the
data in the 3D View as a solid model. If unchecked the data is shown as a
wireframe mesh. Sometimes the wireframe mode can be useful to see
shallow trenches in the data where the shading of the filled option is too
subtle.
4.3.3 Options Menu
4.3.3.1
Comm Port…
This option allows the user to change the Comm Port that the sonar is
using without having to close and re-open the program.
4.3.3.2
Colour…
The Colour menu option allows the choice of several different colour
palettes for representing the data. All three data windows are affected by
the choice of colour palette.
___________________________________________________________________________
©Copyright Marine Electronics Ltd.
Page 14 of 27
3D Remote Profiling Sonar User Manual
15th March 2010
4.3.3.3
Tank Setup…
The Tank Setup menu option opens the Tank Setup dialogue window,
which allows the user to input the dimensions of a rectangular or circular
vessel in which the sonar is deployed. The Tank Setup dialogue is as
shown below.
The general principle for modifying the on-screen values is to first select
the data field to be modified by either left clicking the mouse once on the
data field or using the TAB key to advance to the required field. The data
may then be modified by overtyping a new value and/or using the
BACKSPACE or DELETE keys to modify the data. When finished with a
particular field use either the ENTER key to register the change or move to
a different data field. The boxes coloured green on the setup screen
represent parameters that can be edited in the current mode.
The x and y offset of the sonar from the center of the tank can be entered
together with a rotation offset to specify in which direction the sonar was
deployed. The blue dot and line represent the position of the sonar and the
direction of the forward looking arrow on the sonar. The forward looking
position of the sonar is always plotted up the screen in the Plan View
window, whereas the tank wall overlay is rotated around the sonar
position.
The “Clip data to tank walls” options will limit the data plotted to lie
within the tank walls.
4.3.4 Window Menu
4.3.4.1
Tile Horizontally
The “child” windows within the main screen are re-arranged horizontally
___________________________________________________________________________
©Copyright Marine Electronics Ltd.
Page 15 of 27
3D Remote Profiling Sonar User Manual
15th March 2010
4.3.4.2
Tile Vertically
The “child” windows within the main screen are re-arranged vertically
4.3.4.3
Cascade
The “child” windows within the main screen are re-arranged one on top of
the other as a series of pages cascading from the top left of the main
window.
4.3.4.4
Arrange Icons
If any of the “child” windows within the main screen are minimized then
the icons that represent the minimized windows are re-arranged around the
bottom left of the main window.
4.3.4.5
1 3D View
This option selects and brings to the front the 3D View window.
4.3.4.6
2 Plan View
This option selects and brings to the front the Plan View window.
4.3.4.7
3 Swath View
This option selects and brings to the front the Swath View window.
4.3.4.8
4 Control
This option selects and brings to the front the Control window.
4.3.5 Help
The Help menu option provides access to the “About…” box which
provides contact details for the equipment manuacturer as well as access to
the windows “System Information” which is useful for diagnosing
problems with windows installations.
4.4
Control Window
The parameters that control the operation of the sonar are adjusted using the controls
within the Control Window which is shown below.
___________________________________________________________________________
©Copyright Marine Electronics Ltd.
Page 16 of 27
3D Remote Profiling Sonar User Manual
15th March 2010
4.4.1 Maximum Range Slider
The Maximum Range setting limits the radial coverage of the sonar and
mainly comes into play when the 180° swath width is selected. The easiest
way to think of the effect that this control has, is to imagine a cylinder of this
radius centred on the sonar beyond which no data is gathered. The Maximum
range of this control is 10.0m
NOTE:- The Maximum Range setting cannot be less than the Stop Depth
4.4.2 Start Depth
The Start Depth specifies the depth below the transducer at which sampling
starts and is mainly used to reduce multipath caused by the proximity of the
transducer head to the surface or other objects. The limits of the Upper Height
Limit are 0.2m to 5.0m.
NOTE:- The Start Depth is restricted to always being at least 0.5m less than
the Stop Depth.
4.4.3 Stop Depth
The Stop Depth specifies the depth below the transducer beyond which data is
not captured and is used with the Start Depth to reduce multipath caused by
the proximity of the transducer head to the surface or other objects. The limits
of the Stop Depth are 0.5m to 10.0m.
NOTE:- The Stop Depth is restricted to always being at least 0.5m more than
the Start Depth and the Stop Depth cannot be more than the Maximum Range
setting
4.4.4 Colour Scale
The Colour Scale slider specifies how many metres is represented by the range
of the colour palette, i.e. if the Colour Scale is 1.0m then 0m would represent
colour(0) and 1.0m would represent colour(255). The Colour Scale is the only
control that may be adjusted whilst the sonar is scanning to change the height
representation of the colour palette.
___________________________________________________________________________
©Copyright Marine Electronics Ltd.
Page 17 of 27
3D Remote Profiling Sonar User Manual
15th March 2010
4.4.5 Swath Arc
The arc swept by the sonar as it gathers the data can be set in 30 degree
increments. The limits of the data capture area are shown in the Swath View
window to aid setting the system for optimum coverage.
4.4.6 Advanced… (Button)
The Advanced button opens the Advanced Sonar Parameters dialogue (shown
below) where further parameters may be found to modify how the sonar
gathers its survey data.
4.5
Advanced Sonar Parameters
4.5.1 Velocity of Sound
The Velocity of Sound text box allows the speed of sound in the water to be
compensated to improve the accuracy of the calculated target ranges. Typically
the speed of sound in fresh water is set to 1500 metres per second but the
adjustment range of this control allows values from 1400 to 1600 metres per
second to be used to calibrate the system.
4.5.2 Transmit Pulse
The acoustic Transmit Pulse may be set in the range 10µsec to 250µsec with
shorter pulses generally giving higher resolution but the trade-off is that the
gain is less with shorter pulses. The Transmit Pulse should always be larger
than the Sample Interval otherwise received echoes may be missed. The
Transmit Pulse is adjusted in increments of 10µsec.
4.5.3 Filter Window
The Filter Window parameter is used by the pulse echo detection routine to
smooth the data with a rolling average. The range of values that may be set is
from 1 to 20 and a typical setting is 10. In areas of high background noise it
may be beneficial to use a larger window setting.
___________________________________________________________________________
©Copyright Marine Electronics Ltd.
Page 18 of 27
3D Remote Profiling Sonar User Manual
15th March 2010
4.5.4 Detection Threshold
This Detection Threshold is also used by the pulse echo detection routine to
specify what signal level to start looking for an echo. The range of adjustment
is from 10% to 90% with a typical setting of 30%. The algorithm uses the
background signal level (averaged over the filter window size) added to the
Detection Threshold to specify the signal level above which a pulse is present.
All pulses above the threshold are examined and the nearest largest pulse is
deemed to be the required sea-bed echo.
4.5.5 Swath Step Size
The Swath Step Size specifies how many discrete 0.9° tilt motor steps are
performed for each “ping” of the sonar. For the finest detail the Swath Step
Size should be set to 1, but by increasing this setting the scan speed may be
increased and the dataset size reduced. The range of values that may be set is
from 1 to 10.
4.5.6 Rotation Step Size
The Rotation Step Size specifies how many discrete 0.9° rotation motor steps
are performed after each swath gathered by the sonar. For the finest detail the
Rotation Step Size should be set to 1, but by increasing this setting the dataset
capture speed may be increased and the dataset size reduced. The range of
values that may be set is from 1 to 10.
4.5.7 Sample Delay
This data field cannot be directly modified by the user. The Sample Delay is
the time to when the sonar starts capturing data after the start of the transmit
pulse.
4.5.8 Sample Interval
This data field cannot be directly modified by the user. The Sample Interval is
literally the time between successive readings of the A/D that is sampling the
receiver output. The Sample Interval is automatically set by the system to
obtain the specified range with the specified number of samples
4.5.9 Number of Samples
This data field can not be directly modified by the user. The Number of
Samples gathered by the sonar for each motor step position is optimized by the
system software up to a maximum of 1000 samples. The software uses the
largest number of samples for a given range with the smallest sample interval
possible with the limitation the number of samples cannot exceed 1000.
4.6
Swath View
The format of the Swath View window is shown typically below.
___________________________________________________________________________
©Copyright Marine Electronics Ltd.
Page 19 of 27
3D Remote Profiling Sonar User Manual
15th March 2010
The Start Depth is shown as a green line at 2.5m and the Stop Depth is shown as a red
line at 5.0m. The blue lines show the limits of the swath arc (in this case 150 degrees).
When the system has either finished a survey or read a .raw file in from disk the slider
at the base of the Swath View window may be used to view any of the swaths within
the current survey. Also the display may be toggled between Profile, Data and Both
modes to show where the algorithm is detecting the profile from within the raw data.
The screenshot below shows the same swath as above in Profile mode, the white dots
being where the algorithm has detected the sea-bed.
___________________________________________________________________________
©Copyright Marine Electronics Ltd.
Page 20 of 27
3D Remote Profiling Sonar User Manual
15th March 2010
4.7
Plan View
The Plan View window shows the processed height data scaled according to the
Colour Scale slider in a view looking vertically down on the area scanned.
The cursor measurement tool allows the distance and bearing between objects in the
plan view to be measured. The example above shows a circular tank outline of 10m
diameter used to clip the data with the sonar offset from the center of the tank.
4.8
3D View
The 3D View window provides controls for manipulating the 3D image so that
objects within the data can be viewed from different angles. A typical 3D View is
shown below.
___________________________________________________________________________
©Copyright Marine Electronics Ltd.
Page 21 of 27
3D Remote Profiling Sonar User Manual
15th March 2010
The upper group of six arrows move the observers position around the 3D
environment, the diagonal arrows zoom in and out of the image. The icon in the
middle of the arrows may be clicked to return all the movement and rotation back to
the starting default or “home” position.
The lower group of 4 curved arrows provide rotation around the vertical axis or the
horizontal axis so that the image may be tilted.
The colour bar across the bottom of the image shows the settings of the Colour Scale
slider and the maximum height setting. The 3D image data heights are referenced to
the deepest data point that the sonar scanned and measured above that base level. The
x,y,z data stored in the ASCII .txt file created by the sonar represents the height below
the sonar transducer that a target was detected.
___________________________________________________________________________
©Copyright Marine Electronics Ltd.
Page 22 of 27
3D Remote Profiling Sonar User Manual
15th March 2010
5.
Stored File Formats
5.1
XYZ Data File Structure
The ASCII x,y,z data files are made up of two distinct elements, the first being an
ASCII header containing the sonar parameters set when the data was captured and the
second being the x,y,z data captured by the sonar. The start of a sample XYZ file is
shown below.
3D_Profiler
24/06/04 12:29:17
MaxRange = 10000
Arc = 166
SwathStep = 1
RotateStep = 1
Tx Pulse = 50
Mute Pulse = 100
Delay = 3333
Sample Interval = 11
No. of Samples = 909
Threshold = 30
Blanking = 1
Start Range = 2500
Stop Range = 5000
Filter = 10
Velocity of sound = 1500
000000,000000,000000
000000,000000,000000
000000,000000,000000
000000,000000,000000
000000,000000,000000
000000,000000,000000
000000,000000,000000
000000,000000,000000
000000,000000,000000
000000,000000,000000
000000,000000,000000
000000,008965,004219
000000,008679,004252
000000,008395,004277
000000,008319,004405
000000,007779,004277
000000,007596,004333
000000,007364,004355
etc,, etc., etc………
5.1.1 ASCII Header
The ASCII header is separated from the ASCII xyz data by a blank line to
make it easy to extract just the xyz data when re-processing the file with third
party software.
The header should be read by third party software on a line by line basis. The
first line of the file reads “3D_Profiler” which the system software looks for to
___________________________________________________________________________
©Copyright Marine Electronics Ltd.
Page 23 of 27
3D Remote Profiling Sonar User Manual
15th March 2010
ensure the file is of the correct type when trying to open it. The second line of
the file is a time and date stamp when the file was recorded by the sonar. The
following 15 lines give the parameter of the sonar followed by the blank line
signalling the start of the xyz data.
The parameter values are in the following units and are explained in more
detail below.
MaxRange = 10000 (mm)
Arc = 166 (Gradians = 0.9 degree steps)
SwathStep = 1 (Number of 0.9 degree steps between swaths)
RotateStep = 1 (Number of 0.9 degree steps between swaths)
Tx Pulse = 50 (microseconds)
Mute Pulse = 100 (microseconds – not adjustable)
Delay = 3333 (microseconds)
Sample Interval = 11 (microseconds)
No. of Samples = 909
Threshold = 30 (percentage from 10% to 90%)
Blanking = 1 (not used)
Start Range = 2500 (mm)
Stop Range = 5000 (mm)
Filter = 10 (Number of samples to average for detect base level)
Velocity of sound = 1500 (metres per second)
5.1.2 ASCII XYZ data
The ASCII data is stored in three columns per line with comma separators and
a carriage return, linefeed at the end of each line. The data is ordered x, y, z
and each of the xyz values are in mm with a leading sign character, either ‘+’
or ‘-‘. Note that the z value is the distance BELOW the transducer at which the
seabed was detected NOT the actual seabed height relative to any charted
datum.
5.2
Raw data file structure
The raw data files are made up of two distinct elements, the first being an identical
ASCII header to the XYZ file format except for the first line which contains the
different file type identifier of “3D_Profiler_RAW”. The following data represents the
binary signal amplitudes of each sample taken by the sonar during a survey. The data
may be decoded by a custom program from a knowledge of the sonar parameters. The
data is stored sequentially with each data block being “Number of Samples” long and
starting at the first ping of swath 1 followed by the second ping of swath 1 up to the
“Arc” size and then followed by the first ping of swath 2, etc..
Note that some digital camera display software and some paint programs (e.g. Paint
Shop Pro) can read .raw data files if you count the number of bytes used by the ASCII
header (don’t forget the blank line) and input it when the raw file dialogue appears.
To use Paint Shop Pro specify the size of the header, the number of samples to match
the width dimension and the number of swaths multipled by the number of pings per
swath to match the height dimension. For example if 20 swaths at 150° (166 steps)
and 600 samples were taken then the Width is set at 600, the Height at 3360. The
resultant B-Scan display gives a quick indication of what is in the file.
___________________________________________________________________________
©Copyright Marine Electronics Ltd.
Page 24 of 27
3D Remote Profiling Sonar User Manual
15th March 2010
The first few bytes in a sample .raw data file are shown below.
3D_Profiler_RAW
24/06/04 12:28:51
MaxRange = 10000
Arc = 166
SwathStep = 1
RotateStep = 1
Tx Pulse = 50
Mute Pulse = 100
Delay = 3333
Sample Interval = 11
No. of Samples = 909
Threshold = 30
Blanking = 1
Start Range = 2500
Stop Range = 5000
Filter = 10
Velocity of sound = 1500
……………………..
___________________________________________________________________________
©Copyright Marine Electronics Ltd.
Page 25 of 27
3D Remote Profiling Sonar User Manual
15th March 2010
6.
Connection Details
6.1
19 way Electronics Processing Unit Connector
6.2.1 Connector Type
25 way “Buccaneer” by Bulgin Part No. PX0822/S
6.2.2 Connector Supplier
Farnell,
Canal Road,
Leeds,
LS12 2TU
Tel. +44 8701 200 200
www.farnell.co.uk
6.2.3 Pin Connections
View looking into 25 way bulkhead connector on Electronics Processing Unit
1
2
6
3
7
11 12
17
Pin 1
Pin 2
Pin 3
Pin 4
Pin 14
Pin 5
Pin 6
Pin 7
Pin 8
Pin 9
Pin 18
Pin 17
Pin 13
Pin 19
Pin 12
Pin 10
14
19
23
Signal
5
9
8
13
18
22
25 way Bulkhead (EPU)
4
10
15
20
24
16
21
25
19 way Amphenol (Sonar)
Rotate Motor Phase 1
Rotate Motor Phase 2
Rotate Motor Phase 3
Rotate Motor Phase 4
Rotate Motor Phase 1/2 Common
Rotate Motor Phase 3/4 Common
Tilt Motor Phase 1
Tilt Motor Phase 2
Tilt Motor Phase 3
Tilt Motor Phase 4
Tilt Motor Phase 1/2 Common
Tilt Motor Phase 3/4Common
Reed Switch 1
Reed Switch 2
Transducer Head Earth
Transducer +ve
D
R
V
E
J
K
S
T
U
H
G
F
L
P
N
M
___________________________________________________________________________
©Copyright Marine Electronics Ltd.
Page 26 of 27
3D Remote Profiling Sonar User Manual
15th March 2010
Pin 11
Pin 15
Pin 16
6.2
Transducer –ve
Wet Sensor 1 (n/o)
Wet Sensor 2 (n/o)
A
B
C
2 way Wet Sensor Connector
6.2.1 Connector Type
2 way “Buccaneer” by Bulgin Part No. PX0735/S
6.2.2 Connector Supplier
Farnell,
Canal Road,
Leeds,
LS12 2TU
Tel. +44 8701 200 200
www.farnell.co.uk
6.2.3 Pin Connections
The Wet Sensor output is a normally open relay contact closure connected
between pins 1 and 2 of the 2 pin connector. Neither of these pins has any
power on them they are just the relay contacts. Pins 1 and 2 are open circuit
when out of water and connected together when in water.
6.3
RS485 (9 way 'D' type)
The RS485 serial cable connects between the Electronics Processing Unit and the
RS485/USB Adapter. Normally the RS485/USB adapter is mounted internally in the
EPU enclosure, however, it may be removed to extend the telemetry to up to 100m
between the EPU and the PC. The connectors used into the RS485/USB adapter are 9
way male and female “D” types. The following pins are connected.
Male Pin 1
(Data –ve)
Female Pin 1
Male Pin 2
(Data +ve)
Female Pin 2
Male Pin 5
(0v shield)
Female Pin 5
___________________________________________________________________________
©Copyright Marine Electronics Ltd.
Page 27 of 27