1
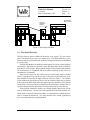
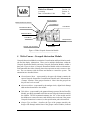
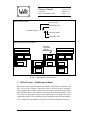
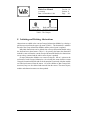
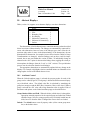
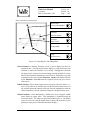
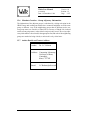
Waltz User Manual
Technical Report 22-96
Dr. Jonathan C. Roberts
Computing Laboratory,
University of Kent,
Canterbury,
Kent, CT2 7NF, UK
19 December, 1996
0-1
Waltz User Manual
Version: 1.0
Section: 0
Page : 0-1
J.C.Roberts
Date: 19 December, 1996
Contents
1 Introduction
1.1 Introduction to Visualization
1.1.1 To Look Further . .
1.2 Introduction to Waltz . . . .
1.3 The Waltz Metaphor . . . .
1.4 The Waltz Hierarchy . . . .
.
.
.
.
.
.
.
.
.
.
.
.
.
.
.
.
.
.
.
.
.
.
.
.
.
.
.
.
.
.
2 A Waltz Session
2.1 Starting . . . . . . . . . . . . . . . . .
2.2 Finishing . . . . . . . . . . . . . . . .
2.3 Loading Data . . . . . . . . . . . . . .
2.3.1 The Waltz information file . . .
2.3.2 Data Preparation . . . . . . . .
2.3.3 Marching Cubes Lookup Table .
2.4 A Simple Session . . . . . . . . . . . .
2.5 The Waltz Canvas Bitmaps . . . . . . .
.
.
.
.
.
.
.
.
.
.
.
.
.
.
.
.
.
.
.
.
.
.
.
.
.
.
.
.
.
.
.
.
.
.
.
.
.
.
.
.
.
.
.
.
.
.
.
.
.
.
.
.
.
.
.
.
.
.
.
.
.
.
.
.
.
.
.
.
.
.
.
.
.
.
.
.
.
.
.
.
.
.
.
.
.
.
.
.
.
.
.
.
.
.
.
.
.
.
.
.
.
.
.
.
.
.
.
.
.
1-1
. . . . . 1-1
. . . . . 1-1
. . . . . 1-1
. . . . . 1-2
. . . . . 1-3
.
.
.
.
.
.
.
.
2-1
2-1
2-1
2-1
2-1
2-2
2-2
2-3
2-4
.
.
.
.
.
.
.
.
.
.
.
.
.
.
.
.
.
.
.
.
.
.
.
.
.
.
.
.
.
.
.
.
.
.
.
.
.
.
.
.
3 Waltz Canvas – Data File Module
3-1
4 Waltz Canvas – Grouped Abstraction Module
4-1
5 Waltz Canvas – Numbering Scheme
5-1
6 Generalizing the Data – Grouping
6-1
6.1 Grouper Control Variables . . . . . . . . . . . . . . . . . . . . . 6-1
6.2 Naming/ Numbering the Generalized Data . . . . . . . . . . . . . 6-1
7 Specializing the Data – Export
7-1
8 Initiating and Deleting Abstractions
8-1
9 Linkage Types
9.1 Linked Highlight . . . .
9.2 Linked Global Transform
9.3 Linked Group Transform
9.4 Linked Attribute List . .
9.5 Linked Data Probes . . .
.
.
.
.
.
.
.
.
.
.
.
.
.
.
.
.
.
.
.
.
.
.
.
.
.
.
.
.
.
.
.
.
.
.
.
.
.
.
.
.
.
.
.
.
.
.
.
.
.
.
.
.
.
.
.
.
.
.
.
.
.
.
.
.
.
.
.
.
.
.
.
.
.
.
.
.
.
.
.
.
.
.
.
.
.
.
.
.
.
.
.
.
.
.
.
.
.
.
.
.
.
.
.
.
.
.
.
.
.
.
9-1
9-2
9-2
9-2
9-2
9-4
10 Abstract Displays
10-1
10.1 Attribute Control . . . . . . . . . . . . . . . . . . . . . . . . . . 10-1
10.2 Controlling the One Dimensional Abstraction . . . . . . . . . . . 10-2
Waltz User Manual
Version: 1.0
Section: 0
Page : 0-2
J.C.Roberts
Date: 19 December, 1996
10.3 Controlling the Two Dimensional Abstraction . . . . . . . . . . . 10-3
10.4 Controlling the Three Dimensional Abstractions . . . . . . . . . . 10-4
11 User Hints
12 Under the Surface
12.1 Coding and Libraries . . . . . . . . . . . . . . . .
12.2 Known Bugs and Limitations . . . . . . . . . . . .
12.3 The Grouping Algorithm . . . . . . . . . . . . . .
12.4 The Merging Algorithm . . . . . . . . . . . . . . .
12.5 Metadata Creation – Group Information . . . . . .
12.6 Metadata Creation – Group Adjacency Information
12.7 Author Details and Contact Address . . . . . . . .
References
11-1
.
.
.
.
.
.
.
.
.
.
.
.
.
.
.
.
.
.
.
.
.
.
.
.
.
.
.
.
.
.
.
.
.
.
.
.
.
.
.
.
.
.
.
.
.
.
.
.
.
.
.
.
.
.
.
.
12-1
12-1
12-1
12-3
12-3
12-4
12-5
12-5
12-1
Waltz User Manual
J.C.Roberts
Date: 19 December, 1996
Version: 1.0
Section: 1
Page : 1-1
1 Introduction
This Document describes relevant information to understand and control the Waltz
Visualization System.
1.1 Introduction to Visualization
The term Visualization is commonly used with computer graphics to describe a picture on a computer screen; however, visualization is more than a “pretty picture”.
Visualization is about forming an image or picture, allowing the viewer to create a
mental image of the object, to perceive, and form insight into, the underlying data.
The process of converting data into images has been a tool for scientists for
many years. Even before the use of computers, charts and diagrams were created
and used to gain insight into and understanding of data. Computers provide functionality to generate and process vast quantities of data, generating mappings and
displaying the visualization at interactive speeds.
1.1.1
To Look Further
Visualization is a rapidly growing area; for more information on visualization and
graphics techniques refer to the following list of periodicals and books.
Visualization:
Graphics:
Virtual Reality:
“Volume Visualization” [Kau91]
“Introduction to Visualization” [EW92]
“Proceedings of the IEEE Conference on Visualization —
IEEE Computer Society Press”: Annual conference proceedings [BE94]
“Visual Cues – Practical Data and Visualization” [KK93]
“Computer Graphics — Principles and Practice (Second
Edition)” [FvDFH90].
“Advanced Animation and Rendering Techniques”,
[WW92]
“Computer Graphics and Applications” — IEEE Computer Society – Bimonthly Scientific Journal.
“The Science of Virtual Reality and Virtual Environments” [Kal93].
“Pictorial Communication in Virtual and Real Environments” [Ell91].
1.2 Introduction to Waltz
The Waltz visualization system [Rob95] provides mechanisms to display and explore three dimensional spatial data sets; often known as Volume Data. The Sys-
Waltz User Manual
J.C.Roberts
Date: 19 December, 1996
Version: 1.0
Section: 1
Page : 1-2
tem provides tools that hierarchically disect the data into a series of parts (known
as groups) of the data. The groups being manipulated, transformed and further
divided.
Volume data can be sampled from ‘real life’ objects, the human body or machined parts for example, being generated from Magnetic Resonance Imaging
(MRI) or Computer (Axial) Tomography (CT) scans. Spatial Volume Data can
also be generated using Simulation and Mathematical Evaluation techniques.
1.3 The Waltz Metaphor
The name Waltz is taken from the music time of three parts in four. The system was
named Waltz because it operates with three parts: Generalization, Specialization
and Abstraction.
The Generalization process groups (clusters) the data into similar regions, and
can reduce the level of detail. Multiresolution modelling, as Nielson [Nie94] states,
can benefit scientific data analysis, for example “browsing through a large data
set, it is useful to zoom in for detail and zoom out for context”. Clustering as
Hagen [Hag94] states reduces the amount of data by “grouping similar objects
by optimizing criterion function or other object-dependent properties”. After any
generalization the data is displayed within Waltz by a number of abstractions.
The Specialization process reduces the amount of data by selecting subsets
of the generalized data creating a tree (fan-out) hierarchy where the data is read
in, generalized and then specialized into smaller subsets of data features. The
user graphically selects specific groups from the generalized data (displayed as
an abstraction) creating a new specialized data set. Each subsequent specialized
dataset can then be further generalized and specialized. The data is automatically
displayed after specialization in a number of abstractions.
The Abstractions display aspects of the information (from the generalization),
where some of the information can be lost or augmented to facilitate the understanding of the data. There are different levels of abstraction, from very abstract
views to those not so abstract. The Generalized data in Waltz is immediately displayed by the nominated abstractions. The abstract views can remain throughout
the visualization process representing a graphical visualization history. The user
can interact between the abstractions, where one abstraction can control the views
and status of another abstraction; providing the user with insight into the relationship between these different abstractions.
The graphical user interface can be described as the fourth part of the Waltz
system controlling the complete operation and functionality of the visualization
system. The user interface controls the hierarchical segmentation (generalization),
user defined disection (specialization) and manipulation (Linkages) between multiple views (abstractions) of the data.
Waltz User Manual
J.C.Roberts
Date: 19 December, 1996
Grouped
Abstraction
Modules
Data File Module
Version: 1.0
Section: 1
Page : 1-3
Specialization
Level, number:
Data File Module
1
2
3
4
Figure 1: Waltz Right Side Rule
1.4 The Waltz Hierarchy
The Specialization process defines the hierarchy of the system. The user selects
parts of the data that are exported to another level. The Waltz hierarchy is a tree
formation (fan-out) and at each node of the tree multiple abstractions can be defined
to view the data.
The Data File Modules are displayed at the highest level (root) on the graphical
user interface, displaying the file name, group file name and a menu to terminate
(kill) the life of the widget. When a parent module is killed all the child modules
(in the hierarchy) are terminated and the modules remaining on the canvas are
automatically repositioned.
Waltz forces a Right Side Rule on the layout of each module, where each first
child of a parent lines up with the left side of the parent widget and each of the
other children are forced to the right of that one child, see Figure 1. The children
of the children are placed likewise first to line up with the parent, then to display
to the right of the older child and to the right of any other children (of this parent)
that are older. The layout consists of multiple levels and columns. Another data set
would be displayed on the right of the most right child of the previous data set.
Each Grouped Abstraction module can contain multiple abstractions (of the
same or different type). The user can create and kill the abstraction modules contained within a Grouped Abstraction module, so it automatically expands and contracts to contain the abstraction. The other modules in the canvas appropriately
move to accommodate the expanded module.
Waltz User Manual
J.C.Roberts
Date: 19 December, 1996
Version: 1.0
Section: 2
Page : 2-1
2 A Waltz Session
The waltz session initiates a Waltz canvas, allowing data to be loaded, generalized
(segmented), specialized and manipulated.
2.1 Starting
The session is started by typing the command:
% waltz
2.2 Finishing
The session is ended by selecting the Quit option from the Quit menu at the top
of the Waltz canvas; or by typing Alt q (the hot key configuration of the menu
command).
2.3 Loading Data
Three dimensional Data files can be loaded into Waltz using the Data menu pulleddown from the Load menu option on the top of the Waltz canvas. The Waltz system
reads specific Waltz data files with a specific string Waltz.1.0 at the top of the file.
Loading a data file creates a Data File module (shown in light-pink on the Waltz
canvas) at the top of the canvas.
2.3.1
The Waltz information file
The Data File module reads specific Waltz Data files. The Waltz Data File is a
metafile, containing the whereabouts, dimensions and aspect ratio of the data file
(in the correct slice-by-slice format). The Waltz Data File consists of keywords
with arguments that can occur in any order. The Waltz Data file must contain:
1. the ‘magic’ character string “Waltz.1.0”, as the first string in the file, to guarantee the file is of the correct format.
2. the keyword “DataFile: complete-path”, describing the whereabouts of the
actual data file, given as a complete path.
3. the keywords “Xdim: XX”, “Ydim: XX” and “Zdim: XX” describing the
dimensions of the data file. The characters XX are exchanged for a value of
the dimension.
4. A Marching Cubes Lookup table is represented by the keyword “MCDataFile:
complete-path”. The format of this file is explained in section 2.3.3. If the
surface Abstraction is not used this keyword can be omitted.
Waltz User Manual
J.C.Roberts
Date: 19 December, 1996
Version: 1.0
Section: 2
Page : 2-2
The Waltz Data file has some optional keywords that can be included to increase
the functionality and correctness of the system, including:
1. Aspect ratio is represented by “XAspect: XX”, “YAspect: XX” and “ZAspect: XX”.
2. The structure width of the Bounding Cube parts (for the Bounding Cube
Abstraction) is represented by “BCOuterWidth: XX”. The default value is
0:125.
3. Comments can be added by using the symbol “# ”. All the characters following the hash symbol to the end of line are ignored.
2.3.2
Data Preparation
The actual data is stored in a slice-by-slice format, providing a fast and effective
method to read, write and search for individual slices. Each slice represents a
double array of Short Integer numbers and the three dimensional data is stored as
blocks of slices. The short integers are stored in a Big endian style conforming to
the SUN SPARC and Silicon Graphics Indy formats. The data is changed into this
format, and referenced by the “DataFile” keyword.
2.3.3
Marching Cubes Lookup Table
Waltz generates the surface abstraction (see section 10.4, page 10-4) using a version of the Marching cubes algorithm, after Lorensen and Cline [LC87]. The algorithm places surfaces through cubes of data bounded by eight vertex positions.
The surfaces are generated via an index of the eight vertices; the index is used to
look up the respective values in a table.
The lookup table is generated from a set of 23 initial representations1 that are
rotated to create the 256 sized table and include information about the index value,
polygons (to generate the surface), triangles (for each polygon), the direction (to
find the next surface) and the number of surfaces through the voxel.
1
The voxel representations are rotated to form the 256 table of values. 23 initial representations
are used with three rotation functions (one for each axis); the initial representations are formed from
15 initial cases (as defined from the Marching cubes algorithm [LC87]) and 8 inverse cases; 7 more
cases could be defined, but these represent the cases where four (out of eight) vertices of the cube
are inside the object and are self-inverse cubes (where the inverse cube can be formed from multiple
rotation operations).
Waltz User Manual
J.C.Roberts
Date: 19 December, 1996
Version: 1.0
Section: 2
Page : 2-3
2.4 A Simple Session
This section describes a simple Waltz session consisting of one Data File module
with two Grouped Abstraction Modules (Figure 2). The simple session is generated
from the following steps:
1. Start a Waltz Session. Resize the window to about quarter the screen size.
2. Select the Data Menu (under Load menu).
3. Double click the mouse button on the required file, or select the file (using
the left mouse button) and select the OK button.
4. Export the Data to generate a new Grouped Abstraction Module. Use the
right mouse button to select the Export new menu on the Export button of
the Data File Module.
5. Select the Closest Value grouper from the Groupers Menu (excluding group
numbers ‘0’ and ‘1’).
6. Edit the Number of Groups and Closest Value fields to values “20” and
“400” respectively. Select the Accept button to initiate the grouper action
and wait for the grouper to finish.
7. Select the List 1D abstraction from the Abstractions menu on the Grouped
Abstraction Module.
8. Select elements 2 to 19 inclusive from the List abstraction; by selecting element number 2 and then shift selecting element 19 (select, shift select-add
method).
9. Use the right mouse button on the Export button (of the Grouped Abstraction Module) to Export new the data to the next specialization level (that
generates a new Grouped Abstraction Module).
10. Select the Surface 3D option from the Abstractions menu (in the second
Grouped Abstraction Module) to initiate the Surface Abstraction.
11. Select the List 1D option from the Abstractions menu (in the second Grouped
Abstraction Module) to initiate the Surface Abstraction.
12. Add the Jack manipulator, by pressing the middle button on empty space (in
the Surface Abstraction window).
13. Manipulate the three dimensional image using the Jack Manipulator.
14. Select the list elements 7 and 12 which in turn highlights up the same groups
in the Surface Abstraction.
Waltz User Manual
J.C.Roberts
Date: 19 December, 1996
Version: 1.0
Section: 2
Page : 2-4
15. Select the Quit option from the Quit menu to finish the Waltz session.
2.5 The Waltz Canvas Bitmaps
The Waltz canvas contains many bitmaps and buttons, hopefully they are all intuitive but for reference and completeness they are described below.
Grouped Abstraction Module Bitmaps
Name
Analogue
Digital
Description
Abstraction menu bitmap, use left mouse button to pull down the list of abstractions.
Spanner
Bitmap
Grouper Tools Action Bitmap (in the form of
a spanner), pull down this menu to control the
actions of the Grouped Abstraction Module.
Paper Clip bitmap to control the Grouper actions for the Grouped Abstraction Module.
Pull down the menu to change the grouper
from None to Closest Value Grouper.
Export bitmap, use the right mouse button to
pull down the menu to Export the (currently
selected) data to the next level. The menu
changes to reflect the state of the Waltz canvas. The numbers of the exporting groups are
numbered from left to right, with the left most
child number 0, for example. All the commands except “Export New” re-export the
data to the child Grouped Abstraction. Export
New generates a new child- Grouped Abstraction.
The Skull and Cross Bone bitmap button kills
the current abstraction; i.e. on selecting this
action with the left mouse button the selected abstraction is removed from the current
Group Abstraction Module.
Grouper
Paper
Clip
Export
Skull and
Cross
Bone
Bitmap
Waltz User Manual
Version: 1.0
Section: 2
Page : 2-5
J.C.Roberts
Date: 19 December, 1996
Grouper
Waltz Canvas
Data File
Module
List
Abstraction
Grouped
Abstraction
Module
Surface Abstraction
List
Abstraction
Jack
Manipulator
Selected
Groups
Figure 2: A Simple Session
Waltz User Manual
Version: 1.0
Section: 2
Page : 2-6
J.C.Roberts
Date: 19 December, 1996
Data File Module Bitmaps
Name
File
Action
Arrow
Export
Description
File Action bitmap, use the left mouse button
to pull down the actions associated with the
Data File Module.
Export bitmap, use the right mouse button to
pull down the menu to Export the Imported
data to a new grouped Abstraction module.
Bitmap
Grouper Associated Bitmaps
Name
Description
Closest
Value
Grouper
The Closest Value grouper segments the data
into groups defined by the closeness of each
data value with its neighbour value. A
6-connectivity three dimensional neighbourhood is used. The groups are then merged together into a user defined number of groups.
The ‘None’ bitmap describes that the groups
are being inherited from the previous level;
i.e. there is no grouper defined on the current
path and level.
The accept bitmap button initiates the grouper
function to group the current data using the
described values.
None
Accept
Iconised
Bitmap
Displayed
Bitmap
Waltz User Manual
J.C.Roberts
Date: 19 December, 1996
Version: 1.0
Section: 2
Page : 2-7
Abstraction Bitmaps
Abstraction
Name
List
Viewed
Dim.
1D
Description
Slice
2D
BoundCube
3D
Net-Display
3D
Skeleton 18
3D
Skeleton 6
3D
Skeleton representation of
the generalized data, using
the 6-Connectivity rule.
Surface
3D
Surface representation of
the data, using a version of
the Marching Cubes Algorithm.
Displays a name (in a Motif list formation) for each
group in the current generalization/ specialization.
Two dimensional slices
through the data; being
sliced along the Z axis (in
and out of the screen).
Displays bounding boxes
that enclose the generalized
groups.
Represents the groups as
spheres positioned at the
center of gravity of each
group.
The radius is
proportional to the inverse
square of the amount of elements within the particular group. The adjacent
groups are connected together with lines.
Skeleton representation of
the generalized data, using
18-Connectivity rule.
Iconised
Bitmap
Displayed
Bitmap
Waltz User Manual
J.C.Roberts
Date: 19 December, 1996
Version: 1.0
Section: 2
Page : 2-8
Linkages Bitmaps
Name
Description
Linked
Attributes
Button and bitmap (for the groups that are locally linked) to popup the window to control
the material type of each group.
Button and bitmap (for individual groups) to
popup the window to control the material type
of each group. The button can only be toggled (popping up and down the attributes window) when the button is not rubbed-out!
Data Probes provide functionality to point and
probe the data. The Pointing probe is implemented by Selection (see Linked Selection) and one other probe to jointly control
the slice number on the two dimensional slice
viewer is implemented.
Global Transformation applies a manipulator
to the scene, being controlled by the user to
rotate, scale and translate the whole (complete) view.
Like Global Transform, this applies a manipulator to the scene. The user controls individual, three dimensional, groups of data.
Change
Attributes
Linked
Data
Probes
Linked
Global
Transform
Linked
Group
Transform
Linked
Selection
The user selects one or more items using (usually) the left mouse button. The selection can
be controlled uniquely for one abstraction or
locally for all the linked abstractions. Whatever is selected locally is chosen when an export request is made.
Local Self
Linked Linked
Waltz User Manual
J.C.Roberts
Date: 19 December, 1996
Data Tools Menu
Version: 1.0
Section: 3
Page : 3-1
Data Export Request
Data File Name
Data Group File Name
Figure 3: Waltz Data File Module
—————————————————–
3 Waltz Canvas – Data File Module
There is one Data File module per Data path holding a copy of the data being
visualized. The File menu “Load”, on the top of the canvas, pulls up a browser to
load in the appropriate Waltz data file. Data (and other information) is read into
Waltz and the Data File module is automatically displayed on the canvas. Figure 3
shows a Data File Module. It consists of two functions:
Data Tools Menu provides tools to control the Data. Waltz currently supports
only one tool in this section, providing functionality to kill the Data File
module and all the children. Other functions to “load” and “save” group data
could be incorporated in this menu.
Data Export Request creates a popup menu to control the export of data from
the current level (Data File Module) to the next. The menu displays a series
of ‘Export X’, to export the data to a current Grouped Abstraction Module
(named X, where X is an integer), with one ‘Export New’ to create a new
Grouped Abstraction Module.
with two textual output displays:
Data File Name describes the file name (and path) of the current data file.
Data Group File Name displays the name of a group File, where ‘none’ is
the the default file name; this is currently not implemented and so always
displays ‘none’.
Waltz User Manual
J.C.Roberts
Date: 19 December, 1996
Version: 1.0
Section: 4
Page : 4-1
Export Request
Module Reference Number
Local Attributes
Links Status
Generalization Menu
Abstraction Menu
Tools Menu
Kill Abstraction
Grouper Type and State
Abstractions
Figure 4: Waltz Grouped Abstraction Module
—————————————————–
4 Waltz Canvas – Grouped Abstraction Module
Grouped Abstraction Modules contain the Generalization and Specialization methods and the display Abstractions. There can be multiple abstractions within the
Grouped Abstraction Module and many Grouped Abstraction Modules within a
data path. Figure 4 shows a Grouped Abstraction Module with two abstractions.
Each annotation describes a bitmap picture that represents an active menu or a button. The user interacts with the menus and buttons to control the system. The
annotations are described below:
Generalization Menu – (represented by the paper clip bitmap) controls the
current Grouped Abstraction Generalization function and is nicknamed the
‘Grouper’ function. If the grouper function is ‘None’ then the groups from
the previous levels are used.
Abstraction Menu – (represented by the analogue-clock, digital-clock bitmap)
adds another abstraction to the module.
Tools Menu – (represented by the spanner bitmap) operates like the Data File
Module, providing commands to kill the current Grouped Abstraction and all
the children. The kill command terminates the ‘life’ of the module and all
the children are removed because each child becomes irrelevant if the parent
Grouped Abstraction is removed, as the specialization path is hierarchical.
Grouper Type and State – describes the Type of the grouper (noted by the
design of the bitmap) and the State of the grouper control window (iconized
Waltz User Manual
J.C.Roberts
Date: 19 December, 1996
Version: 1.0
Section: 4
Page : 4-2
or currently displayed). When the grouper is iconized the bitmap is ‘rubbed
out’.
Export Request – operates like the Export Request in the Data File Module, providing a functionality to export the specialized data to new Grouped
Abstractions Modules or to existing Modules.
Global Attributes – activates a popup window displaying the current global
attributes within the module.
Links Status – describes the state of each link for Close Correlation. Each
bitmap describes one of the Link methods and the bitmap design determines
if the correlation is ‘local’ or ‘self’ (see forward).
Kill Abstraction – kills the particular abstraction.
Abstractions – describe the Type and State of the abstraction. Figure 4
shows two abstractions one represents a Slice Abstraction (the bread and
knife bitmap) and the other a surface over the data.
Module Reference Number – describes the version of the particular Grouped
Abstraction Module and Abstraction; describing the data file version, specialization level, specialization path and abstraction number. This is fully
explained in section 5.
Each abstraction (within a Grouped Abstraction) creates a visualization (or an
abstraction) in a popup window. These popup windows can be iconised into the
Grouped Abstraction module, depicted by a ‘rubbed out’ bitmap representation of
the Abstraction Type.
Waltz User Manual
Version: 1.0
Section: 5
Page : 5-1
J.C.Roberts
Date: 19 December, 1996
Naming Scheme Fields
Data File Version
Specialization Level
Abstraction number = 1 . 2 . 1 . 1
Abstraction Number
Specialization Path
Naming Scheme Canvas Example
Grouped
Abstraction
Modules
Data File Module
0.1.0.0
0.2.0.0
0.1.0.1
0.2.1.0
Data File Module
0.1.1.0
1.1.0.0
0.2.2.0
1.2.0.0
0.3.0.0
1.1.0.1
1.3.0.0
Figure 5: Waltz Module Naming Scheme
5 Waltz Canvas – Numbering Scheme
Waltz names each of the abstractions and modules using numbers separated with
dots. The top part of Figure 5 shows how each of the four fields are generated
and the bottom part of Figure 5 depicts how an example representation is mapped
onto the Waltz canvas. Each Data File and Grouped Abstraction Module, as the
user creates the generalized and specialized data paths on the Waltz canvas, get
appropriately named. The remaining modules and abstractions within the modules
are re-named when any module (or part there of) is killed or deleted from canvas.
Waltz User Manual
J.C.Roberts
Date: 19 December, 1996
Version: 1.0
Section: 6
Page : 6-1
Figure 6: The Grouper
6 Generalizing the Data – Grouping
6.1 Grouper Control Variables
The Grouper is controlled using two integer variables: the Number of Groups and
the Closest Value, see Figure 6.
The “Closest Value” field provides the alpha or closeness value for the region
growning function. The region growing function generates a group of data points,
where each neighbour is joined to another data point if their value difference is less
or equal to the alpha value.
The “Number of Groups” field describes how many groups are required. The
grown groups are individually merged together until the required number of groups
is reached. This merging stage is often slow, especially if the amount of groups are
large and the required number of groups (after the merging stage) is small; (this
could be sped up but inaccuracies may be incorporated into the data).
The number of groups required by the user is the upper limit. The algorithm
may not be able to generate the amount of groups the user has specified; so the
grouper generates the number of groups up to the user specified value. The merging
stage cannot merge the groups into a larger number of groups generated from the
“Closest Value Region Growing” algorithm! A Zero in the ‘number of groups’ field
omits the merging stage producing the maximum number of groups for the current
closest value (which may be a large number and could take a while to generate the
group information).
If the grouper is changed from “Closest Value Grouper” to “None” then the
groups are inherited from the previous specialization level. If there are no groups
defined on the parent level then the default situation (of two groups) is used.
6.2 Naming/ Numbering the Generalized Data
Waltz uses an integer number scheme to name each of the groups that have been
generalized by the Closest Value grouper. Each of the groups are allocated an
integer name, starting from number ‘2’. Groups ‘0’ and ‘1’ are reserved groups.
Group ‘0’ represent the values within the data that are ‘un-selected’. Group ‘1’
is known as the default group representing values that are not ‘named generalized
Waltz User Manual
J.C.Roberts
Date: 19 December, 1996
Version: 1.0
Section: 6
Page : 6-2
groups’ and not ‘un-selected’ data points. Group ‘1’ is used in the calculation and
manipulation of the groups and often contains no elements but has been left for
historic reasons.
Each of the generalized groups (named from group ‘2’ upwards) are guaranteed
to be contiguous, where each of the elements within a specific group are joined by
at least on neighbour (using 6 connectivity) to another element within the group.
However groups ‘0’ and ‘1’ contain the default and un-selected data elements and
need not be connected to each neighbour (they often contain fragmented data elements).
The names of the groups are allocated by order of size, so the group with the
least amount of elements is named as group ‘2’.
Waltz User Manual
J.C.Roberts
Date: 19 December, 1996
Version: 1.0
Section: 7
Page : 7-1
7 Specializing the Data – Export
To export the data use the right mouse button on the
bitmap.
Data Export can be initiated at several positions within the Waltz canvas, to (1)
export the original data (from the Data File Module); (2) export the Specialized
data from the Grouped Abstraction Module creating a new Grouped Abstraction
module and (3) to re-export (export over) the data to a current Grouped Abstraction
module.
When the original data is exported the first Grouped Abstraction module is
created. This module holds the data, data structures and methods to manipulate the
data and control the views of the data (abstractions). Initially groups ‘0’ and ‘1’
are defined. Group ‘0’ contains the full data as one contiguous group.
When the Grouper on any Grouped Abstraction module has been initiated the
groups are defined by the values returned by the grouping algorithm, including the
two reserved groups. Abstractions can be displayed and selections made on the
groups. When the data is Exported to another Grouped Abstraction module the
groups that are currently selected are copied through to the next Grouped Abstraction module. Each of the groups that were ‘un-selected’ are merged into group ‘0’
and the selected groups are re-named (in their current order) starting at group ‘2’.
The Export Over command updates the information in the requested child
Grouped Abstraction Module. If no groups are selected, for both the Export New
and Export Over commands, a complete copy of the current specialization level is
copied to the next level.
Waltz User Manual
J.C.Roberts
Date: 19 December, 1996
Paper Clip
(Grouper Menu)
Version: 1.0
Section: 8
Page : 8-1
Skull and Cross-bone
(Kill this Abstraction)
Table 1: The Grouper
8 Initiating and Deleting Abstractions
Abstractions are added to the current Grouped Abstraction Module by selecting a
pull down section from the paper clip menu (Table 1). The abstraction is added to
the end of the Group Abstraction Module and the canvas layout is updated.
Individual abstractions can be deleted from a Group Abstraction Module using
the skull and cross-bone button: (Table 1). On pressing the button the abstraction
method is removed from the current Grouped Abstraction Module, the abstractions
are moved up, renamed and the whole canvas layout is updated.
Grouped Abstraction Modules are removed using the ‘kill me’ option on the
tool menu of each Grouped Abstraction. On selecting this menu item the current
Grouped Abstraction Module and all the abstractions associated with that module
are killed and removed from the canvas. All of the children of that Grouped Abstraction (if any) are also deleted and removed from the canvas. The canvas layout,
module and abstraction names are then updated.
Waltz User Manual
J.C.Roberts
Date: 19 December, 1996
Version: 1.0
Section: 9
Page : 9-1
Self Linked Attributes
Popup Window.
Local Linked Attributes
Popup window.
Waltz Canvas.
Figure 7: Local and Self Linked Attributes Popups
9 Linkage Types
Selecting the “Local Attributes” button within the Grouped Abstraction Module
(Figure 4) initiates a popup ‘form’ to change the state of the Linkages (Figure 7).
The linkage types are toggled between Local (the default state) and Self linking
scopes. Self linking guarantees that alterations to the abstraction effect only one
abstraction; local linking provides a mechanism to ‘side effect’ any other Linked
Abstraction (within one Grouped Abstraction module).
The ‘form’ consists of five multiple radio-buttons that can switch state between
Local and Self. The state of each Linkage is abbreviated into a Link Status symbol,
with five parts representing each linkage. If the Link state (for any Linkage) is
‘Self’ the individual bitmaps are shown circled.
Waltz User Manual
J.C.Roberts
Date: 19 December, 1996
Version: 1.0
Section: 9
Page : 9-2
There are five linkage types that are explained in the following sections. The
control of Linkages for specific abstractions are explained when the abstractions
are described (section 10).
9.1 Linked Highlight
This allows the same data elements to be selected between views. Selecting a
group exchanges the groups material type with the current ‘Selected Material’ type
as described by current (Self or Local) state of the Linked attributes.
The Linked Specialization process is overloaded onto the Linked Highlight
process. A specialization is created when parts of the data are exported to another
specialization level.
9.2 Linked Global Transform
This allows the user to transform the whole view between abstractions. Only the
three dimensional views are affected. A manipulator controls the transformations,
being applied to the three dimensional scene by selecting the middle mouse button
on ‘empty space’ in the view.
Rotation is one such transformation that allows the user to rotate abstractions,
to the same orientation, directly controlled from one view. Other transformations
include: scale and translation.
9.3 Linked Group Transform
This allows a transformation to be allocated to a specific group. The manipulator
and hence transformations are applied to all of the corresponding three dimensional
views having local Group Transform Linkages. This transformation is useful if a
group is obscuring another group, and the group is moved away from the surrounding elements.
9.4 Linked Attribute List
The color, transparency, and appearance of the groups can be dynamically altered.
The Attribute List also controls the appearance of the objects for the Linked Highlight operation.
button, when
Self Linked attributes are changed by selecting the
the select button on the Linkages Form is in the Self position.
button on the Grouped
Grouped Linkages are changed by selecting the
Abstraction Module generating the Linked Attributes Popup (Figure 8).
Waltz provides default attributes for the groups (the group names are associated
with values of hue). The Selected and Un-selected groups are differentiated by a
Waltz User Manual
Version: 1.0
Section: 9
Page : 9-3
J.C.Roberts
Date: 19 December, 1996
Move slider or edit
field to change the
group number.
Select ON
attribute Controls.
Select OFF
attribute Controls.
‘Accept’ to Manually
update the attribute
information.
Use ‘Edit Color’
Buttons to generate
the Color Editor.
Figure 8: Waltz Linked Attributes Popup
Waltz User Manual
J.C.Roberts
Date: 19 December, 1996
Version: 1.0
Section: 9
Page : 9-4
high and low level of color saturation. In practice any user-defined material type
can be applied to any group.
9.5 Linked Data Probes
The position of data probes and pointing devices are linked between views. Currently the two dimensional slice abstraction uses probe links to describe the slice
position. Selecting Self Linking probes from the Link Form allows multiple slice
abstractions to show different slice positions.
Waltz User Manual
J.C.Roberts
Date: 19 December, 1996
Version: 1.0
Section: 10
Page : 10-1
10 Abstract Displays
Waltz (version 1.0) supports seven abstract displays, over three dimensions:
1
2
3
4
5
6
7
Name:
List
Slice
Bounding Cube
Net-Display
Skeleton 6 Connectivity
Skeleton 18 Connectivity
Surface
Dimension:
1
2
3
3
3
3
3
The abstractions of similar dimension are controlled similarly and are described
below in sections of dimensionality. The linkages are automatically connected between each abstraction; however some of the linkage types don’t effect the abstractions (they make no sense in the dimensionality of the abstraction); the one
dimensional list abstraction, for example, has no effect when the Global or Group
Transformations are changed. Abstract linkages such as these could be implemented, but are not used within this version of Waltz. To individually change an
abstraction the “Self” option is chosen on the linkage form; toggling the switch position updates the linkages from the ‘Local’ to ‘Self’ versions. The specialization
process uses the selections from the local linkages.
The appropriate abstractions are automatically updated after any change to the
displays. For example, a highlight selection command initiates an immediate color
change update in each of the linked abstract views.
10.1 Attribute Control
When the Linked Attribute popup is selected the property nodes for each of the
groups can be edited (Figure 8). Each group is allocated a different material property with default values. The default color Hue is calculated by translating the
group into an angle round the HSV (Hue, Saturation, Value) color wheel. When a
group is selected the ‘ON’ color with a large Saturation value is applied. Each of
the buttons and options on the Linked Attribute popup are described below:
Group Number Slider and Field. When the slider (or field values) is changed the
appropriate material properties for the required group are loaded into Linked
Attribute Popup. Note, the wrong properties may be initially loaded into the
slider, however when the slider is changed the correct values are loaded.
Default. The default button resets all property nodes (of the current group number) to the default values.
Waltz User Manual
J.C.Roberts
Date: 19 December, 1996
Version: 1.0
Section: 10
Page : 10-2
Figure 9: The List Abstraction
Material Fields. The four material color fields of: ambient (Amb), diffuse (Diff),
specular (Spec) and emissive (Emis) and the two material attributes of Shininess and Transparency can each be edited.
Edit Color. The Edit Color buttons select a Material Editor popup. The popup
supports HSV and RGB (Red Green Blue) color editing. The check boxes
allow multiple colors to be edited together and the radio buttons (diamonds)
allow one field to be edited.
Edit. The Edit menu provides five sub options of:
Material List. The Material list provides a list of color palettes that can be
selected.
Continuous or Manual. This radio button describes how the material properties are updated to the Groups. When Manual is selected the Accept
button is used to update the material properties of the group.
Copy. The copy function is used to copy the material attributes to the copybuffer. Copy and Paste are used to transfer the material properties between the ON and OFF Material Editors.
Paste. The contents of the copy-buffer can be pasted into this Material Editor.
Help. The showcase help menu can be initiated using this menu item.
10.2 Controlling the One Dimensional Abstraction
The List abstraction displays the groups in a list formation (Figure 9).
Description The List abstraction displays a list of the group names. A Motif list
widget is used to display the list elements and a OpenGL section is used to
display the (diffuse) colors of each of the groups.
Waltz User Manual
J.C.Roberts
Date: 19 December, 1996
Version: 1.0
Section: 10
Page : 10-3
Figure 10: The Slice Abstraction
General Control The left mouse button is used to scroll the list elements; that
automatically updates the respective color.
Linked Selection The left mouse button is used to select individual groups, the
motif list widget is highlighted and the color bar is appropriately changed.
Multiple values are selected by dragging the mouse over the list area and
additional elements are added (or removed) from the list using the control
(Ctrl) key and left mouse button. Multiple elements within the list can also
be selected by selecting one element and shift-selecting another element (all
of the elements in between the range are selected).
Global Transform Not applicable.
Group Transform Not applicable.
Attributes As above.
Data Probes Not applicable.
10.3 Controlling the Two Dimensional Abstraction
An example of the two dimensional slice abstraction is shown in Figure 10.
Description The two dimensional List abstraction depicts a series of slices (along
the Z axis) of the data.
General Control The viewed slice is altered by sliding the motif scroll bar using
the left mouse button or by entering the slice value in the numeric field (larger
or smaller values are changed to the maximum and minimum slice values,
respectively).
Waltz User Manual
Version: 1.0
Section: 10
Page : 10-4
J.C.Roberts
Date: 19 December, 1996
Bounding Cube Abstraction
Skeleton Abstraction
Surface Abstraction.
Figure 11: The Three Dimensional Abstractions
Linked Selection Individual Groups of the data are selected using the left mouse
button on the slice display. Toggling the groups is achieved using the left
mouse button with the shift key.
Global Transform Not applicable.
Group Transform Not applicable.
Attributes As above.
Data Probes The current slice number of Multiple Slice abstractions within the
same Grouped Abstraction Module are inherantly linked together. These are
unlinked by switching the “Linked Data Probes” buttons on the “Linkages
States” form.
10.4 Controlling the Three Dimensional Abstractions
There are three styles of three dimensional abstraction: Bound Cube, Skeleton and
Surface (Figure 11).
Description of each abstraction:
The Bound Cube abstraction displays a bounding cube round the extremities of each group.
The Skeleton abstraction displays the data as tendril of connecting
cubes maintaining the extremities of the data as the end points on tendril.
The Surface abstraction displays a three dimensional surface representation around the data. The shading calculations are formed from the
orientation of the generalized data.
Waltz User Manual
J.C.Roberts
Date: 19 December, 1996
Version: 1.0
Section: 10
Page : 10-5
Note: Colors have been inverted!
Rotate about
center of Manipulator.
Translate
about X-Z plane.
Translate
along Y axis.
Change Plane.
Alt
Scale
(Uniform scale)
Figure 12: Controlling the Jack-Manipulator
General Control An Inventor Examiner viewer is used to display the three dimensional data. The right mouse button displays a popup menu and extra
functions to control the examiner viewer directly. Through these functions
the image can be centered, moved and enlarged and the method of viewing
altered; these functions should not be used. However, the display is too large
sometimes for the screen, and the Functions – Home menu option followed
by the Functions – View All action are required, but are only to be used as
a last resort!
Linked Selection The left mouse button selects one group, selection ‘Add’ or ‘remove’ being achieved by the Shift key with the left mouse button. However
the selection operation cannot be achieved when the manipulator (from the
Global Transform or Group Transform Linkages) is displayed in the scene.
Global Transform A Jack Manipulator is added to the scene using the middle
mouse button on empty space. This manipulator is controlled using the
left mouse button. The actions are described within Figure 12. The default
values are retrieved using the middle mouse button with the shift key (also
pointing to empty space, within the abstraction display).
Waltz User Manual
J.C.Roberts
Date: 19 December, 1996
Version: 1.0
Section: 10
Page : 10-6
Group Transform The Jack manipulator is added to a specific group by selecting the middle mouse button on the required group. The default values are
retrieved on a specific group by selecting the middle mouse button with the
shift button on a the particular group and all of the values (for each of the
groups) are reset using the middle mouse button with the Alt and Shift Keys
selected on any group.
Attributes As above.
Data Probes Not applicable.
Waltz User Manual
J.C.Roberts
Date: 19 December, 1996
Version: 1.0
Section: 11
Page : 11-1
11 User Hints
After the data is read and before any abstractions are displayed the grouper popup
should be used to generalize the data. However, the abstractions will display the
default data and automatically update the display with the new values. Waltz is
also easier to use if the Auto placement of windows is switched on.
The user is encouraged to simplify (specialize and generalize) and export the
data down through many Specialization Levels generating multiple Grouped Abstraction Modules. The user is encouraged to experiment with the data and use the
Grouped Abstraction Modules to hold past experimentations.
The three dimensional abstractions take longer to generate and use more memory (being more complex). Therefore, the list and slice abstractions should be used
when there are a lot of groups (especially on the numerically lower specialization
levels).
Often the data is surrounded by the members of one group, hence the surface
abstraction would display a bounding surface round the whole data with all the
other groups inside (being obscured by the one group). Other three dimensional
abstractions don’t obscure the internal objects in the same way. Therefore the
surface abstraction is more appropriate at higher levels of specialization. Multiple three dimensional abstractions within one Grouped Abstraction are encouraged
and are defaultly linked together. The Jack Manipulator is useful to rotate and
pull off parts of the abstraction. This is useful when internal parts of one abstraction are obscured (using the surface abstraction, say) but are visible using another
abstraction method, such as the bounding cube abstraction.
Some abstractions display the two reserved groups (0 and 1). Usually these
groups are not exported to the next specialization level.
Waltz User Manual
J.C.Roberts
Date: 19 December, 1996
Version: 1.0
Section: 12
Page : 12-1
12 Under the Surface
12.1 Coding and Libraries
Waltz is currently only implemented for the Silicon Indy Workstations.
The software is written in C++ using the Open Inventor 2.1, Open GL, X11,
Xlib libraries.
12.2 Known Bugs and Limitations
Name
Waltz
File
Name
Grouper
Algorithm
Description
Solution
If there is an error in the waltz Unsolvable.
information file (the data file
path is erroneous, for example)
the system will fail and end immediately.
Description
Solution
Often the grouper takes a long Have patience!
time to finish. This is probably
because there are many groups
to be merged; this could be made
more efficient.
When the data is grouped, ex- Unsolvable.
ported and then grouped again
the session sometimes fails.
The system fails sometimes Unsolvable.
when zero number of groups
(i.e. maximum) are required.
Waltz User Manual
J.C.Roberts
Date: 19 December, 1996
Name
Three
Dimensional
Views
Name
Net–
Display
Name
Memory
Version: 1.0
Section: 12
Page : 12-2
Description
Solution
The image in the three dimen- Reduce the sice of the image
sional view disappears.
using the Manipulator. Or
use the Examiner View Functions to ‘Home’ and then
‘View All’ the image.
The Global and Group Trans- Only use the Global Manipuform manipulators are indistin- lators.
guishable when there is one
group in the display.
The Jack Manipulator center The problem is removed by
does not surround any objects in un-selecting and selecting the
three dimensional space.
manipulator.
If group 1 has been exported the None; but no detrimental efgroup abstraction will display fect.
it as a numbered group, however this group could be empty
have zero data elements. The
Bound Cube and Net-Display
abstractions display the zero
cube with default values (i.e.
width/depth/height or radius of
2) in the default position of
(0,0,0).
When the manipulator is very Don’t make the manipulator
small, the values go out of range too small.
and can then go extremely large.
Description
Solution
The inter group connections Delete and re-start the absometimes do not appropriately straction.
move when a group manipulator
translates the position of a specific group.
Description
Solution
The system does not give back Unsolvable.
all of the memory after creating
and deleting abstractions.
Waltz User Manual
J.C.Roberts
Date: 19 December, 1996
Name
Skeleton
Version: 1.0
Section: 12
Page : 12-3
Description
Solution
The skeleton algorithm (when The algorithm could be sped
there are a large number of up!
groups) is often slow.
12.3 The Grouping Algorithm
The Grouping Algorithm within Waltz is known as the “Closest Value Region
Growing” Algorithm. The algorithm proceeds through five steps (the alpha value
is the threshold value that controls whether neighboring elements are joined as part
of one group). The ‘flood fill’ algorithm is bounded by the alpha value and is
described below:
1. Memory is allocated (GROUP), with the same dimensions as the complete
data array (DATA) and set to all zeros; the current group number is zero
(CGN = 0).
2. The next unvisited seed point (x, y, z) is chosen by searching (from the previously used seed point) until the next GROUP[x, y, z] position is zero. CGN
is incremented.
3. The current point is set as being visited by setting the point GROUP[x, y, z]
to be the current group number (CGN).
4. Each of the adjacent points DATA [x’, y’, z’] are visited and the GROUP [x’,
y’, z’] array is allocated the current group number if the difference between
the adjacent data value and the current seed value (GROUP[x, y, z]) is less
than the defined alpha value. The adjacent points [x’, y’, z’] are defined
using 4-connectivity by [x+1, y, z], [x-1, y, z], [x, y+1, z], : : : [x-1, y-1, z-1].
5. The algorithm recursively visits each of the adjacent points (recursing on
step 4) until there are no more elements to be added within this group, then
the process returns to part 2.
12.4 The Merging Algorithm
Waltz uses a ‘merge score’ system 2 , terminating the merging of the groups when
the number of groups reaches a predefined level. After the groups are ‘grown’
2
A region merging stage is used to merge the small regions into larger subsets. Manos et al
[MCRS93] describe a region merging stage that uses a ‘merge score’. The merge routine joins
together adjacent regions that together have the lowest merge score; their merge score is calculated
from the mean grey level and the standard deviation of the grey level with a size constraint (that
encourages small regions to merge and discourages large regions), and the merging terminates when
there are no merge scores less than a given threshold.
Waltz User Manual
J.C.Roberts
Date: 19 December, 1996
Version: 1.0
Section: 12
Page : 12-4
the adjacency information is calculated; between each pair of adjacent groups the
lowest difference value (closeness value) is stored. The groups are merged into the
adjacent group with the lowest closeness value; the algorithm is defined below:
1. The groups are segmented, as above.
2. The groups are listed by size (number of elements in the group).
3. The smallest group is then merged into an adjacent group with the lowest
closeness value. This is achieved by storing the merged group in a merge
trace, so the calculations of the new group information and new group names
are left to the end of the whole merging process.
4. The smallest sized group is calculated and the process returns to step 3, until
the predefined number of groups is reached.
The region growing phase generates hundreds of groups, that are often merged
into tens of groups, the merge trace is used to rename all of the groups into consecutive group numbers, calculate the new group adjacency information (groups
that have been merged are deleted from the adjacency list, after the information is
included into the remaining groups) and update other group information.
12.5 Metadata Creation – Group Information
Every Grouped Abstraction module stores information of the generalization of the
data (within a GROUP array, see 12.3) and general group information that is stored
for every group, including:
1. the group number, allocated when the group is calculated, representing the
order of calculation;
2. the name of the group (a string representation of the group number);
3. the number of elements within the group;
4. the total amount of all the data values added together;
5. the number of adjacent groups (adjAmount);
6. a list describing information about the adjacent groups (adjGroups) including the closeness values.
Each of these variables are stored by the region growing algorithm. The adjacency information is calculated before the groups are merged together and the
merge process generates a merge trace that is used to add the group information
together between merged groups. The algorithm proceeds in this order, because
the adjacency information is used by the region merging algorithm.
Waltz User Manual
J.C.Roberts
Date: 19 December, 1996
Version: 1.0
Section: 12
Page : 12-5
12.6 Metadata Creation – Group Adjacency Information
The information of the adjacent groups is calculated by visiting each point in the
GROUP array and working out whether the 6-connected neighbors are of the same
group or different. Any of the neighboring groups that are different (to the current group name) are stored in a linked list (in an array of linked lists, indexed
on the current group name), unless it has been previously stored. The reverse adjacency information is also stored (in the appropriate list) and each of the neighboring
groups are marked as being visited, so each node is only visited once.
12.7 Author Details and Contact Address
Author:
Dr. J. C. Roberts
Address: Computing Laboratory,
University of Kent,
Canterbury,
Kent, CT2 7NF
Email
[email protected]
Waltz User Manual
J.C.Roberts
Date: 19 December, 1996
Version: 1.0
Section: 12
Page : 12-1
References
[BE94]
R. Daniel Bergeron and Arie Kaufman Eds. Proceedings Visualization ’94 – Washington D.C., October 17–18, sponsored by the IEEE
Computer Society. IEEE Computer Society Press, 1994.
[Ell91]
S. T. Ellis. Pictorial Communication in Virtual and Real Environments. London: Taylor and Francis, 1991.
[EW92]
R. A. Earnshaw and N. Wiseman. An Introductory Guide to Scientific
Visualization. Springer-Verlag, 1992.
[FvDFH90] James D. Foley, Andries van Dam, Steven K. Feiner, and John F.
Hughes. Computer Graphics — Principles and Practice (Second Edition). Addison-Wesley Systems Programming Series, 1990.
[Hag94]
Hans Hagen. Visualization of large data sets. In L. Rosenblum,
R. A. Earnshaw, J. Encarnacao, H. Hagen, A. Kaufman, S. Klimenko,
G. Nielson, F. Post, and D. Thalmann, editors, Scientific Visualization
Advances and Challenges, pages 187–198. IEEE Computer Society
Press and Academic Press, 1994.
[Kal93]
Roy S. Kalawsky. The Science of Virtual Reality and Virtual Environments. Addison Wesley, 1993.
[Kau91]
Arie Kaufman. Volume Visualization – IEEE Computer Society Press
Tutorial. IEEE Computer Society Press, 1991.
[KK93]
Peter R. Keller and Mary M. Keller. Visual Cues – Practical Data
and Visualization. IEEE Computer Society Press, 1993.
[LC87]
William E. Lorensen and Harvey E. Cline. Marching cubes: A high
resolution 3D surface construction algorithm. ACM Computer Graphics, 21(4):163–169, July 1987.
[MCRS93] G. Manos, A. Y. Cairns, I. W. Ricketts, and D. Simclair. Automatic
segmentation of hand-wrist radiographs. Image and Vision Computing, 11(2):100–111, 1993.
[Nie94]
Gregory M. Nielson. Research issues in modelling for the analysis
and visualization of large data sets. In L. Rosenblum, R. A. Earnshaw,
J. Encarnacao, H. Hagen, A. Kaufman, S. Klimenko, G. Nielson,
F. Post, and D. Thalmann, editors, Scientific Visualization Advances
and Challenges, pages 143–155. IEEE Computer Society Press and
Academic Press, 1994.
Waltz User Manual
J.C.Roberts
Date: 19 December, 1996
Version: 1.0
Section: 12
Page : 12-2
[Rob95]
Jonathan C. Roberts. Aspects of Abstraction in Scientific Visualization. Ph.D thesis, Kent University, Computing Laboratory, Canterbury, Kent, England, UK, CT2 7NF, October 1995.
[WW92]
A. Watt and M. Watt. Advanced Animation and Rendering Techniques
— Theory and Practice. Addison-Wesley, 1992.