1
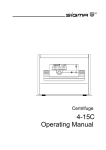
PVC Sustainability Tool User Manual (V1.1) The University of Manchester October 2010 1 2 3 4 5 6 System requirements .................................................................................................. 3 Tool development credits............................................................................................ 3 Acknowledgements..................................................................................................... 3 Introduction ................................................................................................................. 4 PVC Sustainability Tool overview............................................................................... 4 Starting and building a new analysis .......................................................................... 7 6.1 Define the system details.................................................................................... 7 6.2 Defining the processing stage names ................................................................ 8 6.3 Defining the raw materials use ........................................................................... 9 6.4 Defining transport.............................................................................................. 10 6.5 Defining stage details ....................................................................................... 12 6.5.1 Defining material outputs .......................................................................... 12 6.5.2 Defining energy use .................................................................................. 14 6.5.3 Defining packaging use ............................................................................ 15 6.5.4 Defining waste use.................................................................................... 16 6.5.5 Linking the waste use to raw materials .................................................... 17 7 Data Display.............................................................................................................. 20 7.1 Carbon footprint data ........................................................................................ 20 7.2 Value added data.............................................................................................. 22 8 Modifying the database............................................................................................. 24 8.1 Creating a new database record ...................................................................... 24 8.2 Modifying an existing database item ................................................................ 25 8.3 Deleting a database item .................................................................................. 26 9 Loading/Saving data ................................................................................................. 26 9.1 Saving an analysis ............................................................................................ 27 9.2 Loading an analysis .......................................................................................... 27 9.3 Starting new study ............................................................................................ 28 9.4 Deleting an analysis.......................................................................................... 28 10 Examining other environmental impacts .............................................................. 28 11 Data comparison................................................................................................... 30 11.1 Carbon footprint comparison ............................................................................ 30 11.2 Other impact comparison.................................................................................. 31 12 Sharing data between users................................................................................. 32 13 Data quality assessment....................................................................................... 34 Appendix A - Data quality criteria ..................................................................................... 36 A1.1 General about LCA data quality ................................................................... 36 A1.2 Data quality assessment in the PVC sustainability tool................................... 36 2 1 System requirements The PVC Sustainability Tool was designed and built using the English-version of Microsoft Excel 2003 for Windows XP. It may not run properly on non-English operating systems or on older versions of Excel or Windows. The tool is designed for use on PCs and is not suitable for use on Mac computers. Please note that, depending on the speed of your computer, some operations may take longer time to complete. Normally, the hour-glass will indicate that the system is busy. If it appears that there is no response after clicking on an option or action-button or the cursor does not turn into the hour-glass, please wait a few seconds as the system is busy and may take some time to complete the action. 2 Tool development credits The PVC Sustainability Tool has been developed by a research group at The University of Manchester led by Professor Adisa Azapagic. The following researchers were involved in the development of the tool: Dr Anthony Morgan (software development); Dr Heinz Stichnothe (methodology development and case studies); and Dr Haruna Gujba (case studies). For further information, contact: [email protected] 3 Acknowledgements This tool has been developed as part of the EPSRC funded project “Improving Sustainability of PVC through Novel Materials, Processes and Life Cycle Methodologies” (EP/D505372/2). This funding is gratefully acknowledged. The support of the project partners is also gratefully acknowledged, in particular: Ineos ChlorVinyls: Dr Jason Leadbitter and Roger Mottram; Loughborough University: Prof. Bryan Brooks, Prof. Marianne Gilbert and Dr Noreen Thomas; ECOPLAS: Bob Bittlestone and Steve Smith; and Polyflor: Mike Minett and John Whitesmith. 3 4 Introduction The PVC sustainability tool allows quick and easy assessment of environmental and economic sustainability of PVC products and processes. It takes a life cycle approach and it enables estimation of the following environmental impacts: Global warming potential (a.k.a. carbon footprint) Acidification potential Eutrophication potential Ozone layer depletion potential Photochemical smog Human toxicity potential Economic sustainability assessment is related to the estimation of value added along the PVC supply chains. The tool has been developed with the following objectives in mind: to avoid the need to use complex LCA software to calculate environmental impacts; to enable non-expert users to calculate environmental impacts; to allow the user to estimate quickly and easily environmental impacts for a number of different PVC related products and processes following the “80/20” rule (80% of the result with 20% of the effort); to allow the user to identify environmental hot-spots and identify improvement opportunities; to reduce the data collection effort by providing databases on materials, energy, transport, packaging and waste; and to present data in a clear and easy to understand way. 5 PVC Sustainability Tool overview The tool has been developed in Microsoft Excel. It comes with a range of case studies and databases. The case studies include: PVC processes: PVC production; PVC recycling (white chips, jazz chips, jazz pulver); and PVC compounding. PVC products: Blood bags; Windows (steel- and glass-fibre reinforced); Pipes; and Flooring. The databases comprise: Materials; 4 Energy; Transport; Packaging; and Waste management. The worksheets in the tool are locked and are not accessible to the user. This keeps the tool relatively safe as the database and links between cells cannot be modified accidentally. Information can be entered into the tool via user forms that are activated by clicking buttons at the top of worksheets. The user can navigate around the tool using the links provided. When the tool is started, the start-up screen for the PVC tool is shown (Figure 1). The user is given a number of options related to different case studies. If the user clicks on one of these options, they will be taken to the life cycle layout of the base case for the analysis they have selected. Base cases have been constructed for each option from data supplied by the PVC industry as well as other publicly available sources. The user can then modify the analysis to their own specifications. The user may also select the ‘Go to current analysis’ option. This will take the user to the last analysis that was being examined. If the user has come back to the start-up screen at some point during the analysis by accident, then this option will take them back again without changing any information. The ‘Start new analysis’ button takes the user to a blank analysis so that they can start from scratch. Figure 1 - Start-up screen of PVC sustainability tool 5 Figure 2 shows the top-level layout of the tool. This represents a map of a typical product life-cycle and includes the following stages: Raw materials; Processing; Storage; Use; Transport; and Waste. The user can access any of these stages by clicking on the relevant box. The subsequent levels allow the user to modify information contained at these levels; this is described in more detail later on. The Excel menu bars and toolbars are largely disabled for the sake of clarity, although the user can still make use of the in-built excel File/Save functions to save the tool at any point during the analysis. Several menu options specific to the tool have been added: Comparison, PVC Study and Share data. The function of these is described in sections 8, 6 and 9 respectively. The PVC help menu contains the manual as well as software development credits. The carbon footprint for each stage is shown in red and the value added in blue. Figure 2 Life cycle view in the PVC Sustainability Tool 6 6 Starting and building a new analysis To start a new analysis, the user can click on Start New Analysis from the start-up screen (Figure 1) and will be taken to the life-cycle view (Figure 2). 6.1 Define the system details The system details user form can be activated by clicking on the Enter System Details button at the top of the screen in the life-cycle view. The user form is shown in Figure 3. In order to proceed with the analysis the user must define a functional unit. This is the mass of the product to which the carbon footprint will be attributed, in this case 3 kg. The name of the product can also be defined (in this case, Windows), as well as information pertaining to the data, e.g. date collected, estimated quality, source… (although this is not compulsory). Figure 3 System Details user form 7 Mass, energy, distance and currency units of operation can also be defined. The default values for these are tonne, kWh, km and £ respectively. The units can be changed at any point during the analysis. If using a currency other than £, an exchange rate should be supplied to the textbox. This enables the user to switch between currency types during the analysis. The system details can be updated by clicking on the OK button, after which the whole system takes a short while to update. 6.2 Defining the processing stage names It is a good idea to name the process stages before defining the raw materials use. There are ten processing stages available in the current version of the tool. The overview of these is shown in Figure 4. This stage can be accessed by clicking on the Processing box in the life cycle view. Figure 4 Overview of Processing The carbon footprint for each stage is shown in red and the value added in blue. The above example contains only one stage, Windows manufacture. The rest contain no data so are not defined. When the tool is first loaded, all the stage names are called Stage1, Stage2…etc. They can be modified at any point during the analysis as follows: 1. Click on the stage to be modified to see its details 2. Click on the Define Stage button at the top of the screen 3. Enter the name of the stage in the relevant text box (e.g. Windows manufacture) 4. Enter any relevant comments in the Comments text box 5. Click Update. Once this is done, the tool will update all instances of the stage name in the analysis. 8 6.3 Defining the raw materials use All raw materials usage needs to be defined in the Raw Materials section of the tool. This can be accessed by clicking on the relevant box in the life cycle view. A view of this level is shown in Figure 6. It can be seen that there are four tables representing materials, packaging, energy and waste. The amount of each of these can be modified by clicking on the appropriate button at the top of the screen. In order to add a raw material to the analysis, the following procedure is used: 1. 2. 3. 4. 5. Click on the Define Materials button Select the required material from the first drop-down list Select the required processing stage from the second drop-down list Add the amount of material required to the textbox Select the data quality for the amount used (high, medium, low), see appendix 1 for a description of how the data quality is calculated for the system. 6. Add the cost of the material in pounds for the purposes of the value added analysis. 7. Add any comments that are appropriate to this instance of material use. 8. Click the Update button. Figure 5 Stage details and Define Stage user form 9 Figure 6 Raw materials stage with Define raw materials user form The Raw material table on the screen will automatically show the material name, the amount used, the carbon footprint associated with it and its destination. Other materials can be added in the same way. If a new material needs to be added to the database, then this can be done through the Modify Database tab. This is discussed in more detail in section 4. The total carbon footprint for the stage can be seen at the top of the screen in red. The amount of material being used can be updated at any time or can be removed completely from the analysis by setting its usage to zero. 6.4 Defining transport Transport links can be defined when there is a material to be transported between stages. In order to define transport the following procedure should be used: 1. Click on the relevant transport link 2. On the transport stage screen, click the Define Transport button 3. A user form will appear asking the user to select material stream to transport (see Figure 6) 4. Select the required stream from the list box (e.g. Zinc Stearate -> Windows manufacture) 5. Click on Define Transport. The Define Transport user form will then be shown (see figure 8) 6. Select the type of transport from the drop-down menu (e.g. 40 t – truck). 7. Enter the distance travelled into the text box (note the units required) 10 8. Enter the estimated packing density of the material into the text box (if not known – leave as the default value of 1). The packing density is only important for low density products (approx. 300 kg/m3 or less). 9. If a truck has been selected, decide whether you want it to return home empty and if so, select the check box. Selecting empty return will increase the carbon footprint for a transport option by about 60%. 10. Define the cost of the trip (£ per functional unit) 11. Select the data quality for the distance you have used (high, medium, low) 12. Click the Update button. The transport table will then be updated with information pertaining to the journey you have just described. Information pertaining to Transport type, distance, mass transported, carbon footprint for journey and total carbon footprint for the stage are all shown. Figure 7 View of transport stage and user form for selecting transport stream A journey can be removed at any time by setting the distance travelled to zero. 11 6.5 Defining stage details The details of the process stages and the storage and use stages can now be defined by entering each individual process stage in turn (see section 3.2 above for how to navigate). 6.5.1 Defining material outputs Material outputs can be defined from any stage apart from the Use stage. It is necessary to create a material output from a stage for two reasons: 1. Transport can only be defined if there is a material flow between stages 2. Each stage is mass-balanced. Material outputs show up as a mass input at its destination stage. Material outputs are named by the user and have a mass associated with them. They are created as follows: 1. Click on the Define stage button to show the appropriate user form 2. Select the Material outputs tab 3. Type the name of the output flow into the drop down box provided (the material can be selected later on and its mass changed) 4. Select the destination stage for the material 5. Add the mass of the material to the text box 6. Add the value of the material in pounds 7. Click the Update button. Once a mass output has been created, it will show up in the relevant transport stage as well as in the material inputs table of the appropriate stage (processing, storage or use). 12 Figure 8 Define Transport user form 13 Figure 9 Material output tab on Define stage user form 6.5.2 Defining energy use Energy use for any stage can be defined by clicking the Define Energy button. The associated user form is shown in figure 10. The amount of energy is defined as follows: 1. Select the required energy type (e.g. Electricity from UK grid) from the drop-down menu 2. Enter the amount used in the text box (NB: make sure the correct units are being employed – MJ in this case) 3. Select the data quality of the amount being used (high, medium, low) 4. Include any relevant comments in the comments box 5. Include the cost of energy per unit 6. Click on the Update button. 14 Figure 10 Define Energy user form The energy table on the screen will be updated with the relevant information and the carbon footprint shown. 6.5.3 Defining packaging use Packaging use for any stage can be defined by clicking the Define Packaging button. The associated user form is shown in figure 11 below. The amount of packaging is defined as follows: 1. Select the required packaging type (e.g. Polyethylene film (PE-LD)) from the drop-down menu 2. Enter the amount used in the text box 3. Select the data quality of the amount being used (high, medium, low) 15 4. Include any relevant comments in the comments box 5. Include the cost of the packaging per unit mass 6. Click on the Update button. Figure 11 Define Packaging user form The packaging table for the stage will now be populated. Packaging types can be removed from the analysis by setting the mass to zero. 6.5.4 Defining waste use Waste use for any stage can be defined using the same procedure as for materials, energy or packaging. The user form is similar and is shown in figure 12. The procedure for waste is as follows: 1. Select the required packaging type (e.g. PVC - Incineration) from the drop-down menu 2. Enter the amount of waste in the text box (e.g. kg per f.u.) 16 3. 4. 5. 6. Select the data quality of the amount being used (high, medium, low) Include any relevant comments in the comments box Include the cost of waste disposal Click on the Update button. Figure 12 Define waste user form 6.5.5 Linking the waste use to raw materials The waste use can be linked to raw materials use. This function allows the user to automatically update the amount of raw materials used when the amount of waste at a particular stage is changed. This feature is useful if a large number of raw materials are being used as it saves having to go back and update them if the waste amount changes. To use this feature, the user first clicks on the Link waste tab on the waste user form (see Figure 13). 17 Figure 13 Link waste tab Two text boxes are shown on the form,. The top box shows the list of waste streams used at this stage of the analysis that can be linked to materials used at that stage, the bottom box shows the list of materials that are currently linked. In order to link a material, the user should click on the Modify material links button. This will bring up a separate user-form that allows the user to create and remove links using the appropriate buttons (Figure 14). 18 Figure 14 Create/delete links form The top box shows raw materials used at this stage and the bottom box shows the existing material links for the waste stream selected. The user will not initially see any effects of material linking. However, if the amount of waste being used is changed, then the raw materials linked to it will be updated to reflect that change. For instance, if the amount of waste at this stage was 0.1 kg when the material was linked, and it was increased to 0.2 kg, the amount of raw material, would be increased by 0.1 kg. If multiple materials are linked to a waste stream, then the amounts are adjusted in proportion to the ratio of their use. For instance: If three materials are linked to one waste stream: Landfill Municipal = 1 kg Material 1 = 4 kg Material 2 = 4 kg Material 3 = 2 kg Then increasing the amount of waste would have the following effect: Landfill Municipal = 2 kg 19 Material 1 = 4 kg + 0.4 kg = 4.4kg Material 2 = 4 kg + 0.4 kg = 4.4kg Material 3 = 2 kg + 0.2 kg = 2.2kg 7 7.1 Data Display Carbon footprint data Carbon footprint data is displayed plainly throughout the tool and is always shown in red. The units are always mass per functional unit (f.u.) where mass is the current operating unit (e.g. kg, tonne, g). The total carbon footprint for the analysis is shown in the life cycle view at the bottom of the screen; In the life cycle view, the carbon footprint for each stage is shown above the relevant stage box; In the Processing section, the carbon footprint for each processing stage is shown above the relevant box and the total carbon footprint for processing is shown at the top of the screen; In each individual stage the total carbon footprint is shown at the top of the screen In each stage, the components of the carbon footprint are shown in the relevant tables; and The carbon footprint associated with a particular material, energy type, packaging type, waste type, or transport type is displayed in a greyed out text box on the relevant user form when it is displayed. e.g. in Figure 11 above, the carbon footprint for Landfill – Municipal Waste is 0.715 kg CO2 equivalent per kg of waste. A graphical representation of carbon footprint data is available at various points throughout the tool. Graphs can be viewed by clicking the View graph of carbon footprint button at the top of the page. Figure 15 below shows the graph of the total carbon footprint, available in the life cycle view. 20 Figure 15 Graphical view of total carbon footprint Clicking on one of the buttons below each bar on the graph will bring up another graph with a breakdown of the carbon footprint for that particular stage. For instance, clicking the button below Processing shows the carbon footprint for each of the processing stages (Figure 16). Figure 16 Carbon footprint for Processing stages 21 Graphs are also available for each individual stage (apart from transport stages). Figure 17 Carbon footprint for individual process stage 7.2 Value added data Value added data is displayed throughout the tool in blue. The units are expressed in pounds (£) per functional unit. The total value added during the analysis is shown in the life cycle view at the bottom of the screen; In the life cycle view, the value added for each stage is shown above the relevant stage box; and In the Processing section, the value added for each processing stage is shown above the relevant box and the total carbon footprint for processing is shown at the top of the screen. The value added summary is also displayed in a tabular form and can be accessed by clicking the View value added analysis on the top sheet. Figure 18 shows the value added data displayed for each stage, as well as the total value added during the whole analysis. 22 Figure 18 Value added data display for each stage The value added data is also displayed in a graph for each stage. Both costs and value are shown. This can be accessed by clicking on the View graph button. Figure 19 shows an example of a graph. The View missing data button can be clicked on in order to be taken to a table of data for which there is currently no value data. Figure 19 Value added graph 23 8 8.1 Modifying the database Creating a new database record It is probable that, during the course of an analysis, the user will need to create a new database record. This can be done for any of the following: materials, energy, packaging, waste, transport. New database records can be created by: selecting the Modify Database tab on the appropriate user form (see Figure 20 below for materials example) . clicking the Create new item button filling in the appropriate fields in the resulting user form (see Figure 21). It is not possible to create an item with a name that already exists in the database. Figure 20 Modify database tab on Raw Materials user form Once created, the item will be shown in the list of user-defined items in the listbox and will be available to select from the drop-down list in the appropriate list box (e.g. raw materials, energy etc.) 24 Figure 21 Create new database record form 8.2 Modifying an existing database item Any database records created by the user can be subsequently modified by selecting the item in the listbox (see Figure 21 above) and clicking on Modify Details. This will show the existing details of the record (see Figure 22 below). 25 Figure 22 Modify details for an existing database item Database records that are in current use in the LCA can not have their details modified. Database records that are not user defined (i.e. that come as standard with the software) can not have their properties modified. 8.3 Deleting a database item User defined database records can be deleted by selecting the item in the listbox (see figure 20) and clicking on Delete item. The user will be asked if they are sure they want to delete the record in question. Database records that are in current use in the LCA can not be deleted. Database records that are not user defined (i.e. that come as standard with the software) cannot be deleted. 9 Loading/Saving data Analyses can be loaded/saved/deleted using the PVC study menu item at the top of the screen. Figure 23 below shows the menu options available. This can be done if it is necessary to save the data in order to start a new analysis, or to load a previous analysis. 26 Figure 23 PVC study menu options 9.1 Saving an analysis In order to save a study, the user selects Save PVC Study from the PVC Study menu option and is then asked to enter a (unique) name into a drop down box, or select a previously saved study to over-write it. Note: Saving a study saves the data to a new worksheet but it does not save the workbook. To do this, the user must use the Excel File/Save menu. It is recommended that the user saves the file on a regular basis. 9.2 Loading an analysis A previous analysis can be loaded by selecting Load PVC Study from the PVC Study menu option. A listbox will appear with the names of previously created analyses that the user can select from (see Figure 24 below). Note: loading a previous analysis will overwrite any data currently being used. Users are advised to save their analysis before loading another one. Figure 24 Load LCA user form 27 9.3 Starting new study The current study can be re-started at any time by selecting the Start new PVC study menu item from the PVC Study menu. The user will be asked if they are sure they want to reset and will then be given the option of saving the data first (as in 6.1 above). 9.4 Deleting an analysis Analyses that have been saved can be deleted at any time by selecting Delete PVC study from the PVC Study menu. 10 Examining other environmental impacts As well as examining the carbon footprint for a system, other environmental impacts can be examined. This information can be seen by clicking on the View other environmental impacts button at the top of the screen in the life cycle view of the tool. When this is done, the user is taken to a new sheet, showing graphs for the following five impact categories: Acidification potential; Eutrophication potential; Ozone depletion potential; Photochemical ozone creation potential; and Human toxicity potential. If the user has created their own data sets at any point, then they will see a message in red font, stating ‘Warning: Some of the data used in the analysis are incomplete. To complete, click the 'Modify user defined data' button’. In the latter case, it is necessary for the user to supply data for the new data sets they have created before the results for these extra impact categories can be considered to be complete. To do this, the user clicks on the Modify user defined data button. This brings up the form as shown in Figure 25. 28 Figure 25 Modify user data for other impact categories form The top text box shows all of the data sets for which other impact data are missing. The bottom text box shows all of the user defined data sets for which impact data can be modified. To specify missing data the user clicks on the Define impact data button to the right of the top text box after selecting a data set. To modify existing data, the user clicks on the Define impact data to the right of the bottom text box after selecting a data set. Both buttons yield the same user form (Figure 26). This form allows the user to specify the impact data for a specific data set by filling in the text boxes and clicking the Update data button. 29 Figure 26 Define impact data user form 11 Data comparison Data for up to four analyses can be compared using the data comparison feature. This can be accessed by clicking on the Comparison menu at the top of the top sheet. The user can select between comparing the carbon footprint only or all of the environmental impacts. 11.1 Carbon footprint comparison Selecting Carbon footprint takes the user to a new sheet (Figure 27). The first table is always taken up with data for the baseline analysis for the PVC related process in question. If the user clicks on the Add current analysis buttons, then the information from the current analysis will be added to the appropriate (note: if all four tables are populated by data, the user will be given a choice as to where they would like new comparison added). The user can then go back to the analysis, change it and then come back to the data comparison sheet and add the new analysis in order to compare the two. They could also go back, load a previously created analysis, and then compare this (tables of data are not cleared on using the Load CF study function). The tables can be cleared individually by clicking on the Clear comparison data button at the bottom of each table. A graphical comparison of the data in the tables can be viewed by clicking on the View graphs button at the top of the sheet. 30 Figure 27 (Partial) View of the carbon footprint data comparison sheet 11.2 Other impact comparison Selecting All impacts takes the user to a new sheet (Figure 28). Addition and clearing of data is done in the same way as when comparing the carbon footprints (section 8.1). When the data are cleared from the tables on this worksheet, the default values are set back to 0. The data is plotted on a bar graph (fig 29) without causing stability issues. The graph can be accessed by clicking the View graph button. The axis on the graph is automatically scaled. 31 Figure 28 (Partial) View of the environmental impacts data comparison sheet Figure 29 Graph of all environmental impact data comparison 12 Sharing data between users Data and carbon footprint analyses can be shared between users via the menu option Share data. By selecting the Export option from this menu, a form is shown that allows the user to select an analysis that has already been saved (see section 6.1), and then export it (Figure 30). This action will create a new excel file entitled Share_data.xls in the 32 users default directory. This file contains all of the analyses exported, along with the database. Figure 30 Data export form In order to import a previously created analysis, the user selects the Share data/Import menu item. This then prompts the user to locate the previously created Share_data.xls file in the desired directory. Once this is done, the user will be offered a choice of saved analyses to import (multiple analyses can be selected) (Figure 31). Figure 31 Data import form Selecting one or more analyses from the list and clicking Import data will import the selected analyses to the tool and update the database with any missing items. Imported analyses can then be examined using the Load PVC Study menu item (section 6.2). Note: In order for the import/export function to work, the PVC sustainability tool must be the first and only excel workbook open. It must not be renamed from PVC_sustainability_tool.xls. The Share_data.xls file must not be renamed. 33 13 Data quality assessment Throughout the tool, users are required to specify the data quality for the information they are inputting. This takes two forms, firstly the data quality of the data set and secondly, the data quality for the amount being specified. Data quality within the tool is always expressed as either high, medium or low quality. The data quality for the data sets is specified when they are created and is not subject to alteration during the analysis. Data quality of the data sets supplied within the tool will invariably be high, as they are from a trusted source. For user defined data sets, the user can specify the data quality when they create it. The data quality for the amount of material, energy or travel distance specified by the user has to be specified each time the user adds a new datum to the analysis. The user is required to make a judgment as to how reliable their data are. For instance, if a transport distance is known then the user might choose high quality of data; however, if the distance is only guessed at or generic, then the data quality for this datum will be low. The data quality assessment calculation is made by weighting each data point by its contribution to the carbon footprint. A full description of the data quality model is given in appendix A. Clicking on the View data quality assessment button at the top of the screen in the life cycle view of the tool brings up the data quality assessment sheet (Figure 32). This shows the overall data quality for the analysis as well as the data quality for each individual stage. 34 Figure 32 Part of data quality assessment screen 35 Appendix A - Data quality criteria A1.1 General about LCA data quality According to PAS2050, the following data quality requirements should be considered when performing an LCA: time related coverage; geographical coverage; technology coverage; precision and accuracy; completeness; consistency; reproducibility; and sources of data (primary or secondary). Thus, data quality assessment is a complex task as multiple aspects need to be considered, including the context in which the data are used. Enough information on the data is therefore fundamental to avoid their misinterpretation or misuse. A1.2 Data quality assessment in the PVC sustainability tool The quality of data within the PVC sustainability tool can be defined by a user as: − High − Medium or − Low. To help the user determine whether their data are of High, Medium or Low quality, a methodology specific to the PVC sustainability tool has been developed using the data quality criteria mentioned in the previous section. The criteria used in the methodology are summarised in Table A1. Table A1.2 shows how these can be aggregated to arrive at an overall Data Quality Indicator (DQI) - High, Medium or Low. For these purposes, each data quality criterion is assigned a weight of importance on a scale of 1-10. For example, as shown in Table A1.1, “Age of data” has the weight of 2, being twice as important as the geographical origin of data. Each data quality indicator is assigned (an arbitrary) maximum score for each criterion: e.g. the High indicator has a score of 3, Medium has 2 and Low has a score of 1 (see Table A1.2). Applying the weights of importance for each criterion and its maximum score for the respective quality indicators, the maximum score for each quality indicator is: − 30 for High; − 20 for Medium; and − 10 for Low. For the purposes of the analysis in the PVC sustainability tool , the following score ranges have been adopted for the data quality assessment: − Low data quality: score in the range of 1-10; − Medium data quality: score in the range of 11-20; and − High data quality: score range of 21-30. 36 An example shown in Table A1.2 shows an overall score of 19, indicating Medium data quality (noting that the overall score for Medium quality is between 11-20). Table A1.1 Matrix of Data Quality Indicators (DQI) for the PVC sustainability tool Data quality criteria Age of data Geographical origin of data Source of data Data quality indicators Medium 5 - 10 years Partly specific High < 5 years Specific Measured and/or modelled based on specific data (e.g. the company data or from suppliers) Modelled using generic data from LCA databases; some data derived using expert knowledge Completeness of data All inputs and outputs considered Majority of relevant inputs and outputs considered Reproducibility /reliability/ consistency of data Completely reproducible/reliable/ consistent Partly reproducible/reliable/ consistent Low > 10 Generic/average Mainly sourced from literature and/or estimated and/or derived using expert knowledge Some relevant inputs and outputs considered or known Not reproducible/ not known Table A1.2 Aggregating individual Data Quality Indicators (DQI) to arrive at an overall DQI (High, Medium or Low) High quality Data quality criteria Age Geographical origin Source Completeness Reproducibility /reliability/ consistency Maximum score Medium quality Low quality Weighting for each criterion on a scale 1-10* Max. score for each criterion: 3 2 1 3 3 2 2 1 1 1 (Low) 3 (High) 3 2 2 3 3 3 2 2 2 1 1 1 2 (Medium) 3 (High) 1 (Low) 30 (max score) 20 (max score) 10 (max score) Overall score for High in the range: 21-30 Overall score for Medium in the range: 11-20 Overall score for Low in the range: 1-10 Max. score for each criterion: 2 Max. score for each criterion: 1 Example data quality assessment 19 (overall score) Data quality indicator: Medium *The sum of all weights is 10. 37 NB: The overall score of 19 has been calculated in the following way: Overall score = 2*1+1*3+3*2+2*3+2*1 = 19 Therefore the overall data quality indicator = Medium It should be noted that the overall data quality will depend on both the quality of the particular datasets used by the user as well as on the confidence the user places on the quantity/amount of materials, energy etc. they are defining for each sub-system. For example, the quality of the background dataset for UK electricity mix and the related carbon footprint may be High; however, the user may not be confident in the data related to the amount of electricity used in a particular sub-system so that the quality of this datum may be Medium or Low. In this case, since the data quality for the set is already defined (as high), the user will only need to specify the quality for the quantity/amount and the tool will calculate the overall data quality for that particular sub-system. The process is repeated for each sub-system. The approach used for calculating DQI for a sub-system is shown in Table A1.3. Note that the quantity/amount is considered more important here than the quality of the dataset. Table A1.3 Aggregating the Data Quality Indicators (DQI) to arrive at an overall DQI for a each sub-system DQI for user-defined dataset* High Medium Low High Medium Low High Medium Low DQI for the amount/quantity entered in the PVC sustainability tool by the user High High High Medium Medium Medium Low Low Low Data quality of each subsystem (DQS) High (3) High (3) Medium (2) Medium (2) Medium (2) Medium (2) Medium (2) Low (1) Low (1) *Note that the datasets already available in the tool have a predefined DQI so that the user only needs to define the quality of their own datasets. Once the data quality indicators have been calculated for each sub-system, a weighted approach is then applied for assessing the overall data quality of the whole system based on the percentage contribution of each life cycle stage to the total carbon footprint. The overall data quality for the whole system is therefore calculated as: N M n 1 m 1 DQCF I n ( DQS m ) where: DQCF - overall data quality of the system In – percentage contribution of each life cycle stage to the total carbon footprint (%) DQSm – data quality (1, 2 or 3) for sub-system m 38 For the purposes of the analysis in the PVC sustainability tool , the following ranges have been adopted for the overall data quality of the whole system: − Low data quality: DQCF = 100 – 166; − Medium data quality: DQCF = 167 - 233; and − High overall data quality: DQCF = 234 – 300. 39