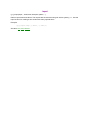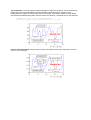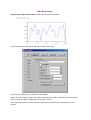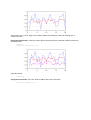
1
Program CC
USER GUIDE
Version 5.0
(01/01/2002)
Copyright(c) Systems Technology Inc.
and Peter M. Thompson
Material seleccionado para el curso Control de Procesos
de la Facultad de Ciencias Exactas y Tecnología de la
U.N.T.
Who?
Who should use Program CC?
Program CC is designed for students, engineers and consultants who occasionally or frequently
perform linear system analysis, control system analysis, and control system design.
We do not want to make the entrance requirements too high, but users should at least know what a
matrix is, and not be surpised that functions of time can be converted to and from the frequency
domain. The required background material is taught in courses about differential equations, linear
algebra, complex numbers, control theory and linear systems theory. Program CC is an excellent
complement to any of these courses. The building blocks of the program are real and complex
numbers and matrices, Laplace transforms, z-transforms, Fourier transforms, and vector differential
equations.
The Student Version is designed primarily for education. Limits are placed on the system order (20th)
and on the total amount of data storage (64 Kbtyes). A matrix of size 90x90 will use up the available
space.
The Professional Version removes these limitation and provides user support. The available
commands are the same.
What
What does Program CC do?
Program CC is used for matrix analysis, transfer function analysis, and state space analysis. A large
number of internal functions are available in a command driven user interface, and any number of
user-defined functions can be written and used to expand the available list of functions. The variable
types built into the program are:
real and complex numbers
real and complex matrices
transfer functions (Laplace, z-domain, or w-plane)
transfer function matrices
quadruples (state space equations)
strings
These variables can be used for systems and control analysis. A physical system such as a
spacecraft, aircraft, tracking antenna, electronic circuit, or chemical process is modeled using linear
differential equations. The equations are converted to transfer functions and/or state space
equations and entered into the program. Program CC can then used for time and frequency domain
analysis, further development and validation the model and then to design and validate the control
systems. A wide variety of time and frequency domain analysis techniques and graphical methods
and programming capabilities are available to help the user, including:
Linear simulation
Frequency response analysis
Matrix decompositions
Model building and model reduction
Classical control plots
General 2D plotting
Fast Fourier transforms
Statisical analysis
Optimal control
Conversion between analog and digital domains
Conversion between classical and modern models
High level programming
In short, Program CC is a comprehensive, computer aided control system analysis and design
program.
Why?
Why use Program CC? Program CC’s strengths are:
Many variable types
High level analysis
Interactive plotting
Eclectic design
Short learning curve
Extensive capabilities
Better education
Many variable types: Program CC does not try to fit the world into matrices. Transfer functions and
state space quadruples are available to the user as variable types.
High level analysis: The user does not need to be a programmer. Poles and zeros are displayed in
a natural form with simple commands. Simulations, Bode plots, and root loci are available using
single commands.
Interactive plottings: The plotting can be changed using a plot dialog box. Cursors and zooming
are available using the mouse. Previous versions of plots can be redrawn and standard sizes can be
stored for later use. The plots can be quickly printed or copied into reports.
Eclectic design: Program CC allows easy transitions between classical, sample-data, modern and
optimal control. System models can be built up using a combination of state space equations and
transfer functions. Individual responses or loops can be converted to transfer function for classical
analysis and design, and the results converted back to state space for simulation.
Short learning curve: The history with Program CC has been that novice users quickly enter data
and quickly start doing significant things. The learning curve is short. This is important not just for
students but also for busy engineers who only occasionally have need of systems analysis.
Extensive capabilities: As novice users transition to experts the full depth of capabilities in Program
CC becomes apparent. People who learn to use all of the parts of Program CC will at least become
much better and hopefully become expert control systems designers. These same people may even
have some fun along the way.
Better education: Sudents new to control theory are presented with a long list of algorithms and
design methods, and while it can safely be said that most algorithms are not in themselves difficult,
the total can be quite an imposing burden. Many people have become good control system
designers, and all have put in the necessary time and effort. Many more people have had a brief
exposure to systems and control and have gone elsewhere. Program CC and personal computers
can considerably shorten the learning process. It becomes less important how to draw a Bode plot or
a root locus and more important to be able to interpret the results. Books full of rules and theorems
can be made transparent enough to allow the fundamental ideas to come forth. People who only
want or need a brief exposure to the subject can come away with a better understanding of the
basics … and better able to read someone else’s report.
By whom?
Program CC is brought to you by whom?
Program CC is a product of Systems Technology, Inc. (STI) of Hawthorne, California, copyrighted by
Peter M. Thompson and STI. Hawthorne is located in the greater Los Angeles area. Our Web site is
www.systemstech.com.
STI primarily does consulting and government contract work. STI has been in existence for more
than forty years, founded by Duane T. McRuer and Irving L. Ashekenas and now headed by R.
Wade Allen and Thomas T. Myers. The company has been involved throughout its history in a wide
variety of systems, dynamics, human operator, and controls activities. We have worked on just about
the entire inventory or U.S. fighter and transport aircraft, the NASA Space Shuttle landing system,
several Army and Navy helicopters, the National Aerospace Plane, and several rocket boosters. We
have worked on exotics such as blimps, parachutes, the Gossamer, the Smithsonian’s Quintocotalus
Northropi, and old and new versions of Northrop’s flying wing. STI has also worked extensively on
ground vehicle dynamics and manual control of ground vehicles; everything from motorcycles, cars,
and trucks and the thankfully no longer popular 3-wheel off road vehicles.
Recently STI has branched into software development and PC-based low-cost simulators. Our
simulator products include automobile and truck simulators and a parachute simulator. Program CC
has been a software product since 1986. Version 5 is our most recent release and the first to emerge
from the DOS world and take full advantage of Microsoft Windows.
Our expertise and experience in control system design is reflected in our products. Most of the
commands and plotting in Program CC are standard treatments of systems and control methods, but
there are many others in the program that are included because we use them and they work.
Dr. Peter M. Thompson is the main author of Program CC. He has a Ph.D. in Electrical Engineering
from the Massachusetts Institute of Technology and was an Assistant Professor at the California
Institute of Technology. Since 1986 he has worked at Systems Technology, Inc and has been
actively involved in applying advance control theory to practical problems.
The Command Line
The heart of Program CC is the command window. The last line is the command line on which the
user is presented with a prompt:
CC>
A command is entered using the keyboard and then executed with a carriage return. A response
may be displayed after the prompt, or a window or dialog box may open, depending on the
command, and then the user is presented with another prompt. In the following example a 2x2 matrix
is entered and displayed, and then its eigenvalues are computed and displayed:
CC>a=(1,2;3,4)
CC>a
a =
1
3
CC>eig(a)
ans =
5.3722813
-0.3722813
2
4
Expressions of the form <lhs>=<rhs> do not display the results, no matter how terminated.
Expressions of the form <rhs> display the result. Long expressions can be continued on the next line
using ellipses:
CC>b=2+3+…
More>4+5
Multiple commands can be entered on the same line separated by a semicolon or an ampersand (;
or &). In the following example a transfer function is entered and then displayed:
CC>g=5/(s+1); g
Parameters separated from the function name by spaces are surrounded by quotes. The following
are equivalent:
CC>help butter
CC>help(’butter’)
Previous commands are scrolled using the arrow keys. The text above the command line is treated
as a regular text window with cutting, pasting and copying operations. The command window cannot
be deleted.
The Alt+C hotkey jumps to the command line and the Alt+X hotkey pops up a dialog box containing
the command line.
Variables
Variable names must start with a letter or underline and then can contain any number of letters,
numbers and underlines. Variable names are case sensitive. Variables have structure members that
return or set different attributes. For example a.nrows returns the number of rows. Examples of each
variable type defined in Program CC are presented below:
Real and complex numbers are entered by:
CC>a=2
CC>b=3+4*j
The variable j is by default equal to the square root of minus one, and if overwritten can be reset
using j = sqrt(-1).
Real and complex matrices are defined using parentheses ( ), square brackets [ ], or braces { }.
Elements are separated by commas, rows by semicolons, and diagonal numbers by poundsigns:
CC>c=(1,2;3,4#5)
Block matrices can be combined using the same operators ( , ; #). The matrix is complex if any of the
elements is a complex number. Matrices defined using parenthese and braces will zero fill as
needed. Matrices defined using square brackets require the number of rows or columns of adjacent
blocks to be the same, which is sometimes safer. Square brackets also allow spaces to be used in
place or commas and carriage returns in place a semicolons:
CC> d=[1 2 0
More> 3 4 0
More> 0 0 5]
The number of rows and columns in a matrix can be determined using the size function or by using
structure members a.nrows and a.ncols.
Transfer functions are entered using the transform variable:
CC>g = 5/(s+5)
The variable s is by default equal to the Laplace transform variable, and if overwritten can be reset
using s=Laplace. Z-transforms are entered using the variable z, which is reset if needed using
z=ztransform. The sample period of a z-transform is undefined unless specified as part of a function
(such as convert) or unless explicity specified:
CC>gd=5*(z+1)/(z+.8)
CC>gd.delta=1/40
Transfer function matrices are created whenever matrix elements are transfer functions:
CC>h=(g,1; 0,1/s)
State space quadruples contain the four matrices used to define the the vector differential equation
x& = Ax + Bu , y = Cx + Du . The matrices have compatible dimensions and can be combined into a
block matrix, but this block matrix is not a quadruple until the number of states is specified:
CC>a=(0,1;0,0); b=(0;1); c=(0,1); d=0
CC>p=(a,b;c,d)
CC>p.nstates=a.nrows
Or more simply:
CC>p=pack(a,b,c,d)
State space quadruples can also represent a vector difference equation: xk +1 = Axk + Buk ,
yk = Cxk + Duk . A digital quadruple is automatically created by functions (such as convert) or is
explicitly specified by:
CC>p.mode=’digital’
CC>p.delta=1/40
String variables are defined by characters enclosed in single quotes:
CC>str=’string variable’
Two single quotes inside a string is interpreted as a single quote.
Vector string variables can have ragged lengths and are created like rows in a matrix using
semicolons:
CC>vstr=(‘first row’; ‘second row’)
Operators
Program CC has a rich variety of operators, arranged below in groups.
Arithmetic: Addition subtraction and multiplication operations, both left and right division, the
feedback operator, and exponentiation:
+
-
*
\
/
|
^
The top part of the left or right slash points to the variable to be inverted. The feedback operator is
defined by a|b = a/(eye+b*a). A matrix plus or minus a number adds or subtracts the number from
each matrix element. (This is different from Program CC Version 4.) A matrix plus or minus a row or
column vector adds or subtracts the vector from each row or column.
Dot arithmetic: The dotted versions of the arithmetic operations work element-by-element when
applied to matrices:
.+
.-
.*
.\
./
.|
.^
Assignment: Assignment (=) is treated as an operation so that multiple assignments can be made
(for example a=b=c=1). As in C assignment operations can be used, whereby “a op= b” is the same
as “a = a op b”:
= +=
-=
*=
\=
/=
|=
^=
Unitary: The unitary operators are plus and negation, not (~), factorial (only for positive integers),
hermitian (‘) and transpose (.’):
+
-
~
‘
!
.’
Relational and logic operators: These are most often used in conditional statements. The C
notation is used for or (||) and and (&&):
==
~=
>=
>
<=
<
||
&&
Matrix building operators: Row, column and diagonal block augmentation are denoted respectively
by , ; and # :
,
space
;
<ret>
#
Matrices can be surrounded by ( ), [ ], or { } but they work differently. Matrices surrounded by square
backets can use space and <ret> respectively for row and column augmentation, and the number of
rows or columns for augmented blocks must be equal. Matrices surrounded by parentheses or
braces cannot use space and <ret> and use zero-fill as needed when combining blocks.
Colon: The colon operator i:j expands to a row vector (i, i+1, i+2 …, j) and I:j:k expands to (i, i+j,
i+2*j, …, k):
:
Parentheses: Parentheses, square brackets, and braces must be used in pairs and have the same
definitions except that matrices built with square brackets have different rules:
( )
[ ]
{ }
Punctuation: Statements are ended with ; & or <ret>. Lines can be continued with ellipsis (…). A
comment is defined from % to <ret>. Lines that start with ‘ in column 1 are comments:
;
&
<ret>
…
%
‘
Structure members: Variables are separated by their structure members using the dot operator:
.
Keystrokes
The following hotkeys are available when the command line is active:
up arrow
down arrow
esc
Ctrl + up arrow
recall previous commands
recall previous commands
delete command line
previous line
The following are available at any time:
Alt+C
Alt+X
jump to command line
open command line dialog box
The remaining hotkeys are more-or-less standard replacements for menu items:
File menu:
Ctrl+N
Ctrl+O
Ctrl+S
Ctrl+X
Edit menu (clipboard): Edit menu (search):
new
open
save
cut
Plot menu:
Ctrl+A
Ctrl+L
Ctrl+T
Ctrl+Z
Ctrl+Z
Ctrl+X
Ctrl+C
Ctrl+V
undo
cut
copy
paste
Ctrl+F
Ctrl+E
Ctrl+R
Ctrl+A
Shift+F
Ctrl+G
Window menu:
Autoscale
Plot text
Cursor type
Zoom cursor
Shift+F5
Shift+F4
cascade
tile
find
find next
replace
select all
change case
goto line
Functions
All functions have the following form:
(out1,…,out_nargout) = function_name(in1,…,int_nargin)
The input arguments can be variables or expressions. Variables used as input arguments are never
changed. Too many input arguments results in a runtime error. Fewer input arguments can be used
but may result in undefined variables inside the function. The variable nargin inside the function
equals the number of input arguments used in the calling expression.
The output arguments are defined in the function and assigned using the assignment operator to the
variables on the left hand side. Too many output arguments results in a runtime error. Fewer output
arguments can be used and the remaining are not assigned. The variable nargout inside the function
equals the number of output argument used in the calling expression.
The ouptut and input arguments can be surrounded by ( ), [ ] or { }. The arguments can be separated
by spaces if square brackets are used.
If a function is used in an expression then only the first output argument is returned and used in the
expression, for example:
CC>a=exp(-1)*sin(pi/4)
Many functions do not have any output arguments. These functions perform actions as plotting and
should not be used in expressions. They actually do return something; a non-printing null variable.
Program CC Version 5 is function oriented, yet the prompt is called a “command prompt.” A
command is an expression built up using functions, variables, and operators.
User Defined Functions and Scripts
User defined functions: Any number of user defined functions and script files can be placed on the
path and therefore made available to the user. A user defined function has three parts: a function
definition, help, and a set of commands. A simple user defined function is:
function c = foo(a,b)
% c = foo(a,b) returns c = a + b
c = a + b
Enter this function using Program CC’s text window, or any other text editor, and store in an ASCII
file named foo.mac somewhere on Program CC’s path. The first set of lines starting with % are
echoed in response to “help foo”. Call this function at the command line by:
CC>foo(2,3)
Variables defined inside the function are local to that function, unless explicitly declared inside the
function as global. Functions and script files can be nested to any level.
User defined unctions when called are compiled and the compiled version is executed and then
saved for possible later use.
Script files: A script file does not have a function declaration and hence does not have any input or
output arguments. All of the variables in the script file are at the same level as the calling expression.
This means all of the currently defined variables at the command level are available inside a script
file (if called from the command level) and any variables defined in the script file are available after
returning from the script file.
Programming
Program CC uses a high level language both on the command line and in user defined functions and
scripts. The language contains expressions of the form:
<lhs> = <rhs>
<rhs>
Declaration and typing of all the variables is done at run time. It is this “late typing” that makes the
high level language so powerful and convenient. The price to be paid is slower execution times.
Operations should be defined using vectors, matrices and functions when possible, as opposed to
looping over matrix elements, so that the overall execution time is acceptable. T
The language contains the following conditional, looping and control statements:
if
elseif
else
end
for
while
break
continue
goto
function
return
Each if, for and while statement must be terminated and is always paired with the nearest end.
A function is compiled and the compiled version is executed. The compiled version is stored for
possible and faster later use. Each command line is also compiled and then executed, but the
compiled version is not stored.
Text Editor Window
The text editor window is used to create, edit, and debug function and script files. A text editor
window is opened using the file menu items new and open, using tool bar buttons, or from the
command line:
CC>edit
CC>edit function_name
Standard text editing features are available. Only one font can be defined at a time. The file size of
the file is limited to about 30 Kbytes. Any text file can be edited, but the main purpose of the text
window is to edit Program CC .mac files.
The text editor window can be used for syntax checking and test runs of functions and scripts. Use
the syntax menu items to do this:
Check
Perform a syntax check
XRef
Display a cross reference table of variables.
Again
Perform the previous operation again
Close
Close the response window
Save
Save the file
Run
Execute the function or script
Run What Enter the command used for testing
The syntax check results are displayed in a response window that is attached to the bottom of the
text editor window. The menu items from "Again" to "Run What" are also available as buttons on the
response window. Source lines in the response window with syntax errors can be double-clicked to
jump to the corresponding lines for changes. The command string selected by “Run what” is echoed
to the command window and the text results if any are displayed in the command window.
The preliminary release for Program CC also contains theSyntax menu items "Tokens" and “Parse.”
The Tokens menu item converts the ascii text to the token stream used by the parser. "Parse" shows
the pseudo-commands output by the parser that actually get executed. These features are
interesting but really only useful for debugging the parser.
Directories
The Program CC path starts with the current working directory and then proceeds in the order listed
by the path command. The current working directory is set by the cd command:
CC>cd ‘c:\ccv5\functions’
The cd function with no parameter and the pwd function display the current working directory. The
following versions of the path command displays, sets, and expands the path:
CC>path
CC>path(‘c:\project1’)
CC>path(path,’c:\project2’)
The currently defined variables are saved and loaded by the save and load commands:
CC>save datafile_name
CC>load datafile_name
The datafile_name.cc file is saved in the current working directory, or in any other directory if
included in the name. The same file is searched for loading in the current working directory and then
anywhere in the path, or just in the directory if included in the name.
User defined functions can be created in the text editor window and are by default saved in the
current working directory. These same functions when called are searched for first in the current
working directory and then along the path. The first occurance is compiled, executed and saved for
later use. The function is recompiled when used again if the text file has changed since the last
occurance. The best way to check if a function is located on the path is to use the help command:
CC>help name
Plotting
The plot commands are:
bode
loglog
nichols
nyquist
plot
rootlocus
semilogx
semilogy
stripchart
time
freq response magnitude and/or phase
log10 versus log10
freq response phase versus magnitude
freq response real versus imaginary
x versus y
real versus imaginary of roots
log10 versus linear
linear versus log10
x versus multi-axis y
simulation response
Recommended use: Each of these plot commands are interactive. Create the plot by using simple
versions of the commands, such as plot(x,y) or bode(g), which will autoscale the axes. Then pop-up
a plot option dialog box by double clicking on the plot, or using the menu or toolbar, and use the
dialog box to add a title, labels, or text; to change the axis limits, and so on; and then print the plot or
copy the result to the clipboard.
Redo and standard plots: You can redo the previous set of axis limits by using the 'redo' plot
option, such as: bode(g,'redo'). You can use a standard set of axis limits by using the 'std' plot option,
such as: bode(g,'std'). Use the plot option dialog box to reset the standard.
Cursors: The x,y values can be read off the plot using a cursor by single clicking anywhere on the
plot. The "axis cursor" reads the values from the axis locations, and the "trace cursor" is always
centered over data points and reads the values from the stored data.
Zooming: Axis zooming can be toggled by clicking the Ctrl+z keys, or by selecting the plot/zoom
menu item, in which case the left mouse button zooms in and the right mouse button zooms out.
Each axis can be zoomed individually by clicking on the axis.
Popup Menu: A subset of options are available in a pop-up menu called using a right-mouse-click.
These options depend on the type of plot.
Mulitple plot windows: The plot functions will overwrite the current plot, unless the hold function is
used to add the new lines to the same plot, or the subplot function is used to place the next plot in a
different location on the same figure, or the figure function is used to place the next plot in a new
window.
Plot options: Any of the plot options can be manually set by using the plotoption function. Axis limits
can be changed using the axis function. New lines can be added using the line function. The title,
xlabel, ylabel, and so on change these parts of the plot. Typically changes are made in a
user-defined function which in one-step creates a particular style of plot or recreates a figure used in
a report.
All plots are 2-dimensional. There are no 3-dimensional plots.
Examples:
plot(rand(1,1e2))
t=0:.1:2*pi; x=cos(t); y=sin(t); plot(x,y)
See also: axis, hold, figure, grid, line, plot, plot options, line styles, subplot, text, title, xlabel, ylabel,
ylabels, y2label.
bode
bode(g)
Plots log10(abs(s)) versus the dB magnitude and phase of g(s), where s is an automatically
generated set of frequencies. The input g can be a tf, tf matrix, or quadruple. If g is
multivariable then plots the frequency response of each input/output pair. Plots the
magnitude using the left axis and phase using the right axis. In the digital case plots
log10(abs(s)) versus g(z) for z=exp(s*g.delta).
bode(s, g)
Uses the frequencies stored in the vector s. Frequencies on the jw-axis should be stored as
complex numbers. See freqvec and dfreqvec.
bode(s, y)
If both s and y are vectors then plots abs(log10(s)) versus dB(abs(y)). If s and/or y are
matrices then does so for each column or pair of columns.
bode(g, 's’)
The string variable 's' specifies the color and size of the line and/or symbols. See line styles.
bode(g1, s1, ..., gn, sn, 'option', params, ...)
The general form of the bode function includes plot options.
Example:
b=butter(2,2)/s
bode(b)
Plot options particular to bode include asymptotes, bodeoption, siggy, and phase. Robustness
margins can be determined by using the cursor or by using the right-mouse-click pop-up menu.
See also: freq, margin, nichols, nyquist, point, plot, siggy.
freq
y=freq(g,s)
Returns the frequency response g(s), where:
g = tf, tf matrix, or quadruple, but must be single input
s = complex vector of frequencies in rad/sec
y=freq(g,low,high,npts,option)
Generates a vector of frequencies and then computes the frequency response, where:
low = low frequency
high = high frequency
npts = number of points
option:
0 = rad/sec log spaced (default)
1 = rad/sec linear spaced
2 = Hz log spaced
3 = Hz linear spaced
The analog or w-plane frequency response is g(s). The digital frequency response is g(z) at
z=exp(s*g.delta). If g.delta==0 then g.delta=1 is used. For the usual frequency response s should be
complex and on the jw-axis, as returned by freqvec and dfreqvec. To use a different delta then reset
the the structrual member: g.delta=newDelta; y=freq(g,s).
Examples:
w=freqvec(.01,100,100); y=freq(g,w); bode(w,y)
y=freq(g,w=freqvec(.01,1000,100)); bode(w,y)
bode(g)
See also dfreqvec, freqvec, point, substitute, svfreq, and point.
margin
margin(g)
Returns text containing phase, delay, gain, and mp margins. Does so by searching from
0.001 to 1000 rad/sec for –180 phase crossovers, unit gain crossovers, or local maxima of
g/(1+g). Returns multiple occurances if they occur. The input g can be a tf or siso quadruple.
margin(g,w)
Returns text containing the closest occurance to w rad/sec of each type of robustness
margin.
margin(g,[wlow,whigh,npts])
Searches from wlow to whigh rad/sec with npts number of points.
(text,mat)=margin(g,w)
(text,mat)=margin(g,[wlow,whigh,npts])
Returns the text the same as displayed in the text variable “text” and returns the margins in
the matrix “mat” packed as follows:
1st column = type (1=phase, 2=delay, 3=gain, 3=mp)
2nd column = omega r/s
3rd column = the margin
The phase is returned in degrees, delay in seconds, and gain and mp as unitless gains, not
dBs.
Definitions:
phase margin = 180+phase where magnitude is unity
delay margin = delay with phase lag equal to phase margin
gain margin = 1/gain where phase is -180 degrees
mp margin = local maximum of g/(1+g)
Example:
CC>b=butter(2,2)/s
CC>margin(b)
At w= 0.973 r/s, Phase margin= 47.97 deg, Delay margin= 0.86 sec
At w= 1.22 r/s, Mp= 1.3 (2.29 dB)
At w= 2 r/s, Gain margin= 2.83 ( 9.03 dB)
CC>(text,mat)=margin(b)
CC>mat
mat =
1
0.9731041
47.965209
2
0.9731041
0.8602891
4
1.2216030
1.3023584
3
2.0000003
2.8284279
See also: phasemargin, delaymargin, gainmargin, mpmargin, bandwidth, airplanebw.
point
point(g,w)
Returns text containing g(s) at s=j*w or g(z) at z=exp(j*w*delta), as shown in the following example:
CC>b=butter(2,2)
CC>point(b,3)
At s = 0 + 3j
b(s) = -0.2061856 - 0.3499085j
Magnitude = 0.4061385 (-7.8265175 dB)
Phase = -120.50896 deg
See also: bode, freq.
phasemargin
x=phasemargin(g)
Returns a two element row vector containing the unit magnitude crossover frequency in rad/sec and
the phase margin in degrees.The input g is a tf or siso quadruple. Searches for unit magnitude
crossovers from 0.001 to 1000 rad/sec. Puts multiple occurances if found in a 2 column matrix.
Returns null if no crossovers are found.
The phase margin is 180 plus the phase at unit magnitude. The phase margin is the phase lag that
destabilizes the closed loop system.
x=phasemargin(g,w)
Returns the closest phase margin to w rad/sec, or null if none found.
x=phasemargin(g,[wlow,whigh,npts])
Searches from wlow to whigh rad/sec with npts number of points.
Example:
CC>b=butter(2,2)/s
CC>phasemargin(b)
ans =
0.9731041
47.965209
See also: margin, delaymargin, gainmargin, mpmargin, bandwidth, airplanebw.
gainmargin
x=gainmargin(g)
Returns a two element row vector containing the –180 degree phase crossover frequency in rad/sec
and the gain margin as a linear gain (and not in dB). The input g is a tf or siso quadruple. Searches
for –180 phase crossovers from 0.001 to 1000 rad/sec. Puts multiple occurances if found in a 2
column matrix. Returns null if no crossovers are found.
The gain margin is the inverse gain at the –180 degree phase crossover frequency. The gain margin
is the gain increase that destabilizes the closed loop system.
x=gainmargin(g,w)
Returns the closest gain margin to w rad/sec, or null if none found.
x=gainmargin(g,[wlow,whigh,npts])
Searches from wlow to whigh rad/sec with npts number of points.
Example:
CC>b=butter(2,2)/s
CC>gainmargin(b)
ans =
2.0000003
2.8284279
See also: margin, phasemargin, delaymargin, mpmargin, bandwidth, airplanebw.
time
time(g)
Plots the unit step response.
time(g,ut,u)
Plots the response to a time series input.
time(g,input,...,delta,tmax)
Plots the response to different types of inputs.
time(...,'simoption',param,...,'plotoption',param,...)
General form. See sim and plotoption.
Plots the result of a linear simulation. Use in place of sim without having to store the output times and
values. Provides the convenience of automatically changing tmax to match the plotted x-axis.
The example:
b=butter(2,2); time(b)
is the same as:
(yt,y)=sim(b); plot(yt,y)
To plot vector outputs with axes for each output use:
(yt,y)=sim(p,ut,u); stripchart(yt,y)
See also: input, plot, sim, stripchart, timevec.
sim
(yt,y)=sim(g)
Returns the unit step response.
(yt,y)=sim(g,delta,tmax)
Returns the unit step response with the specified delta and tmax.
(yt,y)=sim(g,ut,u)
Returns the response to a time series input.
(yt,y)=sim(g,'input_option',input_parameters,delta,tmax)
Returns the response to different types of inputs and with the specified delta and tmax.
(yt,y)=sim(g,'input_option',input_parameters,'sim_option',parameter,...)
General form.
Parameters:
yt = vector of output times
y = vector or matrix of output values
g = tf, tf matrix, or quadruple
ut = vector of input times
u = vector or matrix of input values (if a matrix then each column is the input signal for the
corresponding input channel).
delta = sample period
tmax = maximum of output times
Input options and parameters:
‘timeseries’,ut,u
'step',height
'impulse',area
'pulse',height,width
'whitenoise',sigma,seed
'zero'
Simulation options and parameters:
'delta',delta sample period
'tmax',tmax max time
'ic',x0
i.c. vector (quadruple only)
'channel',n selected input channel
Step reponse example (delta and tmax are automatically determined):
b=butter(2,2);
(yt,y)=sim(b)
Pulse response example (with delta=.1 and tmax=10):
(yt,y)=sim(b,'pulse',1,1,.1,10)
Initial condition example (with zero input and with delta and tmax automatically determined):
p=ocf(b)
x0=(1;0)
(yt,y)=sim(p,'zero','ic',x0)
Time series example (with delta=.01 and tmax=5):
ut=(0,1,2,5)
u=(0,1,0,0)
(yt,y)=sim(b,ut,u,.01,5);
To plot the simulation output:
plot(yt,y)
To plot both the input and output (respectively blue and red):
plot(ut,u,'b',yt,y,'r')
For further details see: simulation overview
See also: input, plot, stripchart, time, timevec.
Simulation Overview
Linear simulation: The sim function computes linear simulations of transfer functions, tf matrices,
and quadruples. The simplest from is a unit step response from the first input:
(yt,y)=sim(b)
For a time series input:
(yt,y)=sim(b,ut,u)
Input types that can be automatically generated include step, impulse, and pulse inputs. See the sim
function for further details.
Time Series: The input time series has times in the vector ut and values in the vector or matrix u.
The output time series has times in the vector yt and values in the vector or matrix y. Multiple inputs
and outputs are stored in matrix columns. The number of columns of u must be equal to the number
of system inputs. If ut is evenly spaced the yt = y, and if only one output parameter is included in the
simulation then y is output. For time series inputs the input values are linearly interpreted between
the input times and are held constant after the last input time.
Computational Methods: For analog tfs and tf matrices the inverse Laplace transform is used for
step, impulse, and pulse inputs. ZOH discretization of analog tfs and tf matrices is used for all other
types of inputs including time series inputs. ZOH discretization is always used for analog quadruple
system. The 6th order Pade approximation is used to compute the required matrix exponential. For
digital tfs, tf matrices, and quadruples the simulation is computed using difference equations.
Maximum time: The maximum time, tmax, can be manually entered using the ‘tmax’ sim option or
is automatically determined using the following logic:
1) For time series inputs the max time in ut is used,
2) Otherwise use 5 times the maximum time constant,
3) Except for integral systems use tmax = 5.
Sample period: The sample period, delta, can be manually entered using the ‘delta’ sim option or is
automatically determined using the following logic:
1) For digital systems use g.delta.
2) Otherwise for time series inputs with regular spacing use that spacing.
3) Otherwise use delta = tmax/500.
Initial conditions: Initial conditions can be specified for quadruple systems using the ‘ic’ sim option.
The ic must be a vector of compatible dimensions, and the ic response can be mixed with any of the
input options. For just the ic response use the ‘zero’ input type.
Nonlinear simulation: Nothing is automatic, but nonlinear simulations can be generated by using
for-loops in user-defined functions.
input
(yt,y)=input(input,...,delta,tmax,'simoption',param,...)
Returns input times and values. The outputs are the same as using sim with a system g = 1. Use the
input function for creating a time series with evenly spaced times.
Example:
(yt,y)=input('step',1,'delta',.1,'tmax',5)
See also: sim, time, timevec
Printing and Copying
Hardcopy output can be created by printing and copying.
Copying and pasting uses the standard Windows hotkeys. When copying a selection of text the
Courier New font is recommended. This is the font used in the command window, and it is
recommended because it is non-proportional, needed so that matrix and transfer function displays
line up, and because it correctly displays the line used as part of the transfer function displays.
Character 227 is used for this line, which is not always a line in other font selections.
When copying a plot a bitmap copy is used. The resolution defaults to the same as used for the
screen (72 dpi), appropriate for documents such as this help file that are designed to be displayed on
a computer screen. Double and quadruple resolution can also be used for copying (respectively 150
and 300 dpi). The resolution can be selected using the Copy Option menu item, or by the copy and
copyoption functions.
The print menu item and the print function can be used to print a figure. The default for the print
function is a full page portrait print of the current figure, preserving the screen aspect ratio. A figure
can be created with a mixture of plots and/or text, and then printed as a single unit on the printer.
The location of the figure on the printer page can be set using options, included with either the plot,
plotoption, or print functions. For example, the figure can be set to fill the printer page. The full
resolution of the printer is used.
Another approach to printing is to place more than one figure on the printer page, and also to mix the
plots with text. Buttons (on the print dialog box) and options (in the print command) can be used to
easily print full page landscape, or 2 or 3 to a page portrait. Print options can also be used to divide
the printer page into subplots, or place a plot to any rectangle on the printer page.
The lpdisplay function can be used to print variables and text. The lptext function is also used to
display text, with more flexibility. Other “lp” functions also can be used, mainly to display transfer
functions in different ways, such as lpsho. A cursor is used to automatically march down the printer
page, and to page eject when the page is full. After a plot the cursor automatically moves to just after
the plot, or if a page eject is used as part of the plot, to the top of the next page.
A figure that is copied using screen resolution will be an exact copy of what is on the screen.
Copying at higher resolution and printing should result in an image that is close to what is on the
screen, but it may not be exactly the same, particularly if automatic scaling is used.
Another consideration is that larger size fonts, relative to the dimensions of a plot, usually look better
on printed images. Use the fontsize plotoption to increase the size of the fonts before copying or
printing the figures, for example: plot(x,y,‘fontsize’,16). The default fontsize is 10 pts.
There is currently a problem printing to HP printers that are setup using “Vector graphics,” which is
the default. If plots take a long time to output and/or having missing parts, then switch to “Raster
graphics” using the printer properties dialog box.
See also: plotting overview, copy, copyoption, lpdisplay, lptext, plot, plotoptions, text, textoptions.
Classical Control Plots
Frequency response plots are created with the following functions:
CC>b=butter(2,2)/s
CC>bode(b)
CC>nyquist(b)
CC>nichols(b)
A root locus plot is created by:
CC>rootlocus(b)
A unit step response is plotted by:
CC>time(b)
See each of these functions for further details. The recommended way to use them is to use
automatically scaling and then manually adjust them using the plot option dialog box. The previous
set of scales or a standard set of scales can also be used:
CC>bode(b,’redo’)
CC>bode(b,’std’)
See also: plotting overview, bode, nichols, nyquist, plot, rootlocus, time.
Command Dialog Box
The command dialog box contains the command line and a list box with different types of lists:
Previous commands
Variables
All functions
Plot options
Path
Structure members
User defined functions
Text options
The command dialog box is popped up by using the Alt-X hot key.
The Enter button echoes the command line is to the command window, executes the command and
displays the text results if any in the command window.
The Close button closes the dialog box, echos the command line to the command window, but does
not execute the command.
The Cancel button closes the dialog box and nulls out the current command.
Program CC Version 4 Compatibility
The key words are “not very.” Program CC Version 5 differs in many ways from Version 4. The
differences (for user’s familiar with Version 4) are listed below:
1. All of the Version 4 commands are replaced with function calls. For example, the Version 4
command "eig,a,d" is replaced by the function call "d=eig(a)".
2. In Version 4 the command arguments are prompted if not included on the command line. This is
no longer supported – all of the arguments must now be included as part of a function call.
3. In Version 4 only the non-ambiguous part of a command name needs to be entered. For
example: "display" can be shortened to "dis". Now the full name needs to be entered.
4. In Version 4 the variable and commands names are case insensitive. In Version 5 the variable
and function names are case sensitive.
5. In Version 4 the variable names are limited to 6 characters followed by an optional dot and up to
a 3 character suffix. In Version 5 there is no limit to the length of a command name. Dots cannot
be used. Underlines can now be part of a name.
6. In Version 4 there are different command levels, the main ones being CC, STATE, and DATA.
Now there is only one command level.
7. In Version 4 the programs are called “macros.” Now the programs are called “functions” and
“scripts.” A macro with no arguments is equivalent to a script. There is no equivalent to a macro
with arguments. Despite this difference, the same file type .mac is used in Version 5.
8. In a Version 4 macro (with or without arguments) all of the variables used in the macro are
global. In a Version 5 function the arguments and variables are local, and in a Version 5 script
file the variables are global.
9. A Version 4 macro with arguments has the syntax “@foo,a,b,c,d”. This is now replaced by the
syntax “(a,b)=foo(c,d)”. The at sign (@) is no longer used, and a distinction is made between
input and output arguments.
10. In Version 4 the macro arguments are embedded in the programming text with the symbols &1,
&2, …, &n and are replaced at run time using ASCII substitution. This syntax is no longer used. If
ASCII substitution is needed then the eval and feval functions can be used.
11. In Version 4 command arguments that expect text replies the text does not need to be
surrounded by single quotes, for example “bode,redo”. Now all text arguments are treated as
string variables that must be surrounded by single quotes, for example “bode(g,’redo’)”.
12. In Version 4 the statements are terminated by & or <ret>. In Version 5 the semicolon can also be
used.
13. In Version 4 the statements cannot be continued to the next line. In Version 5 this can be done
using ellipses (…).
14. In Version 4 macros the comments are lines that begin with an apostrophe in the first column.
This type of comment is still supported, and in addition any text between the percent sign (%)
and the next <ret> is a comment. The percent sign can be anywhere on the line including after
executable text.
15. In Version 4 the macro execution continued after an error. Now function and script execution
does not begin if a compile error is found and the execution stops whenever a runtime error is
found.
16. In Version 4 the for and while loops were quite slow. Now they are much much faster.
17. In Version 4 the macros are interpreted. Each line is tokenized and parsed, immediately
executed, and then forgotten. Each line in a for or while loop is interpreted in each pass, which is
why Version 4 looping is so slow. In Version 5 an entire function or script is tokenized and
parsed (i.e., compiled) before the first line is executed, and then the executable version is saved
for later use.
18. In Version 4 the macros echo text to the command line using “echo, text”. This is done in Version
5 using “disp(‘text’)”.
19. A conversion utility from Version 4 macros to Version 5 functions is not available.
20. In Version 4 all of the systems (transfer functions and quadruple) are either analog or digital,
depending on the current mode, and if digital all of the sample periods are the same. In Version
5 each system is declared analog, digital, or w-plane; and the digital and w-plane sample periods
can be individually set.
21. Version 4 included the “data file” and “functions of transfer functions” variable types. These
variable types are no longer supported.
22. In Version 4 scalar plus matrix addition was defined as the scalar times an identity matrix plus a
23.
24.
25.
26.
27.
28.
29.
30.
31.
32.
square matrix. In Version 5 scalar plus matrix addition is defined as the scalar added to each
element.
Structure members are supported in Version 5, for example “a.nrows”.
In Version 4 quadruple parts are selected by p(a), p(b), p(c) ad p(d). In Version 5 the quadruple
parts are selected by p.a, p.b, p.c and p.d.
Version 5 includes logic operators && || and ~.
Version 5 includes increment and decrement operators ++ and --.
Version 5 includes operation assignment operators such as += and -=.
A Microsoft Windows interface
32-bit programming allowing large size variables.
“help name" displays help about function "name".
New file formats. All of the variables in a project are stored in a single .cc file. Version 4 files can
be loaded and saved.
A limited ability to execute Matlab .m files.
Transfer Functions
Entering: Transfer functions are entered as algebraic expressions. To enter:
5
g (s) =
s+5
type the following:
CC>g=5/(s+5)
Display the transfer function (or any other variable) by typing its name:
CC>g
5
g(s) = ----s+5
Now try a slightly more involved example, to enter:
g1 ( s ) =
10( s + 1)
s[ s 2 + 2(.1)(10) s + 102 ]
type the following:
CC>g1=10*(s+1)/(s*[s^2+2*.1*10*s+10^2])
CC>g1
10(s+1)
g1(s) = ----------------s(s^2 +2s +100)
Use the Courier New Font: By the way, when copying transfer functions from the command window
into documents use the “Courier New” font so that the dividing line is an actual line and not the
strange symbol used by the “Courier” and “Fixedsys” fonts.
Polynomials: Polynomials are treated as transfer functions with a unit denominator:
CC>p=s^3+3*s^2+10*s+100; p
p(s) =
s^3 +3s^2 +10s +100
Filters: Several functions are available to generate different types of transfer functions. Try a few of
the following:
CC>butter(2,2)
CC>chebyshev(2,2,2)
CC>bessel(2,2)
CC>itae(2,2)
CC>pade(.1,2)
CC>leadlag(2,30)
CC>integrator
CC>notch(2,.1,.5)
CC>onepole(2)
CC>twopoles(.7,2)
CC>onezero(2)
CC>twozeros(.7,2)
For help on any of these:
CC>help butter
or:
CC>winhelp butter
or if just the name is entered then a dialog can be used to enter the parameters:
CC>butter
Transfer Function Displays: Transfer functions can be displayed in several different ways, as
suggested by the names of the following function. Try the following, without the comments:
CC>display(b) % displays coefficients as they are stored
CC>shorthand(b) % or sho, the shorthand form
CC>single(b) % multiplies polynomial factors
CC>unitary(b) % sets each high order coefficient to one
CC>pzf(b) % pole-zero-form
CC>tcf(b) % time-constant-form
CC>pfe(b) % partial fraction expansion
CC>ilt(b) % inverse Laplace transform
The shorthand form is popular is some locales. As the name suggests, the display is fairly short, and
is defined by:
g ( s) =
a ( s + b)
2
2
s[ s + 2ζω s + ω ]
=
a (b )
(0)[ζ , ω ]
Usually, at least around here, the function name is shortened to “sho.” Note that the damping and
natural frequency of complex modes are displayed, which are usually more meaningful than the real
and imaginary parts, but if you want to see the real and imaginary parts then use the pzf
(pole-zero-form) function, defined by:
g ( s) =
a ( s + b)
s[( s − Re) ^ 2 + Im 2 ]
The tcf (time-constant-form) function is defined by:
g ( s) =
( ab / ω 2 )( s / b + 1)
s[( s / ω ) 2 + 2ζ s / ω + 1]
The coefficient multiplying the s term is the effective delay (or advance if negative ) of that mode.
The pfe (partial fraction expansion) and ilt (inverse Laplace transform) are described in separate
sections of the tutorial.
Entering Using Coefficients: Transfer funtions can also be entered a vector of coefficients. The
second example can be re-entered by:
CC>g1=enter(2,0,10,1,1,1, 2,1,1,0,2,1,2*.1*10,10^2)
Most people prefer the symbolic form, and who can blame them? The order of the coefficients is:
the number of polynomials in the numerator
the polynomials
the number of polynomials in the denominator
the polynomials.
Each polynomial is entered by the polynmoal order followed by the coefficients ordered high to low.
To go back and forth with the vector of coefficients:
CC>vec=tovec(g1)
CC>vec
CC>g2=enter(vec)
CC>g2
Entering Using the Shorthand Form: The shorthand form can be used to enter transfer functions.
For the g1(s) example type:
CC>g1=senter(2,0,10,1,1, 2,1,0,2,.1,10)
CC>sho(g1)
10( 1)
g1(s) = ------------(0)[ 0.1, 10]
The coefficients are:
the number of numerator factors
the factors
the number of denominator factors
the factors.
Constants b are entered as 0,b; first order factors (a) are entered as 1,a; and second order factors
[zeta,omega] are entered as 2,zeta,omega.
Display Example: If you didn’t type of the different display as suggested above (why not?), this
segment is finished with all of them:
CC>b=butter(2,2)*pade(.1,1)/s
CC>display(b)
4( -s+20)
b(s) = ---------------------------s(s^2 +2.8284271s +4)(s+20)
CC>sho(b)
-4(-20)
b(s) = -----------------------(0)[ 0.7071068, 2] ( 20)
CC>single(b)
-4s+80
b(s) = ------------------------------------s^4 +22.828427s^3 +60.568542s^2 +80s
CC>unitary(b)
-4(s-20)
b(s) = ---------------------------s(s^2 +2.8284271s +4)(s+20)
CC>pzf(b)
-4(s-20)
b(s) = -------------------------------------s[(s+1.4142136)^2+1.4142136^2] (s+20)
CC>tcf(b)
-0.05s+1
b(s) = ---------------------------------------s ( 0.25s^2 +0.7071068s +1)( 0.05s+1)
CC>pfe(b)
1
0.9769739s+3.2238219
b(s) = --- - ------------------------------s
[(s+1.4142136)^2+1.4142136^2]
-
0.0230261
---------(s+20)
CC>ilt(b)
b(t) = 1 - 1.6282743*sin(1.4142136t+0.6435083)*exp(-1.4142136t) - 0.0230261
*exp(-20t) for t >= 0
The Feedback Operator
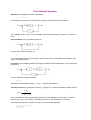
Definition: The feedback operator is defined as:
g|h = g/(1+h*g)
The feedback operator returns the closed loop system for the following block diagram:
The variables g and h can be of any compatible type and the dimensions of g and h’ must be the
same.
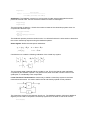
Unity Feedback: For unity feedback systems:
compute the closed loop system by:
g|1
If g is multivariable then it must be square, and the unity gain in the feedback path expands to the
correct size identity matrix.
Precedence: The feedback operator has higher precedence than multiplication, so the closed loop
response of:
must be computed using parentheses:
(g*k)|h
Note that for multivariable systems g*k and k*g are quite a bit different.
Transfer Functions: For transfer functions g = ng/dg and h = nh/dh the feedback operator returns:
g|h=
ng d h
ng nh + d g d h
Due to cancellations that take place during transfer function algebra the same result is returned
whether g|h or g/(1+h*g) is used. The feedback operator is convenient but not necessary.
In the following example a closed loop system is computed and displayed:
CC>g=10*(s+1)/s/(s+2)
CC>h=3/(s+4)
CC>cl=g|h
CC>pzf(cl)
10(s+1)(s+4)
cl(s) = ------------------------------(s+0.898)[(s+2.551)^2+5.188^2]
Quadruples: The feedback operator is more important for state space quadruples because it
preserves minimal order. Convert the above transfer functions to state space:
CC>pg=ccf(g)
CC>ph=ccf(h)
The total number of states is 3. Check the number of states of the closed loop system when it is
computed two different ways:
CC>(pg|ph).nstates
ans = 3
CC>(pg/(1+ph*pg)).nstates
ans = 5
The feedback operator preserves minimal order. You will also find that it is often easier to determine
the correct closed loop response using the feedback operator.
Some Algebra: Define the state space realizations:
x& g = Ag xg + Bg u
y = C g xg
x&h = Ah xh + Bh y
u = r − Ch xh
Combine them to create the following realization of the closed loop system:
⎡ x& g ⎤ ⎡ Ag
⎢ ⎥=⎢
⎣ x&h ⎦ ⎢⎣ BhC g
y = ⎡⎣C g
− Bg Ch ⎤ ⎡ xg ⎤ ⎡ Bg ⎤
⎥⎢ ⎥+⎢ ⎥r
Ah ⎥ ⎣ xh ⎦ ⎣ 0 ⎦
⎦
⎡ xg ⎤
0 ⎤⎦ ⎢ ⎥
⎣ xh ⎦
The augmented state is defined with the xg state on top. This is the (special case) realization
computed by the feedback operator. The general case, when there are nonzero D terms in the
quadruples, is considerably more complicated.
Linear Fractional Transformation: Another way to define a closed loop system is the linear
fractional transformation. It is used to define the H2 and Hinfinity optimal control problems:
The closed loop system is the response from d to e. The feedback operator (with some additional
algebra) can be used to compute the closed loop system but it is easier to use the lft function:
mcl=lft(m,k)
The Plot Function
The plot function plots vectors and matrices. Examples are given of the different combinations that
can be plotted. Duplicate the plots by copying the commands, pasting them on the command line,
and then hitting return.
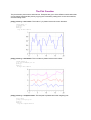
plot(y), where y = real vector: The index of y is plotted versus the vector elements:
rand('seed',1)
y=rand(1,20)
plot(y)
what(y)
1 by 20 Real Matrix
plot(y), where y = real matrix: The row index is plotted versus each column:
randn('seed',1)
y=(1,2,3)+randn(20,3)*.25
plot(y)
what(y)
20 by 3 Real Matrix
plot(y), where y = complex vector: The real part is plotted versus the imaginary part:
x=0:1/500:1
y=exp((-3+10*pi*j)*x)
plot(y)
what(y)
1 by 501 Complex Matrix
plot(y), where y = complex matrix: The real part versus the imaginary part of each column is
plotted:
y1=(y.',y.'+1)
plot(y1)
what(y1)
501 by 2 Complex Matrix
plot(x,y), where x and y are real vectors: Plots x versus y. They must be the same length:
x=(-2:.01:2)'
y=x.^2
plot(x,y)
plot(x,y), where x is a real vector and y is a real matrix: Plots x versus each column of y. The
length of x and the number of rows in y must be the same:
y=(x,x.^2,x.^3,x.^4)
plot(x,y)
axis([-1 1 -1 1])
plot(x,y), where x and y are real matrices: Plots columns of x versus respective columns of y. The
dimensions of x and y must be equal:
x1=(x,2+x,4+x,6+x)
plot(x1,y,'xlim',-1,7,'ylim',-1,1)
For plot(x,y), if x and/or y is complex then the real part is used.
plot(y,’s’): Changes one or more of the line style, line color, symbol style, line width, and symbol
height; according to the code:
y
m
c
r
g
b
w
k
la
a
yellow
magenta
cyan
red
green
blue
white
black
light gray
gray
-:
-.
---..
s
|
solid line
dashed line
dotted line
dash dot line
long dashed
dash dot dot
stairsteps
spikes
.
o
x
+
*
[]
t
<>
point
circle
x-mark
plus
star
box
triangle
diamond
In addition:
dy, dm, dc, dr, dg, db, and da are dark colors.
lwn where n>=1 specifies the line width (default=1)
shn where n>=1 specifies the symbol height (default=6)
Here’s an example:
rand('seed',1)
y=rand(1,20)
plot(y,'r-lw2[]sh12')
The example specified:
r
lw2
[]
sh12
red
solid line
line width 2
boxes
symbol height 12
The plot change dialog box (line option) can be used to made the same changes.
Log10 Scales: The x and/or y-axes can be plotted using log10 scales. To plot the y-axis with a log10
scale:
semilogy(y)
To plot the x-axis with a log10 scale:
semilogx(y)
And to plot both axes with log10 scales:
loglog(y)
Cursors
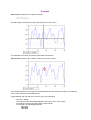
Axis Cursor: Create a plot of random numbers:
CC>rand('seed',1)
CC>plot(rand(1,20))
And then single-click anywhere on the plot to popup an “axis cursor:”
It is called the “axis cursor” because it reads values off the axes.
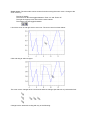
Trace Cursor: Use the Ctrl+T hotkey to switch to the “trace cursor:”
The diamond-shaped cursor jumps to the nearest data point and reads off the value. It is called the
“trace cursor” because it traces data points.
Toggle between the axis and trace cursors by any of the following:
The Ctrl+T hotkey.
The Plot menu item that toggles between “Axis cursor” and “Trace cursor.”
The right-click popup menu item with the same names.
The tool bar icon that toggles between:
Zoom cursor: The axis scales can be zoomed in and out using the zoom cursor. Change to the
zoom cursor by:
The Ctrl+Z hotkey.
The Plot menu item that toggles between “Zoom on” and “Zoom off.”
The right-click popup menu item with the same names.
The toolbar icon that toggles between:
Left click to zoom in and right click to zoom out. The zoom cursor is shown below:
Click and drag to select a region:
The zoom cursor changes when over an axis and then changes just that axis or just that axis limit:
Change back to automatic scaling with any of the following:
The Ctrl+A hotkey.
The “Autoscale” Plot menu item.
The “Autoscale” right-click popup menu item.
The toolbar icon:
Changing the Plot
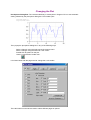
Plot Options Dialog Box: The recommended way to create plots in Program CC is to use automatic
scaling followed by the plot options dialog box. First create a plot:
CC>rand('seed',1)
CC>plot(rand(1,20))
Then popup the plot options dialog box in any of the following ways:
Select “Change” using the right-mouse-click popup menu
Select “Change” using the menu-bar “Plot” menu
Double-click anywhere on the plot.
Use the “Construction” toolbar icon:
It is shown below with the page used to change the x-axis scales:
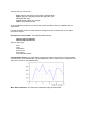
The radio buttons on the left are used to select different pages of options.
The top group of controls are:
Auto: Set all of the options to automatic or default values.
Apply: Apply the changes and keep the dialog box open.
Ok: Apply and close.
Cancel: Close without any changes.
Help: Popup Windows help.
All of the editlines (except for new lines) must contain numbers or text, not variable names or
expressions.
Use the plotoption function to make the same changes from the command line or from within
functions or scripts.
Plot Options on the Toolbar: The following toolbar buttons:
are from left to right:
Print
Copy
Plot options
Zoom cursor
Auto scaling
Axis and trace cursors
Changing Axis Scales: The page used to change axis scales is shown above. The parameters
checked “Auto” are so determined. The label defaults to none for “plot” function. Change the max
value of the x-axis to 10 and add a label:
More Axis Parameters: The “More Axis Parameters” page is shown below:
The label font, location, and orientation can be changed.
The numbers on the axis can have their font changed and the number of significant digits
changed.The label and number fonts can be different.
The tick position and lengths can be changed.
More Changes:
The “Title” page is used to enter the plot title and to change its font.
The “Font” page is used to change and make all of the fonts the same; for the title, axis labels, axis
numbers, and plot text.
The “Grid” page is used to change the background. Some of the options are for specific plots.
The “Text” page is used to add text to the plot and is described in another tutorial section.
The “Standard” page is used make the current axis limits and options the “standard” for this type of
plot. The standard options can then be quickly set using the right-mouse-click popup menu.
Adding Text
A plot can be annotated with text. The location is specified using the current axes. Tex commands
can be embedded in the text. Start this example by creating a plot with random numbers:
CC>rand('seed',1)
CC>plot(rand(1,20))
Adding Text Using a Right-Click: Right-click where you want the text to be located. A popup menu
will appear:
Select “Text” and then the plot options dialog box will pop up with the text page showing. Enter the
text and then press the “Apply” or “Ok” button. The text will then be copied to the plot with the anchor
point at the original right-click location:
Moving the Text:
Move the text by clicking and dragging.
Double click the text to popup the plot options dialog box with the “Text” page:
Use the “location x” and “y” editlines to change the location of the anchor point in the current axis
scales.
Changing the Text:
Change the text using the plot options dialog box.
The “Use defaults” checkbox resets everything except the text and location.
The “Font” button is used to change the font for just this piece of text.
The “Background Color” changes the background color.
The “Anchor Point” is point on the frame for which the text location is defined.
The “Rotation” sets the angle of the text measured clockwise from the positive real axis.
Use the “Previous Text” and “New Text” buttons to select existing or new text.
The font size and color of the “Sample Text” is changed below:
Frames and Callouts:
The “Frame” checkbox puts a box around the text.
The “Callout” checkbox draws a line connected from the frame to the “callout x” and “y” location. This
location also uses the axis scales. The callout line can be adjusted using the cursor.
Examples are shown below:
Deleting the Text:
Select the text by clicking on it and then use the “Del” key to delete it.
Use the “Remove Text” button on the “Text” page.
Tex Commands: Tex is an equation editing language for laying out equations. Tex commands use
regular text and can be imbedded in plot text, plot titles, and axis labels. A subset of Tex is
implemented in Program CC and can be used for subscripts, superscripts, fractions, Greek letters,
and selected mathematical symbols. See the reference manual for a complete list. For this example:
CC>xlabel(‘a^2 + b_3 + c_4^5 + \alpha\beta\gamma’)
CC>text(‘g(s) \approx {s+1\over s^2+2s+10}e^{-.1s} ’,20,0,’br’)
Fancier Text and Callouts: Copy the plot to Word, add callouts with arrows, explosions, word art,
and so on. For example:
The text function: To enter text from the command line:
CC>text('More text',1,.7)
Text options can be used to select the same options as when using the plot options dialog box. For
example, the above command can be changed to include a frame and a callout:
CC>text('More text',1,.7,'frame')
CC>text('More text',1,.7,'callout')
See the text function for a complete description.
Typically the text function is used to recreate a figure used in a report. Make adjustments to the
original figure using the plot options dialog box and the mouse, and then copy the text locations from
the dialog box to the text function.
Add New Lines
Using the Plot Option Dialog Box: Create a plot with random numbers:
CC>rand('seed',1)
CC>plot(rand(1,20))
Popup the plot options dialog box and switch to the “Lines” page:
Put the new y (as above) or x,y entries into the editline.
Select the color, linestyle, symbol, line width, and symbol size options. These are the same choices
that can be surrounded by single quotes in the “plot” function.
Apply the above choices. The entry will be echoed to the command line to check for errors. The
result is:
The buttons on the “Lines” page can be used to delete an existing line, select an existing line, or
create a new line.
Using the hold function: “Hold” the current plot so that the next plot command will add a new line to
the existing axis:
CC>hold on
CC>plot(.2+.2*rand(1,20),'-[]')
Clear the hold by:
CC>hold off
Using the line function: The “line” function adds a line to the current plot:
CC>line(.6+.2*rand(1,20),'.-')
Using the plotoption function: Any of the plot options and parameters can be changed using the
plotoption function. A new line is entered by:
CC>plotoption('addline',.2*rand(1,20),'<>-')
Multiple Plots
Multiple plots are created in the following ways:
1) The figure function is used to put the next plot in an existing or new window.
2) The subplot function is used to divide a figure into tiles and to put the next plot in one of
the tiles.
3) The stripchart function plots vector time responses on a set of axes.
Figure: Two plots in separate windows are created by:
The function “figure” is echoed to the screen by the toolbar icon:
The above tiling of the windows is created using the toolbar icon:
For an alternative tiling use:
Named Figures: The “figure” function can set the number or name of the figure:
The two new figures are named “Plot View 10” and “String Title.”
Making Changes: The plot change dialog box can be called for any of the figures and used to make
changes. Functions such as “title” and “plotoption” can be used to make changes from the command
line. These functions always work on the current figure, which is the last one plotted or the last one
referred to using the “figure” function. For example, to add a title to “Plot View 2:”
CC>figure(2)
CC>title('New title')
The “gcf” function returns the number or name or the current figure, in this case:
CC>gcf
ans = 2
Subplots: Close all of the above figures using the Windows/Close All menu item. Clear the
command window using “Ctrl+A” and pressing “Del” twice.
Create a new figure with two vertical tiles, each with its own plot:
The windows were arranged using:
The “subplot(mnp)” function creates a m by n set of tiles and puts the next plot in the p’th tile
counting row-wise. In the above example a 2x1 set of tiles are created and each tile is filled. Any
existing tiles that are overwritten in whole or in part are deleted.
The “subplot(‘position’,left,bottom,width,height)” defines a tile using fractional locations 0 to 1,
defined left-to-right and bottom-to-top; so that “left,bottom” defines the left-lower corner of the axes
and “left+width,bottom+height” defines the right-upper location of the axes. Room should be left for
the axis and title.
If “subplot(mnp)” is used then the axes are automatically indented to make room for axis labels and
the title, unless the plots are very very small.
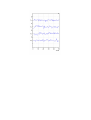
Stripchart: Use the stripchart function to put a vector time series on separate vertical axes with a
common horizontal axis. (What is actually done is that each column of a matrix is plotted on a
separate vertical axis). In the following example random numbers are plotted versus the row
numbers:
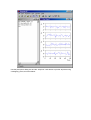
Use the plot options dialog box and the “stripchart” radio button to plot the stripchart using
overlapping y axes, as shown below:
Graphics Example
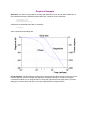
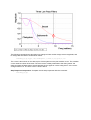
Bode Plot: The claim is that graphics are easy and interactive, so let us now demonstrate this. In
this multi-part example 3 different low pass filters are compared. First create them:
CC>g=butter(3,3)
CC>g1=bessel(3,3)
CC>g2=chebyshev(3,3,3)
A Bode plot of the Butterworth filter is created by:
CC>bode(g)
which should look something like:
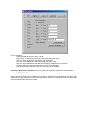
Plot Dialog Box: The plot dialog box was used to add the title and the text next to each line and to
increase the size of the font. Popup this dialog box by double clicking on the plot (or using the
construction toolbar icon or using the menu or using the right-mouse-click popup menu). The plot
dialog box is shown below with the y1-axis (the magnitude axis) change options:
Try the following:
change the dB range from -60 to +20 dB
push “Apply” to make the change and leave the dialog box open
click the “Title” radiobutton and add the title “Bode plot”
click the “Font” radiobutton and change the font size to 14pt
click the “Text” radiobutton and add the text strings “Magnitude” and “Phase”
close the dialog box and move the text by clicking and dragging
copy the plot to the clipboard using the copy icon on the toolbar.
Frequency Response Comparison: Now compare the frequency response of all three filters:
CC>bode(g,g1,g2)
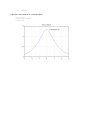
When comparing more than one Bode plot it is best to compare just the magnitude. Use the Bode
radiobutton on the plot dialog box to make this change. Also try to change the axes to linear scales
and then add the title and text to create:
The following command uses plot options to change to linear scales omega versus magnitude, and
to change the axis limits to those shown above:
CC>bode(g,g1,g2,'type','wm','bodeoption',1,'xlim',0,15,'ylim',0,1.2)
The cursor is also shown on the above plot. Click anywhere on the plot to add a cursor. The crossbar
cursor reads its values off the axes. The trace cursor is always attached to the data (“traces” the
data) and reads off data values. Switch between the two types of cursors using Ctrl+T or the cursor
change toolbar icon. The trace cursor is shown above.
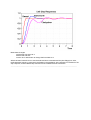
Step Response Comparison: Compare the unit step responses with the command:
CC>time(g,g1,g2)
Make these changes:
set the time axis range to 8
add the title and text
use the “line” radio button to change the line widths to 2.
What has been learned? How to use the bode and time commands and the plot dialgog box. Also,
the Butterworth frequency response is the flattest in the passband, at the expense of overshoot in the
step response, and the Bessel step resonse has the smallest amount of distortion.
-------------------------------------------------------------------------------------------
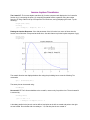
Frequency Response Analysis
Bode Plot: Enter and display the following transfer function:
g (s) =
50( s + 2)
s ( s + 10)
with the commands:
CC>g=50*(s+2)/(s*(s+10))
CC>g
50(s+2)
g(s) = -------s(s+10)
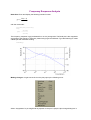
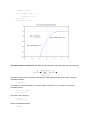
The frequency response is g(s) evaluated for s on the j-omega axis. The Bode plot is the magnitude
and phase of the frequency response, plotted using log10 and dB axes. Type the following to create
a Bode plot with automatic scaling:
CC>bode(g)
Making Changes: A right-mouse-click on the plot pops up the following menu:
Select “Asymptotes” to put magnitude asymptotes on the plot. Popup the plot change dialog box in
any of the following ways:
Select “Change” using the right-mouse-click popup menu
Select “Change” using the menu-bar “Plot” menu
Double-click anywhere on the plot.
Use the “Construction” toolbar icon:
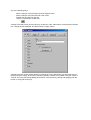
Change to the title screen (shown below) by clicking the “Title” radio button. Enter the title in the edit
box, change the font if desired, and then press the “Apply” button.
Change to the text screen (shown below) by pushing the “Text” radio button. Put each text entry on
the plot using the “Apply” push button; the text is placed by default in the middle of the plot. Close or
“Cancel” out of the plot change dialog box and then move the text by clicking and dragging with the
mouse, or using the arrow keys.
Put a cursor on the plot by clicking and dragging. Change to the trace cursor using the “Cursor”
toolbar icon, which toggles between:
Copy the result to the clipboard using the “Copy” toolbar icon:
After not too much effort my changed plot looks like:
Comparison Plots: In the next Bode plot 2nd order systems with 5 different damping ratios are
compared. Enter the transfer functions with into a tf matrix:
CC>h=(); for i=1:5; h(i,1)=twopoles(.2*i,1); end
Type the following:
CC>sho(h)
CCbode(h).
Here, just to be different, the magnitude and phase are placed in separate plots:
CC>subplot(211); bode(h,'-b','bodeoption',1,'xlim',.1,10,'ylim',-20,10)
CC>subplot(212); bode(h,'-b','bodeoption',2,'xlim',.1,10,'ylim',-180,0)
The plotoptions entered as part of the bode function (or in a separate call to the “plotoption” function)
are how to recreate a plot in a function. The above plot options are:
‘-b’ forces each line to be solid blue
‘bodeoption’,1 selects magnitude
‘bodeoption’,2 selects phase
‘xlim’,.1,10 sets x-axis limits
‘ylim’,-20,10 sets y-axis limits
The labels, title, and text were added using the plot dialog box. The pieces of the text are:
\leftarrow
Top to bottom:\n\zeta = .2, .4, .6, .8, 1
g(s)={1\over[\zeta,1]}
To enter the last one, for example, using the “text” function look at the location in the plot change
dialog box and then recreate the text by:
text('g(s)={1\over[\zeta,1]}',.16,-10.7,'fontsize',12)
Partial Fraction Expansions
Two Real Poles: Partial fraction expansions (pfe’s) are used so that high order transfer functions
can be decomposed into terms with just one pole each. Usually this is done so that the inverse
Laplace transform can be applied to each term. It is also a first step for “hold equivalence”
discretization methods.
Enter a second order transfer function:
CC>g=4/((s+1)*(s+2))
CC>display(g)
4
g(s) = ---------(s+1)(s+2)
And then compute the pfe and the ilt (inverse Laplace transform):
CC>pfe(g)
4
4
g(s) = ------- - ------(s+1)
(s+2)
CC>ilt(g)
g(t) = 4*exp(-t) - 4*exp(-2t) for t >= 0
By the way, when copying pfe’s to a text editor use the Courier New font so that the spacing and
lines are all correct.
The general case for pfe’s is rather tedious, but for a strictly proper transfer function (more poles
than zeros) with no multiple poles the pfe is:
n
ai
, where ai = ( s − pi ) g ( s) s = p
i
i =1 s − pi
g (s) = ∑
You could if you wanted to compute the residues (the ai’s):
CC>substitute((s+1)*g,-1)
ans = 4
CC>substitute((s+2)*g,-2)
ans = -4
Complex Poles: The above formula is valid for complex poles, in which case the poles and residues
are complex and occur in complex conjugate pairs. Try the following:
CC>g=4/((s+1)*(s^2+2*s+5))
CC>pfe(g)
1
s+1
g(s) = ------- - -------------(s+1)
[(s+1)^2+2^2]
CC>ilt(g)
g(t) = exp(-t) - cos(2t)*exp(-t) for t >= 0
The complex pole is at –1 + - 2j, displayed as (s-Re)^2 + Im^2. The pfe command combines the
complex conjugate terms so that the display only has real numbers.
Multiple Poles: Now try a case with multiple poles:
CC>g=4/((s+1)*(s+2)^2)
CC>pfe(g)
4
4
4
g(s) = ------- - --------- - -------(s+1)
(s+2)^2
(s+2)
CC>ilt(g)
g(t) = 4*exp(-t) + (-4t -4)*exp(-2t) for t >= 0
The residue calculations use derivatives with respect to s, and the ilt has a polynomial in t, and it’s
best just to let Program CC swet the details. The general case is described in the reference manual.
Extracting Parts of the PFE: You can use the “partial” function to extract parts of the pfe. The ‘
stable’ flag keeps poles with real parts less than the boundary, and the ‘unstable’ flag keeps poles to
the right:
CC>partial(g,'stable',-1.5)
-4(s+3)
ans(s) = --------(s+2)^2
CC>partial(g,'unstable',-1.5)
4
ans(s) = ----s+1
The “partial” function defaults to ‘stable’ with a boundary of zero, which is the stable partial factor.
The pfe2vec function converts the coefficients of the pfe to a vector, but the description is
complicated, and we will leave it to the reference manual to sort out the details.
Inverse Laplace Transforms
The Causal ILT: The inverse laplace transform (ilt) function computes and displays the ilt of a
transfer function by (1) computing the poles, (2) computing the partial fraction expansion using the
residue formula, (3) using a table look-up to compute the ilt of each term, and (4) displaying the
result. Try the following:
CC>g=4/((s+1)*(s+2))
CC>ilt(g)
g(t) = 4*exp(-t) - 4*exp(-2t) for t >= 0
Plotting the Impulse Response: If the 2nd parameter of the ilt function is a vector of times then the
function returns with the ilt computed at these times. Use this feature to plot the impulse response of
g(s):
CC>t=0:.05:5
CC>y=ilt(g,t)
CC>plot(t,y)
The transfer function was displayed above after using the plot dialog box to enter the following Tex
commands:
g(s) = {4\over(s+1)(s+2)}
The same plot can be created using:
CC>time(g*s)
Noncausal ILT: The ilt functon defaults to the causal ilt; nonzero only for positive time. The
anti-causal ilt is returned by:
CC>ilt(g,'anti')
g(t) = 0 for t >= 0
= -4*exp(-t) + 4*exp(-2t) for t < 0
A boundary parallel to the jw-axis can be defined, and poles to the left are causal and poles to the
right are anti-causal. Do so below with a boundary at –1.5, and then plot the non-causal ilt:
CC>ilt(g,'roc',-1.5)
g(t) = -4*exp(-2t) for t >= 0
= -4*exp(-t) for t < 0
CC>t=-3:.05:3
CC>y=ilt(g,t,'roc',-1.5)
The Autocorrelation and Variance: Now take the same transfer function with input u(s) and output
y(s):
If the input is zero-mean unit-intensity white noise the power-spectral-density of the output is
g(s)g(-s), computed as follows:
CC>yd=g*g(-s)
The stable ilt is the autocorrelation. The autocorrelation evaluated at t = 0 is variance of the output
stochastic process:
CC>ilt(yd,0,'stable')
ans = 1.3333333
This is done more simply by:
CC>var(g)
ans = 1.3333333
And for the standard deviation:
CC>std(g)
ans = 1.1547005
A plot of the autocorrelation is created as follows:
CC>t=-3:.05:3
CC>y=ilt(yd,t,'stable')
CC>plot(t,y)
Classical Control Example: When Delay is a Problem
The Controlled Element: The controlled element is a 3rd order Butterworth filter with a 0.5 second
delay. Enter this system as follows:
CC>g=butter(3,3)*pade(.5,3)
CC>format mini
CC>sho(g)
-27(-9.289)[-0.724, 10.17]
g(s) = ------------------------------------[ 0.5, 3] ( 3)( 9.289)[ 0.724, 10.17]
A 3rd order Pade approximation of the delay is used. The “format mini” command is used to display
just 4 signficant digits. The system g(s) is displayed using the shorthand form, whereby (a) equals
(s+a) and [zeta,omega] equals s^2 + 2*zeta*omega*s + omega^2.
Requirements: The objective is to design a control system that rejects constant output disturbances,
and the step response settles to 2% of the final value within 3 seconds with an overshoot less than
10%. Use the following control architecture:
Open Loop Analysis: First look at the open loop step response:
CC>time(g)
The trace cursor is used to determine the overshoot of 8.1% and the settling time of 2.7 seconds.
The open loop response meets the specfication except for the output disturbance rejection, and
indeed the output disturbance specification is the only reason to use feedback at all. The slight
bobble in the first half second is due to the use of a Pade approximation for the delay. The bobble is
more obvious if you use the zoom cursor to blow up this region (Ctrl+Z, click and drag).
First Try, Integral Control: Classical control design uses guided trial and error. An integral control is
needed to reject a constant output disturbance, and the closed loop bandwidth should be about 1/3
the required rise time, or about 1 rad/sec. Set the controller equal an integrator and then adjust the
gain so that the crossover frequency of gk(s) is 1 rad/sec. The following commands do so
algebraically:
CC>gk=g/s
CC>gk(j*1)
ans = -0.9241708 - 0.3801822j
CC>gk=gk/abs(gk(j*1))
CC>k=gk/g
CC>k
1.001
k(s) = -----s
Compute the closed loop response by using the feedback operator:
CC>cl=gk|1
Look at the Bode plot of the loop transfer function gk(s) and the closed loop step response:
CC>subplot(121); bode(gk); subplot(122); time(cl)
The subplot function is used to place the plots side-by-side in the same window (a 1 by 2 set of tiles
with the plots at index 1 and then 2).
Robustness Margins: The classical robustness margins are:
CC>margin(gk)
At w= 1 r/s, Phase margin= 22.36 deg, Delay margin= 0.39 sec
At w= 1.2 r/s, Mp= 3.89 (11.79 dB)
At w= 1.32 r/s, Gain margin= 1.32 ( 2.42 dB)
The cursor on the Bode plot can also be used to determine the robustness margins, or more
conveniently using the “Robustness” item on the right-mouse-click popup menu. The robustness
margins are not part of the specification, but the closed loop step response obviously does not come
close to the 3 second settling time specification.
Second Try, The Internal Model Control Problem: The combined phase drop of the Butterworth
filter and the delay make this a tricky closed loop design. Another approach is to select a desired
closed loop response, and then compute a compensator that comes close to this desired response
while maintaining closed loop stability. The internal model control problem does this, as long as the
controlled element is stable:
CC>desired=bessel(1,3)
CC>k=imc(g,desired)
CC>sho(k)
0.556( 3)[ 0.5, 3] ( 9.289)[ 0.724, 10.17]
k(s) = ------------------------------------------(0)[ 0.437, 3.996] [ 0.693, 10.86] ( 11.46)
The compensator is 6th order, rather high, but this level of complexity is what it takes to meet the
specifications. Compute the loop transfer function (LTF) and the closed loop response:
CC>gk=g*k
CC>cl=gk|1
CC>sho(cl)
-15(-9.289)[-0.724, 10.17]
cl(s) = ----------------------------------------------( 2.322)[ 0.724, 2.542] ( 9.289)[ 0.724, 10.17]
The closed loop system is stable. The Bode plot of gk(s) and the unit step response of cl(s) are
shown below:
CC>subplot(121); bode(gk,'redo'); subplot(122); time(cl)
The ‘redo’ option is used on the bode function to preserve the axis limits. Using the trace cursor the
overshoot is less than 1%, the 2% settling time is 2.6 seconds, the phase margin is 63 degrees, and
the gain margin is 8.6 dB. The specifications for the design have been satisfied.
The imc function can be used to reduce the rise time further. Use the up arrow to recall and change
the following commands, or better yet put the following in a function:
CC>desired=bessel(3,3); k=imc(g,desired); gk=g*k; cl=gk|1
CC>subplot(121); bode(gk,'redo'); subplot(122); time(cl,'redo')
Classical Control Example: When Delay is a Problem
The Controlled Element: The controlled element is a 3rd order Butterworth filter with a 0.5 second
delay. Enter this system as follows:
CC>g=butter(3,3)*pade(.5,3)
CC>format mini
CC>sho(g)
-27(-9.289)[-0.724, 10.17]
g(s) = ------------------------------------[ 0.5, 3] ( 3)( 9.289)[ 0.724, 10.17]
A 3rd order Pade approximation of the delay is used. The “format mini” command is used to display just
4 signficant digits. The system g(s) is displayed using the shorthand form, whereby (a) equals (s+a) and
[zeta,omega] equals s^2 + 2*zeta*omega*s + omega^2.
Requirements: The objective is to design a control system that rejects constant output disturbances,
and the step response settles to 2% of the final value within 3 seconds with an overshoot less than 10%.
Use the following control architecture:
Open Loop Analysis: First look at the open loop step response:
CC>time(g)
The trace cursor is used to determine the overshoot of 8.1% and the settling time of 2.7 seconds. The
open loop response meets the specfication except for the output disturbance rejection, and indeed the
output disturbance specification is the only reason to use feedback at all. The slight bobble in the first
half second is due to the use of a Pade approximation for the delay. The bobble is more obvious if you
use the zoom cursor to blow up this region (Ctrl+Z, click and drag).
First Try, Integral Control: Classical control design uses guided trial and error. An integral control is
needed to reject a constant output disturbance, and the closed loop bandwidth should be about 1/3 the
required rise time, or about 1 rad/sec. Set the controller equal an integrator and then adjust the gain so
that the crossover frequency of gk(s) is 1 rad/sec. The following commands do so algebraically:
CC>gk=g/s
CC>gk(j*1)
ans = -0.9241708 - 0.3801822j
CC>gk=gk/abs(gk(j*1))
CC>k=gk/g
CC>k
1.001
k(s) = -----s
Compute the closed loop response by using the feedback operator:
CC>cl=gk|1
Look at the Bode plot of the loop transfer function gk(s) and the closed loop step response:
CC>subplot(121); bode(gk); subplot(122); time(cl)
The subplot function is used to place the plots side-by-side in the same window (a 1 by 2 set of tiles with
the plots at index 1 and then 2).
Robustness Margins: The classical robustness margins are:
CC>margin(gk)
At w= 1 r/s, Phase margin= 22.36 deg, Delay margin= 0.39 sec
At w= 1.2 r/s, Mp= 3.89 (11.79 dB)
At w= 1.32 r/s, Gain margin= 1.32 ( 2.42 dB)
The cursor on the Bode plot can also be used to determine the robustness margins, or more
conveniently using the “Robustness” item on the right-mouse-click popup menu. The robustness margins
are not part of the specification, but the closed loop step response obviously does not come close to the
3 second settling time specification.
Second Try, The Internal Model Control Problem: The combined phase drop of the Butterworth filter
and the delay make this a tricky closed loop design. Another approach is to select a desired closed loop
response, and then compute a compensator that comes close to this desired response while maintaining
closed loop stability. The internal model control problem does this, as long as the controlled element is
stable:
CC>desired=bessel(1,3)
CC>k=imc(g,desired)
CC>sho(k)
0.556( 3)[ 0.5, 3] ( 9.289)[ 0.724, 10.17]
k(s) = ------------------------------------------(0)[ 0.437, 3.996] [ 0.693, 10.86] ( 11.46)
The compensator is 6th order, rather high, but this level of complexity is what it takes to meet the
specifications. Compute the loop transfer function (LTF) and the closed loop response:
CC>gk=g*k
CC>cl=gk|1
CC>sho(cl)
-15(-9.289)[-0.724, 10.17]
cl(s) = ----------------------------------------------( 2.322)[ 0.724, 2.542] ( 9.289)[ 0.724, 10.17]
The closed loop system is stable. The Bode plot of gk(s) and the unit step response of cl(s) are shown
below:
CC>subplot(121); bode(gk,'redo'); subplot(122); time(cl)
The ‘redo’ option is used on the bode function to preserve the axis limits. Using the trace cursor the
overshoot is less than 1%, the 2% settling time is 2.6 seconds, the phase margin is 63 degrees, and the
gain margin is 8.6 dB. The specifications for the design have been satisfied.
The imc function can be used to reduce the rise time further. Use the up arrow to recall and change the
following commands, or better yet put the following in a function:
CC>desired=bessel(3,3); k=imc(g,desired); gk=g*k; cl=gk|1
CC>subplot(121); bode(gk,'redo'); subplot(122); time(cl,'redo')
Inverse Laplace Transforms
The Causal ILT: The inverse laplace transform (ilt) function computes and displays the ilt of a transfer
function by (1) computing the poles, (2) computing the partial fraction expansion using the residue
formula, (3) using a table look-up to compute the ilt of each term, and (4) displaying the result. Try the
following:
CC>g=4/((s+1)*(s+2))
CC>ilt(g)
g(t) = 4*exp(-t) - 4*exp(-2t) for t >= 0
Plotting the Impulse Response: If the 2nd parameter of the ilt function is a vector of times then the
function returns with the ilt computed at these times. Use this feature to plot the impulse response of g(s):
CC>t=0:.05:5
CC>y=ilt(g,t)
CC>plot(t,y)
The transfer function was displayed above after using the plot dialog box to enter the following Tex
commands:
g(s) = {4\over(s+1)(s+2)}
The same plot can be created using:
CC>time(g*s)
Noncausal ILT: The ilt functon defaults to the causal ilt; nonzero only for positive time. The anti-causal ilt
is returned by:
CC>ilt(g,'anti')
g(t) = 0 for t >= 0
= -4*exp(-t) + 4*exp(-2t) for t < 0
A boundary parallel to the jw-axis can be defined, and poles to the left are causal and poles to the right
are anti-causal. Do so below with a boundary at –1.5, and then plot the non-causal ilt:
CC>ilt(g,'roc',-1.5)
g(t) = -4*exp(-2t) for t >= 0
= -4*exp(-t) for t < 0
CC>t=-3:.05:3
CC>y=ilt(g,t,'roc',-1.5)
The Autocorrelation and Variance: Now take the same transfer function with input u(s) and output y(s):
If the input is zero-mean unit-intensity white noise the power-spectral-density of the output is g(s)g(-s),
computed as follows:
CC>yd=g*g(-s)
The stable ilt is the autocorrelation. The autocorrelation evaluated at t = 0 is variance of the output
stochastic process:
CC>ilt(yd,0,'stable')
ans = 1.3333333
This is done more simply by:
CC>var(g)
ans = 1.3333333
And for the standard deviation:
CC>std(g)
ans = 1.1547005
A plot of the autocorrelation is created as follows:
CC>t=-3:.05:3
CC>y=ilt(yd,t,'stable')
CC>plot(t,y)
Partial Fraction Expansions
Two Real Poles: Partial fraction expansions (pfe’s) are used so that high order transfer functions can be
decomposed into terms with just one pole each. Usually this is done so that the inverse Laplace
transform can be applied to each term. It is also a first step for “hold equivalence” discretization methods.
Enter a second order transfer function:
CC>g=4/((s+1)*(s+2))
CC>display(g)
4
g(s) = ---------(s+1)(s+2)
And then compute the pfe and the ilt (inverse Laplace transform):
CC>pfe(g)
4
4
g(s) = ------- - ------(s+1)
(s+2)
CC>ilt(g)
g(t) = 4*exp(-t) - 4*exp(-2t) for t >= 0
By the way, when copying pfe’s to a text editor use the Courier New font so that the spacing and lines
are all correct.
The general case for pfe’s is rather tedious, but for a strictly proper transfer function (more poles than
zeros) with no multiple poles the pfe is:
n
ai
, where ai = ( s − pi ) g ( s) s = p
i
i =1 s − pi
g (s) = ∑
You could if you wanted to compute the residues (the ai’s):
CC>substitute((s+1)*g,-1)
ans = 4
CC>substitute((s+2)*g,-2)
ans = -4
Complex Poles: The above formula is valid for complex poles, in which case the poles and residues are
complex and occur in complex conjugate pairs. Try the following:
CC>g=4/((s+1)*(s^2+2*s+5))
CC>pfe(g)
1
s+1
g(s) = ------- - -------------(s+1)
[(s+1)^2+2^2]
CC>ilt(g)
g(t) = exp(-t) - cos(2t)*exp(-t) for t >= 0
The complex pole is at –1 + - 2j, displayed as (s-Re)^2 + Im^2. The pfe command combines the complex
conjugate terms so that the display only has real numbers.
Multiple Poles: Now try a case with multiple poles:
CC>g=4/((s+1)*(s+2)^2)
CC>pfe(g)
4
4
4
g(s) = ------- - --------- - -------(s+1)
(s+2)^2
(s+2)
CC>ilt(g)
g(t) = 4*exp(-t) + (-4t -4)*exp(-2t) for t >= 0
The residue calculations use derivatives with respect to s, and the ilt has a polynomial in t, and it’s best
just to let Program CC swet the details. The general case is described in the reference manual.
Extracting Parts of the PFE: You can use the “partial” function to extract parts of the pfe. The ‘stable’
flag keeps poles with real parts less than the boundary, and the ‘unstable’ flag keeps poles to the right:
CC>partial(g,'stable',-1.5)
-4(s+3)
ans(s) = --------(s+2)^2
CC>partial(g,'unstable',-1.5)
4
ans(s) = ----s+1
The “partial” function defaults to ‘stable’ with a boundary of zero, which is the stable partial factor.
The pfe2vec function converts the coefficients of the pfe to a vector, but the description is complicated,
and we will leave it to the reference manual to sort out the details.