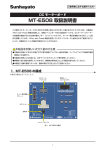
1
IVD medical equipment Line-Gene K Fluorescence Quantitative PCR Detection System User’s Manual Hangzhou Bioer Technology Co., Ltd Note: The Bioer Co. reserves the right to modify this manual at any time without notice. Patent materials are included in this manual. All rights reserved. Any part of this manual shall be forbidden to photocopy, reproduce, or translate into other languages, without written permission from the Bioer Co. Thanks for your selecting this kind of instrument. Please read this manual carefully before operating the instrument! File No.:BYQ60090000000ESM File Version: DecemberJuly, 2012109 Version 2.640 Line-gene K Fluorescence Quantitative PCR Detection System Important Note Important Note 1 Conventions Note: Please read it carefully, for there is important information in this column. Failure to follow the advice in this column will possibly result in damage to or the malfunctioning of the Line-Gene K. Warning! This symbol means that you should be cautious when performing an operation/procedure. Failure to follow the requirements in this column may result in personal injury. 2 Safety During the operation, maintenance, or repair of the Line-Gene K, the following safety measures should be taken. Otherwise, the safeguards provided by the Line-Gene K are likely to be damaged, the rated safety level to be reduced, and the rated operation conditions to be affected. The Bioer Co. shall not be in any way responsible for the consequences resulting from operators not observing the following requirements. Note: The instrument, complying with the Standard GB4793.1/IEC61010-1, is a general instrument of class Ⅰ , the protection degree is IP20. It is intended for indoor use of Elevation 200 meters below. Note: The instrument, complying with the Standard YY0648/IEC61010-2-101, is used for IVD medical equipment. a) Grounding Considerations AC power’s grounding should be reliable to safeguard against an electric shock. The 3-pin plug with 12A supplied with the Line-Gene K power cable is a safety device that should be matched with a suitable grounded socket. If the 3-pin plug cannot be inserted, it is recommended to ask an electrician to install an appropriate power socket. Do not let the grounded socket lose safety protection function. b) Keep Away from Electric Circuits The operator is not allowed to open Line-Gene K. To change components or adjust certain parameters must be accomplished by the authorized professional personnel. Do not change elements while the power is still on. c) AC Power Considerations Before turn on the power, always check whether the voltage of power supply meets that of the instrument (AC 100-240V ) and whether the current rating of the power socket meet the required specification that is larger than max. Load of instrument, 650W. d) AC Power Line Considerations As an accessory of Line-Gene K, the AC power supply should be the default one. If it is damaged, the AC power supply may not be repaired, it must be replaced by a new one. The power supply should be free of heavy objects during Line-Gene K operation. Keep the power supply away from areas where people gather regularly. i Line-gene K Fluorescence Quantitative PCR Detection System e) Important Note Connect the AC Power Line While connecting or disconnecting the power line, you should hold the 3-pin plug with your hand and insert the plug firmly to ensure good contact between the plug and socket. When disconnecting the power line from the mains, please pull the plug but not draw the cable forcedly. f) Design Environments The Line-Gene K should be placed in a low-humidity, dust-free, well-ventilated room without caustic gas or powerful magnetic interference. The Line-Gene K should not be operated in close to water sources, such as pools and water pipes. Never cover or obstruct the openings of the Line-Gene K, which are designed for ventilation and to prevent the device’s interior from becoming too hot. When a single device is running, the shortest distance between the openings and the nearest object should be at least 30 cm; when two devices or more are running at the same time, the shortest distance among them is 50 cm. Too high temperature may lead to degraded performance or failure of the Line-Gene K. Therefore, the device should be protected against any kind of heat sources like sunlight, ovens, or central heating equipment. If the Line-Gene K is set aside for a long time, it is recommended to disconnect the power line from the mains and cover the device with a piece of soft cloth or plastic membrane to prevent dust from entering. Note: Once one of the following events occurs, you are advised to disconnect the power cable from mains, and contact the distributor or ask certificated maintenance personnel for help. Liquid enters into the device; The device is sprinkled or drenched; The device malfunctions, giving off an abnormal sound or odor; The device falls onto the floor or its shell is damaged; Significant changes in the device’s performance. g)Notes during operation During test, cares shall be taken to prevent liquid from dropping onto the instrument. The castoff used in test , such as consumables, reagent, and so on, should be treated as require, and should not be thrown away or poured. During test, if there is hazardous substances, user must be trained before using. Hazardous substances, which has been used, should be coped with and saved according to derection for use. User, who operates the instrument, must be trained and has relevant quantification. Caution: When you deal with potential contagious matter such as flesh sample or reagent, which is likely to touch skin, protecting glove or other protecting measures are need to be used. h) Transportation again If transporting the instrument again, the instrument and its detection wells need be cleared wholely before transportation, and be disinfected by UV light. After clearing, the fixing pin shall be tightened to transportation ii Important Note Line-gene K Fluorescence Quantitative PCR Detection System well when the instrument stops running and power off so that motion componet of the instrumnt interior can be fixed and motion componet is avoided to be demaged during transportation. Introduce of the location from transportation well is seen in chapter of fixing pin backout. i) Warning Sign Warning identification Place pasted this mark in instrument, is danger, if DANGER! the instrument is used irrelevancy. Place pasted this mark in instrument, causes high SCALDING! temperature and is scalding during use. Place pasted this mark in instrument, caused BIOHAZARD biohazard during use. PROTECTIVE Protective earth is near to the place pasted this EARTH mark in instrument Warning markWarning Sign Warning! There are one warning sign reading ‘HOT SURFACE!’ .The metal part near this sign (on the block) is not allowed to be touched by any part of the body for fear of burn injury, during the program execution or in the short period after the program executed! j) Sign of external packing Correct position of transport package is vertical Up upwards. Be treated with care when transportation, there is Breakables breakables in transport package, Fear rain Transport package is not rained. The limit of stacking Maximum stacking layer of the same package is 2. layer iii Important Note Line-gene K Fluorescence Quantitative PCR Detection System Temperature limit that transport package should Temperature limit 3 keep is form -20C to 55C. Maintenance The conical holes over the block should be cleaned regularly with a soaked cotton swab so as to ensure sufficient contact and thus good heat conduction between each conical hole and the tube inside it. In case that it is smeared, the surface of Line-Gene K can be scrubbed with a piece of dehydrated soft wet cloth with cleaning cream. Warning! During surface cleaning, the power must be off. Do not let cleaning cream drop into the conical holes over the block. Corrosive scour is not to be used to clean the surface 4 Warranty and service information Please refer to the Warranty Sheet for detailed information. Note: Once it is opened, the package should be checked according to the checklist. If the buyer finds any items to be missing or damaged, do not hesitate to contact the distributor. After the acceptance check is passed, the buyer should fill out the check form and send its photocopy (or fax it) to the distributor. The Bioer Co. establishes the archives and maintenance record with the returned form. Please store the package and packing materials in a safe place in case of future device maintenance. The above warranty does not extend to goods damaged as result of incorrect package. iv Line-gene K Fluorescence Quantitative PCR Detection System v Important Note Line-gene K Fluorescence Quantitative PCR Detection System conspectus Table of Contents Chapter 1 Summarize.........................................................................................................................................1 1.1.The purposes and characters of line-Gene K fluorescence quantitative detection system......... 1 1.2.Explanation of model and specification, basic parameters and capability specification.............. 2 1.2.1. Explanation of model...................................................................................................................... 2 1.2.2. Explanation of specification........................................................................................................... 2 1.2.3. Basic parameters and capability specification............................................................................2 1.3.Basic function of equipped software..................................................................................................... 3 Chapter 2 Installation.......................................................................................................................................... 4 2.1.Installation condition of instrument........................................................................................................4 2.1.1. Conditions for transportation and stockpile.................................................................................4 2.2.Requirement of field and environment..................................................................................................4 2.2.1. Requirement of power supply....................................................................................................... 4 2.3.Installation the instrument.......................................................................................................................4 2.3.1. Back out of the fixup clamps......................................................................................................... 4 2.3.2. Installation the instrument.............................................................................................................. 5 2.4.Install the equipped software................................................................................................................. 6 2.4.1. Choose the computer system....................................................................................................... 6 2.5.Install the software of fluorescence quantitative PCR detection system........................................ 6 2.5.1. Uninstall the software of fluorescence quantitative PCR detection system...........................8 Chapter 3 Start the instrument.......................................................................................................................... 9 3.1.Checking before start instrument.......................................................................................................... 9 3.2.Start the instrument................................................................................................................................. 9 3.3.Startup interface of the software......................................................................................................... 10 Chapter 4 Enter or Quit the Absolute Quantification, SNP and the Relative Quantification..................11 4.1.To enter three functional modules:................................................................................................... 11 4.2.To quit the functional modules............................................................................................................. 13 Chapter 5 Setting in the Absolute Quantification Module........................................................................... 14 5.1.Set up a New Detection Program File................................................................................................ 14 5.2.Set up a Detection Program.................................................................................................................14 5.2.1. Composing of a Detection Program...........................................................................................14 5.2.2. Setting Process of a Detection Program................................................................................... 15 5.3.How to Input the User’s Name and the Experimental Name..........................................................15 5.4.Select the Fluorescence Channel and the Gain Setup....................................................................15 5.5.Set the Hot-lid.........................................................................................................................................17 5.6.Set the Liquid Volume........................................................................................................................... 17 5.7.Input the Samples Information.............................................................................................................17 5.7.1. Sample Group Setup.................................................................................................................... 17 5.7.2. Input the Sample Data................................................................................................................. 18 5.7.3. Sect Sample Data Columns........................................................................................................ 19 I Line-gene K Fluorescence Quantitative PCR Detection System conspectus 5.7.4. Customized Sample Data Column............................................................................................. 20 5.8.Set the Detection Program Phrases................................................................................................... 20 5.9.Set the Steps of “Cycle/Temp.”............................................................................................................21 5.9.1. Add/Delete Steps.......................................................................................................................... 21 5.9.2. Set the Cycles................................................................................................................................21 5.9.3. Set the Temperature Parameters............................................................................................... 22 5.9.4. Select the Sample Detecting Mode............................................................................................22 5.10.Set the “Melting” Curve.......................................................................................................................22 5.11.Set the “End”.........................................................................................................................................23 5.12.Save the detection result....................................................................................................................23 5.13.Import Setup Parameters................................................................................................................... 24 5.14.Calculate the gradient temperatures................................................................................................ 24 5.15.Crosstalk measurement......................................................................................................................24 5.16.Function of automatic gain calibration..............................................................................................25 Chapter 6 Run the PCR Detection Program File......................................................................................... 26 6.1.Prepare Reagent Samples...................................................................................................................26 6.2.Confirm Gain Value (Demarcated when Leving Factory)................................................................27 6.3.Running................................................................................................................................................... 27 6.3.1. Open and Run the Detection Program File...............................................................................27 6.3.2. Automatically Save the Detection Result File...........................................................................28 6.3.3. Code Input......................................................................................................................................29 6.4.Display and Operation During Running Process.............................................................................. 30 6.4.1. Program's Real-time Running Interface Charts....................................................................... 30 6.4.2. Fluorescence Selection (Adapt to the detection of Multi-Group fluorescence selection)..30 6.4.3. Select Grouping Display (Suit to multi-group's detection)...................................................... 30 6.4.4. Show/Hide samples curves......................................................................................................... 30 6.4.5. Show Grads Temperature............................................................................................................31 6.4.6. Set Fluorescence Display Range............................................................................................... 31 6.4.7. Display Temperature State.......................................................................................................... 31 6.4.8. Add/Reduce Cycle Number.........................................................................................................32 6.4.9. Deal with the Hot-lid's Abnormal Open......................................................................................32 6.4.10. Stop the Current Program Phase............................................................................................... 32 6.4.11. Stop Running................................................................................................................................. 32 6.4.12. Indicator Light During Instrument’s Working State.................................................................. 32 6.4.13. Alarms When Running................................................................................................................. 32 Chapter 7 Absolute Quantitative Analysis Module.......................................................................................34 7.1.Open the Detection Result File............................................................................................................34 7.2.Fluorescence Selection........................................................................................................................ 35 7.3.Grouping Selection................................................................................................................................ 36 7.4.Select and Switch Analysis Mode....................................................................................................... 36 7.5.Select Display Mode..............................................................................................................................36 7.6.Quantitative Analysis.............................................................................................................................37 7.6.1. Summary of Quantitative Analysis............................................................................................. 37 II Line-gene K Fluorescence Quantitative PCR Detection System conspectus 7.6.2. Sample Data after Quantitative Analysis (data analysis)........................................................37 7.6.3. Absolute quantitative analysis principle.....................................................................................38 7.6.4. Select Quantitative Analysis........................................................................................................ 40 7.6.5. Analysis Process...........................................................................................................................41 7.6.6. Modify Samples' Attribute............................................................................................................ 42 7.7.About Analysis Result........................................................................................................................... 42 7.7.1. Application of Standard Curve.................................................................................................... 43 7.8.Introduction and Process of Melting Curve Analysis........................................................................44 7.8.1. Introduction of Melting Curve Analysis...................................................................................... 44 7.8.2. Select Analysis Method................................................................................................................ 45 7.9.Save the Analysis Results.................................................................................................................... 46 7.9.1. Save the Analysis Data................................................................................................................ 46 7.9.2. Save the Analysis Curve.............................................................................................................. 46 7.10.Application of Backup Files................................................................................................................47 7.11.Select treatment methods of fluorescence detection data..................................................... 47 Chapter 8 SNP Module.....................................................................................................................................48 8.1.Enter into SNP Module......................................................................................................................... 48 8.2.Setting and Running of SNP Program Files in SNP Module.......................................................... 48 8.3.Open the Detection Result File............................................................................................................48 8.4.Select the Fluorescence....................................................................................................................... 49 8.5.Select the Group.................................................................................................................................... 50 8.6.Select and Switch the Analysis Mode.................................................................................................50 8.7.Select the Display Mode.......................................................................................................................50 8.8.Quantitative SNP Analysis....................................................................................................................51 8.8.1. Summary for the Quantitative SNP Analysis............................................................................ 51 8.8.2. Data Analysis after the Quantitative SNA Analysis.................................................................. 51 8.8.3. Select the Quantitative SNP Analysis Mode.............................................................................53 8.8.4. Steps of Analysis...........................................................................................................................53 8.8.5. Modify the Sample Attribute........................................................................................................ 54 8.8.6. About the SNP Analysis Result...................................................................................................55 8.9.Introduction and Steps of Melting Curve SNP Analysis...................................................................56 8.9.1. Introduction of Melting Curve SNP Analysis............................................................................. 56 8.9.2. Select the Curve............................................................................................................................57 8.10.Save the SNP Analysis Results.........................................................................................................58 8.10.1. Save the Analysis Data................................................................................................................ 58 Chapter 9 Print, Output and Query to the Results of the Absolute Quantification and SNP Modules.60 9.1.Print the Analysis Result.......................................................................................................................60 9.1.1. Print the Report Forms.................................................................................................................60 9.1.2. Print the Screen.............................................................................................................................62 9.2.Output the Analysis Result................................................................................................................... 62 9.2.1. Export the Data to the Database................................................................................................ 62 9.2.2. Export Data to EXCEL................................................................................................................. 63 9.3.Data Query..............................................................................................................................................63 III Line-gene K Fluorescence Quantitative PCR Detection System conspectus 9.3.1. Open the database....................................................................................................................... 63 9.3.2. Data Query.....................................................................................................................................63 9.3.3. Print Query result.......................................................................................................................... 64 Chapter 10Relative Quantification Module...................................................................................................65 10.1.Introduction...........................................................................................................................................65 10.1.1. Relative Quantification Definition............................................................................................... 65 10.1.2. Analysis Methods.......................................................................................................................... 65 10.1.3. Application......................................................................................................................................65 10.1.4. Comparison of Absolute Quantitative Method and Relative Quantitative Method..............65 10.2.Relative Quantification Setup............................................................................................................ 66 10.2.1. Setup of Relative Quantification PCR Procedure.................................................................... 66 10.2.2. Setup of Relative Quantification PCR Analysis........................................................................ 66 10.3.Relatively Quantification Operation.................................................................................................. 77 10.4.Relative Quantification analysis and results....................................................................................77 10.4.1. Relative Quantification results.................................................................................................... 77 10.4.2. Relative Quantification Analysis Steps...................................................................................... 78 10.5.Introduction and Steps of Melting Curve Analysis..........................................................................84 10.6.To Save Analysis Result..................................................................................................................... 85 10.6.1. To Save Analysis Data................................................................................................................. 85 10.6.2. To Save Analysis Curve............................................................................................................... 85 10.7.Import and Export Relative Quantification Data............................................................................. 86 10.7.1. Import and Export Relatively Quantitative Document............................................................. 86 10.7.2. Export relative quantification data.............................................................................................. 86 10.7.3. To export Melting Curve Data..................................................................................................... 88 10.8.Query and Print of Relative Quantitative Data................................................................................89 10.8.1. Relative Quantitative Data Query...............................................................................................89 10.8.2. EXCEL Template Setup of Relative Quantitative Data...........................................................89 10.8.3. Excel Print of Relative Quantification Data............................................................................... 90 10.8.4. Criteria Print the Relative Quantitative Data.............................................................................90 Chapter 11Maintenance.................................................................................................................................. 92 11.1.Time Cleaning...................................................................................................................................... 92 11.2.Software's Upgrade to The Mainbody.............................................................................................. 92 11.3.Malfunction Analysis and Treatment................................................................................................. 93 Appendix: FQD-48A mode Quantitative PCR Detection System's electric wiring diagram............95 Chapter 1 Summarize...................................................................................................................................... 1 1.1.The purposes and characters of line-Gene K fluorescence quantitative detection system......... 1 1.2.Explanation of model and specification, basic parameters and capability specification.............. 2 1.2.1. Explanation of model........................................................................................................................ 2 1.2.2. Explanation of specification............................................................................................................. 2 1.2.3. Basic parameters and capability specification..............................................................................2 1.3.Basic function of equipped software..................................................................................................... 3 Chapter 2 Installation......................................................................................................................................... 4 IV Line-gene K Fluorescence Quantitative PCR Detection System conspectus 2.1.Installation condition of instrument........................................................................................................4 2.1.1. Conditions for transportation and stockpile................................................................................... 4 2.2.Requirement of field and environment..................................................................................................4 2.2.1. Requirement of power supply..........................................................................................................4 2.3.Installation the instrument.......................................................................................................................4 2.3.1. Back out of the fixup clamps............................................................................................................4 2.3.2. Installation the instrument................................................................................................................ 5 2.4.Install the equipped software................................................................................................................. 6 2.4.1. Choose the computer system..........................................................................................................6 2.5.Install the software of fluorescence quantitative PCR detection system........................................ 6 2.5.1. Uninstall the software of fluorescence quantitative PCR detection system............................. 8 Chapter 3 Start the instrument..........................................................................................................................9 3.1.Checking before start instrument.......................................................................................................... 9 3.2.Start the instrument................................................................................................................................. 9 3.3.Startup interface of the software......................................................................................................... 10 Chapter 4 Enter or Quit the Absolute Quantification, SNP and the Relative Quantification................. 11 4.1.To enter three functional modules:................................................................................................... 11 4.2.To quit the functional modules............................................................................................................. 13 Chapter 5 Setting in the Absolute Quantification Module...........................................................................14 5.1.Set up a New Detection Program File................................................................................................ 14 5.2.Set up a Detection Program.................................................................................................................14 5.2.1. Composing of a Detection Program............................................................................................. 14 5.2.2. Setting Process of a Detection Program..................................................................................... 15 5.3.How to Input the User’s Name and the Experimental Name..........................................................15 5.4.Select the Fluorescence Channel and the Gain Setup....................................................................15 5.5.Set the Hot-lid.........................................................................................................................................17 5.6.Set the Liquid Volume........................................................................................................................... 17 5.7.Input the Samples Information.............................................................................................................17 5.7.1. Sample Group Setup...................................................................................................................... 17 5.7.2. Input the Sample Data....................................................................................................................18 5.7.3. Sect Sample Data Columns.......................................................................................................... 19 5.7.4. Customized Sample Data Column............................................................................................... 20 5.8.Set the Detection Program Phrases................................................................................................... 20 5.9.Set the Steps of “Cycle/Temp.”............................................................................................................21 5.9.1. Add/Delete Steps............................................................................................................................ 21 5.9.2. Set the Cycles..................................................................................................................................21 5.9.3. Set the Temperature Parameters..................................................................................................22 5.9.4. Select the Sample Detecting Mode.............................................................................................. 22 5.10.Set the “Melting” Curve.......................................................................................................................22 5.11.Set the “End”.........................................................................................................................................23 5.12.Save the detection result....................................................................................................................23 5.13.Import Setup Parameters................................................................................................................... 24 V Line-gene K Fluorescence Quantitative PCR Detection System conspectus 5.14.Calculate the gradient temperatures................................................................................................ 24 Chapter 6 Run the PCR Detection Program File.........................................................................................25 6.1.Prepare Reagent Samples...................................................................................................................25 6.2.Confirm Gain Value (Demarcated when Leving Factory)................................................................26 6.3.Running................................................................................................................................................... 26 6.3.1. Open and Run the Detection Program File.................................................................................26 6.3.2. Automatically Save the Detection Result File.............................................................................27 6.3.3. Code Input........................................................................................................................................ 28 6.4.Display and Operation During Running Process.............................................................................. 29 6.4.1. Program's Real-time Running Interface Charts..........................................................................29 6.4.2. Fluorescence Selection (Adapt to the detection of Multi-Group fluorescence selection).... 29 6.4.3. Select Grouping Display (Suit to multi-group's detection)........................................................ 29 6.4.4. Show/Hide samples curves........................................................................................................... 29 6.4.5. Show Grads Temperature.............................................................................................................. 30 6.4.6. Set Fluorescence Display Range................................................................................................. 30 6.4.7. Display Temperature State............................................................................................................ 30 6.4.8. Add/Reduce Cycle Number........................................................................................................... 31 6.4.9. Deal with the Hot-lid's Abnormal Open........................................................................................ 31 6.4.10. Stop the Current Program Phase............................................................................................... 31 6.4.11. Stop Running................................................................................................................................. 31 6.4.12. Indicator Light During Instrument’s Working State.................................................................. 31 6.4.13. Alarms When Running................................................................................................................. 31 Chapter 7 Absolute Quantitative Analysis Module...................................................................................... 33 7.1.Open the Detection Result File............................................................................................................33 7.2.Fluorescence Selection........................................................................................................................ 33 7.3.Grouping Selection................................................................................................................................ 33 7.4.Select and Switch Analysis Mode....................................................................................................... 33 7.5.Select Display Mode..............................................................................................................................34 7.6.Quantitative Analysis.............................................................................................................................34 7.6.1. Summary of Quantitative Analysis................................................................................................34 7.6.2. Sample Data after Quantitative Analysis (data analysis).......................................................... 35 7.6.3. Absolute quantitative analysis principle.......................................................................................35 7.6.4. Select Quantitative Analysis.......................................................................................................... 37 7.6.5. Analysis Process............................................................................................................................. 38 7.6.6. Modify Samples' Attribute...............................................................................................................39 7.7.About Analysis Result........................................................................................................................... 39 7.7.1. Application of Standard Curve...................................................................................................... 40 7.8.Introduction and Process of Melting Curve Analysis........................................................................41 7.8.1. Introduction of Melting Curve Analysis.........................................................................................41 7.8.2. Select Analysis Method.................................................................................................................. 42 7.9.Save the Analysis Results.................................................................................................................... 43 7.9.1. Save the Analysis Data.................................................................................................................. 43 7.9.2. Save the Analysis Curve................................................................................................................ 43 VI Line-gene K Fluorescence Quantitative PCR Detection System conspectus 7.10.Application of Backup Files................................................................................................................44 7.11.Select treatment methods of fluorescence detection data............................................................ 44 Chapter 8 SNP Module....................................................................................................................................45 8.1.Enter into SNP Module......................................................................................................................... 45 8.2.Setting and Running of SNP Program Files in SNP Module.......................................................... 45 8.3.Open the Detection Result File............................................................................................................45 8.4.Select the Fluorescence....................................................................................................................... 46 8.5.Select the Group.................................................................................................................................... 46 8.6.Select and Switch the Analysis Mode.................................................................................................46 8.7.Select the Display Mode.......................................................................................................................47 8.8.Quantitative SNP Analysis....................................................................................................................47 8.8.1. Summary for the Quantitative SNP Analysis.............................................................................. 47 8.8.2. Data Analysis after the Quantitative SNA Analysis.................................................................... 48 8.8.3. Select the Quantitative SNP Analysis Mode............................................................................... 49 8.8.4. Steps of Analysis............................................................................................................................. 50 8.8.5. Modify the Sample Attribute...........................................................................................................51 8.8.6. About the SNP Analysis Result.....................................................................................................51 8.9.Introduction and Steps of Melting Curve SNP Analysis...................................................................53 8.9.1. Introduction of Melting Curve SNP Analysis............................................................................... 53 8.9.2. Select the Curve.............................................................................................................................. 54 8.10.Save the SNP Analysis Results.........................................................................................................54 8.10.1. Save the Analysis Data................................................................................................................ 54 Chapter 9 Print, Output and Query to the Results of the Absolute Quantification and SNP Modules 56 9.1.Print the Analysis Result.......................................................................................................................56 9.1.1. Print the Report Forms................................................................................................................... 56 9.1.2. Print the Screen...............................................................................................................................58 9.2.Output the Analysis Result................................................................................................................... 58 9.2.1. Export the Data to the Database.................................................................................................. 58 9.2.2. Export Data to EXCEL....................................................................................................................59 9.3.Data Query..............................................................................................................................................59 9.3.1. Open the database..........................................................................................................................59 9.3.2. Data Query....................................................................................................................................... 59 9.3.3. Print Query result............................................................................................................................ 60 Chapter 10 Relative Quantification Module..................................................................................................61 10.1.Introduction...........................................................................................................................................61 10.1.1. Relative Quantification Definition............................................................................................... 61 10.1.2. Analysis Methods.......................................................................................................................... 61 10.1.3. Application......................................................................................................................................61 10.1.4. Comparison of Absolute Quantitative Method and Relative Quantitative Method..............61 10.2.Relative Quantification Setup............................................................................................................ 62 10.2.1. Setup of Relative Quantification PCR Procedure.................................................................... 62 10.2.2. Setup of Relative Quantification PCR Analysis........................................................................ 62 VII Line-gene K Fluorescence Quantitative PCR Detection System conspectus 10.3.Relatively Quantification Operation.................................................................................................. 73 10.4.Relative Quantification analysis and results....................................................................................73 10.4.1. Relative Quantification results.................................................................................................... 73 10.4.2. Relative Quantification Analysis Steps...................................................................................... 74 10.5.Introduction and Steps of Melting Curve Analysis..........................................................................80 10.6.To Save Analysis Result..................................................................................................................... 81 10.6.1. To Save Analysis Data..................................................................................................................81 10.6.2. To Save Analysis Curve............................................................................................................... 81 10.7.Import and Export Relative Quantification Data............................................................................. 82 10.7.1. Import and Export Relatively Quantitative Document............................................................. 82 10.7.2. Export relative quantification data.............................................................................................. 82 10.7.3. To export Melting Curve Data......................................................................................................84 10.8.Query and Print of Relative Quantitative Data................................................................................85 10.8.1. Relative Quantitative Data Query...............................................................................................85 10.8.2. EXCEL Template Setup of Relative Quantitative Data...........................................................85 10.8.3. Excel Print of Relative Quantification Data............................................................................... 86 10.8.4. Criteria Print the Relative Quantitative Data.............................................................................86 Chapter 11 Maintenance................................................................................................................................. 88 11.1.Time Cleaning...................................................................................................................................... 88 11.2.Software's Upgrade to The Mainbody.............................................................................................. 88 11.3.Malfunction Analysis and Treatment................................................................................................. 89 Appendix: FQD-48A mode Quantitative PCR Detection System's electric wiring diagram............91 VIII Line-gene K Fluorescence Quantitative PCR Detection System conspectus Chapter 3 Summarize 3.1. The purposes and characters of line-Gene K fluorescence quantitative detection system This detection system adopts fluorescent real-time detection method to analyse PCR template amplification and is suitable for polymerase chain reaction fluorescent quantitative detection in clinical diagnosis fields of virus, tumor,hereditary disease.Adopting fluorescence real-time detection method to analyze amplification of PCR template, Line-Gene K Fluorescence Quantitative PCR Detection System is widely applied in the research area of immunology, human being genome engineering, forensic medicine, oncology, organization & colony biology, paleontology, zoology, and botany, etc. It is also used for the PCR’s fluorogenic quantitative detection in the clinical diagnosis on virus, tumor or hereditary disease. Note: Do remember to use reagents that accord with government relative rule of law in the case Line-Gene K is used for clinics purpose. Features: Multi-point temperature control——higher temperature control accuracy and higher uniformity among every well Simulate sample temperature control——optimize temperature control of different reaction system 24-line sample temperature gradient——higher accuracy of temperature parameters in gradient experiment Specialized designed Peltier ——10 times longer life than common product Electromotion hot-lid——Constant pressure can ensure reliable and stable experiment with easy operation LED light source——long life without maintenance High-performance PMT——High sensitivity, low noise and wide test linear range Multi-color fluorescence detection——Can equip with 4-channel filter at most, which can do detection simultaneously. Chinese and English versions formatting——A suit of software can meet the demands of both Chinese and English interface Various kinds of analysis modes——Can meet many kinds of demands of scientific research and clinic purpose Software can be upgraded online——Can allow customers to enjoy the latest technology Single-sample analysis result can be printed——Suitable for clinical application Experimental data can be exported——can meet special-purpose processing of data for scientific research Data inquiry——Do administration of experimental result database, which can realize data statistics and inquiry Adopt to power among AC100-240V 1 Summarize Line-gene K Fluorescence Quantitative PCR Detection System 3.2. Explanation of model and specification, basic parameters and capability specification 3.2.1. Explanation of model FQD—48 A Revised design number Specifications No. For example:48 means the maximum number of sample Fluorogenic Quantitative Polymerase Chain Reaction (PCR) Detection System Abbreviation of Fluorescent Quantitative Detection 3.2.2. Explanation of specification FQD—48 A (M 1) The channel numbers of fluorescence detection M:manual hot-lid,A:Automatic hot-lid Model 3.2.3. Basic parameters and capability specification Model FQD-48A Specification (A4) (M2) Sample Capacity 48×0.2ml centrifuge tube Reaction System 10μl ~100μl Dynamics Range 10-1010Copies Max. Channel Number of 4Channels Fluorescence Detection Excitation Light Wavelength Detecting Wavelength F1:470nm F2:523nm F3:543nm F4:571nm F1:525nm F2:564nm F3:584nm F4:612nm 2Channels F1:470nm F2:523nm F1:525nm F2:564nm F1:FAM,SYBR GreenⅠ Detecting Fluorescence F2:VIC,HEX,JOE F1:FAM,SYBR GreenⅠ F3:TAMRA,Cy3 F2:VIC,HEX,JOE F4:Texas Red,ROX 4C ~ 99.9C Temp. Range 2 Summarize Line-gene K Fluorescence Quantitative PCR Detection System Heating Rate (max) ≥ 4.0 C/s Cooling Rate (max) ≥ 4.0 C/s Temp. Uniformity of Block ≤±0.3C Temp. Accuracy ≤±0.3C Gradient Temp. Range 1C~24C Temp. Range of Hot-lid 80C~110C Operating System Windows 2000/XP Power supply AC100-240V 50/60Hz 650W(without computer) Dimension (mm) 520×450×320(L×W×H)(without computer) Net Weight (kg) 25(without computer) 3.3. Basic function of equipped software Set up parameters of PCR amplification and fluorescence detection Real-time display detection data of every item during operation Protection and warning function in case of instrument trouble Can do analysis and inquiry to detection data directly after program running over After program running over, can do absolute quantitative, SNP and relative quantitative analysis directly. (The analysis function is available without connecting with the instrument) Can inquire and print out analysis result, edit print format and select print item or self-define print item Can upgrade software online Note: The functions of above-mentioned software are for reference only. Bioer Co. has right to revise them without any notice. 3 Line-gene K Fluorescence Quantitative PCR Detection System Installation Chapter 4 Installation 4.1. Installation condition of instrument 4.1.1. Conditions for transportation and stockpile Ambient Temperature:-20℃~55℃ Relative Humidity:10%~80% 4.2. Requirement of field and environment 1) Line-Gene K is intended for indoor use only. It should be placed on an even and stable worktable. 2) Line-Gene K should be placed in a low-humidity, dust-free, well-ventilated room without caustic gas or powerful magnetic interference. The instrument should not be operated in close proximity to water sources, such as pools and water pipes. 3) Never cover or obstruct the openings of the Line-Gene K, which are designed for ventilation and to prevent the device’s interior from becoming too hot. When a single device is running, the shortest distance between the openings and the nearest object should be at least 30cm; when two devices or more are running at the same time, the shortest distance among them is 50 cm. 4) Too high temperature will lead to degraded performance or failure of the Line-Gene K. Therefore, the device should be protected against any kind of heat sources like sunlight, ovens, or central heating equipment. 5) Ambient Temperature:5C ~ 30C Relative Humidity:10%~80% 4.2.1. Requirement of power supply Power Supply:AC100-240V 650W 50/60Hz Others:Only 3-pin socket is available and please guarantee reliable grounding. 4.3. Installation the instrument 4.3.1. Back out of the fixup clamps In order to prevent the active parts inner of the instrument from moving and striking during transportation, these parts have already been fixed by fixtures before the instrument leaves from the factory. Therefore, please make sure that the fixtures have been taken off before power on. Please refer to Fig.2-1 for detailed operation way: 4 Line-gene K Fluorescence Quantitative PCR Detection System The fixture Installation Please take off it following the direction that the arrow points. 4.3.2. Installation the instrument The instrument should be placed in a place that accords with the demands mentioned in 2.1.2, the worktable should be kept steady and even so as to insure stable operation; Power line connection---should use line attached with the instrument. Please make sure the instrument is power off when connecting the line; after connection, please make sure good connection between line and socket; otherwise, the line should be exchanged; Connection of communication line----should use the one attached with the instrument. Please connect one site of line with RS232C of the instrument, while another site with computer. After connection, please screw fixed bolts tightly. Note: The power line attached with the instrument is reliable. However, it will lead loose connection with the socket after operation for several times. In this case, it is recommended to exchange the power line by a new one with same type and same specification. 5 Line-gene K Fluorescence Quantitative PCR Detection System Installation 4.4. Install the equipped software 4.4.1. Choose the computer system Lowest Computer Configuration: Operating system: Windows2000/XP/Windows 7/Vista(English) Internet Applications: Microsoft Excel2002/2003/2007, Microsoft Access2002/2003/2007 EMS Memory: 512256MB Hard Disk: 10GB CPU : Pentium®4, 1.7GHz System Setup: virtual memory is larger than 1000MB 4.5. Install the software of fluorescence quantitative PCR detection system 1) After starting up Windows2000/ XP/ Windows 7/Vista English system to enter normal interface, please insert Line-Gene K CD-ROM in your CD-ROM drive. Open the folder of “Line-Gene K” and double click Setup.exe icon to enter the Setup interface for language selection: 2) After setup of language selection, click “OK” so as to enter the following interface: 3) Click “Next>” to enter the next interface: 6 Line-gene K Fluorescence Quantitative PCR Detection System Installation Please input user’s name, company name and installation serial number into relative items. Note: 4) Please refer to the tag on the CD-ROM for the set-up serial number of software. Click ”Next (N)>” to enter the next interface: The screen will display the target position (installation directory). The default installation directory is: C:\Program File\bioer\LineGene KNew\;Please click “Next>” to confirm the current installation directory. Please enter installation directory selection interface to revise or newly-built installation directory: 7 Line-gene K Fluorescence Quantitative PCR Detection System 5) Installation The user can select needed installation lane from “Look in” column in the installation directory selection interface; User also can input or revise installation target position from the “Folder Name” column; and then click “OK”, thus achieve setting up target position of the lane, and the system will carry on installation automatically. After finishing installation, there will be a shortcut icon of Line-Gene K Fluorescence Quantitative PCR Detection System on the table-board. 4.5.1. Uninstall the software of fluorescence quantitative PCR detection system 1) Click “Add/Remove Program” from the 【Start】/【Setup】/【Control Board】menu: 2) In the “Add/Remove Program” dialog box, press “Change or Remove Program” item, and select “Line-Gene K” installation program name, finally, click “Remove (R)”. 3) Click “Yes (Y)” in the current “Add/Remove” dialog box, thus the system will achieve installation of selected software automatically. 8 Line-gene K Fluorescence Quantitative PCR Detection System Start the instrument Chapter 3 Start the instrument Note: Please make sure that the fixtures at the bottom of instrument have been removed in a proper way. Otherwise, the instrument maybe damaged. (Please refer to 2.2.1 for detailed information.) 3.1. Checking before start instrument Before power on, please check following items: Whether power accords with the requirements of the system.(Refer to 2.1.3) Whether the plug of power line has been inserted into the socket properly and reliably. Whether plugs of both sites of communication line have been inserted properly and reliably respectively. Whether the upgrade switch that lies at the back of machine locates on the left has been normal. Whether ambient work condition and placement condition meet the demand. (Refer to 2.1.2) 3.2. Start the instrument In order to guarantee available communication between instrument and computer, please follow steps below to start up the instrument: No.1:Start-up display and host computer. No.2:Power on the instrument. No.3 : Start-up software of Fluorescence Quantitative PCR Detection System after entering operation system. User can click Fluorescence Quantitative PCR Detection System in 【Start】/【Program】Menu, or double click shortcut icon of Line-Gene K on the table-board to start up the software. Note: User should do registration from Hangzhou Bioer Technology to get proper operation password. 9 Line-gene K Fluorescence Quantitative PCR Detection System Start the instrument 3.3. Startup interface of the software Double click the shortcut icon of Line-Gene K on the table-board, thus the screen of computer will show you the following interface. Figure3-1 Start Interface Few seconds after start-up, system will enter into the function selection interface of Line-Gene K automatically. Figure3-2 Function Selection Interface 10 Line-gene K Fluorescence Quantitative PCR Detection System Enter or Quit Chapter 4 Enter or Quit the Absolute Quantification, SNP and the Relative Quantification 4.1. To enter three functional modules: After you enter the functional interface, click the function keys like “the absolute quantification”, “SNP” or “the relative quantification” to enter the related function. If you are in one function interface and you want to select another, it will not be available. For example, if you are running the absolute quantification, and you click “the relative quantification”, you will get a warning window as below: Figure 4-1 you can only run one function. Click “the absolute quantification”, you will get an interface as below: Figure 4-2 the absolute quantification Click “SNP” to get the interface as below: 11 Line-gene K Fluorescence Quantitative PCR Detection System Figure 4-3 SNP Click “the relative quantification” to get the interface as below: Figure 4-4 the relative quantification 12 Enter or Quit Line-gene K Fluorescence Quantitative PCR Detection System Enter or Quit 4.2. To quit the functional modules In the Figure 3-2, click “Quit” to quit the LineGeneK system. Please confirm that you have quit three functional modules before you quit the software system. If the functional module is still running, the system will indicate you to quit the functional module in advance. Note: In case of any abnormal situation that you can not quit the functional module of Line-GeneK, please use the Window Task to quit the function. Chapter 5 Setting in the Absolute Quantification Module 13 Line-gene K Fluorescence Quantitative PCR Detection System Setting in the Absolute Quantification Module Setting in the Absolute Quantification Module In this chapter, we will introduce the functions in the absolute quantification module, such as set up a new file, edit (the parameters), save or revise. 5.1. Set up a New Detection Program File Click the shortcut icon of PCR, few seconds later, the system will enter an interface to request you to select the functional module. Click “the absolute quantification”, and then the system will enter into a blank “Program Setup” interface as below: Click“ ” to get a blank “Setup Programs” interface. Click “New (N)” from “File (F)” menu to get a blank “Setup Programs” interface. 5.2. Set up a Detection Program 5.2.1. Composing of a Detection Program Set up Sample Data Program File Information Set up Running Parameter Set up steps in a segment Figure5-1 Simulate Displaying Area Set up the program segments 14 Line-gene K Fluorescence Quantitative PCR Detection System Setting in the Absolute Quantification Module 5.2.2. Setting Process of a Detection Program Step1 Step2 Program File Information Setup: User’s Name, Experimental Name Setting process of a Detection Program System Running Parameter Setup: SNP analysis selection, Fluorescence Selection, Hot-lid Selection, Liquid volume setting Step3 Input the sample information, grouping setup Segment1: set up cycles/constant temperature, melting curve, selection of running-over mode, cycle number Step 1: Setting the parameters of temperature, time, sampling mode e.t.c Step4 Step 2: Setting the parameters of temperature, time, sampling mode e.t.c (The maximum program steps is up to 20.) Segment2: setup of cycler/constant, melting curve, selection of running-over mode, cycler number (The maximum segment is up to 20.) ) 5.3. How to Input the User’s Name and the Experimental Name Input the use’s name in the use’s name column (highly suggested to input for the file management). Otherwise, the unnamed program will be saved into the “default” folder. The system will set up a new folder with the name of “the user’s name” and to save the program files under this name into this folder. The maximum byte of user’s name is 20. Input the experimental name in the experimental name column. The maximum input byte of experimental name is 20. 5.4. Select the Fluorescence Channel and the Gain Setup In the fluorescence quantitative PCR detection system of Line-Gene K, reagents fluorescence’s selection and detection is based on the channels. This detection system can set four (4) channels as Max: F1, F2, F3 and F4. The configures of each channel and its suitable fluorescence is listed below: 15 Line-gene K Fluorescence Quantitative PCR Detection System Setting in the Absolute Quantification Module Channel Parameter Excitation Wavelength Detecting Wavelength Detecting Fluorescence Light F2 Channel F3 Channel F4 Channel For (A4) For(A4) For(A4) 470nm 523nm 543nm 571nm 525nm 564nm 584nm 612nm FAM HEX SYBR GreenI VIC F1 Channel TAMRA Texas Red ROX The selection of fluorescence is decided by the purpose of the detection and the experiment. Line-Gene K fluorescence detection system can process up to fourfour (43) channels’ detection in the same time (channel 2 and channel 3 can not be selected in one program in the same time). Click the Fluorescence Selection button “ ” to get the dialog box as below. Figure 5-2 After select the corresponding channel’s fluorescence, click “Add (A)”, the selected fluorescence will be shown in the right blank column, at the same time the other fluorescence 16 Line-gene K Fluorescence Quantitative PCR Detection System Setting in the Absolute Quantification Module in the same channel in the left column will be shown as grey and can not be selected. Select the fluorescence in right column and then click “Delete (D)” to remove the fluorescence. During the fluorescence selection, when select any fluorescence in the second channel of “VIC/HEX/JOE”, the fluorescence in the third channel of “TAMRA/Cy3” will be shown as grey, since the fluorescence in these two channels can not be selected at one time. Gain value is a parameter to show the amplification of the fluorescence intensity signal. In this case, the deferent signal by the instrument can be displayed in the screen. The default gain value (50) is suitable for most kinds of reagents. The user can modify the setup of the gain value as instructed below: Click “Gain Setup” from the “System Parameter” menu, and then input the gain value in the gain setup interface. The default gain value is 50. 5.5. Set the Hot-lid The user can select to use the hot-lid by clicking the box of “ ”at the right side. The user can set up the target temperature after selecting the hot-lid for use. Please pay attention to set the temperature of the hot-lid at least 10℃ higher than the max. Running temperature of the sample so as to avoid the evaporation. The available setting temperature of hot-lid is from 80℃ to 110℃. 5.6. Set the Liquid Volume The range of liquid volume is 10μl~100μl. In order to achieve the optimized temperature control, please set up the sample liquid volume according to the actual condition. 5.7. Input the Samples Information 5.7.1. Sample Group Setup During the edit of setting program, the user can do the sample grouping according to the demands. After the samples grouped, the samples in each group can be analyzed independently. 17 Line-gene K Fluorescence Quantitative PCR Detection System Setting in the Absolute Quantification Module The grouping line Figure 5-3 Click “Sample Group Setup…(R)” from “Sample Information (S)” menu, thus the system will display the sample group setup interface. It shows the initial setup of the sample groups. By clicking the pop-up button at the right side of “Groups” in the Grouping Setting Interface, the user can select the groups. The maximum groups are four (4). The user can adjust the samples in each group by pulling the grouping line. Please Click “OK (O)” after finishing the setting. The user can do the particular sample grouping in the Sample Data Interface. 5.7.2. Input the Sample Data Click the “Sample Data” from “Sample Information” menu or click shortcut icon “ ” in the toolbar, thus the system will show the Sample Data Input Interface. This interface of the samples’ information is related to the selection of the “SNP analysis”, and the specification of the buttons in the sample data interface for the SNP selected or SNP un-selected sample are listed below: Click the small arrow at the right side, and then select the number of the sample groups, like 1, 2, 3 or 4 in the pop-up frame. Click the small arrow at the right side, and then select the concentration unit of the sample like ”copies/ml”, ”IU/ml”, “fg/ml” or “pg/ml” in the pop-up frame. Click this key, thus the Name Column will be set up as A1, A2…B1, B2…B24 automatically; Group: 1; Property: unknown; Sex: Male; Concentration Unit: copies/ml; And other columns will remain empty. Click this key, thus all sample information will be cleared. Click this key, thus the newly-revised information but without pressing “Enter” will be clear, and the sample data will restore to the original state automatically. Click the right arrowhead to select the fluorescence, which corresponded by standard allele 1. 18 Line-gene K Fluorescence Quantitative PCR Detection System Setting in the Absolute Quantification Module Click the right arrowhead to select the fluorescence, which corresponded by standard allele 2. There are 22 default items in the sample data. The user can input any item optionally according to the demands. Please refer to the input methods of every sample item below: “Name” Column: Click any item and then input the content directly. “Grouping” Column: the user can revise the group information. “Type” Column: click any item, and then input content directly. Note: This column can’t be blank; otherwise, the program will not run automatically. Intelligent Operation: Pull one or more grouping lines to a certain position, where there will create the same content as last one or more lines automatically, which can be also revised. “Property” Column: select one line, and then click pop-up arrow at the right side, thus to select the property of sample from the pop-up frame. Note: The SNP selected property is different to the SNP unselected property. “Concentration” Column: if the sample property is the “Standard”, the user can input the concentration value directly. Note. : The user can set several standards with the same concentration. When analysis, the user needs to hold on “ctrl” button with click the standards to select the standards for analysis. If there are more than two standards with the same concentration selected, the software will calculate the Ct value of the standards and also the average of the standards with the standard deviation. “Sample No.” column: can be input directly. “No.” column: can be input directly. “Name” column: can be input directly. “Sex” column: select and click a certain line, and then select the sex in the pop-up list. “Age”, “Outpatient No.”, “Inpatient No.”, and “Bed No.”, “Case No.” column: can be input directly. “Doctor” and “Dept.” column: select and click a certain line, and then select the doctor or the department from the pop-up list. The contents in the pop-up list can be edited directly, and then be saved automatically. “Sub Date” column: double click a certain line, thus there will display the current date, press “OK” to make sure input the current date, or you can adjust the date through up/down key on the right side by cursor. Click “Diagnosis” column: select first and then input directly. “Sampling Time” column: the same way as that of inspection column. “Sample State”, “Nationality”, “Notes” column: can be input directly. Sample information (such as type, Sample No., No., Name, Age, Sex, Inpatient No., Outpatient No., Case No., Doctor, Dept., Diagnosis, Sampling Time, etc.) will be printed out automatically when the user prints out the report. The default items will be printed out in case there is no sample information input when the user prints out the report. (Please refer to Chapter 9 for more detailed information.) 19 Line-gene K Fluorescence Quantitative PCR Detection System Setting in the Absolute Quantification Module 5.7.3. Sect Sample Data Columns If you think that the default items of sample information column are not suitable, the user can define the columns of the sample information by selection. Operation: Click the “Select Sample Data Columns” from “Sample Information (S)”, thus the system will show you the dialog box of sample information column as below. Figure5-4 Click “Add (A)” or “Remove (D)” to select the necessary columns, thus the selected columns will be showed in the right pane. Select a certain sample information column from the right pane first, and then click “Move Up (U)” or “Move Down (D)” to change the position of the current column in the sample input frame. Click “Add All (W)” or “Remove All (M)” to add or delete wholly. 5.7.4. Customized Sample Data Column The user can add the customized sample data columns as necessary. Operation: Click “Customized Sample Data Columns(C)” from “Sample Information (S)” menu, thus the system will show you the dialog box below. 20 Line-gene K Fluorescence Quantitative PCR Detection System Setting in the Absolute Quantification Module Figure 5-5 Click “Add (A)”, thus one line would be added automatically. Click Column 1 to edit and input the customized column’s name, and then click “OK (O)”. In the “Select Sample Data Columns” interface, add the customized columns into the right frame for use. Click “Remove (R)” button to delete the customized information column. 5.8. Set the Detection Program Phrases To confirm the running mode according to the detection target or the test content: “Cycle/Temp.”, “Melting”, and “End”. If you click the running mode button, the system will add one (1) segment automatically into the right program editing column; similarly, click again to add segment 2. There are 20 segments to be input at the most. If you want to do remarks on these program segments, you can click the “Notes” on the current segment to input the information directly, where there are 20 bytes to be input at the most. Under the different running mode, the contents of their relative steps are different. If you want to modify the segments, select the program segment firstly, and then click the right key of cursor, thus to edit the segment such as “MoveUp (U)”, “MoveDown(D)”, “Remove(R)”, “Cut(T)”, “Copy(C)”, “Paste(P)”. Please refer to the following Figure. Figure 5-6 21 Line-gene K Fluorescence Quantitative PCR Detection System Setting in the Absolute Quantification Module 5.9. Set the Steps of “Cycle/Temp.” 5.9.1. Add/Delete Steps The interface of the steps of the “Cycle/Temp.” Figure 5-7 Add: click“ ”directly to add a step, which will be added in the last line automatically. Delete: select the step first, and then click “ Insert: firstly select the step where needs to insert a step, and then click “ ” to delete it. ” to insert a step. Every parameter of inserted step is the default data, which can be edited if necessary. 5.9.2. Set the Cycles The cycles setup is only valid to the mode of “Cycle/Temp.”. The cycles number can be 1~99. If the cycles number is bigger than 99, the system will treat it as 99 maximum. 5.9.3. Set the Temperature Parameters The use can set up several steps of temperatures (Cycle/Temp) for every segment. The maximum steps are 20. Time: states the time that the instrument keeps the target temperature after it reaches to it. Rate: states the heating or cooling rate. The default is 4.0, which is the max. ramping rate. Grad Temp. : states the temperature different from the No.1 well to the No.24 well. Introduction of the Target temperature, 2nd Temp., Step Size and Step Delay as below: 22 Line-gene K Fluorescence Quantitative PCR Detection System Setting in the Absolute Quantification Module Step Delay: 5 Target: 90℃ Step Size: 5℃ Time (min) 2nd Temp.: 72℃ Figure 5-8 5.9.4. Select the Sample Detecting Mode Under the “Cycle/Temp.” running mode, there is only one step to be detected. The user can select the step to be detected by click “single” in the pop-up list. When the system runs to this step, it will detect and collect the fluorescence of the sample for one time. 5.10. Set the “Melting” Curve The interface of the “Melting” curve is as below: Introduction of initial temperature, target temperature, constant temperature, step temperature, sample mode (Step): Target Temp.: 95℃ Constant time: 20Sec. Step Temp.: 0.5℃ Sample detection Initial Temp.: 60℃ 23 Line-gene K Fluorescence Quantitative PCR Detection System Setting in the Absolute Quantification Module Figure 5-9 Melting curve specification 5.11. Set the “End” After the experiment is over, the user can click “End” to save the samples at a low temperature (the default value is 4℃). The target temperature in this step is for sample storage. The range is 4~99.9℃. The “End” segment is always at the end of the program. Note: After the program is running over, the instrument will dehumidify automatically before it starts the second program. 5.12. Save the detection result Click “ ” or “Save (S)” from the “File” menu after finishing the detection procedure, and then there will display a dialog box for saving the file, where the user can input the file name (the default file name is “fqd+ the current year-month-date-hour-minute-second”), and finally, click “Save”. The file of the detection result will be saved under the folder of the user’s name automatically. In case there is no the folder named as the user’s name, the system will newly-build a folder named as the user’s name automatically to save the file. The result will be saved in the “default” folder automatically in case that the user doesn’t input a user’s name. Figure5-10 5.13. Import Setup Parameters In a newly-built detection program, the user can import the setup parameters from a saved program. Click “Import Setup Parameters (I)” from “File (F)”, thus there will display an interface, where the user can select to open a file. And then the system will import the setup parameters from the selected file to the new program. While in the new program, the setup parameters can be modified if necessary. 24 Line-gene K Fluorescence Quantitative PCR Detection System Setting in the Absolute Quantification Module 5.14. Calculate the gradient temperatures In the gradient temperature calculation interface, the user can refer to the figure to know the temperature in the sample holes. Click “Grad Temp. Calculation (C)” from “System Parameters” Menu, thus the system will display a gradient temperature calculation figure as below. Figure 5-11 5.15. Crosstalk measurement Crosstalk of every instrument has been measured by using reagent of a part of channels at ex-factory, you can observe in “Crosstalk Dyes Measured” When crosstalk of every instrument need to be measured by using reagent of other channels, you can do it in “Crosstalk Dyes Measured (T)…” of “System Parameters (P)” pull-down menu. Reagent of channels should be laid according to rules, for example, reagent of channel F1 should be laid in wall A1. User may select reagent,which is single character and pure dye, of one or more channel to measure at the same time, and may add and cover, the saved file name: gain48.coe and scan48.coe. When measuring, operate software according to prompt, user may select dye name or define new dye name, set “gain” to fit value of channel when running. It takes about 45min during measure. Channel Reference well crosstalk reagent F1 A1 F2 A2 F3 A3 F4 A4 25 of Line-gene K Fluorescence Quantitative PCR Detection System Setting in the Absolute Quantification Module WATER A5 5.16. Function of automatic gain calibration After selecting “Auto Gain” from “Gain Setup” interface, during detection program running, the gain value of dye of each channel will be automatically adjusted. The automatic gain calibration program runs with the following mode: The automatic gain detection well of each channel is: F1 channel --1st well F2 channel --1st well F3 channel –2nd well F4 channel –3rd well The system through adjusting the sample fluorescence intensity of each channel’s automatic gain detection well realizes the function of automatic gain calibration.At quantitative detection, adjusting the gain value will ensure the fluorescence intensity 25 of sample of each channel detection well is value that customer appoints (default 25)..At melting curve detection, adjusting the gain value will ensure fluorescence intensity 90 of sample of each channel detection well is value that customer appoints (default 90).. Calibration program will not insert extra automatic gain detection cycles, and it uses several starting detection points for automatic gain calibration.During running process of automatic gain calibration program, change of each channel gain value will be displayed in “Gain Setup” interface. After running, the system will automatically save calibrated gain value, which may be inquired from “Gain Setup” interface. 26 Line-gene K Fluorescence Quantitative PCR Detection System 27 Run the PCR Detection Program File Line-gene K Fluorescence Quantitative PCR Detection System Run the PCR Detection Program File Chapter 6 Run the PCR Detection Program File This chapter presents in detail the operation of Fluorescent Quantitative PCR Detection System and running detection interface. Warning! User should register the instrument in Bioer Technology Co., Ltd. to get the correct operation code. If the code is wrong, the instrument will not run normally. Input code, refer to6.3.3. Note: Please check that items of “3.1. Inspection before start-up” are all followed. And operate and open the system correctly according to the process of “3.2 Start up”. 6.1. Prepare Reagent Samples Prepare reagents: Line-Gene K uses 0.2ml centrifugal tubes; it is recommended to use 10μl~ 50μl in sample reaction system. Centrifugal operation: The test tubes with reagent should be centrifuged before put into instrument so as to ensure that the reagent can stay at the bottom of test tubes without air bubbles. Correct Reagent at the bottom Incorrect The test tubes should be centrifuged with enough strength and time. Placement of test tubes: If the quantity of samples is less than wells of block, please place the sample tubes evenly into wells to ensure even press by hot-lid, which can also guarantee balanced load of block and even temperature change of each tube. Warning! The position of test tubes should correspond with the content of sample data. If name column of a certain well in sample data isn’t set, this well’s detection information won’t be shown during running. Operating Hot-lid: 1)Automatic hot-lid FQD-48A(A4)has a function to open/close hot-lid automatically. Click the hot-lid button “ ” from interface or press hot-lid switch on the instrument manually to open/close 28 Line-gene K Fluorescence Quantitative PCR Detection System Run the PCR Detection Program File the hot-lid. Before doing the next operation, please make sure that the hot-lid runs correctly. Note: The hot-lid button in the software interface is unavailable during running. 2)Manual hot-lid Open hot-lid: According to the indication direction on the hand wheel, contra rotate the hand wheel and stop when resistance increases dramatically. Then push the hot-lid backwards. (Hot-lid can be pushed backwards only after contra rotating the hand wheel to the target position.) Close hot-lid: After pulling the hot-lid ahead to the target position, then rotate clockwise the hand wheel according to the indication direction and stop when resistance increases dramatically. Warning! If the instrument sounds abnormal noise or comes out abnormal display after power on, or comes out trouble warning during self-test, please power off and contact local distributor immediately. 6.2. Confirm Gain Value (Demarcated when Leving Factory) Different types even different batches of reagent samples have different fluorescence values during PCR fluorescence detection. If you want to self-set fluorescence value, please follow the steps below: 1) Set a constant-temp detection program before operating amplification procedure, hereinto: Target Temperature: Base on the temperature point in formal PCR experiment of fluorescent detection, constant temperature time is 10 seconds and adopting single sampling mode. Setting channel: The same as the channel of fluorescent detection in PCR experiment. Gain Value: Set as the default value (50). 2) Run the above program and observe samples’ fluorescent value (refer to section 3 of chapter 5). 3) If samples’ fluorescent values are between 10-50, the gain value is suitable. Otherwise, the gain value should be adjusted by repeating the last step. 4) After confirming the suitable gain value, open the PCR quantitative detection file that will be run formally and set this value as the gain value. Note: Before the instrument leaves factory, manufacturer has calibrated each channel’s gain value and the default value (50) is suitable for most of reagents. 6.3. Running 6.3.1. Open and Run the Detection Program File In the program setup interface, open the needed detection program file. Click “Run Procedure” menu or click Run button “ ” from the toolbar. If sample information hasn’t been input before running the procedure, the system will pop-up “Select Sample” interface. Click “Enter” then input the sample information. Before running the program, sampling modes of “Circulation/Constant” and “Melting Curve” haven’t been set as “Single” or “Step”, the system will display an interface to remind whether to continue running, thus can avoid wrong setup. 29 Line-gene K Fluorescence Quantitative PCR Detection System Run the PCR Detection Program File During setup of program, user can choose hot-lid under Work Condition, in case that the temperature of hot-lid doesn’t reach the set temperature, the system will display a reminding box reading “Hotlid Temp. Changing”. Only after the hot-lid reaching set temperature, can the program be run. If the instrument runs terminate procedure during last procedure running, the system will display “Dehumidify” interface when the instrument runs for the second time. Take out the test tubes from the instrument, and click “OK (O)”, thus the instrument will do high-temperature dehumidification. After the dehumidification is over, put the tubes in, and click “OK (O)”, thus the system will run detection program directly. Note: The dehumidification is a preheat process to avoid dewfall in the system, thus to guarantee correct detection result. 6.3.2. Automatically Save the Detection Result File If there has been input the file name before running, the detection result file will be saved under the same name of program file name automatically after running. If there hasn’t been input the file name, the system will show a dialog box as below: 30 Line-gene K Fluorescence Quantitative PCR Detection System Run the PCR Detection Program File Input save file name, select save directory, and then click “Save (S)”, thus to achieve saving the detection result file. The format of save file is fqdpcr file(*.fqd). The pop-out dialog box file name is default file name: fqd+current year-month-date-hour-minute-second.fqd, the suffix extension file has been hidden by the system. 6.3.3. Code Input The system will come forth the code input screen when software runs at first time after being installed. Put the correct code into the dialog box, and click “OK (O)"; System enters automatically into running interface and starts to run detection program. Obtain code: User should register the product in Bioer Technology Co., Ltd. at the first time of using, obtains correct operation code and record it for next time's use. If code is incorrect or click "Cancel(C)", system will come forth "Wrong Code". Though you can enter into the system either, it's on abnormal state. If code is correct, well then, you needn't input the code in the next time. (Actually, the code input dialog box won't come forth in the future using.) If the software is reinstalled or computer is changed, at the first time of running, system will come forth the code in put dialog box again. Please input the original correct code, system runs well. 31 Line-gene K Fluorescence Quantitative PCR Detection System Run the PCR Detection Program File 6.4. Display and Operation During Running Process 6.4.1. Program's Real-time Running Interface Charts 6.4.2. Fluorescence Selection (Adapt to the detection of Multi-Group fluorescence selection) Click the right drop of “Fluorescence Select” in the running interface, we can select the different fluorescence. The curve of fluorescence intensity will be shown in the interface. 6.4.3. Select Grouping Display (Suit to multi-group's detection) Click the select box at the right of “Grouping” in running interface to select one fluorescent curve display mode for each group. Show the samples’ fluorescent curve of the selected group. 6.4.4. Show/Hide samples curves Click “Show All” key to display all samples’ fluorescent intensity and curve; Click “Hide All” key Click “Display State” key Click the “Full Screen” key to hide all samples’ fluorescent intensity and curve; below of samples to shift Display/Hide for fluorescent curve. to show the content of this area on full screen. 6.4.5. Show Grads Temperature If set a gradient temperature when setting the program, click“ 32 ” in program running Line-gene K Fluorescence Quantitative PCR Detection System Run the PCR Detection Program File interface to pop-up gradient temperature of 24 wells. Click the top right corner close button in gradient temperature display interface to cancel each well’s display of gradient temperature. 6.4.6. Set Fluorescence Display Range Click curve display state button in the display area of fluorescent curve, then user can switch fluorescent curve’s display area. In the state, the fluorescence intensity curve is shown abnormally. The user can adjust the display range by moving the right staff gauge by mouse. In the state, it means adaptation of Y axis, and the value of fluorescence intensity is shown at the Max. 6.4.7. Display Temperature State The change of Samples’ current temperature when running the Temp/Time curve recording procedure shown in the following chart. Unit of time: Hour: Minute 33 Line-gene K Fluorescence Quantitative PCR Detection System Run the PCR Detection Program File 6.4.8. Add/Reduce Cycle Number Click the button of adding one cycle“ ”or reducing one cycle“ ”, the system will add one or reduce one cycle in every time. The max. cycle number is 99. 6.4.9. Deal with the Hot-lid's Abnormal Open The hot lid should not be opened in the course of procedure’s execution. If opened, a pop-up hot lid dialogue box will appear. Press “NO” to exit the procedure. Press “YES” to go on with the procedure, but the test result may be unreliable. Warning! The hot lid should not be opened in the course of procedure’s execution; otherwise the test result may be unreliable. 6.4.10. Stop the Current Program Phase Click the “Terminate the Current Procedure” command in the “File” menu or click “ ” button in the toolbar to terminate running of the current procedure. 6.4.11. Stop Running After finishing the operation, the running interface will exit automatically, while the system will enter result analysis interface; the running result will be saved automatically (refer to 5.3.2); and the instrument will go back to the initial current state. If the program needs to be stopped on its midway, click command then the whole program will terminate running and the result will be saved automatically. But if the cycle number that has been run is too low (less than 6), the result won’t be saved. 6.4.12. Indicator Light During Instrument’s Working State There are 4 indication lights in the front of instrument to display the working state of system: POWER : The indication lights shown as green states that the instrument is under power on state. RUNNING :The indication lights shown as green states that the instrument is under running state. ALARM :The indication lights shown as yellow states that the hotlid is under opening state. FAULT: The indication lights shown as yellow states trouble warning. Note: After the program is running, please turn off the power. The hotlid will be on working condition if turn on the power. 6.4.13. Alarms When Running Over-temperature warning of hot-lid. Over-temperature warning of radiator. Over-temperature warning of ambient environment. The system will alarm when the 34 Line-gene K Fluorescence Quantitative PCR Detection System Run the PCR Detection Program File temperature of ambient environment is over 35℃, while it will start self-protection procedure when the temperature is over 40℃ and stop running. Note: Over-temperature warning of block. When the system shows any warning, user should stop the running procedure of PCR detection system, turn off its power supply and then restart the instrument. 35 Line-gene K Fluorescence Quantitative PCR Detection System Absolute Quantitative Analysis Module Chapter 7 Absolute Quantitative Analysis Module 7.1. Open the Detection Result File After the procedure running over, the system will enter the “Date Analysis” interface. Click “Open(O)” command from “File” menu or click “ ” button in toolbar, choose the target file and then click “Open (O)” command in the opening file dialogue box. All of the detection results are saved in default database. To open the files from other folder, user can adopt “Import” function. The operation is: Click “Import(M)” command from “File(F)”menu, choose the target file and then click “Open(O)” in the opening file dialogue box. Open the imported file and it can be saved in default database. In module of absolute quantification, user can import detection result of SNP and relative quantification. The operation is: Click “Import SNP File” /”importt Relative File”command from “File(F)”menu, choose the target file and then click “Open(O)” in the opening file dialogue box. Open the imported file. 36 Line-gene K Fluorescence Quantitative PCR Detection System Absolute Quantitative Analysis Module 7.2. Fluorescence Selection If the detecting results are Multi-type files, we should select the type of fluorescence before analysis. The selection method is: Click “Fluorescence (C)” menu column and select the type of fluorescence which need analysis. User may test two dyes in the same channel, dyes of channel are permitted to be modified during analysis. For example, if user sets dye of the second channel with “HEX”, while user uses dyes with “HEX” and “VIC”, user may modify dye of the second channel with “VIC” during analysis, so that targeted crosstalk amendment can be carried out. The operation as follows: 1. To select “Select Dyes for Analysis” of ”Dyes” put-down menu 2. To select dyes in pop-up window, and click “OK”, then user may analyse selected dyes in analysis interface. 37 Line-gene K Fluorescence Quantitative PCR Detection System Absolute Quantitative Analysis Module 7.3. Grouping Selection If the samples are divided into groups, it’s necessary to analyze in groups. Selecting mode: Click “Grouping selection(G)” menu to select a group to analyze. 7.4. Select and Switch Analysis Mode Line-Gene K has two modes can be selected for PCR result analysis: Quantitative analysis and Melting curve analysis. 1) Select “Quantitative analysis”: Click “Quantitative analysis” from “File ( F ) ” menu or click “Quantitative Analysis (Q)” in the toolbar. 2) Select “Melting Curve (M)” mode: Click “Melting Curve” from “File(F)” menu or click “Melting Curve” in the toolbar. Note: If only one detection mode is adopted during detecting, it’s not necessary to select analysis mode and the system will select it automatically when opening the result files. Only doing both modes as “Quantitative analysis” and “Melting Curve” during detecting, it is available to select or shift detection mode. 7.5. Select Display Mode Click “Logarithmic” in the “Display Mode” column during detection, the analysis result will be displayed in the way of logarithm curves. Otherwise, the result will be displayed as common fluorescence intensity /cycle number curve. Because fluorescence values of different experiments are different, please set fluorescence curve to full value as 100, which is convenient for compare among different experiments. Adjusting the curve through the smoothness of curve column, there are four modes can be chosen: low, lower, high and higher. 38 Line-gene K Fluorescence Quantitative PCR Detection System Absolute Quantitative Analysis Module 7.6. Quantitative Analysis 7.6.1. Summary of Quantitative Analysis Fluorescence Plateau Period Index increasing period Linear period Cycler number when starts index increasing Cycle Number Picture 6-1 Typical PCR Amplification Curve The curve showed in picture 6-1, it’s a typical PCR amplification curve. The amplification of PCR includes 3 phases: 1)Linear epacme. 2)Exponential epacme. 3)Stationary phase. During PCR amplification, the time (circular number) for samples with different concentrations to enter exponential epacme is different. The samples with high concentration will enter into exponential epacme earlier than that with low concentration, which need more cycles of amplification. Thereby, user can get the rotation number of each sample through comparing the PCR amplification curves, thus to work out each sample’s concentration, and then achieve the target of quantification analysis. 7.6.2. Sample Data after Quantitative Analysis (data analysis) After quantification analysis, there are two main sample data: Ct value and calculating concentration 39 Line-gene K Fluorescence Quantitative PCR Detection System Absolute Quantitative Analysis Module . Ct value: it is the circular number of fluorescence curve entering into exponential epacme. Calculating concentration: Compare with the standard sample or the standard curve to work out the sample concentration. Explain: Click the right button next to “Hide All”, the result data will be shown as full screen. Click the right button of mouse, you can print all of the results as full screen. 7.6.3. Absolute quantitative analysis principle There are two methods to do absolute quantitative analysis: 2nd Deriv. Max. method and fit-point method. 1) Analysis principle of 2nd Deriv. Max. Firstly, get the location where the max. 2nd Deriv. lies from the fluorescence curve of each sample through calculating (fluorescence intensity-cycler). Regard the max. value of fluorescence intensity located the position where max. 2nd Deriv. Lies as the threshold. And then, draw a horizontal curve through the threshold, which will be crossed with the quantitative curve. The cycler numbers relative to the crossed points are threshold cyclers, namely, Ct value. Get 2 or more Ct value of standard samples with different concentration through calculating, and then fit point the Ct values of standard samples and their relative log concentration sample points, thus to get a Ct value-log concentration curve (linear function). To calculate sample concentration of each sample through Ct value-log concentration curve (linear function) and Ct value of samples. To compare the calculated samples’ concentration with standard concentration, thus to get the detection result. 40 Line-gene K Fluorescence Quantitative PCR Detection System Absolute Quantitative Analysis Module ① Fluorescence ①——Detected fluorescence curve ②——2nd Deriv. curve ③——the location where max. Intensity 2nd Deriv. Curve lies ③ ④——the location where max. 2nd Deriv. Curve lies through threshold. ⑥——Cross Cycler Fluorescence Intensity curve ⑤——horizontal ④ ② ⑥ point of horizontal curve and max. 2nd Deriv. Curve ⑦——the relative cycle of the crossed point: Ct value ⑦ ⑤ Cycler Figure7-1 Principle to calculate Ct value through Max. 2nd Deriv. method Figure 7-2 Principle to calculate sample concentration 2)Analysis principle of fit-point method: Firstly, according to the index growing area of fluorescence curve, fit-point fluorescence intensity log-cycler number curve. According to the noise of amplification curve to determine the baseline. Choose 2 or more sample points on the baseline, get a linear function of fluorescence intensity log-cycler number through fit-point. The fit-pointed linear function and the baseline will be crossed. The corresponding cycler number of cross point is called threshold cycler number, namely, Ct value. Get 2 or more Ct value of standard samples with different concentration through calculating, and then fit point the Ct values of standard samples and their relative log concentration sample points, thus to get a Ct value-log concentration curve (linear function). To calculate sample concentration of each sample through Ct value-log concentration curve 41 Line-gene K Fluorescence Quantitative PCR Detection System Absolute Quantitative Analysis Module (linear function) and Ct value of samples. To compare the calculated samples’ concentration with standard concentration, thus to get the detection result. ① ①——Detected fluorescence Fluorescence curve Intensity ③ ②——Fluorescence intensity log and cycler no. curve ③——baseline ④——the Cycler Fluorescence ⑤——Cross point of sample ⑤ ③ fit-point line baseline. Cycler ② Figure 7-3 Principle to calculate Ct value through fit-point method 7.6.4. Select Quantitative Analysis Select the “2nd Deriv. Max.” or “Fit points” in the “Method” column. 2nd Deriv. Max. Automatically work out each circular point’s second derivative value in fluorescence curve and define the max. one as Ct value, accordingly achieve the target of quantitative analysis. Fit-point method Set a base line and a threshold value, then draw a threshold value line; Adopt some sample points in fluorescence curve which is above the base line and in the exponential epacme, and the intersection point between the sample fit-point straight line and the threshold value line is the Ct value. When adopting this method, user need get sample points in exponential epacme of fluorescence curve. The number of sample points must be more than 2 that could be imported directly. Point numbers recommended: line through fit-point ④ Intensity straight 2 ~ 4. (Usually choose 2). Then the system will choose sample points automatically from fluorescence curve. 42 and Line-gene K Fluorescence Quantitative PCR Detection System Absolute Quantitative Analysis Module 7.6.5. Analysis Process 1) Selection of Standard Sample User can set several standard samples with same concentration value. During analysis, user can choose one or more samples that are set as standard mode from standard concentration column by pressing “ctrl” + “Left Key” of mouse. The chosen samples’ grounding color would be blue. In the PCR quantitative analysis mode, if there are two or more than two sample with different concentration being selected, we can calculate the calculation concentration of this concentration’s standard sample and the average and the standard deviation of Ct value. Note: In case that user set standard sample but not choose standard sample, or only choose less than 2 samples with different concentration, it is impossible to calculate concentration. 2) Adjusting Zero: Click “Zero Adj.” and set values in the pop-up adjusting zero dialog box. Automatic adjustment: The zero will be set to the average value over the fluorescence values from cycle 1 to cycle 10. Manual adjustment: The zero will be the average value over the fluorescence values from the start cycle to the end cycle. The start cycle and end cycle should be set on the steady section of the fluorescence curve. Linear Adjust: If the said function is selected, fluorescence curve system shift may be corrected. 3) Tolerance of noise (Adjusting base line, just for fit-point method): Click “Baseline” to set the value for “Baseline position” in the dialogue box of “Baseline and Threshold”. The baseline should be set as low as possible, but above the noise of each sample. If same reagent is used for different experiments, the baseline for the result analysis on those experiments should be set as same as possible. For result analysis of the same experiment, different base line setup refers to different Ct. 43 Line-gene K Fluorescence Quantitative PCR Detection System 4) Absolute Quantitative Analysis Module Quantitative Analysis (Confirm the threshold value) Click “Analysis” to set the value for “Threshold” in the dialogue box of “Baseline and Threshold” (for Fit-point only). The threshold should be set with due consideration of the correlation coefficient and error parameters etc. The line of threshold value should be higher or equal to base line. 7.6.6. Modify Samples' Attribute The property of the sample can be modified in the “Analysis” interface, operate as the following: In quantitative PCR analysis model, Click a sample counterpart in the standard attributes column ,it will bomb attributes Dialog box , the attribute of the sample can be re-established; Click “Sample data…(S)” from “Sample information(S)”menu, modify the sample information in pop-up sample import interface. 7.7. About Analysis Result After carrying out the quantitative analysis shown in section 6.4 of chapter 6, the analysis result will be shown as following: 44 Line-gene K Fluorescence Quantitative PCR Detection System Absolute Quantitative Analysis Module The bias in dashed line box is fitted by the known concentration standard sample’s Ct value. There are 4 parameters to token the contrast line on the right. Y axis intercept, slope: math parameters of the straight line. Error, correlation coefficient: represent the error of this analysis result. “Calculate Concentration and Ct value” column can display every sample’s calculated concentration and Ct value. When several standard samples with same concentration are chosen, user can refer to the average Ct value, standard difference of Ct value, average concentration and standard difference of concentration. 7.7.1. Application of Standard Curve The standard curve is a contrast line that is used to calculate the concentration of sample. If there is no standard sample set during the PCR experiment, user can import the given standard curve to do analysis and calculation. Create a Standard Curve 45 Line-gene K Fluorescence Quantitative PCR Detection System 1) Absolute Quantitative Analysis Module Open the “Detection Result” file that will be used as a standard curve. Click the “Save Standard Curve" from the “File (F)” menu. Specify the file name and the saving path in the pop-up dialogue box. Then click “OK”, thus “Standard Curve” file will be created. 2) In “Detection Result” file that is used as standard curve, the number of the standard sample should be set from 2 to 5. If the sample number is fewer than 2, system will prompt user when the file is saved. If more than 5, the preceding 5 samples will be saved. Application of Standard Curve 1) Open the “Detection Result” file to be analyzed. Click “Open Standard Curves (T)” from the “File (F)” menu. In the pop-up dialogue box, select the “Standard Curve” file to be imported. The standard curve will be imported. 2) After importing the standard curve, the original standard sample in the “Detection Result” file will be treated as a nonstandard sample. 3) The “Detection Result” file to be analyzed should have the same running setup, running environment, reagent and reagent preparation as that of the “Detection Result” file with which the standard curve is affiliated. Any discrepancy will affect the analysis results. 4) The user should realize that the analysis results obtained with the standard curve function have a big risk of error. Warning! The application function of standard curve is intended for contrast research, but not for clinical diagnosis. Announce! The application function of standard curve is intended for contrast research, but not for clinical diagnosis. Otherwise, any rising result shall not be property to any responsibility of Bioer Co. 7.8. Introduction and Process of Melting Curve Analysis 7.8.1. Introduction of Melting Curve Analysis Analysis on the melting curve is in common used in quantitative PCR. The principle is: PCR quantitative analysis uses the fluorescent effect which is worked out by the process, after renaturation of DNA in low temperature, the amplification produce will combine to DNA double chains as base pairing principle and some fluorescent materials will be activated when they combine with the double chains DNA, then they 46 Line-gene K Fluorescence Quantitative PCR Detection System Absolute Quantitative Analysis Module will work out the fluorescence. When the amplification is finished and step up temperature slowly, double chains of DNA will be untied then dyes will be released and fluorescence will reduce. You can get the melting curve by inspecting the melting process continuously and dynamically. We can identify produces, differentiate non-specificity (such as primer dimer), and analyze mutation and SNP. Melting curve and its analysis sample shown in picture 6-5, it’s a typical melting curve which deputies the relation between fluorescent strength and temperature. Software can do derivation analysis automatically and can find the position of the max. derivative by manual or automatic method. This position’s relative temperature can be judged as the melting temperature(Tm) of DNA template in reagent. 7.8.2. Select Analysis Method After select “Melting curve Analysis” mode, system will enter into melting curve analysis interface, then select analysis method in “Analysis Method” column. Select “Auto.” or “Manual” in the “Method” column 1) Automatic Click the down arrow in the “Number of Peaks” column and select the peak number in the drop-down list (3 can be selected at most). Click any certain sample item in the “Sample” column. The “Temperature” column will display the sample’s peak temperature, i.e. the melting temperature. 2) Manual Set the sample show/hide status to display the sample to be analyzed. Adjust the peak temperature value in the “Temp. of peaks” column or, drag the peak position on curve in the derivative/ temperature figure to locate it at the peak position of the derivative/ temperature curve of the selected sample. This peak temperature is the melting temperature. 47 Line-gene K Fluorescence Quantitative PCR Detection System Absolute Quantitative Analysis Module 7.9. Save the Analysis Results 7.9.1. Save the Analysis Data After the detection procedure is finished, the system will enter into analysis interface automatically. When the analysis is finished and close the file, it will clue on saving the file. Set file that have been saved by program before running, the detection result will be saved automatically after the program finished. Cancel to save after analysis is finished, it will not save the analysis result, just save detection result data. Set file that haven’t saved by the program before running, the detection result and analysis result won’t be saved after the program is finished. All of the detection result files are saved in default database. If you want to save the detection result files in other position, can adopt “Export(X)” function. The process of operation is: Open the file wanted to export, click “Export” command from “File(F)”, select position in pop-up dialog box, then press “Save”. Warning! During program set, the file isn’t named, and then not named after the program is finished, system will delete this unnamed file. 7.9.2. Save the Analysis Curve Software system of Line-Gene K can save relative curve of analysis result under *.jpg format if necessary. In the quantitative analysis or melting curve analysis interface, and in the quantitative SNP analysis or melting curve SNP analysis interface which will be referred in the following chapters, by clicking “File (F)” menu, select responding save: Explain: During the PCR Quantitative curve analysis process, User can select “Save Quantitative Analysis Curve (F)” and “Save Concentration Curve (C)” to save the pictures; During the PCR Melting curve analysis process, User can select “Save fluorescence – temperature curve(B)” and “Save derivative – temperature(D)” to save the pictures. During the SNP curve analysis process, User can select “Save Quantitative SNP analysis type picture(T)” to save the pictures; 48 Line-gene K Fluorescence Quantitative PCR Detection System Absolute Quantitative Analysis Module During the SNP Melting curve analysis process, User can select “Save melting curve SNP analysis type picture(Y)” to save the pictures. 7.10. Application of Backup Files When Line-Gene K stops working in case of trouble of system or other reasons, it has the function of detection data protection. The “backup0”, “backup1” and “backup2” files in “default” file will record the latest data in turns (The alternation time is about 30 seconds). When the detection result file is lost, the system will stop running immediately. And open the latest backup files (backup0, backup1, backup2) and then save them into file named as user’s name. 7.11. Select treatment methods of fluorescence detection data During analysis, user can select suitable method to analyze fluorescence detection data according to their demands. There are two methods generally: Fit-point fluorescence data and raw fluorescence data. The fit-point fluorescence data is optimized data by the system on raw fluorescence data. Fit-point fluorescence data(F):under quantification or melting curve analysis interface, click pop-up menu of “System Parameter (P)”, select “Fit-point fluorescence data (F)”, thus can do analysis on fluorescence data after fit-point. Raw fluorescence data( R ): under quantification or melting curve analysis interface, click pop-up menu of “System Parameter ( P ) ”, select “Raw fluorescence data”, thus can do analysis of raw data. Change the method to deal with fluorescence detection data of original file: click “Yes(Y)” from the pop-up dialog box, thus can change the method to deal with data. All current analysis results will be cleared in the case that the method is changed. Note: after running is over, please save fit-point fluorescence data. When re-open the file, the interface of saved fluorescence data will be showed. 49 Line-gene K Fluorescence Quantitative PCR Detection System SNP Modules Chapter 8 SNP Module 8.1. Enter into SNP Module On the condition that other functional module is not running, please select “SNP” button to enter into SNP functional module in the function selection interface of Figure 8-1. SNP Analysis interface: Figure 8-1 8.2. Setting and Running of SNP Program Files in SNP Module The setting and running of SNP program file is the same as absolute quantification. (Here we omit). 8.3. Open the Detection Result File The system will automatically enter into the analysis interface after program running. Click "Open (O)" command in the “File (F)”, or click " “in the tool bar, select target file, and then click "Open (O)". All detection result files are saved in default data base. If you want to open the file in other location, you can use “Import” function. Click "Import (M)" in “File (F)” and select the target file and then click “Open (O)” The file will be saved in the default data base after imported. 50 Line-gene K Fluorescence Quantitative PCR Detection System SNP Modules 8.4. Select the Fluorescence If the detection result file is a multi-channels fluorescence detection result file, well then, please select the genotype of fluorescence before analysis. Click “Select Fluorescence” menu bar to select the genotype of fluorescence. User may test two dyes in the same channel, dyes of channel are permitted to be modified during analysis. For example, if user sets dye of the second channel with “HEX”, while user uses dyes with “HEX” and “VIC”, user may modify dye of the second channel with “VIC” during analysis, so that targeted crosstalk amendment can be carried out. The operation as follows: 1. To select “Select Dyes for Analysis” of ”Dyes” put-down menu 2. To select dyes in pop-up window, and click “OK”, then user may analyse selected dyes in analysis interface. 51 Line-gene K Fluorescence Quantitative PCR Detection System SNP Modules 8.5. Select the Group If the samples are divided into groups, please select the group before analysis. Click “Select the group” menu bar to select grouping analysis. 8.6. Select and Switch the Analysis Mode There are two analysis modes to be selected for SNP result in LineGene K, like: quantitative SNP analysis and melting curve SNP analysis. Select the Quantitative SNP analysis mode: Click “SNP analysis” command in “File” menu bar, then click “Quantitative SNP analysis” menu in tool bar. Select Melting curve SNP analysis mode: Click “SNP analysis” command in “File” menu bar, then click “Melting curve SNP analysis” menu in tool bar. Note: If the user selected only one mode for detection, the system will automatically show the corresponding analysis mode when open the result file. Only when both of the Quantitative SNP analysis and the Melting curve SNP analysis were selected for detection, there is necessary to select and switch the analysis mode when data analysis. 8.7. Select the Display Mode Select the logarithm curve in the quantitative analysis display mode bar, the corresponding analysis phase will be displayed as logarithm curve, otherwise it will display the common Fluorescence intensity / cycles curve. Due to the difference of fluorescence between different batches of experiments, to be convenient to compare the different batches’ fluorescence, the system will use full setting function to adjust the fluorescence curve to be the full scale value 100. Adjust the displayed curve in curve flatness bar, please select: low, a bit low, high, and quite high. 52 Line-gene K Fluorescence Quantitative PCR Detection System SNP Modules 8.8. Quantitative SNP Analysis 8.8.1. Summary for the Quantitative SNP Analysis Fluorescence Plateau Period Index increasing period Linear period Cycler number when starts index increasing Cycle Number Figure 8-2 Typical PCR Amplification Curve in the Quantitative SNP Analysis As showed in the figure, it is a typical PCR amplification curve of SNP quantitative SNP analysis. There are three phases in PCR amplification: 1) linear growth period; 2) Exponential growth period; 3) Platform period. For different samples with the different concentration, their cycle number to enter into the exponential growth period during PCR amplification is different. The high concentration samples enter into the exponential growth period earlier, and the low concentration samples will enter into the exponential growth period later after more cycles amplification. According to this phenomenon, we can compare the cycle number of each sample entering into the exponential growth period by PCR amplification curve and then calculate the concentration of each sample to reach the quantification analysis. 8.8.2. Data Analysis after the Quantitative SNA Analysis 1) After select the Ct mode during SNP analysis, there are following genotypes of sample data: Genotype result, Ct-FAM or Ct-VIC etc. 53 Line-gene K Fluorescence Quantitative PCR Detection System SNP Modules Genotype result: It’s the determined genotype of sample allele. The name can be input. Ct-FAM: It’s the cycle number when FAM fluorescence curve analyzed by Ct mode, at which starts to enter into the exponential growth period. Ct-VIC: It’s the cycle number when VIC fluorescence curve analyzed by Ct mode at which starts to enter into the exponential growth period. Note: the quantitative analysis of SNP data are related to the sample fluorescence. The choice will be different genotypes of fluorescence corresponding genotypes of fluorescence analysis of samples, such as Ct -FAM, Ct -VIC, Ct-TAMRA, and Ct -ROX. In the Ct -allele gene map interface, it can switch to analysis the information through the sample selection coordinates axis corresponding the fluorescence genotypes. As to each sample data result, after click the full screen button at the right side of “Hide All”, at the data result full screen state, click the right key of mouse to print the data result in the full screen. 2) After select the fluorescence mode during SNP analysis, there are following genotypes of sample data: Genotype result, Fluorescence-FAM or Fluorescence-VIC etc. Genotype result: It’s the determined genotype of sample allele. The name can be input. 54 Line-gene K Fluorescence Quantitative PCR Detection System SNP Modules Ct-FAM: It’s the cycle number when FAM fluorescence curve analyzed by Ct mode, at which starts to enter into the exponential growth period. Ct-VIC: It’s the cycle number when VIC fluorescence curve analyzed by Ct mode at which starts to enter into the exponential growth period. Note: the quantitative analysis of SNP data are related to the sample fluorescence. The choice will be different genotypes of fluorescence corresponding genotypes of fluorescence analysis of samples, such as fluorescence -FAM, fluorescence -VIC, fluorescence -TAMRA, fluorescence -ROX. In the Fluorescence -allele gene map interface, it can switch to analysis the information through the sample selection coordinates axis corresponding the fluorescence genotypes. 8.8.3. Select the Quantitative SNP Analysis Mode There are two methods: “2 nd. Driv. Max.” or “Fit points” in analysis mode column for selection. 2 nd. Driv. Max. It is to calculate the second derivate value of every cycle point on the fluorescence curve automatically and then define the corresponding cycle number of the maximum second derivate value as Ct value, thus to achieve the quantitative analysis. The user can get the reliable result by this method only when the fluorescence curve is very smooth. Fit Points Method It is to set a base line firstly, and then set a threshold value and draw threshold value line accordingly. Secondly select some sample points on the segment of fluorescence curve above the baseline, which is in the logarithm increasing area. The corresponding cycle number of crossing point of fit-point line and threshold value is named as Ct value. Under the fit-point method, please select sample points on the index increasing segment of the fluorescence curve (Refer to the following Figure). The user can input the number of sample points directly, which should be more than 2. It is recommended to select 2-4 sample points. (usually it is 2 points ) The system will select sample points automatically on the segment of fluorescence curve, which is above the baseline. 8.8.4. Steps of Analysis 1) Zero Adjustment: Click “Zero Adj.” and set values in the pop-up “Zero Adj.” dialog box. 55 Line-gene K Fluorescence Quantitative PCR Detection System SNP Modules Automatic adjustment: The zero will be set to the average value over the fluorescence values from cycle 1 to cycle 10. Manual adjustment: The zero will be the average value over the fluorescence values from the start cycle to the end cycle. It should be set on the stable section of the fluorescence curve. Linear Adjust: If the said function is selected, fluorescence curve system shift may be corrected. Tolerance of noise (set the base line for fit-point method only): Click “Baseline” to set the value for “Baseline position” in the dialogue box of “Baseline and Threshold”. The baseline should be set as low as possible, but above the noise of each sample. If same reagent is used for different experiments, the baseline for the result analysis on those experiments should be set as same as possible. For result analysis of the same experiment, different base line setup refers to the different Ct. 2) Quantitative Analysis (Confirm the threshold value) Click “Quantitative Analysis” to set the value for “Threshold” in the dialogue box of “Baseline and Threshold” (for Fit-point method only). The analysis results will be displayed automatically after finish the setting. The setting of threshold value is related to some parameters such like correlation coefficient, error and so on... The threshold value curve should be equal to or higher than baseline. 8.8.5. Modify the Sample Attribute The user can modify the sample attribute in the analysis interface as below: Click a relative item under a standard concentration column, thus a dialog box for sample attribute appears, where the user can reset the sample attribute. 56 Line-gene K Fluorescence Quantitative PCR Detection System SNP Modules Click the “Sample Data (S)" in the "Sample Information (S)”, thus there shows the sample input interface, in which the user can modify sample information. 8.8.6. About the SNP Analysis Result 1) After the steps described in section 6.4 of chapter 7 the quantitative SNP analysis, the analysis results by the fluorescence intensity are as follows : Dotted line Box: the fluorescence intensity-allele Photograph shows the results of the analysis using fluorescence method, the red allele group is the analytical results of allele1 samples. The blue allele group is the analytical results of allele2 samples. The green allele group is the analytical results of mixed samples. The black allele group next to the allele group is the analytical results of undetermined samples through automatic genetic samples. And at this time user can determine the type of the gene manually. Move the mouse on the gene sample, the mouse will change to a hand, and user can round the gene sample. Click on the left side” ” , user can select the determined gene sample result, such as allele 1; Sub-Type Result: display the name of all kinds of the allele which were got by fluorescence method. Note: Fluorescence which is used on allele1 or allele2 in fluorescence intensity-allele coordinate 57 Line-gene K Fluorescence Quantitative PCR Detection System SNP Modules system can be selected in sample information interface. X axis and Y axis of the fluorescence intensity-allele will be switched. 2) After accomplish the quantitative SNP analysis steps which described in section 6.4 of chapter 7, the Ct analytical results interface shown as follow: In the box of the dotted line, Ct- allele Photograph shows the analysis results by Ct method. When the selected fluorescence shown as FAM, the analyzed red allel group is the determined allele 1 and the purple sample above the red is identified as the blank genetic samples by the automatic analysis, which can be determined through the manual analysis. Please move the mouse to the genetic samples, and then the mouse becomes a hand, the user can draw a round to select and click the right down box on the " " to give the artificial gene sample results, such as allele 1; The names of alleles analyzed and determined by Ct method are displayed in the typing result column. After select FAM as the fluorescence display, the Ct value of each sample analyzed and determined by Ct method is displayed in Ct-FAM column. Note: Ct which is used on allele1 or allele2 in Derivative-allele coordinate system can be selected in sample information interface. X axis and Y axis of the Derivative-allele will be switched. 8.9. Introduction and Steps of Melting Curve SNP Analysis 8.9.1. Introduction of Melting Curve SNP Analysis The melting curve analysis is a common used analysis method to the quantitative PCR products. The principle is that the PCR quantitative analysis uses the fluorescent effect, which is activated by combining the fluorescent dyes to the DNA. The process is as below: after the PCR amplification, and with providing 58 Line-gene K Fluorescence Quantitative PCR Detection System SNP Modules a high temperature slowly, the double chains of DNA will be hydrolyzed and then the dyes will be released and the fluorescence will be reduced. You can get the melting curve by inspecting the melting process continuously and dynamically. The user can identify the products or differentiate the non-specify products (such as the primer dimer), and analyze the mutation and SNPS genotype. Please refer to the melting curve SNP analysis Figure below. It’s a melting curve which represents the relationship between the fluorescent intension and the temperature. The software can automatically analyze the logarithm of the melting curve and can find the position of the max. derivative by the red or the green cursor method. The relative temperature of this position can be judged as the melting temperature(Tm) of DNA template of the reagent. Figure 8-3 the melting curve SNP analysis 8.9.2. Select the Curve Select the melting curve SNP analysis mode when analysis SNP data, the system will enter into the melting curve SNP analysis interface. There are two displaying modes to the curve: the derivative-temperature curve and the fluorescence-temperature curve. 1) Derivative-temperature curve: Click the derivative-temperature curve, it will be displayed in the curve window. The software can adjust the axis value of the fluorescence derivative-Allele1 and the fluorescence derivative-Allele2 by setting the position and range of the red and the green cursors to analysis the melting curve temperature of corresponding DNA template of different fluorescence value. 59 Line-gene K Fluorescence Quantitative PCR Detection System 2) SNP Modules Fluorescence-temperature curve: Click the fluorescence-temperature curve, the curve window will switch to it. In the fluorescence-temperature curve, the software can adjust the axis value of the fluorescence derivative-Allele1 and the fluorescence derivative-Allele2 by setting the position and range of the red and the green cursors to analysis the melting curve temperature of corresponding DNA template of different fluorescence value. But the fluorescence intensity and the temperature curve will not change. 8.10. Save the SNP Analysis Results 8.10.1. Save the Analysis Data After the detection procedure is finished, the system will enter into the analysis interface automatically. When the analysis is finished and close the file, it will clue on saving the file. Set the file that has been saved by the program before running, the detection result will be saved automatically after the program finished. Cancel “save” after the analysis is finished, it will not save the analysis result, but save the detection result data. Set the file that wasn’t saved by the program before running, the detection result and analysis result won’t be saved after the program is finished. All of the detection result files are saved in default database. If you want to save the detection result files in other position, you can use “Export(X)”. The process is to open the file to be exported, and then click “Export” command from “File(F)”, select a folder in the pop-up dialog box, then click “Save”. 60 Line-gene K Fluorescence Quantitative PCR Detection System Warning! SNP Modules During the program setting, if a file isn’t named, and then not named after the program is finished, the system will delete this unnamed file automatically. Note : The saving of the SNP analysis curves, the backup paper applications and the selection of the processing to the fluorescence detection data are same to the ways of the absolute quantification. Please refer to it. 61 Line-gene K Fluorescence Quantitative PCR Detection System Print, Output and Inquiry to the Results of the Absolute Quantification and SNP Modules Chapter 9 Print, Output and Query to the Results of the Absolute Quantification and SNP Modules 9.1. Print the Analysis Result 9.1.1. Print the Report Forms 1) Set up a print template (for data analysis and analysis report printing only): Figure 9-1 Printing template’s setting interface Click the “Print Template Setup (T)” command from the “File (F)” menu and set up in the pop-up dialogue box. The user can set the printing mode as following: In the ellipse of dashed line, the user can input the “Contrast Concentration”, “Contrast Ct”, maximum and minimum concentration values; At the left of printing item select column, all samples’ information and analysis result have been listed, select the target item, click “Add(A)” to add that to the right. At the right of printing item set column, can use “Add(I)”, “Delete(D)”to add/delete customized items. You can edit and modify in customized items’ box immediately. Click “Page Setup(P)” to pop-up page setup dialog box, then you can set pages and operate printing range. Click “Edit (E)” to pop-up the Figure 9-2 “Customized Print Template” the items will be shown in the print template. Double click the item column that will be printed, can adjust position, size and genotype face of the printing items. Save and exit the customized print template when finish edit. 2) After finishing the setting to the print template, click “OK(O)” to save the setup. Print setup Click the “Print setup” in the main menu, set the printing parameters in the pop-up dialog box. 62 Line-gene K Fluorescence Quantitative PCR Detection System Print, Output and Inquiry to the Results of the Absolute Quantification and SNP Modules Figure 9-2 the customized the print setup interface Figure 9-3 SNP data print preview interface Note: Either in the SNP analysis mode or the none SNP analysis mode, the user can set the font, the arrange mode or the position in Customized Print Template. But these contents can’t set in the print preview interface. 3) Select the printing sample: After the Quantitative analysis is complete, click the sample name to be printed, or hold down the “Ctrl” key and click the samples in the sample bar, and then the report forms of the selected sample will be printed out. Click “shift” key to select all the samples. 4) Print form setup: Click the “Print Setup(R)” from “File(F)” menu and set the parameters in the dialogue box. 5) Print Preview: Click the “Print Preview(V)” command from the “File(F)” menu to preview the printing of report forms. 63 Line-gene K Fluorescence Quantitative PCR Detection System Print, Output and Inquiry to the Results of the Absolute Quantification and SNP Modules 9.1.2. Print the Screen Click the “Print Screen” command from “File(F)” menu and set values in the pop-up dialogue box. Click “OK(O)” to print the current screen display. 9.2. Output the Analysis Result 9.2.1. Export the Data to the Database Open the analysis result document that need to be exported; Click “Data Export(D)” from “File(F)” menu after analysis is over; Select the database file needed to be imported from the dialog box or newly-build file; Click “Open(O)” to finish exporting the analysis data. When there are records with the same file name in the database file, the system will pop up a dialog box for selecting “Add Record Mode”. 1) Select “Save as a new record”; Click “OK(O)” and it brings up a dialog box of selecting “Save Analyzing Result File As …”; Save the analyzing result file needed to be exported under another file name; Click “Save(S)” to finish the data export. 2) Select “Overwrite the original records”; Click “OK (O)” and the record with the same file name in the database file will be covered. Select “Append the record directly”; Click “OK (O)” and the former record in database file will exist with added record together. Note: The contents of Report Data Item in the database are the data of analysis result file exported. 64 Line-gene K Fluorescence Quantitative PCR Detection System Print, Output and Inquiry to the Results of the Absolute Quantification and SNP Modules 9.2.2. Export Data to EXCEL Open the analysis result file to be exported. After the analysis is over, click “Export data to EXCEL(X) ” from “File(F)” menu, thus the setting parameters, sample information, the fluorescence detecting data and the calculated result of the analysis file can be exported to an EXCEL file, which is helpful for the user to carry on the analysis for the second time. 9.3. Data Query Click “Data Query (U)” from “File (F)” menu and the system will show you a data Query system interface. Click the main shortcut key of Query data to switch to the Query data system template. 9.3.1. Open the database Click “Open Database (P)” from “File (F)” menu and then open the selected database file in the dialog box. 9.3.2. Data Query Click “List All Records”, thus the system will list all records. Query with some conditions: Select the Query items and enter the contents (multiple choices); Click “Query”, thus the system will list the records according to the Query terms. Click “Clear Condition”, thus the Query terms will go back to the original default state. 65 Line-gene K Fluorescence Quantitative PCR Detection System Print, Output and Inquiry to the Results of the Absolute Quantification and SNP Modules 9.3.3. Print Query result Standard Print: Click the “Standard Print” from the “File (F)” menu, and then carry on the printing setup and operation in the pop-up interface. Standard printing is the fixed form. Excel Print: Click “Excel Temp. Setup” and input reporting form name and set items that need to be printed. After finishing the Excel template setting, click “Excel Print” from “File (F)” menu; the system will operate automatically Microsoft Excel program and export the needed printing contents into the Excel file form, which can be edited before printing. Chapter 10 Relative Quantification Module 10.1. Introduction 10.1.1. Relative Quantification Definition 66 Relative Quantification Module Line-gene K Fluorescence Quantitative PCR Detection System Simultaneous test a housekeeping gene (HKG) together with the gene of interest(GOI).Compare the expression level of the gene of interest (GOI) and housekeeping gene (HKG )to get a normalized value. Then compare the specific control sample with different samples, and then get a relative expression coefficient to identify the expression diversity of target gene of different samples or the gene expression diversity in different time. 10.1.2. Analysis Methods 1) Relative Standard Curve Method: User can use absolute standard, or relatively standard and the relative standard goods in the lab is more user-friendly. 2) Comparative Delta-Delta Ct method: This method for direct examination relative quantification is based on several assumptions. A. All PCR efficiency from different samples sources are the same. B. All PCR efficiency of different sequence template are the same. C. All PCR efficiency in different process cycle are the same. D.All above PCR process efficiency are the ideal 100%. 10.1.3. Application Gene expression analysis(quantify mRNA) 10.1.4. Comparison of Absolute Quantitative Method Quantitative Method and Relative Absolute Quantification Relative Quantification Obtain the absolute quantity of the Simultaneous test a housekeeping gene (HKG) target gene, to reflect the gene together with the gene of interest (GOI).Compare expression differences directly. the expression level of the gene of interest (GOI) and housekeeping gene (HKG) to get a normalized Definition value; Then compare the specific control sample with different samples, then get a relative expression coefficient to identify the expression diversity of target gene of different samples or the gene expression diversity in different time. Advantag e 1)Better CT value reproducibility More simple, economical, reliable and accurate 2)No inner control requirement than the absolute quantification in gene expression studies 1)Time-consuming Drawback laborious to 1) Must have housekeeping gene produce a series of dilution 2) Can not give the absolute quantity standard 3) Difficult to control inner-scalar 2)Difficult to preserve the standard 67 Line-gene K Fluorescence Quantitative PCR Detection System Relative Quantification Module stably 3)User can’t test more samples within the single-batch 10.2. Relative Quantification Setup 10.2.1. Setup of Relative Quantification PCR Procedure The setup of relative quantification PCR procedure is the same as absolute quantification module, but no “melt curve” segment setup. Please refer to Section9 of Charter 5. 10.2.2. Setup of Relative Quantification PCR Analysis 10.2.2.1. Definition of Single-Tube Comparison and Double-Tube Comparison Single-Tube Comparison: the Single-Tube Comparison, means GOI (genes) and HKG (housekeeping genes) doing the quantitative analysis in the same PCR reaction tube. Double-Tube Comparison: the Double-Tube Comparison, means GOI (genes) and HKG (housekeeping genes) doing the quantitative comparative analysis in different PCR reaction tube. 10.2.2.2. Selection of Single-Tube Comparison and Double-Tube Comparison Click the corresponding comparison method in the procedure setup interface. The default method is Single-Tube Comparison. 68 Line-gene K Fluorescence Quantitative PCR Detection System Relative Quantification Module Figure 10-1 10.2.2.3. Setup of Analysis of Single-Tube Comparison Click relative quantification on the main interface, thus the relative analysis setup interface emerges as below. Figure 10-2 69 Line-gene K Fluorescence Quantitative PCR Detection System Relative Quantification Module Including 4 parts: (1) Fluorescence setup, which means to set fluorescence corresponding to GOI and HKG Firstly, select all the fluorescence used in this test in the setup procedure interface. Then select the fluorescence corresponding to GOI and HKG in the relative quantitative fluorescence interface setup column. If there are groups of GOI and HKG (maximum 3 is permitted), user need to choose the corresponding fluorescence in each group of GOI and HKG. (2) Comparison option, which is planning to select which pair of the GOI and HKG to analyze. After setting fluorescence, HKG and GOI will be automatically added to the drop-down list of the comparison option, user just needs to click the drop-down list box to choose. Note: The contrastive GOI and HKG should be corresponding to different fluorescence. (3) Customized Comparison Wells Select interested PCR tubes in 48 wells to analyze. Click the “Customized Comparison Wells” button, the dialog box which is divided into three regions will pop up as follows: Latency section…..To display 48 wells for choice. Target section……Users will drag the selected wells to the target areas for analysis. Info section…To prompt the user’s operation, tell user which manipulation has been done. Latency section Target section Info section Figure 10-3 Definition of the operation of a comparison well: The first step: Click the well you want to analyse in the latency section by left key of mouse, like of “A1” will turn into dark blue , show that “A1” is pitched on. 70 . The circle Relative Quantification Module Line-gene K Fluorescence Quantitative PCR Detection System Figure 10-4 The second step: Loose the mouse, then click “A1” again by left key of mouse (Note: Please don’t loose the left key this time). The circle of “A1” becomes to the green thin dotted line . Figure 10-5 The third step: Drag the mouse to the corresponding round center, and then loose the left mouse button. This place displays , to show that the user-define “A1” comparison succeed. This time the “A1” circle in the latency section turns to red real line , to show that “A1” is already been selected, which can’t be selected again. Info section display: "You have chosen a well: A1”. 71 Line-gene K Fluorescence Quantitative PCR Detection System Relative Quantification Module Figure 10-6 Definition of the operation of repeated well: The first step: Press the Ctrl key in the latency section, then click the wells you want to repeat, like “A1”, “A2”. Here their circles will became dark blue, to show that “A1”, “A2”are selected. Figure 10-7 The second step: Loosen the left mouse button and the Ctrl key, then use the left mouse button to click arbitrary region of the "A1" or "A2" circle. Do not release the left mouse button at this time. "A1" and "A2" circles turn into the small green dotted line. 72 Relative Quantification Module Line-gene K Fluorescence Quantitative PCR Detection System Figure 10-8 The third step: Drag the mouse to the corresponding round center, and then loose the left mouse button. This place displays “G1”, means group one, to show the definition of "A1" and "A2" to repeat in comparison. time the “A1” “A2” circle in the latency section turn to red real line This , showing that “A1” “A2” have already been selected, which can’t be selected again. Suggest areas in the information displayed: "You have chosen a group of wells-G1:A1, A2". Figure 10-9 Operation method to define a number of comparison-wells in one time: The first step: Press the Ctrl key in the latency section, then click the wells you want to compare, like “A1”, “A2”, Here their circles will became dark blue, to show that “A1”, “A2”are selected. 73 Line-gene K Fluorescence Quantitative PCR Detection System The second step: Relative Quantification Module Loosen the left mouse button and the Ctrl key, then use the left mouse button to click arbitrary region of the "A1" or "A2" Circle. Please do not release the left mouse button at this time. "A1" and "A2" circle turn into the small green dotted line. The third step: Drag the mouse to the corresponding round center. Press the Shift key first then loose the left mouse button, then loose the Shift key. This place displays“G1”, means group one, to show the definition of "A1" and "A2" to participate in comparison. This time the “A1” “A2” circles in the latency section turn to red real line , showing that “A1” “A2”are already been selected. Suggest areas in the information displayed: "You have chosen A1, A2". Figure 10-10 Operation method to cancel defined comparison-well: The first step: Click the wells you want to cancel in the latency section, like “A1”. Here their circles will become dark blue, to show comparison-wells have been selected. Figure 10-11 74 Line-gene K Fluorescence Quantitative PCR Detection System Relative Quantification Module The second step: Click “Clear” button, the name of defined comparison-holes disappears, the green line of cylindrical area reverts to the red line (Figure 10-12); Meanwhile the cylindrical thick red solid lines of "A1" (they have already been selected, which can’t be defined again) into a small red solid lines (not selected, can be defined. At the same time, information suggested column shows: "You have cancelled a well: A1” Figure 10-12 Operation method to cancel all defined comparison-wells: Click “Clear All”button, to remove all the defined wells. The method to choose the Auto-range Comparison Wells: Click the “Auto-range”button, to self-define the Comparison Wells as showed below: Figure 10-13 75 Line-gene K Fluorescence Quantitative PCR Detection System Relative Quantification Module (4) Input and setup sample information: After the definition of the Comparison Wells, click “OK” to input the sample information. The interface after selecting auto-range in comparison appears as follows: Figure 10-14 Input the user-defined sample names in the "Sample" column. Click the "Color" column cell, choose the color you want in the pop-up palette, thus to set the color of the compared wells. Double-click “Property “column cell, thus a drop-down list box appears. To choose the wells attributes through the drop-down list box: "unknown", "standard" or “calibrator". Note: A comparative quantitative analysis has only one calibrator. Input the corresponding standard concentration in the “GOI standard” and “HKG standard” column. Input the user-defined remark information in the “Note” column. 10.2.2.4. Analysis setup in the Double-Tube Comparison In the setup program interface, choose the Double-Tube Comparison, then click relative quantification, thus the analysis setup interface appears. 76 Line-gene K Fluorescence Quantitative PCR Detection System Relative Quantification Module Figure 10-15 The setup of Double-Tube Comparison includes four parts. Dye selection setup is the same as the comparison setup and the Single-Tube Comparison refer to the setup illumination of Single-Tube Comparison. Hereinafter is the introduction of different parts. (1) Setup of Customized Comparison Wells After the setup of Dye selection and comparative selection, click the Customized Comparison Wells setup, thus the pop-up window appears as below: Latency section GOI Placed HKG Placed District District GOI Placed HKG Placed District District Info section Figure10-16 77 Line-gene K Fluorescence Quantitative PCR Detection System Relative Quantification Module The explanation to define one comparative well, define multi-comparison wells in one time, define one repetition well, cancel one defined comparison well, cancel all defined comparison wells, select auto-define comparison wells, the manipulation are the same as the Single-Tube Comparison, which can refer to the explanation of Single-Tube Comparison part. Attention: GOI and HKG are the one-to-one correspondence relationship. So when choose to place a well-in GOI zone, the corresponding fraction of the bottom line must be placed with a HKG counterpart. Without matching, it will eject a prompt dialog box when click the “Enter”. The figure below is the pop-up dialog box when no matching with"B3" Figure 10-17 (2) Input sample information Click the Auto-range, thus pop-up the input interface of sample info appears. Figure 10-18 As indicated above, A1, B1, respectively for the same sample of GOI and HKG, have the names and properties of the same samples. Input all necessary information, thus to complete the recording of information. 78 Line-gene K Fluorescence Quantitative PCR Detection System Relative Quantification Module 10.3. Relatively Quantification Operation Operate after the PCR procedures setup and the Single-Tube / Double-Tube Comparison selection. Just like the absolute quantification and SNP function module, single click “Operate Procedures (R)”in the “File(F)”menu, or click the Shortcut button " " , the procedure will run. Relative quantification analysis setup can be done before or after the operation. If there is real time detection program, real time sample date will be showed in the main interface after the program running; even if the last running is melting curve detection program as showed in below picture. Quantitative samples 10.4. Relative Quantification analysis and results 10.4.1. Relative Quantification results After finishing the procedures, the system will eject a pop-up window to preserve the results, as showed in the Figure below: 79 Line-gene K Fluorescence Quantitative PCR Detection System Relative Quantification Module Figure10-19 10.4.2. Relative Quantification Analysis Steps 10.4.2.1. 2-ΔΔCt Method The first step: After preserving the results, click the relative quantitative interface, and select the GOI HKG corresponding fluorescence, to complete setup of current comparison selection and the Customized Comparison Wells. By choosing 2-ΔΔCt method, click the “Start Analysis” button, to enter the relative quantification analysis interface, as showed in the Figure below: Figure 10-20 The second step: Do the absolute quantification analysis of GOI. Click GOI first, and then do absolute quantification analysis. Analytical methods and absolute quantification analysis method is the same, as showed in the figure below: 80 Line-gene K Fluorescence Quantitative PCR Detection System Relative Quantification Module Figure 10-21 The third step: Do the absolute quantification analysis of HKG. Click GOI first, and then do absolute quantification analysis. Analytical methods and absolute quantification analysis method are the same, as showed in Figure 10-22. Click the “Maximized Form” button, user can observe the detailed analysis results in the Figure 10-23 Figure 10-22 81 Line-gene K Fluorescence Quantitative PCR Detection System Relative Quantification Module Figure 10-23 Note: Wells-B2 and B3 as a repeat well in G1 composition analysis, the HKG gene 22.62 Ct value gained is the average result of the two wells. The fourth step: If the GOI and HKG both have the analyzed results, click the "relative quantification" button to access to the relative quantification analysis, as showed in the Figure 10-24. Click the “Maximized Form” button, user can observe the detailed analysis results in the Figure 10-25 Figure 10-24 Figure 10-25 If the relative quantification analysis of the results is not satisfactory, user can click the "Back" button to return to the relative quantification’s second, third steps, to redo the absolute quantitative analysis of the GOI and HKG 82 Line-gene K Fluorescence Quantitative PCR Detection System Relative Quantification Module respectively. Note: At this time all the data of GOI and HKG and relative quantification analysis will lose, please operate carefully. After the first analysis, if user ready to re-elect a new GOI and HKG to analyze, please go to the relative quantitative results interface and click the " back" twice continuously to return to the relative quantification analysis setup interface. Re-analyze in accordance with the above steps. 10.4.2.2. Relative Standard Curve Method The first step: After preserving the results, click the relative quantitative interface, and select GOI and HKG corresponding fluorescence, complete the current comparison selection and Customized Comparison Wells setup and choose Relative Standard Curve Method, then click the "Start Analysis" button, to enter the relative quantification analysis interface, as showed in the Figure below. Figure 10-26 The second step: Do the absolute quantification analysis of GOI. Click GOI first, and then do absolute quantification analysis. Analytical methods and quantitative analysis method are the same, as illustrated. Note: through Ctrl-left mouse button to choose the criteria wells (cell wallpaper turns Blue), then the quantification analysis can be carried out. 83 Line-gene K Fluorescence Quantitative PCR Detection System Relative Quantification Module Figure 10-27 The third step: Do quantitative analysis of HKG. Click HKG first, and then do absolute quantification analysis. Analytical method and quantitative analysis method are the same, as showed in the Figure 10-28. Note: through Ctrl-left mouse button to select criteria wells (cell wallpaper turns Blue), the quantitative analysis can be carried out. Click the "Maximized Form" button, user can observe the detailed analysis of results in the figure 10-29. Figure 10-28 84 Line-gene K Fluorescence Quantitative PCR Detection System Relative Quantification Module Figure 10-29 The fourth step: If the GOI and HKG both have the analysis results, click the "Relative Quantification" button to access to the relative quantitative analysis, as showed in the Figure 10-30. Click the "Maximized Form" button, user can observe the detailed analysis results in the figure 10-31. Figure 10-30 Figure 10-31 85 Relative Quantification Module Line-gene K Fluorescence Quantitative PCR Detection System Note : Standard wells cannot give the relative quantitative results; In the Figure 10-30, the relative quantification column of red "Ⅰ" sign represent the relative standard partial coefficient difference which are evocable by repeat wells. 10.5. Introduction and Steps of Melting Curve Analysis The user can set “Melting Curve” program through “ ”in the setting interface. After setting compared parameters of relative quantitation, the sample names of relative quantitation can be refected from corresponding wells in the melting curve. The user can contrast the main interfaces of relative quantitation and melting curve as showed below. Relative quantitative main interface Melting Curve main interface 86 Line-gene K Fluorescence Quantitative PCR Detection System Relative Quantification Module The analysis of melting curve of relative quantitation is the same as that of absolute quantitation, please refer to Chapter 7, 7.7. 10.6. To Save Analysis Result 10.6.1. To Save Analysis Data It is the same way to save analysis data of melting curve of relative quantitation is the same as that of absolute quantitation , please refer to Chapter 7, 7.8. 10.6.2. To Save Analysis Curve There are two sub-menus “Capture Flr-Temp Curves (B) ” and“ Capture Deriv-Temp Curves (D)” in “File” menu, the user can save the analysis curve in *.jpg format according to clients’ request. Click “Capture Flr-Temp Curves (B)”, the following dialog box will appear. The user can rename the file name and save path that saved in the dialog box, click save, and thus the fluorescence-temper curve will be as follows. In the same way, click “Capture Deriv-Temp Curves (D)”, the curve will as follows after saving: 87 Line-gene K Fluorescence Quantitative PCR Detection System Relative Quantification Module 10.7. Import and Export Relative Quantification Data 10.7.1. Import and Export Relatively Quantitative Document Import: After entering into the system, choose the relative quantification module to enter into the quantitative main interface. Click the menu → "document" → "Import", pop-up the following dialog box: Figure 10-32 After selecting corresponding documents, just click it to open. Export: Access to the system, then chooses the relative quantification module to enter into the quantitative main interface. Click the menu → "document" → "export", pop-up the following dialog box: Figure 10-33 Input the corresponding file name in the “File Name” column, click the "Save" button. 10.7.2. Export relative quantification data 10.7.2.1. Export to EXCEL Click the menu "Document" → " Export Data to Excel", the results can be exported to Excel, as showed in the Figure 10-34,10-35 (2-ΔΔCt method) and the Figure 10-36, 10-37 (Relative Standard Curve Method) below: 88 Line-gene K Fluorescence Quantitative PCR Detection System Figure 10-34 Figure10-35 Figure10-36 89 Relative Quantification Module Line-gene K Fluorescence Quantitative PCR Detection System Relative Quantification Module Figure 10-37 10.7.2.2. Export to ACCESS Database When relative quantification analysis completed, a relatively quantification column fig appears. Click the menu "Document" → "Export Data to the Database," the following dialog box pop-up. Enter a new name in the “File Name”, then click "Open" and the analysis results can be exported to database. 10.7.3. To export Melting Curve Data Click “File” → “Export to excel”, thus the analysis result can be exported to Excel as showed in following picture: 90 Line-gene K Fluorescence Quantitative PCR Detection System Relative Quantification Module 10.8. Query and Print of Relative Quantitative Data 10.8.1. Relative Quantitative Data Query After relative quantitative analysis finished, if data has been exported to database, click “Data Query (U)” from “File (F)”, it will show data enquire system interface, or just click data enquire shortcut key, the system will also shift to data enquire interface. Figure 10-38 Currently there are four pieces of inquiries as testing name, user name, sample name, and the proof-test date. The inquiries method and absolute quantification, SNP module are the same. 10.8.2. EXCEL Template Setup of Relative Quantitative Data Click the "Excel Template Setup” in the query interface, the window below pop-up. The setting methods are the same with absolute quantification and SNP module. 91 Line-gene K Fluorescence Quantitative PCR Detection System Relative Quantification Module Figure 10-39 10.8.3. Excel Print of Relative Quantification Data Click the "Excel Print" in query interface. The current recorded inquiries can be export to Excel by choosing columns of dialog box in the Figure 10-39, as showed in the Figure below: Figure 10-40 10.8.4. Criteria Print the Relative Quantitative Data Relative quantitative standards print can print the following columns of current inquiries: "Analysis method", "SN" "GOI standard", "HKG standard" "GOI Ct", "HKG Ct" "relative coefficient," "2^-Delta-Delta Ct", as shoed in the following Figure: 92 Line-gene K Fluorescence Quantitative PCR Detection System Fig10-41 93 Relative Quantification Module Line-gene K Fluorescence Quantitative PCR Detection System Maintenance Chapter 11 Maintenance 11.1. Time Cleaning It is recommended to clean the instrument periodically to ensure normal operation and detection. Clean the surface: Use soft dishcloth; Dip some alcohol, distilled water or cleanser to clean if necessary. Clean the wells of block: Use the brush and soft dishcloth; Dip some alcohol or distilled water to clean if necessary. Warning! Please turn off power during cleaning. It’s forbidden to drop cleanser into taper hole during cleaning. It’s forbidden to clean the surface with caustic cleanser. 11.2. Software's Upgrade to The Mainbody Software of instrument can be upgraded by computer through RS232 connection. Process in the following: 1) Turn the upgrade switch in the back of instrument to the right, turn on the power and connect RS232 connection wire. 2) Open Line-Gene K software, select “absolute quantification” module, and in this interface, click “Firmware Upgrade (F)” from the system parameter menu. 3) In the pop-up dialog box: Select the serial port which connect the instrument and computer; Click “Load” to select upgrade software (*.bin), which can be gotten from BIOER’s website or 94 Maintenance Line-gene K Fluorescence Quantitative PCR Detection System from After-service Department; Press “Start” to upgrade and the finish interface will pop-up after finishing upgrade; Press “Exit”. Turn the upgrade switch in the back of instrument to the left, thus to achieve software upgrade. 11.3. Malfunction Analysis and Treatment No. Fault Cause Have abnormal noise 1 during running for the first time 2 System shows “Password Error” Remedy The fixtures haven’t removed yet. The password input is wrong or press “Cancel” in the password input interface. Power has not been turned 3 Exit the interface, press “Run” again and input the correct password. Check the power supply and turn on it. After power on, the on. power indicator light is Fuse breaks down Change the fuse (250V, 5A, Φ5×20) not bright. Damage of the switch Change the switch Others Contact distributor or the manufacturer Bad contact of connection line Check connection lines and switch on it or or damage of the line. change it In detecting the position of sample, the 4 Remove the fixtures. step work, failed. motor doesn’t communication The power supply is not turned on, or is turned on Power on, and restart the program after the running of program. Damage of step motor or driver Contact distributor or the manufacturer Switch off the power and then switch on it Lock of step motor again, if the trouble still exists, contact distributor or the manufacturer 95 Maintenance Line-gene K Fluorescence Quantitative PCR Detection System After 5 finishing detection of sample position, the actual temperature display is 0 Damage of temperature sensor in the module Turn on the power supply and restart the The power supply is turned on after running program C or 100 C The ventiduct is blocked The module’s heating and 6 cooling speed slow down obviously or its program temperature cannot be controlled The connecting line is loose Failure radiator The fan is damaged or not running Damage properly Clean the ventiduct of Contact distributor or the manufacturer temperature sensor 7 The module is neither heating nor cooling The 8 hotlid is The fan is damaged or not running Contact distributor or the manufacture Damage of all the radiators not heating Loose of the connectors Damage of heating elements in the hotlid Damage of Contact distributor or the manufacturer temperature sensor in the hotlid The discrepancy fluorescence 9 of value among each well is Pollution of wells or hotlid Cleaning. increased.(without test tube in the well) The strong irradiation of the 10 outside light source fluorescence value The hotlid is open during Close the hotlid. (The detection results running maybe not true) Damage of the photoelectric system NOTE: Shut down the outside light source. Abnormal Contact distributor or the manufacturer During the warranty period, users are forbidden to open instrument to check. If the instrument meets trouble and need to be open for check, please contact distributor or the manufacture. 96 Appendix Line-gene K Fluorescence Quantitative PCR Detection System Appendix: FQD-48A mode Quantitative PCR Detection System's electric wiring diagram U27 MOTOR_DRIVER B BDD DPSW VV+ A+ AB+ B- PUL DIR OPTO ENA Y EL ORG U33 MOTOR_DRIVER RED BLU WHT BRN J8-4 J8-3 J8-2 J8-1 CPX DIRX ENA 5V J16-4 J16-3 J16-2 J16-1 J7-1 J7-2 J6-1 J6-2 HV+ HV- CPY DIRY ENA 5V GND HX0 GND S+ U26 OPTIC-COUPLE J12-4 J12-3 J12-2 J12-1 U28 OPTIC-COUPLE A A- C NO U30 OPTIC-COUPLE LED+ LEDU29 DOOR-CONTROL SW CC U32 OPTIC-COUPLE B BDD 1 2 1 2 1 2 LED+ LED- C E LED+ LED- C E LED+ LED- C E LED+ LED- C E LED+ LED- C E 3 4 3 4 FRONT BACK 3 4 DOWN1 3 4 DOWN2 3 4 UP 42HS03 U31 MOTOR BLK GRN JTAG[1..20] U23 OPTIC-COUPLE J11-4 J11-3 J11-2 J11-1 J13-1 J13-2 S+ J13-3 GND J13-4 HY02 GND WHT BRN CC GND HX1 GND S+ J14-1 J14-2 S+ J14-3 GND J14-4 HY01 GND RED BLU J2 A A- J15-1 J15-2 S+ J15-3 GND J15-4 HY1 GND DPSW VV+ A+ AB+ B- PUL DIR OPTO ENA Y EL ORG J5-1 J5-2 ON/OFF J5-3 GND J5-4 LED 5V BLK GRN J4-3 J4-2 VCC J4-1 ON_C OFF_C U25 MOTOR HV+ HV- HV+ HV- J1-1 J1-2 U24 BY Q5009041_AUTOLID_CONTROLBOARD 1 2 1 2 42HS03 OFF ON VCC HV+ HV- AOTO LID ONLY PE HOTLID BASE PLATE LIDLID+ SEN-lid GND J1-1 J1-2 J1-3 J1-4 1 2 SEN SEN HEATERHEATER+ U34 BY Q500904200000_HOTLID LED+ GND LED+ LED- C E 3 4 U35 OPTIC-COUPLE OPEN LID SENSOR OPEN GND 97 Appendix Line-gene K Fluorescence Quantitative PCR Detection System J3_CH1-3 J3_CH1-2 J3_CH1-1 TEM M TE+ U14 BY Q05091020_UPDATE_BOARD HVNC HV+ J29 MJ7-2 MJ7-1 MJ9-2 MJ9-1 MJ5-3 MJ5-2 MJ5-1 C CAA J38 J25-4 J25-3 J25-2 J25-1 J37-5 J37-4 J37-3 J37-2 J37-1 VCC OFF ORG Y EL J32-8 J32-7 J32-6 J32-5 J32-4 J32-3 J32-2 J32-1 ENAENA+ DIRDIR+ PULPUL+ BLU RED DIPSW-SET U19 MOTER DRIVER CS_power[1..26] NC +5VIN GND GND SDIR +5V SPLUS +5V SCAN[1..10] GND FDIR +5V FPLUSE +5V 2[1..26] SW_A SW_B SW_C SW_D GND V_LED+ GND OPEN SEN GND OPEN DOOR FAULT RUN STATUS GND +5V +5V GND +5V CLOSE +5V OPEN +5V GND IN UPDATE GND VCC VCC 40008_CPU_JTAG[1..20] GND TX RX GND J23 GRN BLK SEN-heatsink SJ3 GND J22-3 J22-2 J22-1 SEN-lid GND J24-3 J24-2 J24-1 SEN-right GND J20-3 J20-2 J20-1 SEN-middle GND ORG Y EL GRN BLK U22 E04SR150718 OUTPUT: DC24V ENAENA+ DIRDIR+ PULPUL+ BLU RED HV+ HV+ HV+ HV+ HVHVHVHV- J19-3 J19-2 J19-1 12 13 14 15 CPU[1..26] VD2 VE2 COM VREF VCONT COM COM ANODEIN SEN-lef t GND SJ1-1 SJ1-2 SJ1-3 SJ1-4 SJ1-5 SJ1-6 SJ1-7 SJ1-8 1 3 5 7 LED+ LED+ LED+ LED+ LEDLEDLEDLED- 2 4 6 8 SJ2 SJ5-1 SJ5-2 SJ5-3 SJ5-4 SJ5-5 SJ5-6 1 2 3 SJ4-2 SJ4-1 6 7 4 5 VCC VEE GND VREF VCONTROL ANODEOUT GND U6 PMT sensor J17-5 J17-4 J17-3 J17-2 J17-1 J11 ORIGIN +S DC24V+ DC24V+ DC24V+ DC24VDC24VDC24V-S HJ1[1..10] J18-5 J18-4 J18-3 J18-2 J18-1 U12 BY Q5009011_SCAN BOARD SCAN HJ2-1 HJ2-2 HJ2-3 HJ2-4 HJ2-5 HJ2-6 HJ2-7 HJ2-8 J39-5 J39-4 J39-3 J39-2 J39-1 J15-6 J15-5 J15-4 J15-3 J15-2 J15-1 DJ1-5 DJ1-4 DJ1-3 DJ1-2 DJ1-1 J16-3 J16-2 J16-1 FAULT LID RUN POW VCC VCC OUT HALL GND GND A B CODE C D U13 BY Q50090721_FILTER board U17 BY Q5009120_DISPLAY BOARD J3 FUSE1 250V8A U37 POWER SUPPLY SP-500-24 8 9 10 11 LED1+ LED1LED2+ LED2LED3+ LED3LED4+ VE2 TEST[1..16] U21 MOTER DRIVER BRN WHT BB+ AA+ V+ V- BB HV+ ON BRN WHT U20 FILTER MOTOR D D- J31-3 J31-2 J31-1 To lid controler DIPSW-SET AA U11 DCFAN U15 E04SR150718 BB+ AA+ V+ V- 42HS03 C C- HV- FANFAN+ LED+ GND OPEN GND J3 J4 U18 SCAN MOTOR BB 2 1 J23-3 J23-2 J23-1 U10 BY Q5009051_CPU BOARD To openlid sensor PE D D- U8 DCFAN FANFAN+ SEN_lef t GND GND D[1..40] 2 1 MJ8-2 MJ8-1 J3 J4 U16 BY Q05091020_RS232C_BOARD J2 COM_PORT_8P CN CN HV2HV2+ MJ12-2 MJ12-1 U7 DCFAN FANFAN+ U4 LED*4 LIGHTSOURCE U3 BY Q5009080_OPTIC BOARD D[1..40] CN CN DRIVERHV2+ HVM HV+ J4_CH1-4 J4_CH1-3 J4_CH1-2 J4_CH1-1 UPDATE DRIVERHV2+ OH HVOH HV- 2 1 U42 MF5E103 B3900 0.5% 2 1 S S J24 HV+ FRONT FAN HV2+ MJ11-2 MJ11-1 U88_CPLD_JTAG[1..10] TEM M TE+ J2_CH1-1 J2_CH1-2 J2_CH1-3 J2_CH1-4 HV- FAN HV2+ SEN_middle GND GND Temperture sensor J33 J4_CH2-4 J4_CH2-3 J4_CH2-2 J4_CH2-1 U9 BY Q5009021_BLOCK MJ3-A1 TE12 MJ3-A2 TE9 MJ3-A3 TE8 MJ3-A4 TE11 MJ3-B1 OH MJ3-B2 OH MJ3-B3 TE7 MJ3-B4 TE10 MJ2 HVM HV+ LIDLID+ HVHV+ CTRL[1..40] J3_CH2-3 J3_CH2-2 J3_CH2-1 MJ10-4 MJ10-3 MJ10-2 MJ10-1 SEN_right GND GND J21-3 J21-2 J21-1 J34 HV+ LIDLID+ HVHV+ SEN_lid GND GND J35 HV- OH HVOH HV- MJ6-5 MJ6-4 MJ6-3 MJ6-2 MJ6-1 J1 J2_CH2-1 J2_CH2-2 J2_CH2-3 J2_CH2-4 -12V GND +12V CPU0V CPU+5V +12V GND -12V J36 TEM M TE+ J36-3 J36-2 J36-1 1-2_LIGHT_LCD[1..14] J4_CH3-4 J4_CH3-3 J4_CH3-2 J4_CH3-1 SEN-heatsink SEN-right SEN-middle SEN-lef t GND GND GND GND MJ2[1..26] HVM HV+ SEN_heatsink GND GND U89_CPLD_JTAG[1..10] J3_CH3-3 J3_CH3-2 J3_CH3-1 SEN_env ironment GND GND CTRL[1..40] HV+ J1_CH1 MJ1 J1_CH1[1..10] MJ1[1..10] MJ2-A1 MJ2-A2 MJ2-A3 MJ2-A4 MJ2-B1 MJ2-B2 MJ2-B3 MJ2-B4 HV- OH HVOH HV- J1_CH2 MJ2 J1_CH2[1..10] MJ3[1..10] RT4 RT3 RT2 RT1 RT4 RT3 RT2 RT1 J2_CH3-1 J2_CH3-2 J2_CH3-3 J2_CH3-4 J1_CH3 MJ3 J1_CH3[1..10] MJ4[1..10] U5 BY Q5009022_BLOCK BACK MJ1-A1 TE6 MJ1-A2 TE3 MJ1-A3 TE2 MJ1-A4 TE5 MJ1-B1 OH MJ1-B2 OH MJ1-B3 TE1 MJ1-B4 TE4 U2 BY Q50090502_AD BOARD RT U1 BY Q500906_CS POWER BOARD ACL ACN PE NC NC R.C G R.C FUSE 1 2 3 FUSE FUSE2 250V8A 4 5 6 7 FUSE PE PE FUSE U36 INLET U39 SWITCH L C1 NO1 E C2 NO2 N L E N U40 74271131_3turns INPUT: AC100-240V 50-60Hz 98 42HS03 Hangzhou Bioer Technology Co., Ltd. Add:1192 Bin An Rd, Hi-tech (Binjiang) District, Hangzhou, 310053, P.R. China P.C.: 310053 Tel.:+86-571-87774575 After sale service Tel.:87774558 Fax:+86-571-87774553 After sale service Fax:87774559 E-mail:[email protected] service line:800-857-1279 www.bioer.com.cn Shanghai International Holding Corp. GmbH(Europe) Dimdi No.: DE/0000040627 Add: Eiffestrasse 80, 20537 Hamburg,Germany Tel: +49-40-2513175 Fax: +49-40-255726 E-mail: [email protected]


![VFC-2000取扱説明書[PDF:3.3MB]](http://vs1.manualzilla.com/store/data/006610633_2-a5dfaf6a6d969ff09e69ca83b1500e45-150x150.png)