1
Red Hat Developer Toolset 2.x
User Guide
Installing and Using Red Hat Developer Toolset
Edition 1
Jaromír Hradílek
Matt Newsome
Jaromír Hradílek
Jacquelynn East
Red Hat Developer Toolset 2.x User Guide
Installing and Using Red Hat Developer Toolset
Edition 1
Jaromír Hradílek
Red Hat Engineering Cont ent Services
jhradilek@redhat .com
Jacquelynn East
Red Hat Engineering Cont ent Services
jeast @redhat .com
Mat t Newsome
Red Hat Sof t ware Engineering
mnewsome@redhat .com
Legal Notice
Copyright 2013 Red Hat, Inc. This document is licensed by Red Hat under the Creative Commons
Attribution-ShareAlike 3.0 Unported License. If you distribute this document, or a modified version of it,
you must provide attribution to Red Hat, Inc. and provide a link to the original. If the document is modified,
all Red Hat trademarks must be removed. Red Hat, as the licensor of this document, waives the right to
enforce, and agrees not to assert, Section 4d of CC-BY-SA to the fullest extent permitted by applicable
law. Red Hat, Red Hat Enterprise Linux, the Shadowman logo, JBoss, MetaMatrix, Fedora, the Infinity Logo,
and RHCE are trademarks of Red Hat, Inc., registered in the United States and other countries. Linux is
the registered trademark of Linus Torvalds in the United States and other countries. Java is a registered
trademark of Oracle and/or its affiliates. XFS is a trademark of Silicon Graphics International Corp. or its
subsidiaries in the United States and/or other countries. MySQL is a registered trademark of MySQL AB
in the United States, the European Union and other countries. Node.js is an official trademark of Joyent.
Red Hat Software Collections is not formally related to or endorsed by the official Joyent Node.js open
source or commercial project. The OpenStack Word Mark and OpenStack Logo are either registered
trademarks/service marks or trademarks/service marks of the OpenStack Foundation, in the United
States and other countries and are used with the OpenStack Foundation's permission. We are not
affiliated with, endorsed or sponsored by the OpenStack Foundation, or the OpenStack community. All
other trademarks are the property of their respective owners.
Keywords
Abstract
Red Hat Developer Toolset is a Red Hat offering for developers on the Red Hat Enterprise Linux platform.
The Red Hat Developer Toolset User Guide provides an overview of this product, explains how to invoke
and use the Developer Toolset versions of the tools, and links to resources with more in-depth
information.
Table of Contents
Table of Contents
.Preface
. . . . . . . . . . . . . . . . . . . . . . . . . . . . . . . . . . . . . . . . . . . . . . . . . . . . . . . . . . . . . . . . . . . . . . . . . . . . . . . . . . . . . . . . . . .8. . . . . . . . . .
1. Document Conventions
8
1.1. T ypographic Conventions
8
1.2. Pull-quote Conventions
9
1.3. Notes and Warnings
10
2. Getting Help and Giving Feedback
10
2.1. Do You Need Help?
10
2.2. We Need Feedback
11
. . . . . I.
Part
. . Introduction
. . . . . . . . . . . . . . . . . . . . . . . . . . . . . . . . . . . . . . . . . . . . . . . . . . . . . . . . . . . . . . . . . . . . . . . . . . . . . . . . . . . .12
...........
.Chapter
. . . . . . . . 1.
. . .Red
. . . . Hat
. . . . .Developer
. . . . . . . . . . .T. oolset
. . . . . . . . . . . . . . . . . . . . . . . . . . . . . . . . . . . . . . . . . . . . . . . . . . . . . . . . . .13
...........
1.1. About Red Hat Developer T oolset
13
1.2. Main Features
14
1.3. Compatibility
15
1.4. Getting Access to Red Hat Developer T oolset
16
1.4.1. Using RHN Classic
17
1.4.2. Using Red Hat Subscription Management
17
1.5. Installing Red Hat Developer T oolset
18
1.5.1. Installing All Available Components
19
1.5.2. Installing Individual Package Groups
19
1.5.3. Installing Optional Packages
20
1.5.4. Installing Debugging Information
20
1.6. Updating Red Hat Developer T oolset
21
1.6.1. Updating to a Minor Version
21
1.6.2. Updating to a Major Version
21
1.7. Uninstalling Red Hat Developer T oolset
21
1.8. Additional Resources
22
Online Documentation
22
See Also
22
. . . . . II.
Part
. . .Integrated
. . . . . . . . . . . Development
. . . . . . . . . . . . . . Environments
. . . . . . . . . . . . . . . . . . . . . . . . . . . . . . . . . . . . . . . . . . . . . . . . . . . . . . . . . .23
...........
.Chapter
. . . . . . . . 2.
. . .Eclipse
. . . . . . . . . . . . . . . . . . . . . . . . . . . . . . . . . . . . . . . . . . . . . . . . . . . . . . . . . . . . . . . . . . . . . . . . . . . . . . 24
............
2.1. Installing Eclipse
25
2.1.1. Building Eclipse from the Source RPM Packages
26
2.2. Using Eclipse
26
2.2.1. Using the Red Hat Developer T oolset T oolchain
26
2.2.2. Using the Red Hat Enterprise Linux T oolchain
27
2.3. Additional Resources
28
Installed Documentation
28
Online Documentation
28
See Also
28
. . . . . III.
Part
. . . Development
..............T
. .ools
. . . . . . . . . . . . . . . . . . . . . . . . . . . . . . . . . . . . . . . . . . . . . . . . . . . . . . . . . . . . . . . . . . .29
...........
.Chapter
. . . . . . . . 3.
. . .GNU
. . . . .Compiler
. . . . . . . . . .Collection
. . . . . . . . . . .(GCC)
. . . . . . . . . . . . . . . . . . . . . . . . . . . . . . . . . . . . . . . . . . . . . . . . . . . . .30
...........
3.1. GNU C Compiler
30
3.1.1. Installing the C Compiler
30
3.1.2. Using the C Compiler
30
3.1.3. Running a C Program
31
3.2. GNU C++ Compiler
32
3.2.1. Installing the C++ Compiler
32
1
Red Hat D eveloper Toolset 2.x User Guide
3.2.2. Using the C++ Compiler
3.2.3. Running a C++ Program
3.3. GNU Fortran Compiler
3.3.1. Installing the Fortran Compiler
3.3.2. Using the Fortran Compiler
3.3.3. Running a Fortran Program
3.4. Additional Resources
Installed Documentation
Online Documentation
See Also
32
33
34
34
34
35
36
36
36
36
.Chapter
........4
. ...binutils
. . . . . . . . . . . . . . . . . . . . . . . . . . . . . . . . . . . . . . . . . . . . . . . . . . . . . . . . . . . . . . . . . . . . . . . . . . . . . . .38
...........
4.1. Installing binutils
38
4.2. Using the GNU Assembler
38
4.3. Using the GNU Linker
39
4.4. Using Other Binary T ools
40
4.5. Additional Resources
40
Installed Documentation
41
Online Documentation
41
See Also
41
.Chapter
. . . . . . . . 5.
. . .elfutils
. . . . . . . . . . . . . . . . . . . . . . . . . . . . . . . . . . . . . . . . . . . . . . . . . . . . . . . . . . . . . . . . . . . . . . . . . . . . . . 4. .2. . . . . . . . . .
5.1. Installing elfutils
42
5.2. Using elfutils
42
5.3. Additional Resources
43
See Also
43
.Chapter
. . . . . . . . 6.
. . .dwz
. . . . . . . . . . . . . . . . . . . . . . . . . . . . . . . . . . . . . . . . . . . . . . . . . . . . . . . . . . . . . . . . . . . . . . . . . . . . . . 4. .4. . . . . . . . . .
6.1. Installing dwz
44
6.2. Using dwz
44
6.3. Additional Resources
44
Installed Documentation
44
See Also
45
. . . . . IV.
Part
. . . Debugging
. . . . . . . . . . . . T. .ools
. . . . . . . . . . . . . . . . . . . . . . . . . . . . . . . . . . . . . . . . . . . . . . . . . . . . . . . . . . . . . . . . . . . . 4. .6. . . . . . . . . .
.Chapter
. . . . . . . . 7.
. . .GNU
. . . . .Debugger
. . . . . . . . . . .(GDB)
. . . . . . . . . . . . . . . . . . . . . . . . . . . . . . . . . . . . . . . . . . . . . . . . . . . . . . . . . . . . . . 4. .7. . . . . . . . . .
7.1. Installing the GNU Debugger
47
7.2. Preparing a Program for Debugging
47
Compiling Programs with Debugging Information
47
Installing Debugging Information for Existing Packages
48
7.3. Running the GNU Debugger
48
7.4. Listing Source Code
49
7.5. Setting Breakpoints
51
Setting a New Breakpoint
51
Listing Breakpoints
51
Deleting Existing Breakpoints
51
7.6. Starting Execution
52
7.7. Displaying Current Values
52
7.8. Continuing Execution
53
7.9. Additional Resources
54
Online Documentation
54
See Also
54
.Chapter
. . . . . . . . 8.
. . .strace
. . . . . . . . . . . . . . . . . . . . . . . . . . . . . . . . . . . . . . . . . . . . . . . . . . . . . . . . . . . . . . . . . . . . . . . . . . . . . . .56
...........
8.1. Installing strace
56
8.2. Using strace
56
2
Table of Contents
8.2.1. Redirecting Output to a File
8.2.2. T racing Selected System Calls
8.2.3. Displaying T ime Stamps
8.2.4. Displaying a Summary
8.3. Additional Resources
Installed Documentation
See Also
56
57
58
59
59
59
60
.Chapter
. . . . . . . . 9.
. . .memstomp
. . . . . . . . . . . . . . . . . . . . . . . . . . . . . . . . . . . . . . . . . . . . . . . . . . . . . . . . . . . . . . . . . . . . . . . . . . . . . . .61
...........
9.1. Installing memstomp
63
9.2. Using memstomp
63
9.3. Additional Resources
65
Installed Documentation
65
See Also
65
. . . . . V.
Part
. . .Performance
. . . . . . . . . . . . . .Monitoring
. . . . . . . . . . . T. .ools
. . . . . . . . . . . . . . . . . . . . . . . . . . . . . . . . . . . . . . . . . . . . . . . . . . . . . . . .66
...........
.Chapter
. . . . . . . . 10.
. . . . SystemT
. . . . . . . . . ap
. . . . . . . . . . . . . . . . . . . . . . . . . . . . . . . . . . . . . . . . . . . . . . . . . . . . . . . . . . . . . . . . . . . . .67
...........
10.1. Installing SystemT ap
67
10.2. Using SystemT ap
67
10.3. Additional Resources
68
Installed Documentation
68
Online Documentation
68
See Also
69
.Chapter
. . . . . . . . 11.
. . . . Valgrind
. . . . . . . . . . . . . . . . . . . . . . . . . . . . . . . . . . . . . . . . . . . . . . . . . . . . . . . . . . . . . . . . . . . . . . . . . . . . . .70
...........
11.1. Installing Valgrind
70
11.2. Using Valgrind
70
11.3. Additional Resources
71
Installed Documentation
71
Online Documentation
71
See Also
71
.Chapter
. . . . . . . . 12.
. . . . OProfile
. . . . . . . . . . . . . . . . . . . . . . . . . . . . . . . . . . . . . . . . . . . . . . . . . . . . . . . . . . . . . . . . . . . . . . . . . . . . . .73
...........
12.1. Installing OProfile
73
12.2. Using OProfile
73
12.3. Additional Resources
74
Installed Documentation
74
Online Documentation
74
See Also
75
.Chapter
. . . . . . . . 13.
. . . .Dyninst
. . . . . . . . . . . . . . . . . . . . . . . . . . . . . . . . . . . . . . . . . . . . . . . . . . . . . . . . . . . . . . . . . . . . . . . . . . . . . .76
...........
13.1. Installing Dyninst
76
13.2. Using Dyninst
76
13.2.1. Using Dyninst with SystemT ap
76
13.2.2. Using Dyninst as a Stand-alone Application
77
13.3. Additional Resources
81
Installed Documentation
81
Online Documentation
82
See Also
82
. . . . . VI.
Part
. . . Getting
. . . . . . . . .Help
. . . . . . . . . . . . . . . . . . . . . . . . . . . . . . . . . . . . . . . . . . . . . . . . . . . . . . . . . . . . . . . . . . . . . . . . . .83
...........
.Chapter
. . . . . . . . 14
. . . .. Accessing
. . . . . . . . . . . Red
. . . . .Hat
. . . .Product
. . . . . . . . .Documentation
. . . . . . . . . . . . . . . . . . . . . . . . . . . . . . . . . . . . . . . . . . . . . . . . 84
............
Red Hat Developer T oolset
84
Red Hat Enterprise Linux
84
. . . . . . . . . 15.
Chapter
. . . . Accessing
. . . . . . . . . . . the
. . . . Customer
. . . . . . . . . . .Portal
. . . . . . . . . . . . . . . . . . . . . . . . . . . . . . . . . . . . . . . . . . . . . . . . . . . .85
...........
3
Red Hat D eveloper Toolset 2.x User Guide
.Chapter
. . . . . . . . 15.
. . . . Accessing
. . . . . . . . . . . the
. . . . Customer
. . . . . . . . . . .Portal
. . . . . . . . . . . . . . . . . . . . . . . . . . . . . . . . . . . . . . . . . . . . . . . . . . . .85
...........
15.1. T he Plan Menu
85
15.2. T he Deploy Menu
86
15.3. T he Connect Menu
87
.Chapter
. . . . . . . . 16.
. . . . Contacting
. . . . . . . . . . . . Global
. . . . . . . Support
. . . . . . . . . Services
. . . . . . . . . . . . . . . . . . . . . . . . . . . . . . . . . . . . . . . . . . . . . . . . . .89
...........
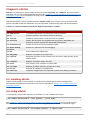
16.1. Gathering Required Information
89
Background Information
89
Diagnostics
89
Account and Contact Information
89
Issue Severity
90
16.2. Escalating an Issue
90
16.3. Re-opening a Service Request
91
16.4. Additional Resources
91
Online Documentation
91
.Changes
. . . . . . . . . in
. . .Version
. . . . . . . .2.0
. . . . . . . . . . . . . . . . . . . . . . . . . . . . . . . . . . . . . . . . . . . . . . . . . . . . . . . . . . . . . . . . . . . . . .92
...........
A.1. Changes in Eclipse
92
A.1.1. Changes Since Red Hat Enterprise Linux 6.4
92
A.2. Changes in GCC
93
A.2.1. Changes Since Red Hat Developer T oolset 1.1
93
A.2.1.1. Caveats
93
Aggressive Loop Optimizations
93
A.2.1.2. General Improvements and Changes
94
New Local Register Allocator
94
AddressSanitizer
94
T hreadSanitizer
94
Compiling Extremely Large Functions
94
New -Og Optimization Level
94
Caret Diagnostic Messages
94
New -fira-hoist-pressure Option
94
New -fopt-info Option
95
New -floop-nest-optimize Option
95
Hot and Cold Attributes on Labels
95
A.2.1.3. Debugging Enhancements
95
DWARF4
95
New -gsplit-dwarf Option
95
A.2.1.4. C++ Changes
96
Experimental C++ Features from an Upcoming Standard
96
New thread_local Keyword
96
Dynamic Initialization of T hread-local Variables
96
C++11 Attribute Syntax
96
C++11 Alignment Specifier
96
A.2.1.5. Fortran Changes
96
A.2.1.5.1. Caveats
96
A.2.1.5.2. ABI Compatibility
97
A.2.1.5.3. Other Changes
97
BACKT RACE Intrinsic
97
Floating Point Numbers with “q” as Exponential
97
GFORT RAN_T MPDIR Environment Variable
97
Fortran 2003
97
T S 29113
97
A.2.1.6. x86-specific Improvements
98
New Instructions
98
New Built-in Functions to Detect Run-time CPU T ype and ISA
98
Function Multiversioning
98
New RT M and HLE Intrinsics
99
4
Table of Contents
T ransactions Using T ransactional Synchronization Extensions
Support for AMD Family 15h Processors
Support for AMD Family 16h Processors
A.2.2. Changes Since Red Hat Enterprise Linux 6.4 and 5.9
A.2.2.1. Status and Features
A.2.2.1.1. C++11
A.2.2.1.2. C11
A.2.2.1.3. Parallelism and Concurrency
C++11 T ypes and GCC Built-ins for Atomic Memory Access
T ransactional Memory
A.2.2.1.4. Architecture-specific Options
A.2.2.1.5. Link-time Optimization
A.2.2.1.6. Miscellaneous
A.2.2.2. Language Compatibility
A.2.2.2.1. C
Duplicate Member
A.2.2.2.2. C++
Header Dependency Changes
Name Lookup Changes
Uninitialized const
Visibility of T emplate Instantiations
User-defined Literal Support
T aking the Address of T emporary
Miscellaneous
A.2.2.2.3. C/C++ Warnings
A.2.2.2.4. Fortran
A.2.2.2.4.1. New Features
A.2.2.2.4.2. Compatibility Changes
A.2.2.2.4.3. Fortran 2003 Features
A.2.2.2.4.4. Fortran 2003 Compatibility
A.2.2.2.4.5. Fortran 2008 Features
A.2.2.2.4.6. Fortran 2008 Compatibility
A.2.2.2.4.7. Fortran 77 Compatibility
A.2.2.3. ABI Compatibility
A.2.2.3.1. C++ ABI
A.2.2.3.2. Miscellaneous
A.2.2.4. Debugging Compatibility
A.2.2.5. Other Compatibility
A.3. Changes in binutils
A.3.1. GNU Linker
A.3.1.1. New Features
Changes Since Red Hat Enterprise Linux 6.4
Changes Since Red Hat Enterprise Linux 5.9
A.3.1.2. Compatibility Changes
Changes Since Red Hat Enterprise Linux 6.4
Changes Since Red Hat Enterprise Linux 5.9
A.3.2. GNU Assembler
A.3.2.1. New Features
Changes Since Red Hat Enterprise Linux 6.4
Changes Since Red Hat Enterprise Linux 5.9
A.3.3. Other Binary T ools
A.3.3.1. New Features
Changes Since Red Hat Developer T oolset 1.1
Changes Since Red Hat Enterprise Linux 6.4
Changes Since Red Hat Enterprise Linux 5.9
100
100
100
100
100
100
100
101
101
101
103
105
105
106
106
106
106
106
107
108
108
108
109
109
109
110
110
111
112
112
113
114
114
114
114
115
115
115
115
116
116
116
116
117
117
117
118
118
118
118
119
119
119
119
119
5
Red Hat D eveloper Toolset 2.x User Guide
A.3.3.2. Compatibility Changes
Changes Since Red Hat Enterprise Linux 5.9
A.4. Changes in elfutils
A.4.1. Changes Since Red Hat Developer T oolset 1.1
A.4.2. Changes Since Red Hat Enterprise Linux 6.4
A.4.3. Changes Since Red Hat Enterprise Linux 5.9
A.5. Changes in dwz
A.5.1. Changes Since Red Hat Developer T oolset 1.1
A.6. Changes in GDB
A.6.1. Changes Since Red Hat Developer T oolset 1.1
A.6.2. Changes Since Red Hat Enterprise Linux 6.4
New Features
Compatibility Changes
A.6.3. Changes Since Red Hat Enterprise Linux 5.9
New Features
A.7. Changes in strace
A.7.1. Changes Since Red Hat Enterprise Linux 6.4 and 5.9
A.8. Changes in SystemT ap
A.8.1. Changes Since Red Hat Developer T oolset 1.1
A.9. Changes in OProfile
A.9.1. Changes Since Red Hat Developer T oolset 1.1
A.9.2. Changes Since Red Hat Enterprise Linux 5.9
A.10. Changes in Valgrind
A.10.1. Changes Since Red Hat Developer T oolset 1.1
A.10.2. Changes Since Red Hat Enterprise Linux 5.9
120
120
120
120
121
121
122
122
122
122
125
125
129
130
130
133
133
133
133
134
134
134
135
135
135
. . . . . . . . . .History
Revision
. . . . . . . . . . . . . . . . . . . . . . . . . . . . . . . . . . . . . . . . . . . . . . . . . . . . . . . . . . . . . . . . . . . . . . . . . . . . . . . 137
.............
.Index
. . . . . . . . . . . . . . . . . . . . . . . . . . . . . . . . . . . . . . . . . . . . . . . . . . . . . . . . . . . . . . . . . . . . . . . . . . . . . . . . . . . . . . . . 137
.............
A
137
B
137
C
137
D
138
E
139
F
141
G
141
H
142
L
143
M
143
N
143
O
143
R
144
S
145
V
147
6
Table of Contents
7
Red Hat D eveloper Toolset 2.x User Guide
Preface
1. Document Conventions
T his manual uses several conventions to highlight certain words and phrases and draw attention to
specific pieces of information.
In PDF and paper editions, this manual uses typefaces drawn from the Liberation Fonts set. T he
Liberation Fonts set is also used in HT ML editions if the set is installed on your system. If not, alternative
but equivalent typefaces are displayed. Note: Red Hat Enterprise Linux 5 and later include the Liberation
Fonts set by default.
1.1. Typographic Conventions
Four typographic conventions are used to call attention to specific words and phrases. T hese
conventions, and the circumstances they apply to, are as follows.
Mono-spaced Bold
Used to highlight system input, including shell commands, file names and paths. Also used to highlight
keys and key combinations. For example:
T o see the contents of the file m y_next_bestselling_novel in your current working
directory, enter the cat m y_next_bestselling_novel command at the shell prompt
and press Enter to execute the command.
T he above includes a file name, a shell command and a key, all presented in mono-spaced bold and all
distinguishable thanks to context.
Key combinations can be distinguished from an individual key by the plus sign that connects each part of
a key combination. For example:
Press Enter to execute the command.
Press Ctrl+Alt+F2 to switch to a virtual terminal.
T he first example highlights a particular key to press. T he second example highlights a key combination:
a set of three keys pressed simultaneously.
If source code is discussed, class names, methods, functions, variable names and returned values
mentioned within a paragraph will be presented as above, in m ono-spaced bold. For example:
File-related classes include filesystem for file systems, file for files, and dir for
directories. Each class has its own associated set of permissions.
Proportional Bold
T his denotes words or phrases encountered on a system, including application names; dialog box text;
labeled buttons; check-box and radio button labels; menu titles and sub-menu titles. For example:
Choose System → Preferences → Mouse from the main menu bar to launch Mouse
Preferences. In the Buttons tab, select the Left-handed m ouse check box and click
Close to switch the primary mouse button from the left to the right (making the mouse
suitable for use in the left hand).
T o insert a special character into a gedit file, choose Applications → Accessories →
8
Preface
Character Map from the main menu bar. Next, choose Search → Find… from the
Character Map menu bar, type the name of the character in the Search field and click
Next. T he character you sought will be highlighted in the Character T able. Double-click
this highlighted character to place it in the T ext to copy field and then click the Copy
button. Now switch back to your document and choose Edit → Paste from the gedit menu
bar.
T he above text includes application names; system-wide menu names and items; application-specific
menu names; and buttons and text found within a GUI interface, all presented in proportional bold and all
distinguishable by context.
Mono-spaced Bold Italic or Proportional Bold Italic
Whether mono-spaced bold or proportional bold, the addition of italics indicates replaceable or variable
text. Italics denotes text you do not input literally or displayed text that changes depending on
circumstance. For example:
T o connect to a remote machine using ssh, type ssh username@ domain.name at a shell
prompt. If the remote machine is exam ple.com and your username on that machine is
john, type ssh john@ exam ple.com .
T he m ount -o rem ount file-system command remounts the named file system. For
example, to remount the /hom e file system, the command is m ount -o rem ount /hom e.
T o see the version of a currently installed package, use the rpm -q package command. It
will return a result as follows: package-version-release.
Note the words in bold italics above — username, domain.name, file-system, package, version and
release. Each word is a placeholder, either for text you enter when issuing a command or for text
displayed by the system.
Aside from standard usage for presenting the title of a work, italics denotes the first use of a new and
important term. For example:
Publican is a DocBook publishing system.
1.2. Pull-quote Conventions
T erminal output and source code listings are set off visually from the surrounding text.
Output sent to a terminal is set in m ono-spaced rom an and presented thus:
books
books_tests
Desktop
Desktop1
documentation
downloads
drafts
images
mss
notes
photos
scripts
stuff
svgs
svn
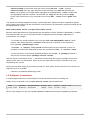
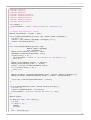
Source-code listings are also set in m ono-spaced rom an but add syntax highlighting as follows:
9
Red Hat D eveloper Toolset 2.x User Guide
static int kvm_vm_ioctl_deassign_device(struct kvm *kvm,
struct kvm_assigned_pci_dev *assigned_dev)
{
int r = 0;
struct kvm_assigned_dev_kernel *match;
mutex_lock(&kvm->lock);
match = kvm_find_assigned_dev(&kvm->arch.assigned_dev_head,
assigned_dev->assigned_dev_id);
if (!match) {
printk(KERN_INFO "%s: device hasn't been assigned before, "
"so cannot be deassigned\n", __func__);
r = -EINVAL;
goto out;
}
kvm_deassign_device(kvm, match);
kvm_free_assigned_device(kvm, match);
out:
mutex_unlock(&kvm->lock);
return r;
}
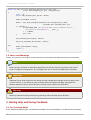
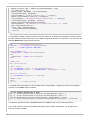
1.3. Notes and Warnings
Finally, we use three visual styles to draw attention to information that might otherwise be overlooked.
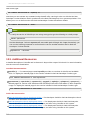
Note
Notes are tips, shortcuts or alternative approaches to the task at hand. Ignoring a note should
have no negative consequences, but you might miss out on a trick that makes your life easier.
Important
Important boxes detail things that are easily missed: configuration changes that only apply to the
current session, or services that need restarting before an update will apply. Ignoring a box
labeled 'Important' will not cause data loss but may cause irritation and frustration.
Warning
Warnings should not be ignored. Ignoring warnings will most likely cause data loss.
2. Getting Help and Giving Feedback
2.1. Do You Need Help?
If you experience difficulty with a procedure described in this documentation, visit the Red Hat Customer
10
Preface
Portal at http://access.redhat.com. T hrough the customer portal, you can:
search or browse through a knowledgebase of technical support articles about Red Hat products.
submit a support case to Red Hat Global Support Services (GSS).
access other product documentation.
Red Hat also hosts a large number of electronic mailing lists for discussion of Red Hat software and
technology. You can find a list of publicly available mailing lists at https://www.redhat.com/mailman/listinfo.
Click on the name of any mailing list to subscribe to that list or to access the list archives.
2.2. We Need Feedback
If you find a typographical error in this manual, or if you have thought of a way to make this manual
better, we would love to hear from you. Please submit a report in Bugzilla: http://bugzilla.redhat.com/
against the product Red Hat Developer T oolset.
When submitting a bug report, be sure to mention the manual's identifier: doc-User_Guide
If you have a suggestion for improving the documentation, try to be as specific as possible when
describing it. If you have found an error, please include the section number and some of the surrounding
text so we can find it easily.
11
Red Hat D eveloper Toolset 2.x User Guide
Part I. Introduction
12
Chapter 1. Red Hat D eveloper Toolset
Chapter 1. Red Hat Developer Toolset
1.1. About Red Hat Developer Toolset
Red Hat Developer T oolset is a Red Hat offering for developers on the Red Hat Enterprise Linux
platform, and provides a complete set of development and performance analysis tools that can be
installed and used on multiple versions of Red Hat Enterprise Linux. Executables built with the Red Hat
Developer T oolset toolchain can then also be deployed and run on multiple versions of Red Hat
Enterprise Linux. For detailed compatibility information, see Section 1.3, “Compatibility”.
Critically, Red Hat Developer T oolset does not replace the default system tools provided with Red Hat
Enterprise Linux 5 or 6 when installed on those platforms. Instead, a parallel set of developer tools
provides an alternative, newer version of those tools for optional use by developers. T he default
compiler and debugger, for example, remain those provided by the base Red Hat Enterprise Linux
system.
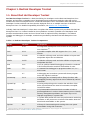
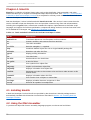
T able 1.1. Red Hat Developer T oolset Components
Name
Version
Description
Eclipse
4.3.0
An integrated development environment for the graphical
user interface. [a]
GCC
4.8.1
A portable compiler suite with support for C, C++, and
Fortran.
binutils
2.23.52
A collection of binary tools and other utilities to inspect and
manipulate object files and binaries.
elfutils
0.155
A collection of binary tools and other utilities to inspect and
manipulate ELF files.
dwz
0.11
A tool to optimize DWARF debugging information contained
in ELF shared libraries and ELF executables for size.
GDB
7.6
A command line debugger for programs written in C, C++,
and Fortran.
strace
4.7
A debugging tool to monitor system calls that a program
uses and signals it receives.
memstomp
0.1.4
A debugging tool to identify calls to library functions with
overlapping memory regions that are not allowed by various
standards.
SystemT ap
2.1
A tracing and probing tool to monitor the activities of the
entire system without the need to instrument, recompile,
install, and reboot.
Valgrind
3.8.1
An instrumentation framework and a number of tools to
profile applications in order to detect memory errors, identify
memory management problems, and report any use of
improper arguments in system calls.
OProfile
0.9.8
A system-wide profiler that uses the performance monitoring
hardware on the processor to retrieve information about the
kernel and executables on the system.
Dyninst
8.0
A library for instrumenting and working with user-space
executables during their execution.
[a] If yo u intend to d evelo p ap p lic atio ns fo r Red Hat JBo s s Mid d leware o r req uire s up p o rt fo r O p enShift To o ls , it is
rec o mmend ed that yo u us e Red Hat JBo s s Develo p er Stud io .
13
Red Hat D eveloper Toolset 2.x User Guide
Red Hat Developer T oolset differs from “T echnology Preview” compiler releases previously supplied in
Red Hat Enterprise Linux in two important respects:
1. Red Hat Developer T oolset can be used on multiple major and minor releases of Red Hat
Enterprise Linux, as detailed in Section 1.3, “Compatibility”.
2. Unlike T echnology Preview compilers and other tools shipped in earlier Red Hat Enterprise Linux,
Red Hat Developer T oolset is fully supported under Red Hat Enterprise Linux Subscription Level
Agreements, is functionally complete, and is intended for production use.
Important bug fixes and security errata are issued to Red Hat Developer T oolset subscribers in a similar
manner to Red Hat Enterprise Linux for two years from the release of each major version release. New
major versions of Red Hat Developer T oolset is released annually, providing significant updates for
existing components and adding major new components. A single minor release, issued six months after
each new major version release, provides a smaller update of bug fixes, security errata, and new minor
components.
Additionally, the Red Hat Enterprise Linux Application Compatibility Specification also applies to Red Hat
Developer T oolset (subject to some constraints on the use of newer C++11 language features, detailed
in Section A.2.2.3, “ABI Compatibility”).
Important
Applications and libraries provided by Red Hat Developer T oolset do not replace the Red Hat
Enterprise Linux system versions, nor are they used in preference to the system versions. Using
a framework called Software Collections, an additional set of developer tools is installed into
the /opt directory and is explicitly enabled by the user on demand using the supplied scl utility.
1.2. Main Features
T he Red Hat Developer T oolset version of the GNU Compiler Collection (GCC) provides the
following features:
A new register allocator (LRA) has been added, improving code performance.
A fast memory error detector called AddressSanitizer has been added.
A fast data race detector called T hreadSanitizer has been added.
Extremely large functions can now be compiled faster using less memory.
A new general optimization level has been introduced.
GCC diagnostic messages now highlight the exact problem source code.
Various new optimization options have been added.
DWARF4 is now used as the default debug format.
GCC now fully implements the C++11 language standard.
C++11 library support has been extended though is still experimental.
GCC now supports dynamic initialization of thread-local variables.
Support has been added for Intel FXSR, XSAVE, and XSAVEOPT instructions.
New built-in functions added to detect run-time Intel CPU T ype and ISA.
Intel function multi-versioning support added.
Intel RT M/HLE intrinsics, built-ins, and code generation have been added.
14
Chapter 1. Red Hat D eveloper Toolset
T ransactions (the -fgnu-tm option) can now be run using Intel T SX extensions.
Support for AMD family 15h and 16h processors has been added.
Various Fortran changes have been included.
T he version of the GNU Debugger (GDB) included in Red Hat Developer T oolset provides the
following features:
Improved and expanded support for Python scripting.
Improved handling of C++ debugee executables.
Improved inferior control commands.
Improved support for ambiguous line specifications.
Improved tracepoint support.
Multi-program debugging.
Additionally, the Red Hat Developer T oolset version of binutils provides these features:
T he new gold linker, which is smaller and faster than ld. Note that gold is not the default linker
and must be explicitly enabled by using the alternatives command.
Support for link-time optimization (LT O) in conjunction with GCC.
Support for build-IDs, unique numbers to identify executables.
Support for the IFUNC and UNIQUE symbols that are used by glibc to improve performance. Due
to dependencies on a particular version of the glibc library, these symbols are only available on
Red Hat Enterprise Linux 6.
Compressed debug sections for smaller debug info files.
For a full list of changes and features introduced in this release, see Appendix A, Changes in Version
2.0.
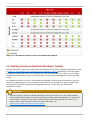
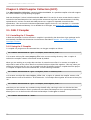
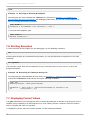
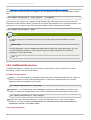
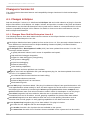
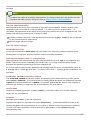
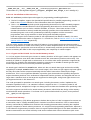
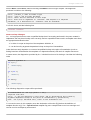
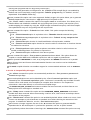
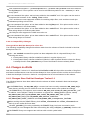
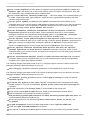
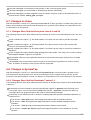
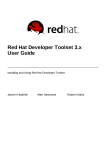
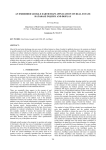
1.3. Compatibility
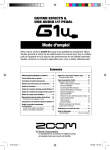
Red Hat Developer T oolset 2.0 is available for Red Hat Enterprise Linux 5 and 6, both for 32-bit and 64bit Intel and AMD architectures. Figure 1.1, “Red Hat Developer T oolset 2.0 Compatibility Matrix”
illustrates the support for binaries built with Red Hat Developer T oolset on a certain version of Red Hat
Enterprise Linux when those binaries are run on various other versions of this system.
15
Red Hat D eveloper Toolset 2.x User Guide
Figure 1.1. Red Hat Developer T oolset 2.0 Compatibility Matrix
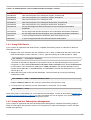
1.4. Getting Access to Red Hat Developer Toolset
Red Hat Developer T oolset is an offering that is distributed as part of the developer subscriptions listed
in T able 1.2, “Subscriptions T hat Provide Red Hat Developer T oolset”. Depending on the subscription
management service with which you registered your Red Hat Enterprise Linux system, you can either
enable Red Hat Developer T oolset by using the Red Hat Subscription Management, or by using RHN
Classic.
For detailed instructions on how to enable Red Hat Developer T oolset using RHN Classic or Red Hat
Subscription Management, see the respective section below. For information on how to register your
system with one of these subscription management services, see the Red Hat Subscription
Management Guide.
Important
If you are running a version of Red Hat Enterprise Linux prior to 5.9 or 6.4, you will be unable to
download Red Hat Developer T oolset through Red Hat Subscription Management. T o obtain Red
Hat Developer T oolset, you will need to either update to Red Hat Enterprise Linux 5.9 or 6.4, or
register your system with RHN Classic. For more information, see
https://access.redhat.com/site/solutions/129003.
16
Chapter 1. Red Hat D eveloper Toolset
T able 1.2. Subscriptions T hat Provide Red Hat Developer T oolset
SKU
Subscription Name
RH2282403
Red Hat Enterprise Linux Developer Support, Professional
RH2264664
Red Hat Enterprise Linux Developer Support, Enterprise
RH2262474
Red Hat Enterprise Linux Developer Suite
RH3482727
Red Hat Enterprise Linux Developer Workstation, Professional
RH3413336
Red Hat Enterprise Linux Developer Workstation, Enterprise
RH3414706
30 day Self-Supported Red Hat Enterprise Linux Developer Workstation
Evaluation
RH3474212
60 day Supported Red Hat Enterprise Linux Developer Workstation Evaluation
RH3437268
90 day Supported Red Hat Enterprise Linux Developer Workstation Evaluation
SER0402
1-year Unsupported Partner Evaluation Red Hat Enterprise Linux
SER0403
1-year Unsupported Red Hat Advanced Partner Subscription
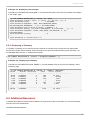
1.4.1. Using RHN Classic
If your system is registered with RHN Classic, complete the following steps to subscribe to Red Hat
Developer T oolset:
1. Display a list of all channels that are available to you in order to determine the exact name of the
Red Hat Developer T oolset channel. T o do so, type the following at a shell prompt as root:
rhn-channel --available-channels
T he name of the channel depends on the specific version of Red Hat Enterprise Linux you are
using and is in the rhel-architecture-variant-dts2-version format, where architecture
is the system's CPU architecture (x86_64 or i386), variant is the Red Hat Enterprise Linux
system variant (server or workstation), and version is the Red Hat Enterprise Linux system
version (5 or 6).
2. Subscribe the system to the Red Hat Developer T oolset channel by running the following
command as root:
rhn-channel --add --channel=channel_name
Replace channel_name with the name you determined in the previous step.
3. T o verify the list of channels you are subscribed to, at any time, run as root:
rhn-channel --list
Once the system is subscribed, you can install Red Hat Developer T oolset as described in Section 1.5,
“Installing Red Hat Developer T oolset”. For more information on how to register your system with RHN
Classic, see the Red Hat Subscription Management Guide.
1.4.2. Using Red Hat Subscription Management
If your system is registered with Red Hat Subscription Management, complete the following steps to
attach a subscription that provides access to the repository for Red Hat Developer T oolset, and then
enable that repository:
17
Red Hat D eveloper Toolset 2.x User Guide
1. Display a list of all subscriptions that are available for your system to determine the pool ID of a
subscription that provides Red Hat Developer T oolset. T o do so, type the following at a shell
prompt as root:
subscription-manager list --available
For each available subscription, this command displays its name, unique identifier, expiration date,
and other details related to your subscription. T he pool ID is listed on a line beginning with Pool
Id.
For a complete list of subscriptions that provide access to Red Hat Developer T oolset, see
T able 1.2, “Subscriptions T hat Provide Red Hat Developer T oolset”.
2. Attach the appropriate subscription to your system by running the following command as root:
subscription-manager subscribe --pool=pool_id
Replace pool_id with the pool ID you determined in the previous step. T o verify the list of
subscriptions your system has currently attached, at any time, run as root:
subscription-manager list --consumed
3. Display a list of available Yum repositories to retrieve repository metadata and to determine the
exact name of the Red Hat Developer T oolset repositories. As root, type:
yum repolist all
T he repository names depend on the specific version of Red Hat Enterprise Linux you are using,
and are in the following format:
rhel-variant-dts2-version-rpms
rhel-variant-dts2-version-debug-rpms
rhel-variant-dts2-version-source-rpms
Replace variant with the Red Hat Enterprise Linux system variant (server or workstation),
and version with the Red Hat Enterprise Linux system version (5 or 6).
4. Enable the appropriate repository. On Red Hat Enterprise Linux 6, you can do so by running the
following command as root:
yum-config-manager --enable repository
On Red Hat Enterprise Linux 5, which does not support the yum -config-m anager tool, edit the
/etc/yum .repos.d/redhat.repo file, locate the relevant [repository] section, and set the
value of the enabled option to 1:
enabled = 1
Once the subscription is attached to the system, you can install Red Hat Developer T oolset as
described in Section 1.5, “Installing Red Hat Developer T oolset”. For more information on how to register
your system using Red Hat Subscription Management and associate it with subscriptions, see the Red
Hat Subscription Management Guide.
1.5. Installing Red Hat Developer Toolset
18
Chapter 1. Red Hat D eveloper Toolset
Red Hat Developer T oolset is distributed as a collection of RPM packages that can be installed,
updated, uninstalled, and inspected by using the standard package management tools that are included
in Red Hat Enterprise Linux. Note that a valid subscription is required in order to install Red Hat
Developer T oolset on your system. For detailed instructions on how to associate your system with an
appropriate subscription and get access to the product, see Section 1.4, “Getting Access to Red Hat
Developer T oolset”.
Important
Before installing Red Hat Developer T oolset on a system that is already running the previous
version of the product, make sure that the devtoolset-1.1-gcc-debuginfo is not installed. T o
uninstall this package from the system, type the following at a shell prompt as root:
yum remove devtoolset-1.1-gcc-debuginfo
Important
After installing Red Hat Developer T oolset, it is recommended to apply all available Red Hat
Enterprise Linux errata updates to enable all Red Hat Developer T oolset features and apply fixes
that may otherwise impact the tools or built code.
1.5.1. Installing All Available Components
T o install all components that are included in this product, install the devtoolset-2 package by typing the
following at a shell prompt as root:
yum install devtoolset-2
T his installs the Eclipse development environment, all development, debugging, and performance
monitoring tools, the scl utility and other dependent packages to the system. Alternatively, you can
choose to install only a selected package group as described in Section 1.5.2, “Installing Individual
Package Groups”.
1.5.2. Installing Individual Package Groups
T o make it easier to install only certain components such as the integrated development environment or
the software development toolchain, Red Hat Developer T oolset is distributed with a number of meta
packages that allow you to install selected package groups as described in T able 1.3, “Red Hat
Developer T oolset Meta Packages”.
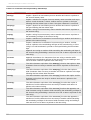
T able 1.3. Red Hat Developer T oolset Meta Packages
Package Name
Description
Installed Components
devtoolset-2-ide
Integrated Development
Environment
Eclipse
devtoolset-2-perftools
Performance monitoring tools
SystemT ap, Valgrind, OProfile,
Dyninst
devtoolset-2-toolchain
Development and debugging tools
GCC, GDB, binutils, elfutils, dwz,
memstomp, strace
19
Red Hat D eveloper Toolset 2.x User Guide
T o install any of these meta packages, type the following at a shell prompt as root:
yum install package_name...
Replace package_name with a space-separated list of meta packages you want to install. For example,
to install only the Eclipse development environment and packages that depend on it, type as root:
~]# yum install devtoolset-2-ide
Alternatively, you can choose to install all available components as described in Section 1.5.1, “Installing
All Available Components”.
1.5.3. Installing Optional Packages
Red Hat Developer T oolset is distributed with a number of optional packages that are not installed by
default. T o list all Red Hat Developer T oolset packages that are available to you but not installed on
your system, type the following command at a shell prompt:
yum list available devtoolset-2-\*
T o install any of these optional packages, run as root:
yum install package_name...
Replace package_name with a space-separated list of packages that you want to install. For example, to
install the devtoolset-2-gdb-gdbserver and devtoolset-2-gdb-doc packages, type:
~]# yum install devtoolset-2-gdb-gdbserver devtoolset-2-gdb-doc
Important
T he devtoolset-2-gcc-plugin-devel package depends on the mpfr-devel package, which is only
available in the Optional channel. For detailed instructions on how to subscribe your system to
this channel, see the relevant Knowledge article on the Customer Portal.
1.5.4. Installing Debugging Information
T o install debugging information for any of the Red Hat Developer T oolset packages, make sure that the
yum-utils package is installed and run the following command as root:
debuginfo-install package_name
For example, to install debugging information for the devtoolset-2-dwz package, type:
~]# debuginfo-install devtoolset-2-dwz
Note that in order to use this command, you need to have access to the repository with these packages.
If your system is registered with Red Hat Subscription Management, enable the rhel-variantdts2-version-debug-rpm s repository as described in Section 1.4.2, “Using Red Hat Subscription
Management”. If your system is registered with RHN Classic, subscribe the system to the
20
Chapter 1. Red Hat D eveloper Toolset
rhel-architecture-variant-version-debuginfo channel as described in Section 1.4.1, “Using
RHN Classic”. For more information on how to get access to debuginfo packages, see
https://access.redhat.com/site/solutions/9907.
1.6. Updating Red Hat Developer Toolset
1.6.1. Updating to a Minor Version
When a new minor version of Red Hat Developer T oolset is available, run the following command as
root to update your Red Hat Enterprise Linux installation:
yum update
T his updates all packages on your Red Hat Enterprise Linux system, including the Red Hat Developer
T oolset versions the Eclipse development environment, development, debugging, and performance
monitoring tools, the scl utility and other dependent packages.
Important
Use of Red Hat Developer T oolset requires the removal of any earlier pre-release versions of
this product. Additionally, it is not possible to update to Red Hat Developer T oolset 2.0 from a
pre-release version of Red Hat Developer T oolset, including beta releases. If you have previously
installed any pre-release version of Red Hat Developer T oolset, uninstall it from your system as
described in Section 1.7, “Uninstalling Red Hat Developer T oolset” and install the new version as
documented in Section 1.5, “Installing Red Hat Developer T oolset”.
1.6.2. Updating to a Major Version
When a new major version of Red Hat Developer T oolset is available, you can install it in parallel with
the previous version of the product. For detailed instructions on how to install Red Hat Developer
T oolset on your system, see Section 1.5, “Installing Red Hat Developer T oolset”.
1.7. Uninstalling Red Hat Developer Toolset
T o uninstall Red Hat Developer T oolset packages from your system, type the following at a shell prompt
as root:
yum remove devtoolset-2\*
T his removes the GNU Compiler Collection, GNU Debugger, binutils, and other packages that are part of
Red Hat Developer T oolset from the system. T o uninstall the scl utility as well, type as root:
yum remove scl-utils\*
Note that uninstallation of the tools provided by Red Hat Developer T oolset does not affect the Red Hat
Enterprise Linux system versions of these tools.
For information on how to uninstall Red Hat Developer T oolset 1.1, see the Red Hat Developer T oolset
1.1 User Guide.
21
Red Hat D eveloper Toolset 2.x User Guide
1.8. Additional Resources
For more information about Red Hat Developer T oolset and Red Hat Enterprise Linux, see the resources
listed below.
Online Documentation
Red Hat Subscription Management Guide — T he Red Hat Subscription Management Guide provides
detailed information on how to manage subscriptions on Red Hat Enterprise Linux.
Red Hat Developer T oolset 2.0 Release Notes — T he Release Notes for Red Hat Developer T oolset
2.0 contain more information about this product.
Red Hat Enterprise Linux 6 Developer Guide — T he Developer Guide for Red Hat Enterprise Linux 6
provides more information on the Eclipse IDE, libraries and runtime support, compiling and building,
debugging, and profiling on this system.
Red Hat Enterprise Linux 6 Installation Guide — T he Installation Guide for Red Hat Enterprise Linux
6 explains how to obtain, install, and update the system.
Red Hat Enterprise Linux 5 Installation Guide — T he Installation Guide for Red Hat Enterprise Linux
5 explains how to obtain, install, and update the system.
Red Hat Enterprise Linux 6 Deployment Guide — T he Deployment Guide for Red Hat Enterprise
Linux 6 documents relevant information regarding the deployment, configuration, and administration
of Red Hat Enterprise Linux 6.
Red Hat Enterprise Linux 5 Deployment Guide — T he Deployment Guide for Red Hat Enterprise
Linux 5 documents relevant information regarding the deployment, configuration, and administration
of Red Hat Enterprise Linux 5.
See Also
Appendix A, Changes in Version 2.0 provides a comprehensive list of changes and improvements
over the Red Hat Enterprise Linux system versions of the GNU Compiler Collection, GNU Debugger,
and binutils, as well as information about the language, ABI, and debugging compatibility.
22
Part II. Integrated D evelopment Environments
Part II. Integrated Development Environments
23
Red Hat D eveloper Toolset 2.x User Guide
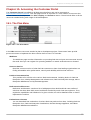
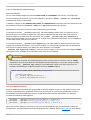
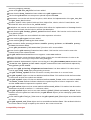
Chapter 2. Eclipse
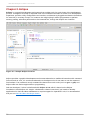
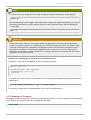
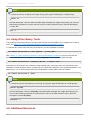
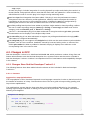
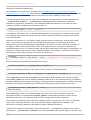
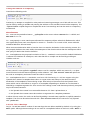
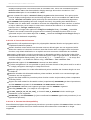
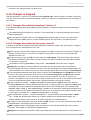
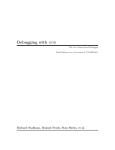
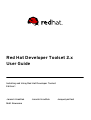
Eclipse is a powerful development environment that provides tools for each phase of the development
process. It integrates a variety of disparate tools into a unified environment to create a rich development
experience, provides a fully configurable user interface, and features a pluggable architecture that allows
for extension in a variety of ways. For instance, the Valgrind plug-in allows programmers to perform
memory profiling, otherwise performed on the command line, through the Eclipse user interface.
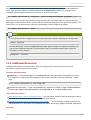
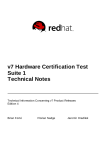
Figure 2.1. Sample Eclipse Session
Eclipse provides a graphical development environment alternative to traditional interaction with command
line tools and as such, it is a welcome alternative to developers who do not want to use the command
line interface. T he traditional, mostly command line based Linux tools suite (such as gcc or gdb) and
Eclipse offer two distinct approaches to programming.
Red Hat Developer T oolset is distributed with Eclipse 4 .3.0, which is based on the Eclipse
Foundation's 2013 Eclipse 4.3 “Kepler” simultaneous release. Note that if you intend to develop
applications for Red Hat JBoss Middleware or require support for OpenShift T ools, it is recommended
that you use Red Hat JBoss Developer Studio.
24
Chapter 2. Eclipse
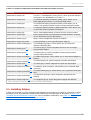
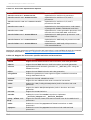
T able 2.1. Eclipse Components Included in Red Hat Developer T oolset
Package
Description
devtoolset-2-eclipse-cdt
T he C/C++ Development T ooling (CDT ), which provides features
and plug-ins for development in C and C++.
devtoolset-2-eclipse-emf
T he Eclipse Modeling Framework (EMF), which allows you to
build applications based on a structured data model.
devtoolset-2-eclipse-gef
T he Graphical Editing Framework (GEF), which allows you to
create a rich graphical editor from an existing application model.
devtoolset-2-eclipse-rse
T he Remote System Explorer (RSE) framework, which allows you
to work with remote systems from Eclipse.
devtoolset-2-eclipse-jgit
JGit, a Java implementation of the Git revision control system.
devtoolset-2-eclipse-egit
EGit, a team provider for Eclipse that provides features and plugins for interaction with Git repositories.
devtoolset-2-eclipse-mylyn
Mylyn, a task management system for Eclipse.
devtoolset-2-eclipse-linuxtools
A meta package for Linux-specific Eclipse plug-ins.
devtoolset-2-eclipse-changelog
[a]
T he ChangeLog plug-ins, which allows you to create and
maintain changelog files.
devtoolset-2-eclipse-gcov[a]
T he GCov plug-in, which integrates the GCov test coverage
program with Eclipse.
devtoolset-2-eclipse-gprof[a]
T he Gprof plug-in, which integrates the Gprof performance
analysis utility with Eclipse.
devtoolset-2-eclipse-manpage[a]
T he Man Page plug-in, which allows you to view manual pages in
Eclipse.
devtoolset-2-eclipse-oprofile[a]
T he OProfile plug-in, which integrates OProfile with Eclipse.
devtoolset-2-eclipse-perf[a]
T he Perf plug-in, which integrates the perf tool with Eclipse.
devtoolset-2-eclipse-rpm-editor[a]
T he Eclipse Spec File Editor, which allows you to maintain RPM
spec files.
devtoolset-2-eclipse-rpmstubby[a]
T he RPM Stubby plug-in, which allows you to generate RPM spec
files.
devtoolset-2-eclipse-systemtap[a]
T he SystemT ap plug-in, which integrates SystemT ap with
Eclipse.
devtoolset-2-eclipse-valgrind[a]
T he Valgrind plug-in, which integrates Valgrind with Eclipse.
[a] This p ac kag e is ins talled as a d ep end enc y o f devtoolset-2-eclipse-linuxtools.
2.1. Installing Eclipse
In Red Hat Developer T oolset, the Eclipse development environment is provided as a collection of RPM
packages and is automatically installed with the devtoolset-2-ide package as described in Section 1.5,
“Installing Red Hat Developer T oolset”. For a list of available components, see T able 2.1, “Eclipse
Components Included in Red Hat Developer T oolset”.
25
Red Hat D eveloper Toolset 2.x User Guide
Note
T he Red Hat Developer T oolset version of Eclipse is only available for Red Hat Enterprise Linux
6 on 32-bit and 64-bit Intel and AMD architectures. T his version fully supports C, C++, and Java
development, but does not provide support for the Fortran programming language.
2.1.1. Building Eclipse from the Source RPM Packages
It is recommended that you install the Red Hat Developer T oolset version of Eclipse from the official
RPM packages distributed by Red Hat. If, for some reason, you need to build Red Hat Developer T oolset
2.0 Eclipse on Red Hat Enterprise Linux 6 from the supplied source RPM (SRPM) packages, complete
the following steps:
1. Install the java-1.7.0-openjdk package from Red Hat Enterprise Linux 6.3 or newer and all its
dependencies.
2. Download, build, and install the maven package and all its dependencies from the SRPM
packages for Fedora 19.
3. Download, build, and install the tycho package and all its dependencies from the SRPM packages
for Fedora 19.
4. Download and build all dependent packages listed in the devtoolset-2-eclipse SRPM package.
5. Download and build the devtoolset-2-eclipse SRPM package.
6. Download and build additional devtoolset-2-eclipse-* SRPM packages.
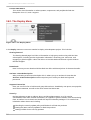
2.2. Using Eclipse
T o start the Red Hat Developer T oolset version of Eclipse, either select Applications →
Programming → DT S Eclipse from the panel, or type the following at a shell prompt:
scl enable devtoolset-2 'eclipse'
During its startup, Eclipse prompts you to select a workspace, that is, a directory in which you want to
store your projects. You can either use ~/workspace/, which is the default option, or click the Browse
button to browse your file system and select a custom directory. Additionally, you can select the Use
this as the default and do not ask again check box to prevent Eclipse from displaying this
dialog box the next time you run this development environment. When you are done, click the OK button
to confirm the selection and proceed with the startup.
2.2.1. Using the Red Hat Developer Toolset Toolchain
T o use the Red Hat Developer T oolset version of Eclipse with support for the GNU Compiler Collection
and binutils from Red Hat Developer T oolset, make sure that the devtoolset-2-toolchain package is
installed and run the application as described in Section 2.2, “Using Eclipse”. Red Hat Developer T oolset
Eclipse uses the Red Hat Developer T oolset toolchain by default.
For detailed instructions on how to install the devtoolset-2-toolchain package in your system, see
Section 1.5, “Installing Red Hat Developer T oolset”.
26
Chapter 2. Eclipse
Important
If you are working on a project that you previously built with the Red Hat Enterprise Linux version
of the GNU Compiler Collection, make sure that you discard all previous build results. T o do so,
open the project in Eclipse and select Project → Clean from the menu.
2.2.2. Using the Red Hat Enterprise Linux Toolchain
T o use the Red Hat Developer T oolset version of Eclipse with support for the toolchain distributed with
Red Hat Enterprise Linux, either uninstall devtoolset-2-gcc, devtoolset-2-binutils, and related packages
from your system, or change the configuration of the project to use absolute paths to the Red Hat
Enterprise Linux system versions of gcc, g++, and as.
T o uninstall the Red Hat Developer T oolset toolchain from the system, type the following at a shell
prompt as root:
yum remove devtoolset-2-gcc\* devtoolset-2-binutils\*
T o configure Eclipse to explicitly use the Red Hat Enterprise Linux system versions of the tools for the
current project, complete the following steps:
1. In the C/C++ perspective, choose Project → Properties from the main menu bar to open the
project properties.
2. In the menu on the left-hand side of the dialog box, click C/C++ Build → Settings.
3. Select the T ool Settings tab.
4. If you are working on a C project:
a. select GCC C Compiler or Cross GCC Compiler and change the value of the Com m and
field to:
/usr/bin/gcc
b. select GCC C Linker or Cross GCC Linker and change the value of the Com m and field
to:
/usr/bin/gcc
c. select GCC Assembler or Cross GCC Assembler and change the value of the
Com m and field to:
/usr/bin/as
If you are working on a C++ project:
a. select GCC C++ Compiler or Cross G++ Compiler and change the value of the
Com m and field to:
/usr/bin/g++
b. select GCC C Compiler or Cross GCC Compiler and change the value of the Com m and
field to:
27
Red Hat D eveloper Toolset 2.x User Guide
/usr/bin/gcc
c. select GCC C++ Linker or Cross G++ Linker and change the value of the Com m and field
to:
/usr/bin/g++
d. select GCC Assembler or Cross GCC Assembler and change the value of the
Com m and field to:
/usr/bin/as
5. Click the OK button to save the configuration changes.
2.3. Additional Resources
A detailed description of Eclipse and all its features is beyond the scope of this book. For more
information, see the resources listed below.
Installed Documentation
Eclipse includes a built-in Help system which provides extensive documentation for each integrated
feature and tool. T his greatly decreases the initial time investment required for new developers to
become fluent in its use. T he use of this Help section is detailed in the Red Hat Enterprise Linux
Developer Guide linked below.
Online Documentation
Red Hat Enterprise Linux 6 Developer Guide — T he Developer Guide for Red Hat Enterprise Linux 6
provides more information on Eclipse, including a description of the user interface, overview of
available development toolkits, or instructions on how to use it to build RPM packages.
See Also
Section A.1, “Changes in Eclipse” provides a comprehensive list of features and improvements over
the Red Hat Enterprise Linux system version of the Eclipse development environment.
Chapter 1, Red Hat Developer Toolset provides an overview of Red Hat Developer T oolset and more
information on how to install it on your system.
Chapter 3, GNU Compiler Collection (GCC) provides information on how to compile programs written
in C, C++, and Fortran on the command line.
28
Part III. D evelopment Tools
Part III. Development Tools
29
Red Hat D eveloper Toolset 2.x User Guide
Chapter 3. GNU Compiler Collection (GCC)
T he GNU Compiler Collection, commonly abbreviated GCC, is a portable compiler suite with support
for a wide selection of programming languages.
Red Hat Developer T oolset is distributed with GCC 4 .8. T his version is more recent than the version
included in Red Hat Enterprise Linux and provides numerous bug fixes and enhancements, including
optimization for various new Intel and AMD processors, support for OpenMP 3.1 and link-time
optimization. T his version also includes experimental support for the C++11 standard, C++11 atomic
types, and T ransactional Memory. For a detailed list of changes, see Section A.2, “Changes in GCC”.
3.1. GNU C Compiler
3.1.1. Installing the C Compiler
In Red Hat Developer T oolset, the GNU C compiler is provided by the devtoolset-2-gcc package and is
automatically installed with devtoolset-2-toolchain as described in Section 1.5, “Installing Red Hat
Developer T oolset”.
3.1.2. Using the C Compiler
T o compile a C program on the command line, run the gcc compiler as follows:
scl enable devtoolset-2 'gcc -o output_file source_file...'
T his creates a binary file named output_file in the current working directory. If the -o option is
omitted, the compiler creates a file named a.out by default.
When you are working on a project that consists of several source files, it is common to compile an
object file for each of the source files first and then link these object files together. T his way, when you
change a single source file, you can recompile only this file without having to compile the entire project.
T o compile an object file on the command line, run the following command:
scl enable devtoolset-2 'gcc -o object_file -c source_file'
T his creates an object file named object_file. If the -o option is omitted, the compiler creates a file
named after the source file with the .o file extension. T o link object files together and create a binary file,
run:
scl enable devtoolset-2 'gcc -o output_file object_file...'
Note that you can execute any command using the scl utility, causing it to be run with the Red Hat
Developer T oolset binaries used in preference to the Red Hat Enterprise Linux system equivalent. T his
allows you to run a shell session with Red Hat Developer T oolset gcc as default:
scl enable devtoolset-2 'bash'
30
Chapter 3. GNU Compiler Collection (GCC)
Note
T o verify the version of gcc you are using at any point, type the following at a shell prompt:
which gcc
Red Hat Developer T oolset's gcc executable path will begin with /opt. Alternatively, you can use
the following command to confirm that the version number matches that for Red Hat Developer
T oolset gcc:
gcc -v
Important
Some newer library features are statically linked into applications built with Red Hat Developer
T oolset to support execution on multiple versions of Red Hat Enterprise Linux. T his adds a small
additional security risk as normal Red Hat Enterprise Linux errata would not change this code. If
the need for developers to rebuild their applications due to such an issue arises, Red Hat will
signal this via a security erratum. Developers are strongly advised not to statically link their entire
application for the same reasons.
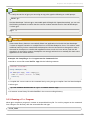
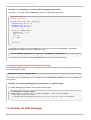
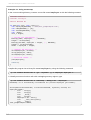
Example 3.1. Compiling a C Program on the Command Line
Consider a source file named hello.c with the following contents:
#include <stdio.h>
int main(int argc, char *argv[]) {
printf("Hello, World!\n");
return 0;
}
T o compile this source code on the command line by using the gcc compiler from Red Hat Developer
T oolset, type:
~]$ scl enable devtoolset-2 'gcc -o hello hello.c'
T his creates a new binary file called hello in the current working directory.
3.1.3. Running a C Program
When gcc compiles a program, it creates an executable binary file. T o run this program on the command
line, change to the directory with the executable file and type:
./file_name
31
Red Hat D eveloper Toolset 2.x User Guide
Example 3.2. Running a C Program on the Command Line
Assuming that you have successfully compiled the hello binary file as shown in Example 3.1,
“Compiling a C Program on the Command Line”, you can run it by typing the following at a shell
prompt:
~]$ ./hello
Hello, World!
3.2. GNU C++ Compiler
3.2.1. Installing the C++ Compiler
In Red Hat Developer T oolset, the GNU C++ compiler is provided by the devtoolset-2-gcc-c++ package
and is automatically installed with the devtoolset-2-toolchain package as described in Section 1.5,
“Installing Red Hat Developer T oolset”.
3.2.2. Using the C++ Compiler
T o compile a C++ program on the command line, run the g++ compiler as follows:
scl enable devtoolset-2 'g++ -o output_file source_file...'
T his creates a binary file named output_file in the current working directory. If the -o option is
omitted, the g++ compiler creates a file named a.out by default.
When you are working on a project that consists of several source files, it is common to compile an
object file for each of the source files first and then link these object files together. T his way, when you
change a single source file, you can recompile only this file without having to compile the entire project.
T o compile an object file on the command line, run the following command:
scl enable devtoolset-2 'g++ -o object_file -c source_file'
T his creates an object file named object_file. If the -o option is omitted, the g++ compiler creates a
file named after the source file with the .o file extension. T o link object files together and create a binary
file, run:
scl enable devtoolset-2 'g++ -o output_file object_file...'
Note that you can execute any command using the scl utility, causing it to be run with the Red Hat
Developer T oolset binaries used in preference to the Red Hat Enterprise Linux system equivalent. T his
allows you to run a shell session with Red Hat Developer T oolset g++ as default:
scl enable devtoolset-2 'bash'
32
Chapter 3. GNU Compiler Collection (GCC)
Note
T o verify the version of g++ you are using at any point, type the following at a shell prompt:
which g++
Red Hat Developer T oolset's g++ executable path will begin with /opt. Alternatively, you can use
the following command to confirm that the version number matches that for Red Hat Developer
T oolset g++:
g++ -v
Important
Some newer library features are statically linked into applications built with Red Hat Developer
T oolset to support execution on multiple versions of Red Hat Enterprise Linux. T his adds a small
additional security risk as normal Red Hat Enterprise Linux errata would not change this code. If
the need for developers to rebuild their applications due to such an issue arises, Red Hat will
signal this via a security erratum. Developers are strongly advised not to statically link their entire
application for the same reasons.
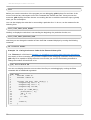
Example 3.3. Compiling a C++ Program on the Command Line
Consider a source file named hello.cpp with the following contents:
#include <iostream>
using namespace std;
int main(int argc, char *argv[]) {
cout << "Hello, World!" << endl;
return 0;
}
T o compile this source code on the command line by using the g++ compiler from Red Hat Developer
T oolset, type:
~]$ scl enable devtoolset-2 'g++ -o hello hello.cpp'
T his creates a new binary file called hello in the current working directory.
3.2.3. Running a C++ Program
When g++ compiles a program, it creates an executable binary file. T o run this program on the command
line, change to the directory with the executable file and type:
./file_name
33
Red Hat D eveloper Toolset 2.x User Guide
Example 3.4 . Running a C++ Program on the Command Line
Assuming that you have successfully compiled the hello binary file as shown in Example 3.3,
“Compiling a C++ Program on the Command Line”, you can run it by typing the following at a shell
prompt:
~]$ ./hello
Hello, World!
3.3. GNU Fortran Compiler
3.3.1. Installing the Fortran Compiler
In Red Hat Developer T oolset, the GNU Fortran compiler is provided by the devtoolset-2-gcc-gfortran
package and is automatically installed with devtoolset-2-toolchain as described in Section 1.5, “Installing
Red Hat Developer T oolset”.
3.3.2. Using the Fortran Compiler
T o compile a Fortran program on the command line, run the gfortran compiler as follows:
scl enable devtoolset-2 'gfortran -o output_file source_file...'
T his creates a binary file named output_file in the current working directory. If the -o option is
omitted, the compiler creates a file named a.out by default.
When you are working on a project that consists of several source files, it is common to compile an
object file for each of the source files first and then link these object files together. T his way, when you
change a single source file, you can recompile only this file without having to compile the entire project.
T o compile an object file on the command line, run the following command:
scl enable devtoolset-2 'gfortran -o object_file -c source_file'
T his creates an object file named object_file. If the -o option is omitted, the compiler creates a file
named after the source file with the .o file extension. T o link object files together and create a binary file,
run:
scl enable devtoolset-2 'gfortran -o output_file object_file...'
Note that you can execute any command using the scl utility, causing it to be run with the Red Hat
Developer T oolset binaries used in preference to the Red Hat Enterprise Linux system equivalent. T his
allows you to run a shell session with Red Hat Developer T oolset gfortran as default:
scl enable devtoolset-2 'bash'
34
Chapter 3. GNU Compiler Collection (GCC)
Note
T o verify the version of gfortran you are using at any point, type the following at a shell
prompt:
which gfortran
Red Hat Developer T oolset's gfortran executable path will begin with /opt. Alternatively, you
can use the following command to confirm that the version number matches that for Red Hat
Developer T oolset gfortran:
gfortran -v
Important
Some newer library features are statically linked into applications built with Red Hat Developer
T oolset to support execution on multiple versions of Red Hat Enterprise Linux. T his adds a small
additional security risk as normal Red Hat Enterprise Linux errata would not change this code. If
the need for developers to rebuild their applications due to such an issue arises, Red Hat will
signal this via a security erratum. Developers are strongly advised not to statically link their entire
application for the same reasons.
Example 3.5. Compiling a Fortran Program on the Command Line
Consider a source file named hello.f with the following contents:
program hello
print *, "Hello, World!"
end program hello
T o compile this source code on the command line by using the gfortran compiler from Red Hat
Developer T oolset, type:
~]$ scl enable devtoolset-2 'gfortran -o hello hello.f'
T his creates a new binary file called hello in the current working directory.
3.3.3. Running a Fortran Program
When gfortran compiles a program, it creates an executable binary file. T o run this program on the
command line, change to the directory with the executable file and type:
./file_name
35
Red Hat D eveloper Toolset 2.x User Guide
Example 3.6. Running a Fortran Program on the Command Line
Assuming that you have successfully compiled the hello binary file as shown in Example 3.5,
“Compiling a Fortran Program on the Command Line”, you can run it by typing the following at a shell
prompt:
~]$ ./hello
Hello, World!
3.4. Additional Resources
A detailed description of the GNU Compiler Collections and its features is beyond the scope of this book.
For more information, see the resources listed below.
Installed Documentation
gcc(1) — T he manual page for the gcc compiler provides detailed information on its usage; with few
exceptions, g++ accepts the same command line options as gcc. T o display the manual page for the
version included in Red Hat Developer T oolset, type:
scl enable devtoolset-2 'man gcc'
gfortran(1) — T he manual page for the gfortran compiler provides detailed information on its
usage. T o display the manual page for the version included in Red Hat Developer T oolset, type:
scl enable devtoolset-2 'man gfortran'
C++ Standard Library Documentation — Documentation on the C++ standard library can be optionally
installed by typing the following at a shell prompt as root:
yum install devtoolset-2-libstdc++-docs
Once installed, HT ML documentation is available at /opt/rh/devtoolset2/root/usr/share/doc/devtoolset-2-libstdc++-docs-4 .8.1/htm l/index.htm l.
Online Documentation
Red Hat Enterprise Linux 6 Developer Guide — T he Developer Guide for Red Hat Enterprise Linux 6
provides in-depth information about GCC.
Using the GNU Compiler Collection — T he official GCC manual provides an in-depth description of
the GNU compilers and their usage.
T he GNU C++ Library — T he GNU C++ library documentation provides detailed information about
the GNU implementation of the standard C++ library.
T he GNU Fortran Compiler — T he GNU Fortran compiler documentation provides detailed
information on gfortran's usage.
See Also
Section A.2, “Changes in GCC” provides a comprehensive list of features and improvements over the
Red Hat Enterprise Linux system version of the GNU Compiler Collection and the version distributed
36
Chapter 3. GNU Compiler Collection (GCC)
in the previous release of Red Hat Developer T oolset, as well as information about the language,
ABI, and debugging compatibility.
Chapter 1, Red Hat Developer Toolset provides an overview of Red Hat Developer T oolset and more
information on how to install it on your system.
Chapter 2, Eclipse provides a general introduction to the Eclipse development environment, and
describes how to use it with the tools from Red Hat Developer T oolset.
Chapter 4, binutils explains how to use the binutils, a collection of binary tools to inspect and
manipulate object files and binaries.
Chapter 5, elfutils explains how to use elfutils, a collection of binary tools to inspect and manipulate
ELF files.
Chapter 6, dwz explains how to use dwz to optimize DWARF debugging information contained in ELF
shared libraries and ELF executables for size.
Chapter 7, GNU Debugger (GDB) provides information on how to debug programs written in C, C++,
and Fortran.
37
Red Hat D eveloper Toolset 2.x User Guide
Chapter 4. binutils
binutils is a collection of various binary tools such as the GNU linker, GNU assembler, and other
utilities that allow you to inspect and manipulate object files and binaries. See T able 4.1, “T ools Included
in binutils for Red Hat Developer T oolset” for a complete list of binary tools that are distributed with the
Red Hat Developer T oolset version of binutils.
Red Hat Developer T oolset is distributed with binutils 2.23.52. T his version is more recent than the
version included in Red Hat Enterprise Linux and provides numerous bug fixes and enhancements,
including the new gold linker, several new command line options, improvements to the linker script
language, and support for link-time optimization, compressed debug sections, and new instruction sets.
For a detailed list of changes, see Section A.3, “Changes in binutils”.
T able 4 .1. T ools Included in binutils for Red Hat Developer T oolset
Name
Description
addr2line
T ranslates addresses into file names and line numbers.
ar
Creates, modifies, and extracts files from archives.
as
T he GNU assembler.
c++filt
Decodes mangled C++ symbols.
dwp
Combines DWARF object files into a single DWARF package file.
elfedit
Examines and edits ELF files.
gprof
Display profiling information.
ld
T he GNU linker.
ld.bfd
An alternative to the GNU linker.
ld.gold
A new ELF linker.
nm
Lists symbols from object files.
objcopy
Copies and translates object files.
objdum p
Displays information from object files.
ranlib
Generates an index to the contents of an archive to make access to this
archive faster.
readelf
Displays information about ELF files.
size
Lists section sizes of object or archive files.
strings
Displays printable character sequences in files.
strip
Discards all symbols from object files.
4.1. Installing binutils
In Red Hat Developer T oolset, binutils are provided by the devtoolset-2-binutils package and are
automatically installed with devtoolset-2-toolchain as described in Section 1.5, “Installing Red Hat
Developer T oolset”.
4.2. Using the GNU Assembler
T o produce an object file from an assembly language program, run the as tool as follows:
38
Chapter 4. binutils
scl enable devtoolset-2 'as [option...] -o object_file source_file'
T his creates an object file named object_file in the current working directory.
Note that you can execute any command using the scl utility, causing it to be run with the Red Hat
Developer T oolset binaries used in preference to the Red Hat Enterprise Linux system equivalent. T his
allows you to run a shell session with Red Hat Developer T oolset as as default:
scl enable devtoolset-2 'bash'
Note
T o verify the version of as you are using at any point, type the following at a shell prompt:
which as
Red Hat Developer T oolset's as executable path will begin with /opt. Alternatively, you can use
the following command to confirm that the version number matches that for Red Hat Developer
T oolset as:
as -v
4.3. Using the GNU Linker
T o create an executable binary file or a library from object files, run the ld tool as follows:
scl enable devtoolset-2 'ld [option...] -o output_file object_file...'
T his creates a binary file named output_file in the current working directory. If the -o option is
omitted, the compiler creates a file named a.out by default.
Note that you can execute any command using the scl utility, causing it to be run with the Red Hat
Developer T oolset binaries used in preference to the Red Hat Enterprise Linux system equivalent. T his
allows you to run a shell session with Red Hat Developer T oolset ld as default:
scl enable devtoolset-2 'bash'
39
Red Hat D eveloper Toolset 2.x User Guide
Note
T o verify the version of ld you are using at any point, type the following at a shell prompt:
which ld
Red Hat Developer T oolset's ld executable path will begin with /opt. Alternatively, you can use
the following command to confirm that the version number matches that for Red Hat Developer
T oolset ld:
ld -v
4.4. Using Other Binary Tools
T he binutils provide many binary tools other than a linker and assembler. For a complete list of these
tools, see T able 4.1, “T ools Included in binutils for Red Hat Developer T oolset”.
T o execute any of the tools that are part of binutils, run the command as follows:
scl enable devtoolset-2 'tool [option...] file_name'
See T able 4.1, “T ools Included in binutils for Red Hat Developer T oolset” for a list of tools that are
distributed with binutils. For example, to use the objdum p tool to inspect an object file, type:
scl enable devtoolset-2 'objdump [option...] object_file'
Note that you can execute any command using the scl utility, causing it to be run with the Red Hat
Developer T oolset binaries used in preference to the Red Hat Enterprise Linux system equivalent. T his
allows you to run a shell session with Red Hat Developer T oolset binary tools as default:
scl enable devtoolset-2 'bash'
Note
T o verify the version of binutils you are using at any point, type the following at a shell prompt:
which objdump
Red Hat Developer T oolset's objdum p executable path will begin with /opt. Alternatively, you
can use the following command to confirm that the version number matches that for Red Hat
Developer T oolset objdum p:
objdump -v
4.5. Additional Resources
40
Chapter 4. binutils
A detailed description of binutils is beyond the scope of this book. For more information, see the
resources listed below.
Installed Documentation
as(1), ld(1), addr2line(1), ar(1), c++filt(1), dwp(1), elfedit(1), gprof(1), nm(1), objcopy(1),
objdump(1), ranlib(1), readelf(1), size(1), strings(1), strip(1), — Manual pages for various
binutils tools provide more information about their respective usage. T o display a manual page for
the version included in Red Hat Developer T oolset, type:
scl enable devtoolset-2 'man tool'
Online Documentation
Documentation for binutils — T he binutils documentation provides an in-depth description of the
binary tools and their usage.
See Also
Section A.3, “Changes in binutils” provides a comprehensive list of features and improvements over
the Red Hat Enterprise Linux system version of binutils and the version distributed in the previous
release of Red Hat Developer T oolset.
Chapter 1, Red Hat Developer Toolset provides an overview of Red Hat Developer T oolset and more
information on how to install it on your system.
Chapter 5, elfutils explains how to use elfutils, a collection of binary tools to inspect and manipulate
ELF files.
Chapter 3, GNU Compiler Collection (GCC) provides information on how to compile programs written
in C, C++, and Fortran.
41
Red Hat D eveloper Toolset 2.x User Guide
Chapter 5. elfutils
elfutils is a collection of various binary tools such as eu-objdum p, eu-readelf, and other utilities
that allow you to inspect and manipulate ELF files. See T able 5.1, “T ools Included in elfutils for Red Hat
Developer T oolset” for a complete list of binary tools that are distributed with the Red Hat Developer
T oolset version of elfutils.
Red Hat Developer T oolset is distributed with elfutils 0.155. T his version is more recent than the
version included in Red Hat Enterprise Linux and provides numerous bug fixes and enhancements.
T able 5.1. T ools Included in elfutils for Red Hat Developer T oolset
Name
Description
eu-addr2line
T ranslates addresses into file names and line numbers.
eu-ar
Creates, modifies, and extracts files from archives.
eu-elfcm p
Compares relevant parts of two ELF files for equality.
eu-elflint
Verifies that ELF files are compliant with the generic ABI (gABI) and
processor-specific supplement ABI (psABI) specification.
eu-findtextrel
Locates the source of text relocations in files.
eu-m ake-debugarchive
Creates an offline archive for debugging.
eu-nm
Lists symbols from object files.
eu-objdum p
Displays information from object files.
eu-ranlib
Generates an index to the contents of an archive to make access to this
archive faster.
eu-readelf
Displays information about ELF files.
eu-size
Lists section sizes of object or archive files.
eu-strings
Displays printable character sequences in files.
eu-strip
Discards all symbols from object files.
eu-unstrip
Combines stripped files with separate symbols and debug information.
5.1. Installing elfutils
In Red Hat Developer T oolset, elfutils is provided by the devtoolset-2-elfutils package and is
automatically installed with devtoolset-2-toolchain as described in Section 1.5, “Installing Red Hat
Developer T oolset”.
5.2. Using elfutils
T o execute any of the tools that are part of elfutils, run the command as follows:
scl enable devtoolset-2 'tool [option...] file_name'
See T able 5.1, “T ools Included in elfutils for Red Hat Developer T oolset” for a list of tools that are
distributed with elfutils. For example, to use the eu-objdum p tool to inspect an object file, type:
scl enable devtoolset-2 'eu-objdump [option...] object_file'
42
Chapter 5. elfutils
Note that you can execute any command using the scl utility, causing it to be run with the Red Hat
Developer T oolset binaries used in preference to the Red Hat Enterprise Linux system equivalent. T his
allows you to run a shell session with Red Hat Developer T oolset binary tools as default:
scl enable devtoolset-2 'bash'
Note
T o verify the version of elfutils you are using at any point, type the following at a shell prompt:
which eu-objdump
Red Hat Developer T oolset's eu-objdum p executable path will begin with /opt. Alternatively,
you can use the following command to confirm that the version number matches that for Red Hat
Developer T oolset eu-objdum p:
eu-objdump -V
5.3. Additional Resources
A detailed description of elfutils is beyond the scope of this book. For more information, see the
resources listed below.
See Also
Section A.4, “Changes in elfutils” provides a comprehensive list of features and improvements over
the Red Hat Enterprise Linux system version of elfutils and the version distributed in the previous
release of Red Hat Developer T oolset.
Chapter 1, Red Hat Developer Toolset provides an overview of Red Hat Developer T oolset and more
information on how to install it on your system.
Chapter 3, GNU Compiler Collection (GCC) provides information on how to compile programs written
in C, C++, and Fortran.
Chapter 4, binutils explains how to use the binutils, a collection of binary tools to inspect and
manipulate object files and binaries.
Chapter 6, dwz explains how to use dwz to optimize DWARF debugging information contained in ELF
shared libraries and ELF executables for size.
43
Red Hat D eveloper Toolset 2.x User Guide
Chapter 6. dwz
dwz is a command line tool that attempts to optimize DWARF debugging information contained in ELF
shared libraries and ELF executables for size. T o do so, dwz replaces DWARF information
representation with equivalent smaller representation where possible, and reduces the amount of
duplication by using techniques from Appendix E of the DWARF Standard.
Red Hat Developer T oolset is distributed with dwz 0.11.
6.1. Installing dwz
In Red Hat Developer T oolset, the dwz utility is provided by the devtoolset-2-dwz package and is
automatically installed with devtoolset-2-toolchain as described in Section 1.5, “Installing Red Hat
Developer T oolset”.
6.2. Using dwz
T o optimize DWARF debugging information in a binary file, run the dwz tool as follows:
scl enable devtoolset-2 'dwz [option...] file_name'
Note that you can execute any command using the scl utility, causing it to be run with the Red Hat
Developer T oolset binaries used in preference to the Red Hat Enterprise Linux system equivalent. T his
allows you to run a shell session with Red Hat Developer T oolset dwz as default:
scl enable devtoolset-2 'bash'
Note
T o verify the version of dwz you are using at any point, type the following at a shell prompt:
which dwz
Red Hat Developer T oolset's dwz executable path will begin with /opt. Alternatively, you can use
the following command to confirm that the version number matches that for Red Hat Developer
T oolset dwz:
dwz -v
6.3. Additional Resources
A detailed description of dwz and its features is beyond the scope of this book. For more information,
see the resources listed below.
Installed Documentation
dwz(1) — T he manual page for the dwz utility provides detailed information on its usage. T o display
the manual page for the version included in Red Hat Developer T oolset, type:
44
Chapter 6. dwz
scl enable devtoolset-2 'man dwz'
See Also
Section A.5, “Changes in dwz” provides a comprehensive list of features and enhancements over the
version of dwz distributed in the previous release of Red Hat Developer T oolset.
Chapter 1, Red Hat Developer Toolset provides an overview of Red Hat Developer T oolset and more
information on how to install it on your system.
Chapter 3, GNU Compiler Collection (GCC) provides information on how to compile programs written
in C, C++, and Fortran.
Chapter 4, binutils explains how to use the binutils, a collection of binary tools to inspect and
manipulate object files and binaries.
Chapter 5, elfutils explains how to use elfutils, a collection of binary tools to inspect and manipulate
ELF files.
45
Red Hat D eveloper Toolset 2.x User Guide
Part IV. Debugging Tools
46
Chapter 7. GNU D ebugger (GD B)
Chapter 7. GNU Debugger (GDB)
T he GNU Debugger, commonly abbreviated as GDB, is a command line tool that can be used to debug
programs written in various programming languages. It allows you to inspect memory within the code
being debugged, control the execution state of the code, detect the execution of particular sections of
code, and much more.
Red Hat Developer T oolset is distributed with GDB 7.6. T his version is more recent than the version
included in Red Hat Enterprise Linux and provides numerous bug fixes and enhancements, including
improved support for Python scripting, ambiguous line specifications, and tracepoints, as well as
improved inferior control commands and handling of C++ debugee executables. For a detailed list of
changes, see Section A.6, “Changes in GDB”.
7.1. Installing the GNU Debugger
In Red Hat Developer T oolset, the GNU Debugger is provided by the devtoolset-2-gdb package and is
automatically installed with devtoolset-2-toolchain as described in Section 1.5, “Installing Red Hat
Developer T oolset”.
7.2. Preparing a Program for Debugging
Compiling Programs with Debugging Information
T o compile a C program with debugging information that can be read by the GNU Debugger, make sure
the gcc compiler is run with the -g option. T o do so on the command line, use a command in the
following form:
scl enable devtoolset-2 'gcc -g -o output_file input_file...'
Similarly, to compile a C++ program with debugging information, run:
scl enable devtoolset-2 'g++ -g -o output_file input_file...'
47
Red Hat D eveloper Toolset 2.x User Guide
Example 7.1. Compiling a C Program With Debugging Information
Consider a source file named fibonacci.c that has the following contents:
#include <stdio.h>
#include <limits.h>
int main (int argc,
unsigned long int
unsigned long int
unsigned long int
char *argv[]) {
a = 0;
b = 1;
sum;
while (b < LONG_MAX) {
printf("%ld ", b);
sum = a + b;
a = b;
b = sum;
}
return 0;
}
T o compile this program on the command line using GCC from Red Hat Developer T oolset with
debugging information for the GNU Debugger, type:
~]$ scl enable devtoolset-2 'gcc -g -o fibonacci fibonacci.c'
T his creates a new binary file called fibonacci in the current working directory.
Installing Debugging Information for Existing Packages
T o install debugging information for a package that is already installed on the system, type the following
at a shell prompt as root:
debuginfo-install package_name
Note that the yum-utils package must be installed for the debuginfo-install utility to be available on
your system.
Example 7.2. Installing Debugging Information for the glibc Package
T o install debugging information for the glibc package, type:
~]# debuginfo-install glibc
Loaded plugins: product-id, refresh-packagekit, subscription-manager
--> Running transaction check
---> Package glibc-debuginfo.x86_64 0:2.12-1.47.el6_2.5 will be installed
...
7.3. Running the GNU Debugger
48
Chapter 7. GNU D ebugger (GD B)
T o run the GNU Debugger on a program you want to debug, type the following at a shell prompt:
scl enable devtoolset-2 'gdb file_name'
T his starts the gdb debugger in interactive mode and displays the default prompt, (gdb). T o quit the
debugging session and return to the shell prompt, run the following command at any time:
quit
Note that you can execute any command using the scl utility, causing it to be run with the Red Hat
Developer T oolset binaries used in preference to the Red Hat Enterprise Linux system equivalent. T his
allows you to run a shell session with Red Hat Developer T oolset gdb as default:
scl enable devtoolset-2 'bash'
Note
T o verify the version of gdb you are using at any point, type the following at a shell prompt:
which gdb
Red Hat Developer T oolset's gdb executable path will begin with /opt. Alternatively, you can use
the following command to confirm that the version number matches that for Red Hat Developer
T oolset gdb:
gdb -v
Example 7.3. Running the gdb Utility on the fibonacci Binary File
Assuming that you have successfully compiled the fibonacci binary file as shown in Example 7.1,
“Compiling a C Program With Debugging Information”, you can start debugging it with gdb by typing
the following at a shell prompt:
~]$ scl enable devtoolset-2 'gdb fibonacci'
GNU gdb (GDB) Red Hat Enterprise Linux (7.4.50.20120120-43.el6)
Copyright (C) 2012 Free Software Foundation, Inc.
License GPLv3+: GNU GPL version 3 or later <http://gnu.org/licenses/gpl.html>
This is free software: you are free to change and redistribute it.
There is NO WARRANTY, to the extent permitted by law. Type "show copying"
and "show warranty" for details.
This GDB was configured as "x86_64-redhat-linux-gnu".
For bug reporting instructions, please see:
<http://www.gnu.org/software/gdb/bugs/>.
(gdb)
7.4. Listing Source Code
T o view the source code of the program you are debugging, run the following command:
49
Red Hat D eveloper Toolset 2.x User Guide
list
Before you start the execution of the program you are debugging, gdb displays first ten lines of the
source code and any subsequent use of this command lists another ten lines. Once you start the
execution, gdb displays the lines that are surrounding the line on which the execution stops, typically
when you set a breakpoint.
You can also display the code that is surrounding a particular line. T o do so, run the command in the
following form:
list [file_name:]line_number
Similarly, to display the code that is surrounding the beginning of a particular function, run:
list [file_name:]function_name
Note that you can change the number of lines the list command displays by running the following
command:
set listsize number
Example 7.4 . Listing the Source Code of the fibonacci Binary File
T he fibonacci.c file listed in Example 7.1, “Compiling a C Program With Debugging Information”
has exactly 17 lines. Assuming that you have compiled it with debugging information and you want the
gdb utility to be capable of listing the entire source code, you can run the following command to
change the number of listed lines to 20:
(gdb) set listsize 20
You can now display the entire source code of the file you are debugging by running the list
command with no additional arguments:
(gdb) list
1
#include <stdio.h>
2
#include <limits.h>
3
4
int main (int argc, char *argv[]) {
5
unsigned long int a = 0;
6
unsigned long int b = 1;
7
unsigned long int sum;
8
9
while (b < LONG_MAX) {
10
printf("%ld ", b);
11
sum = a + b;
12
a = b;
13
b = sum;
14
}
15
16
return 0;
17
}
50
Chapter 7. GNU D ebugger (GD B)
7.5. Setting Breakpoints
Setting a New Breakpoint
T o set a new breakpoint at a certain line, run the following command:
break [file_name:]line_number
You can also set a breakpoint on a certain function:
break [file_name:]function_name
Example 7.5. Setting a New Breakpoint
Assuming that you have compiled the fibonacci.c file listed in Example 7.1, “Compiling a C
Program With Debugging Information” with debugging information, you can set a new breakpoint at
line 10 by running the following command:
(gdb) break 10
Breakpoint 1 at 0x4004e5: file fibonacci.c, line 10.
Listing Breakpoints
T o display a list of currently set breakpoints, run the following command:
info breakpoints
Example 7.6. Listing Breakpoints
Assuming that you have followed the instructions in Example 7.5, “Setting a New Breakpoint”, you can
display the list of currently set breakpoints by running the following command:
(gdb) info breakpoints
Num
Type
Disp Enb Address
What
1
breakpoint
keep y
0x00000000004004e5 in main at fibonacci.c:10
Deleting Existing Breakpoints
T o delete a breakpoint that is set at a certain line, run the following command:
clear line_number
Similarly, to delete a breakpoint that is set on a certain function, run:
clear function_name
You can also delete all breakpoints at once. T o do so, run the clear command with no additional
arguments:
51
Red Hat D eveloper Toolset 2.x User Guide
clear
Example 7.7. Deleting an Existing Breakpoint
Assuming that you have compiled the fibonacci.c file listed in Example 7.1, “Compiling a C
Program With Debugging Information” with debugging information, you can set a new breakpoint at
line 7 by running the following command:
(gdb) break 7
Breakpoint 2 at 0x4004e3: file fibonacci.c, line 7.
T o remove this breakpoint, type:
(gdb) clear 7
Deleted breakpoint 2
7.6. Starting Execution
T o start execution of the program you are debugging, run the following command:
run
If the program accepts any command line arguments, you can provide them as arguments to the run
command:
run argument…
T he execution stops when a first breakpoint (if any) is reached, when an error occurs, or when the
program terminates.
Example 7.8. Executing the fibonacci Binary File
Assuming that you have followed the instructions in Example 7.5, “Setting a New Breakpoint”, you can
execute the fibonacci binary file by running the following command:
(gdb) run
Starting program: /home/john/fibonacci
Breakpoint 1, main (argc=1, argv=0x7fffffffe4d8) at fibonacci.c:10
10
printf("%ld ", b);
7.7. Displaying Current Values
T he gdb utility allows you to display the value of almost anything that is relevant to the program, from a
variable of any complexity to a valid expression or even a library function. However, the most common
task is to display the value of a variable.
T o display the current value of a certain variable, run the following command:
52
Chapter 7. GNU D ebugger (GD B)
print variable_name
Example 7.9. Displaying the Current Values of Variables
Assuming that you have followed the instructions in Example 7.8, “Executing the fibonacci Binary File”
and the execution of the fibonacci binary stopped after reaching the breakpoint at line 10, you can
display the current values of variables a and b as follows:
(gdb) print a
$1 = 0
(gdb) print b
$2 = 1
7.8. Continuing Execution
T o resume the execution of the program you are debugging after it reached a breakpoint, run the
following command:
continue
T he execution stops again when another breakpoint is reached. T o skip a certain number of breakpoints
(typically when you are debugging a loop), you can run the continue command in the following form:
continue number
T he gdb utility also allows you to stop the execution after executing a single line of code. T o do so, run:
step
Finally, you can execute a certain number of lines by using the step command in the following form:
step number
53
Red Hat D eveloper Toolset 2.x User Guide
Example 7.10. Continuing the Execution of the fibonacci Binary File
Assuming that you have followed the instructions in Example 7.8, “Executing the fibonacci Binary File”
and the execution of the fibonacci binary stopped after reaching the breakpoint at line 10, you can
resume the execution by running the following command:
(gdb) continue
Continuing.
Breakpoint 1, main (argc=1, argv=0x7fffffffe4d8) at fibonacci.c:10
10
printf("%ld ", b);
T he execution stops the next time the breakpoint is reached. T o execute next three lines of code,
type:
(gdb) step 3
13
b = sum;
T his allows you to verify the current value of the sum variable before it is assigned to b:
(gdb) print sum
$3 = 2
7.9. Additional Resources
A detailed description of the GNU Debugger and all its features is beyond the scope of this book. For
more information, see the resources listed below.
Online Documentation
Red Hat Enterprise Linux 6 Developer Guide — T he Developer Guide for Red Hat Enterprise Linux 6
provides more information on the GNU Debugger and debugging.
GDB Documentation — T he official GDB documentation includes the GDB User Manual and other
reference material.
See Also
Section A.6, “Changes in GDB” provides a comprehensive list of features and improvements over the
Red Hat Enterprise Linux system version of the GNU Debugger and the version distributed in the
previous release of Red Hat Developer T oolset.
Chapter 1, Red Hat Developer Toolset provides an overview of Red Hat Developer T oolset and more
information on how to install it on your system.
Chapter 2, Eclipse provides a general introduction to the Eclipse development environment, and
describes how to use it with the tools from Red Hat Developer T oolset.
Chapter 3, GNU Compiler Collection (GCC) provides further information on how to compile programs
written in C, C++, and Fortran.
Chapter 8, strace documents how to use the strace utility to monitor system calls that a program
uses and signals it receives.
Chapter 9, memstomp documents how to use the memstomp utility to identify calls to library functions
with overlapping memory regions that are not allowed by various standards.
54
Chapter 7. GNU D ebugger (GD B)
55
Red Hat D eveloper Toolset 2.x User Guide
Chapter 8. strace
strace is a diagnostic and debugging tool for the command line that can be used to trace system calls
that are made and received by a running process. It records the name of each system call, its
arguments, and its return value, as well as signals received by the process and other interactions with
the kernel, and prints this record to standard error output or a selected file.
Red Hat Developer T oolset is distributed with strace 4 .7.
8.1. Installing strace
In Red Hat Enterprise Linux, the strace utility is provided by the devtoolset-2-strace package and is
automatically installed with devtoolset-2-toolchain as described in Section 1.5, “Installing Red Hat
Developer T oolset”.
8.2. Using strace
T o run the strace utility on a program you want to analyze, type the following at a shell prompt:
scl enable devtoolset-2 'strace program [argument...]'
Replace program with the name of the program you want to analyze, and argument with any command
line options and arguments you want to supply to this program. Alternatively, you can run the utility on an
already running process by using the -p command line option followed by the process ID:
scl enable devtoolset-2 'strace -p process_id'
Note that you can execute any command using the scl utility, causing it to be run with the Red Hat
Developer T oolset binaries used in preference to the Red Hat Enterprise Linux system equivalent. T his
allows you to run a shell session with Red Hat Developer T oolset strace as default:
scl enable devtoolset-2 'bash'
Note
T o verify the version of strace you are using at any point, type the following at a shell prompt:
which strace
Red Hat Developer T oolset's strace executable path will begin with /opt. Alternatively, you can
use the following command to confirm that the version number matches that for Red Hat
Developer T oolset strace:
strace -V
8.2.1. Redirecting Output to a File
By default, strace prints the name of each system call, its arguments and the return value to standard
error output. T o redirect this output to a file, use the -o command line option followed by the file name:
56
Chapter 8. strace
scl enable devtoolset-2 'strace -o file_name program [argument...]'
Replace file_name with the name of the file.
Example 8.1. Redirecting Output to a File
Consider a slightly modified version of the fibonacci file from Example 7.1, “Compiling a C Program
With Debugging Information”. T his executable file displays the Fibonacci sequence and optionally
allows you to specify how many members of this sequence to list. T o run the strace utility on this file
and redirect the trace output to fibonacci.log, type:
~]$ scl enable devtoolset-2 'strace -o fibonacci.log ./fibonacci 20'
1 1 2 3 5 8 13 21 34 55 89 144 233 377 610 987 1597 2584 4181 6765
T his creates a new plain-text file called fibonacci.log in the current working directory.
8.2.2. Tracing Selected System Calls
T o trace only a selected set of system calls, run the strace utility with the -e command line option:
scl enable devtoolset-2 'strace -e expression program [argument...]'
Replace expression with a comma-separated list of system calls to trace or any of the keywords listed
in T able 8.1, “Commonly Used Values of the -e Option”. For a detailed description of all available values,
see the strace(1) manual page.
T able 8.1. Commonly Used Values of the -e Option
Value
Description
file
System calls that accept a file name as an argument.
process
System calls that are related to process management.
network
System calls that are related to networking.
signal
System calls that are related to signal management.
ipc
System calls that are related to inter-process communication (IPC).
desc
System calls that are related to file descriptors.
57
Red Hat D eveloper Toolset 2.x User Guide
Example 8.2. T racing Selected System Calls
Consider the em ployee file from Example 9.1, “Using memstomp”. T o run the strace utility on this
executable file and trace only the m m ap and m unm ap system calls, type:
~]$ scl enable devtoolset-2 'strace -e mmap,munmap ./employee'
mmap(NULL, 4096, PROT_READ|PROT_WRITE, MAP_PRIVATE|MAP_ANONYMOUS, -1, 0) =
0x7f896c744000
mmap(NULL, 61239, PROT_READ, MAP_PRIVATE, 3, 0) = 0x7f896c735000
mmap(0x3146a00000, 3745960, PROT_READ|PROT_EXEC, MAP_PRIVATE|MAP_DENYWRITE, 3,
0) = 0x3146a00000
mmap(0x3146d89000, 20480, PROT_READ|PROT_WRITE,
MAP_PRIVATE|MAP_FIXED|MAP_DENYWRITE, 3, 0x189000) = 0x3146d89000
mmap(0x3146d8e000, 18600, PROT_READ|PROT_WRITE,
MAP_PRIVATE|MAP_FIXED|MAP_ANONYMOUS, -1, 0) = 0x3146d8e000
mmap(NULL, 4096, PROT_READ|PROT_WRITE, MAP_PRIVATE|MAP_ANONYMOUS, -1, 0) =
0x7f896c734000
mmap(NULL, 4096, PROT_READ|PROT_WRITE, MAP_PRIVATE|MAP_ANONYMOUS, -1, 0) =
0x7f896c733000
mmap(NULL, 4096, PROT_READ|PROT_WRITE, MAP_PRIVATE|MAP_ANONYMOUS, -1, 0) =
0x7f896c732000
munmap(0x7f896c735000, 61239)
= 0
mmap(NULL, 4096, PROT_READ|PROT_WRITE, MAP_PRIVATE|MAP_ANONYMOUS, -1, 0) =
0x7f896c743000
John,[email protected],
+++ exited with 0 +++
8.2.3. Displaying Time Stamps
T o prefix each line of the trace with the exact time of the day in hours, minutes, and seconds, run the
strace utility with the -t command line option:
scl enable devtoolset-2 'strace -t program [argument...]'
T o also display milliseconds, supply the -t option twice:
scl enable devtoolset-2 'strace -tt program [argument...]'
T o prefix each line of the trace with the time required to execute the respective system call, use the -r
command line option:
scl enable devtoolset-2 'strace -r program [argument...]'
58
Chapter 8. strace
Example 8.3. Displaying T ime Stamps
Consider an executable file named pwd. T o run the strace utility on this file and include time stamps
in the output, type:
~]$ scl enable devtoolset-2 'strace -tt ./pwd'
19:43:28.011815 execve("./pwd", ["./pwd"], [/* 36 vars */]) = 0
19:43:28.012128 brk(0)
= 0xcd3000
19:43:28.012174 mmap(NULL, 4096, PROT_READ|PROT_WRITE,
MAP_PRIVATE|MAP_ANONYMOUS, -1, 0) = 0x7fc869cb0000
19:43:28.012427 open("/etc/ld.so.cache", O_RDONLY) = 3
19:43:28.012446 fstat(3, {st_mode=S_IFREG|0644, st_size=61239, ...}) = 0
19:43:28.012464 mmap(NULL, 61239, PROT_READ, MAP_PRIVATE, 3, 0) =
0x7fc869ca1000
19:43:28.012483 close(3)
= 0
...
19:43:28.013410 +++ exited with 0 +++
8.2.4. Displaying a Summary
T o display a summary of how much time was required to execute each system call, how many times
were these system calls executed, and how many errors were encountered during their execution, run
the strace utility with the -c command line option:
scl enable devtoolset-2 'strace -c program [argument...]'
Example 8.4 . Displaying a Summary
Consider an executable file named lsblk. T o run the strace utility on this file and display a trace
summary, type:
~]$ scl enable devtoolset-2 'strace -c ./lsblk > /dev/null'
% time
seconds usecs/call
calls
errors syscall
------ ----------- ----------- --------- --------- ---------------80.88
0.000055
1
106
16 open
19.12
0.000013
0
140
munmap
0.00
0.000000
0
148
read
0.00
0.000000
0
1
write
0.00
0.000000
0
258
close
0.00
0.000000
0
37
2 stat
...
------ ----------- ----------- --------- --------- ---------------100.00
0.000068
1790
35 total
8.3. Additional Resources
A detailed description of strace and its features is beyond the scope of this book. For more information,
see the resources listed below.
Installed Documentation
59
Red Hat D eveloper Toolset 2.x User Guide
strace(1) — T he manual page for the strace utility provides detailed information about its usage.
T o display the manual page for the version included in Red Hat Developer T oolset, type:
scl enable devtoolset-2 'man strace'
See Also
Section A.7, “Changes in strace” provides a comprehensive list of features and improvements over
the Red Hat Enterprise Linux system version of strace.
Chapter 1, Red Hat Developer Toolset provides an overview of Red Hat Developer T oolset and more
information on how to install it on your system.
Chapter 7, GNU Debugger (GDB) provides information on how to debug programs written in C, C++,
and Fortran.
Chapter 9, memstomp documents how to use the memstomp utility to identify calls to library functions
with overlapping memory regions that are not allowed by various standards.
60
Chapter 9. memstomp
Chapter 9. memstomp
memstomp is a command line tool that can be used to identify function calls with overlapping memory
regions in situations when such an overlap is not permitted by various standards. It intercepts calls to
the library functions listed in T able 9.1, “Function Calls Inspected by memstomp” and for each memory
overlap, it displays a detailed backtrace to help you debug the problem.
Similarly to Valgrind, the m em stom p utility inspects applications without the need to recompile them.
However, it is much faster than this tool and therefore serves as a convenient alternative to it.
Red Hat Developer T oolset is distributed with memstomp 0.1.4 .
61
Red Hat D eveloper Toolset 2.x User Guide
T able 9.1. Function Calls Inspected by memstomp
Function
Description
m em cpy
Copies n bytes from one memory area to another and returns a pointer to
the second memory area.
m em ccpy
Copies a maximum of n bytes from one memory area to another and stops
when a certain character is found. It either returns a pointer to the byte
following the last written byte, or NULL if the given character is not found.
m em pcpy
Copies n bytes from one memory area to another and returns a pointer to
the byte following the last written byte.
strcpy
Copies a string from one memory area to another and returns a pointer to
the second string.
stpcpy
Copies a string from one memory area to another and returns a pointer to
the terminating null byte of the second string.
strncpy
Copies a maximum of n characters from one string to another and returns a
pointer to the second string.
stpncpy
Copies a maximum of n characters from one string to another. It either
returns a pointer to the terminating null byte of the second string, or if the
string is not null-terminated, a pointer to the byte following the last written
byte.
strcat
Appends one string to another while overwriting the terminating null byte of
the second string and adding a new one at its end. It returns a pointer to the
new string.
strncat
Appends a maximum of n characters from one string to another while
overwriting the terminating null byte of the second string and adding a new
one at its end. It returns a pointer to the new string.
wm em cpy
T he wide-character equivalent of the m em cpy() function that copies n wide
characters from one array to another and returns a pointer to the second
array.
wm em pcpy
T he wide-character equivalent of the m em pcpy() function that copies n
wide characters from one array to another and returns a pointer to the byte
following the last written wide character.
wcscpy
T he wide-character equivalent of the strcpy() function that copies a widecharacter string from one array to another and returns a pointer to the
second array.
wcsncpy
T he wide-character equivalent of the strncpy() function that copies a
maximum of n wide characters from one array to another and returns a
pointer to the second string.
wcscat
T he wide-character equivalent of the strcat() function that appends one
wide-character string to another while overwriting the terminating null byte of
the second string and adding a new one at its end. It returns a pointer to the
new string.
wcsncat
T he wide-character equivalent of the strncat() function that appends a
maximum of n wide characters from one array to another while overwriting
the terminating null byte of the second wide-character string and adding a
new one at its end. It returns a pointer to the new string.
62
Chapter 9. memstomp
9.1. Installing memstomp
In Red Hat Developer T oolset, the m em stom p utility is provided by the devtoolset-2-memstomp package
and is automatically installed with devtoolset-2-toolchain as described in Section 1.5, “Installing Red Hat
Developer T oolset”.
9.2. Using memstomp
T o run the m em stom p utility on a program you want to analyze, type the following at a shell prompt:
scl enable devtoolset-2 'memstomp program [argument...]'
T o immediately terminate the analyzed program when a problem is detected, run the utility with the -kill (or -k for short) command line option:
scl enable devtoolset-2 'memstomp --kill program [argument...]'
T he use of the --kill option is especially recommended if you are analyzing a multi-threaded program;
the internal implementation of backtraces is not thread-safe and running the m em stom p utility on a multithreaded program without this command line option can therefore produce unreliable results.
Additionally, if you have compiled the analyzed program with the debugging information or this debugging
information is available to you, you can use the --debug-info (or -d) command line option to produce
a more detailed backtrace:
scl enable devtoolset-2 'memstomp --debug-info program [argument...]'
For detailed instructions on how to compile your program with the debugging information built in the
binary file, see Section 7.2, “Preparing a Program for Debugging”. For information on how to install
debugging information for any of the Red Hat Developer T oolset packages, see Section 1.5.4, “Installing
Debugging Information”.
Note that you can execute any command using the scl utility, causing it to be run with the Red Hat
Developer T oolset binaries used in preference to the Red Hat Enterprise Linux system equivalent. T his
allows you to run a shell session with Red Hat Developer T oolset m em stom p as default:
scl enable devtoolset-2 'bash'
63
Red Hat D eveloper Toolset 2.x User Guide
Example 9.1. Using memstomp
In the current working directory, create a source file named em ployee.c with the following contents:
#include <stdio.h>
#include <string.h>
#define BUFSIZE 80
int main(int argc, char *argv[]) {
char employee[BUFSIZE] = "John,Doe,[email protected]";
char name[BUFSIZE] = {0};
char surname[BUFSIZE] = {0};
char *email;
size_t length;
/* Extract the information: */
memccpy(name, employee, ',', BUFSIZE);
length = strlen(name);
memccpy(surname, employee + length, ',', BUFSIZE);
length += strlen(surname);
email = employee + length;
/* Compose the new entry: */
strcat(employee, surname);
strcpy(employee, name);
strcat(employee, email);
/* Print the result: */
puts(employee);
return 0;
}
Compile this program into a binary file named em ployee by using the following command:
~]$ scl enable devtoolset-2 'gcc -rdynamic -g -o employee employee.c'
T o identify erroneous function calls with overlapping memory regions, type:
~]$ scl enable devtoolset-2 'memstomp --debug-info ./employee'
memstomp: 0.1.4 successfully initialized for process employee (pid 14887).
strcat(dest=0x7fff13afc265, src=0x7fff13afc269, bytes=21) overlap for
employee(14887)
??:0
strcpy()
??:0
strcpy()
??:0
_Exit()
??:0
strcat()
employee.c:26
main()
??:0
__libc_start_main()
??:0
_start()
John,[email protected],
64
Chapter 9. memstomp
9.3. Additional Resources
A detailed description of m em stom p and its features is beyond the scope of this book. For more
information, see the resources listed below.
Installed Documentation
m em stom p(1) — T he manual page for the m em stom p utility provides detailed information about its
usage. T o display the manual page for the version included in Red Hat Developer T oolset, type:
scl enable devtoolset-2 'man memstomp'
See Also
Chapter 1, Red Hat Developer Toolset provides an overview of Red Hat Developer T oolset and more
information on how to install it on your system.
Chapter 7, GNU Debugger (GDB) provides information on how to debug programs written in C, C++,
and Fortran.
Chapter 8, strace documents how to use the strace utility to monitor system calls that a program
uses and signals it receives.
Chapter 11, Valgrind explains how to use valgrind to profile applications and detect memory errors
and memory management problems, such as the use of uninitialized memory, improper allocation and
freeing of memory, and the use of improper arguments in system calls.
65
Red Hat D eveloper Toolset 2.x User Guide
Part V. Performance Monitoring Tools
66
Chapter 10. SystemTap
Chapter 10. SystemTap
SystemT ap is a tracing and probing tool that allows users to monitor the activities of the entire system
without needing to instrument, recompile, install, and reboot. It is programmable with a custom scripting
language, which gives it expressiveness (to trace, filter, and analyze) and reach (to look into the running
kernel and applications).
SystemT ap can monitor various types of events, such as function calls within the kernel or applications,
timers, tracepoints, performance counters, and so on. Some included example scripts produce output
similar to netstat, ps, top, and iostat, others include pretty-printed function callgraph traces or tools
for working around security bugs.
Red Hat Developer T oolset is distributed with SystemT ap 2.1.
T able 10.1. T ools Distributed with SystemT ap for Red Hat Developer T oolset
Name
Description
stap
T ranslates probing instructions into C code, builds a kernel module, and
loads it into a running Linux kernel.
staprun
Loads, unloads, attaches to, and detaches from kernel modules built with
the stap utility.
stapsh
Serves as a remote shell for SystemT ap.
stap-prep
Determines and—if possible—downloads the kernel information packages
that are required to run SystemT ap.
stap-m erge
Merges per-CPU files. T his script is automatically executed when the stap
utility is executed with the -b command line option.
stap-report
Gathers important information about the system for the purpose of reporting
a bug in SystemT ap.
10.1. Installing SystemTap
In Red Hat Developer T oolset, System T ap is provided by the devtoolset-2-systemtap package and is
automatically installed with devtoolset-2-perftools as described in Section 1.5, “Installing Red Hat
Developer T oolset”.
In order to place instrumentation into the Linux kernel, SystemT ap may also require installation of
additional packages with debugging information. T o determine which packages to install, run the stapprep utility as follows:
scl enable devtoolset-2 'stap-prep'
Note that if you execute this command as the root user, the utility automatically offers the packages for
installation. For more information on how to install these packages on your system, see the Red Hat
Enterprise Linux SystemTap Beginners Guide.
10.2. Using SystemTap
T o execute any of the tools that are part of SystemT ap, type the following at a shell prompt:
scl enable devtoolset-2 'tool [option...]'
67
Red Hat D eveloper Toolset 2.x User Guide
See T able 10.1, “T ools Distributed with SystemT ap for Red Hat Developer T oolset” for a list of tools that
are distributed with SystemT ap. For example, to run the stap tool to build an instrumentation module,
type:
scl enable devtoolset-2 'stap [option...] argument...'
Note that you can execute any command using the scl utility, causing it to be run with the Red Hat
Developer T oolset binaries used in preference to the Red Hat Enterprise Linux system equivalent. T his
allows you to run a shell session with Red Hat Developer T oolset SystemT ap as default:
scl enable devtoolset-2 'bash'
Note
T o verify the version of SystemT ap you are using at any point, type the following at a shell
prompt:
which stap
Red Hat Developer T oolset's stap executable path will begin with /opt. Alternatively, you can
use the following command to confirm that the version number matches that for Red Hat
Developer T oolset SystemT ap:
stap -V
10.3. Additional Resources
A detailed description of SystemT ap and its features is beyond the scope of this book. For more
information, see the resources listed below.
Installed Documentation
stap(1) — T he manual page for the stap command provides detailed information on its usage, as
well as references to other related manual pages. T o display the manual page for the version
included in Red Hat Developer T oolset, type:
scl enable devtoolset-2 'man stap'
staprun(8) — T he manual page for the staprun command provides detailed information on its
usage. T o display the manual page for the version included in Red Hat Developer T oolset, type:
scl enable devtoolset-2 'man staprun'
SystemTap Tapset Reference Manual — HT ML documentation on the most common tapset
definitions is located at /opt/rh/devtoolset-2/root/usr/share/doc/devtoolset-2system tap-client-2.1/index.htm l.
Online Documentation
68
Chapter 10. SystemTap
Red Hat Enterprise Linux 6 SystemT ap Beginners Guide — T he SystemTap Beginners Guide for
Red Hat Enterprise Linux 6 provides an introduction to SystemT ap and its usage.
Red Hat Enterprise Linux 5 SystemT ap Beginners Guide — T he SystemTap Beginners Guide for
Red Hat Enterprise Linux 5 provides an introduction to SystemT ap and its usage.
Red Hat Enterprise Linux 6 SystemT ap T apset Reference — T he SystemTap Tapset Reference for
Red Hat Enterprise Linux 6 provides further details about SystemT ap.
Red Hat Enterprise Linux 5 SystemT ap T apset Reference — T he SystemTap Tapset Reference for
Red Hat Enterprise Linux 5 provides further details about SystemT ap.
T he SystemT ap Documentation — T he official SystemT ap documentation provides further
documentation on SystemT ap, as well as numerous examples of SystemT ap scripts.
See Also
Section A.8, “Changes in SystemT ap” provides a comprehensive list of features and improvements
over the Red Hat Enterprise Linux system version of SystemT ap and the version distributed in the
previous release of Red Hat Developer T oolset.
Chapter 1, Red Hat Developer Toolset provides an overview of Red Hat Developer T oolset and more
information on how to install it on your system.
Chapter 11, Valgrind explains how to use Valgrind to profile applications and detect memory errors
and memory management problems, such as the use of uninitialized memory, improper allocation and
freeing of memory, and the use of improper arguments in system calls.
Chapter 12, OProfile explains how to use OProfile to determine which sections of code consume the
greatest amount of CPU time and why.
Chapter 13, Dyninst documents how to use the Dyninst library to instrument a user-space
executable.
69
Red Hat D eveloper Toolset 2.x User Guide
Chapter 11. Valgrind
Valgrind is an instrumentation framework that ships with a number of tools to profile applications. It can
be used to detect various memory errors and memory management problems, such as the use of
uninitialized memory or improper allocation and freeing of memory, or to identify the use of improper
arguments in system calls. For a complete list of profiling tools that are distributed with the Red Hat
Developer T oolset version of Valgrind, see T able 11.1, “T ools Distributed with Valgrind for Red Hat
Developer T oolset”.
Valgrind profiles an application by rewriting it and instrumenting the rewritten binary. T his allows you to
profile your application without the need to recompile it, but it also makes Valgrind significantly slower
than other profilers, especially when performing extremely detailed runs. It is therefore not suited to
debugging time-specific issues, or kernel-space debugging.
Red Hat Developer T oolset is distributed with Valgrind 3.8.1. T his version is more recent than the
version included in Red Hat Enterprise Linux and provides numerous bug fixes and enhancements.
T able 11.1. T ools Distributed with Valgrind for Red Hat Developer T oolset
Name
Description
Memcheck
Detects memory management problems by intercepting system calls and
checking all read and write operations.
Cachegrind
Identifies the sources of cache misses by simulating the level 1 instruction
cache (I1), level 1 data cache (D1), and unified level 2 cache (L2).
Callgrind
Generates a call graph representing the function call history.
Helgrind
Detects synchronization errors in multithreaded C, C++, and Fortran
programs that use POSIX threading primitives.
DRD
Detects errors in multithreaded C and C++ programs that use POSIX
threading primitives or any other threading concepts that are built on top of
these POSIX threading primitives.
Massif
Monitors heap and stack usage.
11.1. Installing Valgrind
In Red Hat Developer T oolset, Valgrind is provided by the devtoolset-2-valgrind package and is
automatically installed with devtoolset-2-perftools. If you intend to use Valgrind to profile parallel
programs that use the Message Passing Interface (MPI) protocol, also install the devtoolset-2-valgrindopenmpi package by typing the following at a shell prompt as root:
yum install devtoolset-2-valgrind-openmpi
For detailed instructions on how to install Red Hat Developer T oolset and related packages to your
system, see Section 1.5, “Installing Red Hat Developer T oolset”.
11.2. Using Valgrind
T o run any of the Valgrind tools on a program you want to profile, type the following at a shell prompt:
scl enable devtoolset-2 'valgrind [--tool=tool] program [argument...]'
See T able 11.1, “T ools Distributed with Valgrind for Red Hat Developer T oolset” for a list of tools that
70
Chapter 11. Valgrind
See T able 11.1, “T ools Distributed with Valgrind for Red Hat Developer T oolset” for a list of tools that
are distributed with Valgrind. T he argument of the --tool command line option must be specified in
lower case, and if this option is omitted, Valgrind uses Memcheck by default. For example, to run
Cachegrind on a program to identify the sources of cache misses, type:
scl enable devtoolset-2 'valgrind --tool=cachegrind program [argument...]'
Note that you can execute any command using the scl utility, causing it to be run with the Red Hat
Developer T oolset binaries used in preference to the Red Hat Enterprise Linux system equivalent. T his
allows you to run a shell session with Red Hat Developer T oolset Valgrind as default:
scl enable devtoolset-2 'bash'
Note
T o verify the version of Valgrind you are using at any point, type the following at a shell prompt:
which valgrind
Red Hat Developer T oolset's valgrind executable path will begin with /opt. Alternatively, you
can use the following command to confirm that the version number matches that for Red Hat
Developer T oolset Valgrind:
valgrind --version
11.3. Additional Resources
A detailed description of Valgrind and its features is beyond the scope of this book. For more
information, see the resources listed below.
Installed Documentation
valgrind(1) — T he manual page for the valgrind utility provides detailed information on how to
use Valgrind. T o display the manual page for the version included in Red Hat Developer T oolset,
type:
scl enable devtoolset-2 'man valgrind'
Valgrind Documentation — HT ML documentation for Valgrind is located at /opt/rh/devtoolset2/root/usr/share/doc/devtoolset-2-valgrind-3.8.1/htm l/index.htm l.
Online Documentation
Red Hat Enterprise Linux 6 Developer Guide — T he Developer Guide for Red Hat Enterprise Linux 6
provides more information about Valgrind and its Eclipse plug-in.
Red Hat Enterprise Linux 6 Performance T uning Guide — T he Performance Tuning Guide for Red
Hat Enterprise Linux 6 provides more detailed information about using Valgrind to profile applications.
See Also
71
Red Hat D eveloper Toolset 2.x User Guide
Section A.10, “Changes in Valgrind” provides a comprehensive list of features and improvements
over the Red Hat Enterprise Linux system version of Valgrind and the version distributed in the
previous release of Red Hat Developer T oolset.
Chapter 1, Red Hat Developer Toolset provides an overview of Red Hat Developer T oolset and more
information on how to install it on your system.
Chapter 9, memstomp documents how to use the memstomp utility to identify calls to library functions
with overlapping memory regions that are not allowed by various standards.
Chapter 10, SystemTap provides an introduction to SystemT ap and explains how to use it to monitor
the activities of a running system.
Chapter 12, OProfile explains how to use OProfile to determine which sections of code consume the
greatest amount of CPU time and why.
Chapter 13, Dyninst documents how to use the Dyninst library to instrument a user-space
executable.
72
Chapter 12. OProfile
Chapter 12. OProfile
OProfile is a low overhead, system-wide profiler that uses the performance monitoring hardware on the
processor to retrieve information about the kernel and executables on the system, such as when
memory is referenced, the number of level 2 cache (L2) requests, and the number of hardware interrupts
received. It consists of a configuration utility, a daemon for collecting data, and a number of tools that can
be used to transform the data into a human-readable form. For a complete list of tools that are
distributed with the Red Hat Developer T oolset version of OProfile, see T able 12.1, “T ools Distributed
with OProfile for Red Hat Developer T oolset”.
OProfile profiles an application without adding any instrumentation by recording the details of every nth
event. T his allows it to consume fewer resources than Valgrind, but also causes its samples to be less
precise. Unlike Valgrind, which only collects data for a single process and its children in user-space,
OProfile is well suited to collect system-wide data on both user-space and kernel-space processes, and
requires root privileges to run.
Red Hat Developer T oolset is distributed with OProfile 0.9.8. T his version is more recent than the
version included in Red Hat Enterprise Linux and provides numerous bug fixes and enhancements.
T able 12.1. T ools Distributed with OProfile for Red Hat Developer T oolset
Name
Description
oprofiled
T he OProfile daemon that collects profiling data.
opcontrol
Starts, stops, and configures the OProfile daemon.
opannotate
Generates an annotated source file or assembly listing form the profiling
data.
oparchive
Generates a directory containing executable, debug, and sample files.
opgprof
Generates a summary of a profiling session in a format compatible with
gprof.
ophelp
Displays a list of available events.
opim port
Converts a sample database file from a foreign binary format to the native
format.
opjitconv
Converts a just-in-time (JIT ) dump file to the Executable and Linkable
Format (ELF).
opreport
Generates image and symbol summaries of a profiling session.
12.1. Installing OProfile
In Red Hat Developer T oolset, OProfile is provided by the devtoolset-2-oprofile package and is
automatically installed with devtoolset-2-perftools as described in Section 1.5, “Installing Red Hat
Developer T oolset”.
12.2. Using OProfile
T o run any of the tools that are distributed with OProfile, type the following at a shell prompt as root:
scl enable devtoolset-2 'tool [option...]'
See T able 12.1, “T ools Distributed with OProfile for Red Hat Developer T oolset” for a list of tools that
are distributed with Valgrind. For example, to use the ophelp command to list available events in the
73
Red Hat D eveloper Toolset 2.x User Guide
are distributed with Valgrind. For example, to use the ophelp command to list available events in the
XML format, type:
scl enable devtoolset-2 'ophelp -X'
Note that you can execute any command using the scl utility, causing it to be run with the Red Hat
Developer T oolset binaries used in preference to the Red Hat Enterprise Linux system equivalent. T his
allows you to run a shell session with Red Hat Developer T oolset OProfile as default:
scl enable devtoolset-2 'bash'
Note
T o verify the version of OProfile you are using at any point, type the following at a shell prompt:
which opcontrol
Red Hat Developer T oolset's opcontrol executable path will begin with /opt. Alternatively, you
can use the following command to confirm that the version number matches that for Red Hat
Developer T oolset OProfile:
opcontrol --version
12.3. Additional Resources
A detailed description of OProfile and its features is beyond the scope of this book. For more information,
see the resources listed below.
Installed Documentation
oprofile(1) — T he manual page named oprofile provides an overview of OProfile and available
tools. T o display the manual page for the version included in Red Hat Developer T oolset, type:
scl enable devtoolset-2 'man oprofile'
opannotate(1), oparchive(1), opcontrol(1), opgprof(1), ophelp(1), opimport(1), opreport(1) —
Manual pages for various tools distributed with OProfile provide more information on their respective
usage. T o display the manual page for the version included in Red Hat Developer T oolset, type:
scl enable devtoolset-2 'man tool'
Online Documentation
Red Hat Enterprise Linux 6 Developer Guide — T he Developer Guide for Red Hat Enterprise Linux 6
provides more information on OProfile.
Red Hat Enterprise Linux 6 Deployment Guide — T he Deployment Guide for Red Hat Enterprise
Linux 6 describes in detail how to install, configure, and start using OProfile on this system.
Red Hat Enterprise Linux 5 Deployment Guide — T he Deployment Guide for Red Hat Enterprise
Linux 5 describes in detail how to install, configure, and start using OProfile on this system.
74
Chapter 12. OProfile
See Also
Section A.9, “Changes in OProfile” provides a comprehensive list of changes and improvements over
the Red Hat Enterprise Linux system version of OProfile and the version distributed in the previous
release of Red Hat Developer T oolset.
Chapter 1, Red Hat Developer Toolset provides an overview of Red Hat Developer T oolset and more
information on how to install it on your system.
Chapter 10, SystemTap provides an introduction to SystemT ap and explains how to use it to monitor
the activities of a running system.
Chapter 11, Valgrind explains how to use Valgrind to profile applications and detect memory errors
and memory management problems, such as the use of uninitialized memory, improper allocation and
freeing of memory, and the use of improper arguments in system calls.
Chapter 13, Dyninst documents how to use the Dyninst library to instrument a user-space
executable.
75
Red Hat D eveloper Toolset 2.x User Guide
Chapter 13. Dyninst
T he Dyninst library provides an application programming interface (API) for instrumenting and working
with user-space executables during their execution. It can be used to insert code into a running program,
change certain subroutine calls, or even remove them from the program, and serves as a valuable
debugging and performance monitoring tool. T he Dyninst API is also commonly used along with
SystemT ap to allow non-root users to instrument user-space executables.
Red Hat Developer T oolset is distributed with Dyninst 8.0.
13.1. Installing Dyninst
In Red Hat Developer T oolset, the Dyninst library is provided by the devtoolset-2-dyninst package and
is automatically installed with devtoolset-2-perftools as described in Section 1.5, “Installing Red Hat
Developer T oolset”. In addition, it is recommended that you also install the GNU Compiler Collection
provided by the devtoolset-2-toolchain package.
If you intend to write a custom instrumentation for binaries, install the relevant header files by running the
following command as root:
yum install devtoolset-2-dyninst-devel
You can also install API documentation for this library by typing the following at a shell prompt as root:
yum install devtoolset-2-dyninst-doc
For a complete list of documents that are included in the devtoolset-2-dyninst-doc package, see
Section 13.3, “Additional Resources”. For detailed instructions on how to install optional packages to
your system, see Section 1.5, “Installing Red Hat Developer T oolset”.
13.2. Using Dyninst
13.2.1. Using Dyninst with SystemTap
T o use Dyninst along with SystemT ap to allow non-root users to instrument user-space executables,
run the stap command with the --dyninst (or --runtim e=dyninst) command line option. T his tells
stap to translate a SystemT ap script into C code that uses the Dyninst library, compile this C code into
a shared library, and then load the shared library and run the script. Note that when executed like this,
the stap command also requires the -c or -x command line option to be specified.
T o use the Dyninst runtime to instrument an executable file, type the following at a shell prompt:
scl enable devtoolset-2 'stap --dyninst -c command [option...] argument...'
Similarly, to use the Dyninst runtime to instrument a user's process, type:
scl enable devtoolset-2 'stap --dyninst -x process_id [option...] argument...'
See Chapter 10, SystemTap for more information about the Red Hat Developer T oolset version of
SystemT ap. For a general introduction to SystemT ap and its usage, see the SystemTap Beginners
Guide for Red Hat Enterprise Linux.
76
Chapter 13. D yninst
13.2.2. Using Dyninst as a Stand-alone Application
Before using the Dyninst library as a stand-alone application, set the value of the DYNINST API_RT _LIB
environment variable to the path to the runtime library file. If you are running a 64-bit system, you can do
so by typing the following at a shell prompt:
export DYNINSTAPI_RT_LIB=/opt/rh/devtoolset2/root/usr/lib64/dyninst/libdyninstAPI_RT.so.8.0
If you are running a 32-bit system, type:
export DYNINSTAPI_RT_LIB=/opt/rh/devtoolset2/root/usr/lib/dyninst/libdyninstAPI_RT.so.8.0
T his sets the DYNINST API_RT _LIB environment variable in the current shell session.
Example 13.1, “Using Dyninst as a Stand-alone Application” illustrates how to write and build a program
to monitor the execution of a user-space process. For a detailed explanation of how to use Dyninst, see
the resources listed in Section 13.3, “Additional Resources”.
77
Red Hat D eveloper Toolset 2.x User Guide
Example 13.1. Using Dyninst as a Stand-alone Application
Consider a source file named exercise.C that has the following contents:
#include <stdio.h>
void print_iteration(int value) {
printf("Iteration number %d\n", value);
}
int main(int argc, char **argv) {
int i;
printf("Enter the starting number: ");
scanf("%d", &i);
for(; i>0; --i)
print_iteration(i);
return 0;
}
T his program prompts the user to enter a starting number and then counts down to 1, calling the
print_iteration() function for each iteration in order to print the number to standard output. Now
consider another source file named count.C with the following contents:
78
Chapter 13. D yninst
#include
#include
#include
#include
#include
#include
#include
#include
<stdio.h>
<fcntl.h>
"BPatch.h"
"BPatch_process.h"
"BPatch_function.h"
"BPatch_Vector.h"
"BPatch_thread.h"
"BPatch_point.h"
void usage() {
fprintf(stderr, "Usage: count <process_id> <function>\n");
}
// Global information for counter
BPatch_variableExpr *counter = NULL;
void createCounter(BPatch_process *app, BPatch_image *appImage) {
int zero = 0;
counter = app->malloc(*appImage->findType("int"));
counter->writeValue(&zero);
}
bool interceptfunc(BPatch_process *app,
BPatch_image *appImage,
char *funcName) {
BPatch_Vector<BPatch_function *> func;
appImage->findFunction(funcName, func);
if(func.size() == 0) {
fprintf(stderr, "Unable to find function to instrument()\n");
exit (-1);
}
BPatch_Vector<BPatch_snippet *> incCount;
BPatch_Vector<BPatch_point *> *points;
points = func[0]->findPoint(BPatch_entry);
if ((*points).size() == 0) {
exit (-1);
}
BPatch_arithExpr counterPlusOne(BPatch_plus, *counter, BPatch_constExpr(1));
BPatch_arithExpr addCounter(BPatch_assign, *counter, counterPlusOne);
return app->insertSnippet(addCounter, *points);
}
void printCount(BPatch_thread *thread, BPatch_exitType) {
int val = 0;
counter->readValue(&val, sizeof(int));
fprintf(stderr, "Function executed %d times.\n", val);
}
BPatch bpatch;
int main(int argc, char *argv[]) {
int pid;
if (argc != 3) {
usage();
exit(1);
}
pid = atoi(argv[1]);
79
Red Hat D eveloper Toolset 2.x User Guide
BPatch_process *app = bpatch.processAttach(NULL, pid);
if (!app) exit (-1);
BPatch_image *appImage = app->getImage();
createCounter(app, appImage);
fprintf(stderr, "Finding function %s(): ", argv[2]);
BPatch_Vector<BPatch_function*> countFuncs;
fprintf(stderr, "OK\nInstrumenting function %s(): ", argv[2]);
interceptfunc(app, appImage, argv[2]);
bpatch.registerExitCallback(printCount);
fprintf(stderr, "OK\nWaiting for process %d to exit...\n", pid);
app->continueExecution();
while (!app->isTerminated())
bpatch.waitForStatusChange();
return 0;
}
T his program accepts a process ID and a function name as command line arguments and then prints
the total number of times the function was called during the execution of the process. You can use the
following Makefile to build these two files:
DTS
= /opt/rh/devtoolset-2/root
CXXFLAGS = -g -I$(DTS)/usr/include/dyninst
LBITS
:= $(shell getconf LONG_BIT)
ifeq ($(LBITS),64)
DYNINSTLIBS = $(DTS)/usr/lib64/dyninst
else
DYNINSTLIBS = $(DTS)/usr/lib/dyninst
endif
.PHONY: all
all: count exercise
count: count.C
g++ $(CXXFLAGS) count.C -I /usr/include/dyninst -c
g++ $(CXXFLAGS) count.o -L $(DYNINSTLIBS) -ldyninstAPI -o count
exercise: exercise.C
g++ $(CXXFLAGS) exercise.C -o exercise
.PHONY: clean
clean:
rm -rf *~ *.o count exercise
T o compile the two programs on the command line using the g++ compiler from Red Hat Developer
T oolset, run the m ake utility as follows:
~]$ scl enable devtoolset-2 make
g++ -g -I/opt/rh/devtoolset-2/root/usr/include/dyninst count.C -c
g++ -g -I/opt/rh/devtoolset-2/root/usr/include/dyninst count.o -L
/opt/rh/devtoolset-2/root/usr/lib64/dyninst -ldyninstAPI -o count
g++ -g -I/opt/rh/devtoolset-2/root/usr/include/dyninst exercise.C -o exercise
T his creates new binary files called exercise and count in the current working directory.
In one shell session, execute the exercise binary file as follows and wait for it to prompt you to
enter the starting number:
80
Chapter 13. D yninst
~]$ ./exercise
Enter the starting number:
Do not enter this number. Instead, start another shell session and type the following at its prompt to
set the DYNINST API_RT _LIB environment variable and execute the count binary file:
~]$ export DYNINSTAPI_RT_LIB=/opt/rh/devtoolset2/root/usr/lib64/dyninst/libdyninstAPI_RT.so.8.0
~]$ ./count `pidof exercise` print_iteration
Finding function print_iteration(): OK
Instrumenting function print_iteration(): OK
Waiting for process 8607 to exit...
Now switch back to the first shell session and enter the starting number as requested by the
exercise program. For example:
Enter the
Iteration
Iteration
Iteration
Iteration
Iteration
starting number: 5
number 5
number 4
number 3
number 2
number 1
When the exercise program terminates, the count program displays the number of times the
print_iteration() function was executed:
Function executed 5 times.
13.3. Additional Resources
A detailed description of Dyninst and its features is beyond the scope of this book. For more information,
see the resources listed below.
Installed Documentation
T he devtoolset-2-dyninst-doc package installs the following documents in the /opt/rh/devtoolset2/root/usr/share/doc/devtoolset-2-dyninst-doc-8.0/ directory:
Dyninst Programmer's Guide — A detailed description of the Dyninst API is stored in the
DyninstAPI.pdf file.
DynC API Programmer's Guide — An introduction to DynC API is stored in the dynC_API.pdf file.
ParseAPI Programmer's Guide — An introduction to the ParseAPI is stored in the ParseAPI.pdf
file.
PatchAPI Programmer's Guide — An introduction to PatchAPI is stored in the PatchAPI.pdf file.
ProcControlAPI Programmer's Guide — A detailed description of ProcControlAPI is stored in the
ProcControlAPI.pdf file.
StackwalkerAPI Programmer's Guide — A detailed description of StackwalkerAPI is stored in the
stackwalker.pdf file.
SymtabAPI Programmer's Guide — An introduction to SymtabAPI is stored in the Sym tabAPI.pdf
file.
81
Red Hat D eveloper Toolset 2.x User Guide
InstructionAPI Reference Manual — A detailed description of the InstructionAPI is stored in the
InstructionAPI.pdf file.
For information on how to install this package on your system, see Section 13.1, “Installing Dyninst”.
Online Documentation
Dyninst Home Page — T he project home page provides links to additional documentation and related
publications.
Red Hat Enterprise Linux 6 SystemT ap Beginners Guide — T he SystemTap Beginners Guide for
Red Hat Enterprise Linux 6 provides an introduction to SystemT ap and its usage.
Red Hat Enterprise Linux 5 SystemT ap Beginners Guide — T he SystemTap Beginners Guide for
Red Hat Enterprise Linux 5 provides an introduction to SystemT ap and its usage.
Red Hat Enterprise Linux 6 SystemT ap T apset Reference — T he SystemTap Tapset Reference for
Red Hat Enterprise Linux 6 provides further details about SystemT ap.
Red Hat Enterprise Linux 5 SystemT ap T apset Reference — T he SystemTap Tapset Reference for
Red Hat Enterprise Linux 5 provides further details about SystemT ap.
See Also
Chapter 1, Red Hat Developer Toolset provides an overview of Red Hat Developer T oolset and more
information on how to install it on your system.
Chapter 10, SystemTap provides an introduction to SystemT ap and explains how to use it to monitor
the activities of a running system.
Chapter 11, Valgrind explains how to use Valgrind to profile applications and detect memory errors
and memory management problems, such as the use of uninitialized memory, improper allocation and
freeing of memory, and the use of improper arguments in system calls.
Chapter 12, OProfile explains how to use OProfile to determine which sections of code consume the
greatest amount of CPU time and why.
82
Part VI. Getting Help
Part VI. Getting Help
83
Red Hat D eveloper Toolset 2.x User Guide
Chapter 14. Accessing Red Hat Product Documentation
Red Hat Product Documentation located at https://access.redhat.com/site/documentation/ serves as
a central source of information. It is currently translated in 22 languages and for each product, it provides
different kinds of books from release and technical notes to installation, user, and reference guides in
HT ML, PDF, and EPUB formats.
Below is a brief list of documents that are directly or indirectly relevant to this book.
Red Hat Developer Toolset
Red Hat Developer T oolset 2.0 Release Notes — T he Release Notes for Red Hat Developer T oolset
2.0 provide more information about this product.
Red Hat Developer T oolset 2.0 Software Collections Guide — T he Software Collections Guide for
Red Hat Developer T oolset 2.0 explains the concept of Software Collections and documents the scl
tool.
Red Hat Enterprise Linux
Red Hat Enterprise Linux 6 Developer Guide — T he Developer Guide for Red Hat Enterprise Linux 6
provides detailed information about libraries and runtime support, compiling and building, debugging,
and profiling.
Red Hat Enterprise Linux 6 Installation Guide — T he Installation Guide for Red Hat Enterprise Linux
6 explains how to obtain, install, and update the system.
Red Hat Enterprise Linux 5 Installation Guide — T he Installation Guide for Red Hat Enterprise Linux
5 explains how to obtain, install, and update the system.
Red Hat Enterprise Linux 6 Deployment Guide — T he Deployment Guide for Red Hat Enterprise
Linux 6 documents relevant information regarding the deployment, configuration, and administration
of Red Hat Enterprise Linux 6.
Red Hat Enterprise Linux 5 Deployment Guide — T he Deployment Guide for Red Hat Enterprise
Linux 5 documents relevant information regarding the deployment, configuration, and administration
of Red Hat Enterprise Linux 5.
84
Chapter 15. Accessing the Customer Portal
Chapter 15. Accessing the Customer Portal
T he Customer Portal is available to all Red Hat subscribers and can be accessed at
https://access.redhat.com/home. T his web page serves as a pointer to a vast number of resources but
of most interest to developers are the Plan, Deploy, and Connect menus. T hese include links to all the
resources needed during each stage of the development.
15.1. The Plan Menu
Figure 15.1. T he Plan Menu
In the Plan menu are resources needed to plan a development project. T hese menu items provide
proven resources to implement the best solution the first time. T his includes:
Webinars
T he Webinars page contains information on upcoming Red Hat and open source events around
the world. Here you can register for upcoming webinars or watch archived ones on demand.
Success Stories
Read the success stories of other Red Hat customers to learn how leading organizations are
finding unbeatable value, performance, security and reliability with Red Hat solutions.
Product Documentation
T his provides a list of links to the various Red Hat documents, including books for Red Hat
Enterprise Linux, Identity Management and Infrastructure, Red Hat Enterprise Storage, JBoss
Enterprise Middleware, and System Management.
Reference Architectures
Reference Architectures contains a list of whitepapers that detail technical case studies of
solutions that have been built, tested, and bench-marked by senior Red Hat engineers. T hey
explain the capabilities and limitations of a given solution, as well as detailed notes on how to
implement the solution.
Evaluations & Demos
You can download free evaluations of various Red Hat products from here, including Red Hat
Enterprise Linux, Red Hat Enterprise Virtualization, Red Hat Storage Appliance, and JBoss
Enterprise Middleware evaluations.
85
Red Hat D eveloper Toolset 2.x User Guide
Certified Hardware
T his section has information on what systems, components, and peripherals Red Hat
Enterprise Linux 6, 5, and 4 support.
15.2. The Deploy Menu
Figure 15.2. T he Deploy Menu
In the Deploy menu are resources needed to deploy a development project. T his includes:
Getting Started
T he Getting Started page has links to information to help get up and running with Red Hat
subscriptions, including product registration information, accessing your resources, and
engaging in global support. It also has links to a Red Hat Welcome Kit and a Quick Guide to
Red Hat Support.
Downloads
Here is where you can download all that Red Hat offers with descriptions of what each entails.
Activate a New Subscription
After purchasing a Red Hat subscription this is where you go to activate it. Note that the
Activate a New Subscription section requires you to enter your Red Hat login and
password.
Support Essentials
Here you can find a list of articles and group discussions, viewable by new posts, most popular,
and recent comments, as well as the most recent Red Hat errata.
Security
Red Hat releases errata to address bugs, provide enhancements, or to fix security
vulnerabilities. With each erratum an advisory is supplied to give the details of the issues being
fixed, as well as how to obtain and install the required software packages. T his section has
information about the errata, including:
Checking the security update policy and lifetime for all Red Hat products
Getting the latest security updates for Red Hat products
Getting notified of new security updates
86
Chapter 15. Accessing the Customer Portal
Finding out if a specific CVE affects a Red Hat product
Reporting a security vulnerability
How we measure security vulnerabilities
Security Response T eam mission and standards of service
Support
T his is where all the information regarding Red Hat support can be found, including links for:
Support Cases
Support Programs
Product Life Cycles
Supported Environments
Help & Assistance
Site Help
15.3. The Connect Menu
Figure 15.3. T he Connect Menu
T he Connect menu allows you to connect to the industry's best engineers and collaborate with industry
peers. T his includes:
Knowledgebase
T he Knowledgebase contains a large number of whitepapers on a variety of topics which can
serve as another source of documentation for your project. Note that the Knowledgebase
section requires you to enter your Red Hat login and password.
Groups
T his section allows users to join a group to collaborate on the documents. T hey can also
create and comment on discussions to interact with other customers, Red Hat support staff,
and certified engineers. Note that the Groups section requires you to enter your Red Hat login
and password.
Videos
A number of videos on how to get vital solutions, useful tips, product demonstrations, and inside
information can be accessed from here. You can also rate and comment on all of the videos.
87
Red Hat D eveloper Toolset 2.x User Guide
T ech Briefs
T ech briefs provide practical advice to help solve real-world problems with Red Hat products.
Each tech brief provides a detailed use case covering best practices, how-to instructions, or
detailed discussions on how to use Red Hat technology effectively, and are reviewed and
tested by Red Hat engineers.
Source
T his is the kernel source browser and contains links to all the kernel sources broken into each
individual patch, unlike the kernel srpm which is shipped as one big patch. Note that the
Source section requires you to enter your Red Hat login and password.
Support Cases
T his is where users can view all their support cases, make changes or view any updates. Note
that the Support Cases section requires you to enter your Red Hat login and password.
88
Chapter 16. Contacting Global Support Services
Chapter 16. Contacting Global Support Services
Unless you have a Self-Support subscription, when both the Red Hat Documentation website and
Customer Portal fail to provide the answers to your questions, you can contact Global Support
Services (GSS).
16.1. Gathering Required Information
Several items of information should be gathered before contacting GSS.
Background Information
Ensure you have the following background information at hand before calling GSS:
Hardware type, make, and model on which the product runs
Software version
Latest upgrades
Any recent changes to the system
An explanation of the problem and the symptoms
Any messages or significant information about the issue
Note
If you ever forget your Red Hat login information, it can be recovered at
https://access.redhat.com/site/help/LoginAssistance.html.
Diagnostics
T he diagnostics report for Red Hat Enterprise Linux is required as well. T his report is also known as a
sosreport and the program to create the report is provided by the sos package. T o install the sos
package and all its dependencies on your system, type the following at a shell prompt as root:
yum install sos
T o generate the report, run as root:
sosreport
For more information, access the Knowledgebase article at https://access.redhat.com/kb/docs/DOC3593.
Account and Contact Information
In order to help you, GSS requires your account information to customize their support, as well contact
information to get back to you. When you contact GSS ensure you have your:
Red Hat customer number or Red Hat Network (RHN) login name
Company name
Contact name
Preferred method of contact (phone or email) and contact information (phone number or email
address)
89
Red Hat D eveloper Toolset 2.x User Guide
Issue Severity
Determining an issue's severity is important to allow the GSS team to prioritize their work. T here are four
levels of severity.
Severity 1 (urgent)
A problem that severely impacts your use of the software for production purposes. It halts your
business operations and has no procedural work around.
Severity 2 (high)
A problem where the software is functioning but production is severely reduced. It causes a
high impact to business operations and no work around exists.
Severity 3 (medium)
A problem that involves partial, non-critical loss of the use of the software. T here is a medium to
low impact on your business and business continues to function by utilizing a work around.
Severity 4 (low)
A general usage question, report of a documentation error, or a recommendation for a future
product improvement.
For more information on determining the severity level of an issue, see
https://access.redhat.com/support/policy/severity.
Once the issue severity has been determined, submit a service request through the Customer Portal
under the Connect option, or at https://access.redhat.com/support/contact/technicalSupport.html. Note
that you need your Red Hat login details in order to submit service requests.
If the severity is level 1 or 2, then follow up your service request with a phone call. Contact information
and business hours are found at https://access.redhat.com/support/contact/technicalSupport.html.
If you have a premium subscription, then after hours support is available for Severity 1 and 2 cases.
T urn-around rates for both premium subscriptions and standard subscription can be found at
https://access.redhat.com/support/offerings/production/sla.html.
16.2. Escalating an Issue
If you feel as though an issue is not being handled correctly or adequately, you can escalate it. T here
are two types of escalation:
T echnical escalation
If an issue is not being resolved appropriately or if you need a more senior resource to attend
to it.
Management escalation
If the issue has become more severe or you believe it requires a higher priority.
More information on escalation, including contacts, is available at
90
Chapter 16. Contacting Global Support Services
https://access.redhat.com/support/policy/mgt_escalation.html.
16.3. Re-opening a Service Request
If more relevant information regarding a closed service request (such as the problem reoccurring), you
can re-open it via the Red Hat Customer Portal at
https://access.redhat.com/support/policy/mgt_escalation.html or by calling your local support center, the
details of which can be found at https://access.redhat.com/support/contact/technicalSupport.html.
Important
In order to re-open a service request, you need the original service request number.
16.4. Additional Resources
For more information, see the resources listed below.
Online Documentation
Getting Started — T he Getting Started page serves as a starting point for people who purchased a
Red Hat subscription, and offers the Red Hat Welcome Kit and Quick Guide to Red Hat Support for
download.
How can a RHEL Self-Support subscription be used? — A Knowledgebase article for customers with
a Self-Support subscription.
Red Hat Global Support Services and public mailing lists — A Knowledgebase article that answers
frequent questions about public Red Hat mailing lists.
91
Red Hat D eveloper Toolset 2.x User Guide
Changes in Version 2.0
T he sections below document features and compatibility changes introduced in Red Hat Developer
T oolset 2.0.
A.1. Changes in Eclipse
Red Hat Developer T oolset 2.0 is distributed with Eclipse 4 .3 and a wide selection of plug-ins from the
Eclipse Foundation's 2013 Eclipse 4.3 “Kepler” release, and provides a number of bug fixes and feature
enhancements over the Red Hat Enterprise Linux system version. Below is a comprehensive list of new
features compatibility changes in this release. For details on how to use these new features, see the
built-in Eclipse documentation.
A.1.1. Changes Since Red Hat Enterprise Linux 6.4
T he following features have been added since the release of the Eclipse Platform and native plug-ins
included in Red Hat Enterprise Linux 6.4:
T he Eclipse Platform has been updated to from version 3.6 to 4.3. T his new major release features a
more flexible user interface based on Eclipse Modeling Framework (EMF), CSS-based themes,
dependency injection, and more.
T he Eclipse C/C++ Development T oolkit (CDT ) has been updated from version 7.0 to 8.2. T his
new major release includes:
a greatly enhanced indexer, both in terms of capabilities and speed;
improved GNU Debugger integration;
support for GNU Debugger's pretty-printing;
multi-process debugging;
project-less debugging;
enhanced refactoring;
code-checking capabilities;
an improved and more polished user interface.
Mylyn, a set of task and application life cycle management plug-ins, has been updated from version
3.4 to 3.9. T his update includes:
an enhanced task-focused interface and task editing;
a new Jenkins/Hudson connector;
enhanced Bugzilla and T rac connectors;
EPUB authoring tools.
A new EGit plug-in has been added. T his plug-in includes an Eclipse T eam provider based on JGit,
a Git implementation written entirely in Java, and adds support for the Git revision control system to
the Eclipse user interface by introducing the History and Synchronize views, Com pare and
Quick Diff menu items, and various wizards to make it easier for developers to use this plug-in.
New GCov integration has been added to allow the user to visualize GCov output in both
summarized form and in file editors. As well, graphing capabilities for the data have been added.
New GProf integration has been added to allow the user to view profiling information such as
execution time and call graphs. As well, graphing capabilities for the data have been added.
A new SystemT ap integration plug-in has been added. T his plug-in includes:
an editor for the .stp files with the autocomplete feature;
the Probe view with a list of probes that are available on the system;
the Function view with a list of functions that are available on the system and can be used in
92
Changes in Version 2.0
.stp scripts.
As well, this plug-in includes integration for running SystemT ap scripts and viewing the results in a
textual, tabular, and graphical manner. Note that the result sets are updated in a near-runtime way,
which allows the user to use this plug-in for longer-running monitoring tasks.
New kernel perf tool integration has been added. T his plug-in uses the performance counters
subsystem of the Linux kernel to profile applications, makes it easier to analyze the results by
hyperlinking to the sources in the workspace projects, simplifies the perf tool configuration by
selecting the counters to be used, and allows the user to run this tool remotely.
A unified profiling launcher has been added to provide a single method to launch profiling. It allows
the user to select a profiling category (Mem ory, T im ing, or Coverage) and back ends for this
category (such as OProfile, perf, or GProf for T im ing).
T he C/C++ documentation plug-in has been enhanced to recognize and use gtk-doc generated
documentation and to display it in the Eclipse Help Center.
T he OProfile plug-in has been enhanced to support root privilege authentication through polkit.
T his feature is configured automatically.
T he Valgrind plug-in now supports the Helgrind tool, which can be used to detect synchronization
problems such as race conditions, deadlocks caused by incorrect locking order, or misuse of the
POSIX pthreads API. When a problem is detected, the plug-in displays error markers on the
corresponding lines in the source code.
A.2. Changes in GCC
Red Hat Developer T oolset 2.0 is distributed with GCC 4 .8, which provides a number of bug fixes and
feature enhancements over the Red Hat Enterprise Linux system version and the version included in
Red Hat Developer T oolset 1.1. Below is a comprehensive list of new features and compatibility changes
in this release.
A.2.1. Changes Since Red Hat Developer Toolset 1.1
T he following features have been added since the release of GCC included in Red Hat Developer
T oolset 1.1.
A.2.1.1. Caveats
Aggressive Loop Optimizations
T he loop optimizer of GCC has been improved to use language constraints in order to derive bounds for
the number of iterations of a loop. T he bounds are then used as a guide to loop unrolling, peeling, and
loop exit test optimizations.
T he optimizations assume that the loop code does not invoke undefined behavior by, for example,
causing signed integer overflows or making out-of-bound array accesses. For example, consider the
following code fragment:
unsigned int foo()
{
unsigned int data_data[128];
for (int fd = 0; fd < 128; ++fd)
data_data[fd] = fd * (0x02000001); // error
return data_data[0];
}
93
Red Hat D eveloper Toolset 2.x User Guide
When the value of the fd variable is 64 or above, the fd * 0x02000001 operation overflows, which is
invalid in both C and C++ for signed integers. In the example above, GCC may generate incorrect code
or enter an infinite loop.
T o fix this error, use the appropriate casts when converting between signed and unsigned types to
avoid overflows, for instance:
data_data[fd] = (uint32_t) fd * (0x02000001U); // ok
If necessary, this optimization can be turned off by using the new command line option -fnoaggressive-loop-optim izations.
A.2.1.2. General Improvements and Changes
New Local Register Allocator
GCC 4.8 features a new Local Register Allocator (LRA), which replaces the 26-year old reload pass and
improves the quality of generated code. T he new local register allocator is meant to be simpler, easier to
debug, and does a better job of register allocation.
AddressSanitizer
A fast memory error detector called AddressSanitizer has been added and can be enabled by using the
-fsanitize=address command line option. It augments memory access instructions in order to
detect use-after-free and out-of-bound accesses to objects on the heap.
T hreadSanitizer
A fast data race detector called ThreadSanitizer has been added in GCC 4.8. T he option to enable this
feature is -fsanitize=thread.
Compiling Extremely Large Functions
Many scalability bottlenecks have been removed from GCC optimization passes. As a consequence, it is
now possible to compile extremely large functions with smaller memory consumption in less time.
New -Og Optimization Level
A new general optimization level, -Og, has been introduced. T his optimization level addresses the need
for fast compilation and a superior debugging experience while providing a reasonable level of runtime
performance. Overall, the development experience should be better than the default optimization level O0.
Caret Diagnostic Messages
T he diagnostic messages of GCC, which display a line of source code, now also show a caret that
indicates the column where the problem was detected. For example:
fred.cc:4:15: fatal error: foo: No such file or directory
#include <foo>
^
compilation terminated.
New -fira-hoist-pressure Option
A new command line option, -fira-hoist-pressure, has been added. T his option uses the register
allocator to help decide when it is worthwhile to move expressions out of loops. It can reduce the size of
94
Changes in Version 2.0
the compiler code, but it slows down the compiler. T his option is enabled by default at -Os.
New -fopt-info Option
A new command line option, -fopt-info, has been added. T his option controls printing information
about the effects of particular optimization passes, and takes the following form:
-fopt-info[-info][=file_name]
T he info part of the option controls what is printed. Replace it with optim ized to print information
when optimization takes place, m issed to print information when optimization does not take place, note
to print more verbose information, or optall to print everything.
Replace file_name with the name of the file in which you want the information to be written. If you omit
this part of the option, GCC writes the information to the standard error output stream.
For example, to display a list of optimizations that were enabled by the -O2 option but had no effect
when compiling a file named foo.c, type:
gcc -O2 -fopt-info-missed foo.c
New -floop-nest-optimize Option
A new command line option, -floop-nest-optim ize, has been added. T his option enables an
experimental ISL-based loop nest optimizer, a generic loop nest optimizer that is based on the Pluto
optimization algorithms and that calculates a loop structure optimized for data-locality and paralelism.
For more information about this optimizer, see http://pluto-compiler.sourceforge.net.
Hot and Cold Attributes on Labels
T he hot and cold function attributes can now also be applied to labels. Hot labels tell the compiler that
the execution path following the label is more likely than any other execution path, and cold labels
convey the opposite meaning. T hese attributes can be used in cases where __builtin_expect
cannot be used, for instance with a computed goto or asm goto.
A.2.1.3. Debugging Enhancements
DWARF4
DWARF4 is now used as the default debugging data format when generating debugging information. T o
get the maximum benefit from this new debugging representation, use the latest version of Valgrind,
elfutils, and GDB included in this release.
New -gsplit-dwarf Option
A new command line option, -gsplit-dwarf, has been added. T his option tells the compiler driver to
separate as much DWARF debugging information as possible into a separate output file with the .dwo
file extension, and allows the build system to avoid linking files with debugging information.
In order to be useful, this option requires a debugger capable of reading .dwo files, such as the version
of GDB included in Red Hat Developer T oolset 2.0.
95
Red Hat D eveloper Toolset 2.x User Guide
Note
elfutils, SystemT ap, and Valgrind do not support the .dwo files.
A.2.1.4 . C++ Changes
Experimental C++ Features from an Upcoming Standard
g++ now supports a new command line option, -std=c++1y. T his option can be used for
experimentation with features proposed for the next revision of the standard that is expected around
2014. Currently, the only difference from -std=c++11 is support for return type deduction in normal
functions as proposed in N3386.
New thread_local Keyword
g++ now implements the C++11 thread_local keyword. In comparison with the GNU __thread
keyword, thread_local allows dynamic initialization and destruction semantics. See the next item for
dynamic initialization issues.
Dynamic Initialization of T hread-local Variables
T he C++11 and OpenMP standards allow thread-local and thread-private variables to have dynamic
(that is, runtime) initialization. T o support this, any use of such a variable goes through a wrapper
function that performs necessary initialization.
When the use and definition of the variable are in the same translation unit, this overhead can be
optimized away, but when the use is in a different translation unit, there is significant overhead even if
the variable does not actually need dynamic initialization. If the programmer can be sure that no use of
the variable in a non-defining translation unit needs to trigger dynamic initialization (either because the
variable is statically initialized, or a use of the variable in the defining translation unit will be executed
before any uses in another translation unit), they can avoid this overhead by using the new -fnoextern-tls-init option.
By default, g++ uses the -fextern-tls-init option.
C++11 Attribute Syntax
g++ now implements the C++11 attribute syntax, for example:
[[noreturn]] void f();
C++11 Alignment Specifier
g++ now implements the C++11 alignment specifier, for example:
alignas(double) int i;
A.2.1.5. Fortran Changes
A.2.1.5.1. Caveats
T he version of module files (the .m od files) has been incremented. Fortran modules compiled by earlier
GCC versions have to be recompiled when they are used by files compiled with GCC 4.8, as this version
of GCC is not able to read .m od files created by earlier versions; attempting to do so fails with an error
96
Changes in Version 2.0
message.
Note
T he ABI of the produced assembler data itself has not changed; object files and libraries are fully
compatible with older versions except as noted in Section A.2.1.5.2, “ABI Compatibility”.
A.2.1.5.2. ABI Compatibility
Some internal names used in the assembler or object file have changed for symbols declared in the
specification part of a module. If an affected module — or a file using it via use association — is
recompiled, the module and all files which directly use such symbols have to be recompiled as well. T his
change only affects the following kind of module symbols:
Procedure pointers. Note that C-interoperable function pointers (type(c_funptr)) are not affected,
nor are procedure-pointer components.
Deferred-length character strings.
A.2.1.5.3. Other Changes
BACKT RACE Intrinsic
A new intrinsic subroutine, BACKT RACE, has been added. T his subroutine shows a backtrace at an
arbitrary place in user code, program execution continues normally afterwards.
Floating Point Numbers with “q” as Exponential
Reading floating point numbers that use q for the exponential (such as 4 .0q0) is now supported as a
vendor extension for better compatibility with old data files. It is strongly recommended to use the
equivalent but standard conforming e (such as 4 .0e0) for I/O.
For Fortran source code, consider replacing the q in floating-point literals by a kind parameter (such as
4 .0e0_qp with a suitable qp). Note that — in Fortran source code — replacing q with a simple e is not
equivalent.
GFORT RAN_T MPDIR Environment Variable
T he GFORT RAN_T MPDIR environment variable for specifying a non-default directory for files opened
with ST AT US="SCRAT CH", is not used anymore. Instead, gfortran checks the POSIX/GNU standard
T MPDIR environment variable and if T MPDIR is not defined, gfortran falls back to other methods to
determine the directory for temporary files as documented in the user manual.
Fortran 2003
Support for unlimited polymorphic variables (CLASS(* )) has been added. Non-constant character
lengths are not yet supported.
T S 29113
Assumed types (T YPE(* )) are now supported.
Experimental support for assumed-rank arrays (dim ension(..)) has been added. Note that at the
moment, the gfortran array descriptor is used, which is different from the array descriptor defined in
TS 29113. For more information, see the header file of gfortran or use the Chasm language
interoperability tools.
97
Red Hat D eveloper Toolset 2.x User Guide
A.2.1.6. x86-specific Improvements
New Instructions
GCC 4.8 has added support for the Intel FXSR, XSAVE, and XSAVEOPT instructions. Corresponding
intrinsics and built-in functions can now be enabled by using the -m fxsr, -m xsave, and -m xsaveopt
command line options respectively.
In addition, support for the RDSEED, ADCX, ADOX, and PREFET CHW instructions has been added and can
be enabled by using the -m rdseed, -m adx, and -m prfchw command line options.
New Built-in Functions to Detect Run-time CPU T ype and ISA
A new built-in function, __builtin_cpu_is(), has been added to detect if the run-time CPU is of a
particular type. T his function accepts one string literal argument with the CPU name, and returns a
positive integer on a match and zero otherwise. For example, __builtin_cpu_is("westm ere")
returns a positive integer if the run-time CPU is an Intel Core i7 Westmere processor. For a complete list
of valid CPU names, see the user manual.
A new built-in function, __builtin_cpu_supports(), has been added to detect if the run-time CPU
supports a particular ISA feature. T his function accepts one string literal argument with the ISA feature,
and returns a positive integer on a match and zero otherwise. For example,
__builtin_cpu_supports("ssse3") returns a positive integer if the run-time CPU supports SSSE3
instructions. For a complete list of valid ISA names, see the user manual.
Important
If these built-in functions are called before any static constructors are invoked, such as IFUNC
initialization, then the CPU detection initialization must be explicitly run using this newly provided
built-in function, __builtin_cpu_init(). T he initialization needs to be done only once. For
example, the following is sample invocation inside an IFUNC initializer:
static void (*some_ifunc_resolver(void))(void)
{
__builtin_cpu_init();
if (__builtin_cpu_is("amdfam10h") ...
if (__builtin_cpu_supports("popcnt") ...
}
Function Multiversioning
Function multiversioning allows the programmer to specify multiple versions of the same function, each
of which is specialized for a particular variant of a given target. At runtime, the appropriate version is
automatically executed depending upon the target where the execution takes place. For example,
consider the following code fragment:
__attribute__ ((target ("default"))) int foo () { return 0; }
__attribute__ ((target ("sse4.2"))) int foo () { return 1; }
__attribute__ ((target ("arch=atom"))) int foo () { return 2; }
When the function foo() is executed, the result returned depends upon the architecture where the
program runs, not the architecture where the program was compiled. See the GCC Wiki for more details.
98
Changes in Version 2.0
New RT M and HLE Intrinsics
Support for the Intel RT M and HLE intrinsics, built-in functions, and code generation has been added and
can be enabled by using the -m rtm and -m hle command line options. T his is done via intrinsics for
Restricted Transactional Memory (RT M) and extensions to the memory model for Hardware Lock Elision
(HLE).
For HLE, two new flags can be used to mark a lock as using hardware elision:
__AT OMIC_HLE_ACQUIRE
Starts lock elision on a lock variable. T he memory model in use must be __AT OMIC_ACQUIRE
or stronger.
__AT OMIC_HLE_RELEASE
Ends lock elision on a lock variable. T he memory model must be __AT OMIC_RELEASE or
stronger.
For example, consider the following code fragment:
while (__atomic_exchange_n (& lockvar, 1, __ATOMIC_ACQUIRE
| __ATOMIC_HLE_ACQUIRE))
_mm_pause ();
// work with the acquired lock
__atomic_clear (& lockvar, __ATOMIC_RELEASE | __ATOMIC_HLE_RELEASE);
T he new intrinsics that support Restricted T ransactional Memory are:
unsigned _xbegin (void)
Attempts to start a transaction. If it succeeds, this function returns _XBEGIN_ST ART ED,
otherwise it returns a status value indicating why the transaction could not be started.
void _xend (void)
Commits the current transaction. When no transaction is active, this function causes a fault. All
memory side effects of the transactions become visible to other threads in an atomic manner.
int _xtest (void)
Returns a non-zero value if a transaction is currently active, or zero if it is not.
void _xabort (unsigned char status)
Aborts the current transaction. When no transaction is active, this is a no-op. T he parameter
status is included in the return value of any _xbegin() call that is aborted by this function.
T he following example illustrates the use of these intrinsics:
99
Red Hat D eveloper Toolset 2.x User Guide
if ((status = _xbegin ()) == _XBEGIN_STARTED)
{
// some code
_xend ();
}
else
{
// examine the status to see why the transaction failed and possibly retry
}
T ransactions Using T ransactional Synchronization Extensions
T ransactions in the transactional memory feature (the -fgnu-tm option) of GCC can now be run using
Transactional Synchronization Extensions (T SX) if available on x86 hardware.
Support for AMD Family 15h Processors
T he x86 backend of GCC now supports CPUs based on AMD Family 15h cores with the 64-bit x86
instruction set support. T his can be enabled by using the -m arch=bdver3 option.
Support for AMD Family 16h Processors
T he x86 backend of GCC now supports CPUs based on AMD Family 16h cores with the 64-bit x86
instruction set support. T his can be enabled by using the -m arch=btver2 option.
A.2.2. Changes Since Red Hat Enterprise Linux 6.4 and 5.9
T he following features have been added since the release of GCC included in Red Hat Enterprise Linux
6.4 and 5.9:
A.2.2.1. Status and Features
A.2.2.1.1. C++11
GCC 4.7 and later provides experimental support for building applications compliant with C++11 using
the -std=c++11 or -std=gnu++11 command line options. However, there is no guarantee for
compatibility between C++11 code compiled by different versions of the compiler. Refer to
Section A.2.2.3.1, “C++ ABI” for details.
T he C++ runtime library, libstdc++, supports a majority of the C++11 features. However, there is no
or only partial support for some features such as certain properties on type traits or regular
expressions. For details, refer to the libstdc++ documentation, which also lists implementationdefined behavior.
Support for C++11 exception_ptr and future requires changes to the exception handling runtime in
the system libstdc++ package. T hese changes will be distributed through the normal Z -stream channel.
Application of all Red Hat Enterprise Linux errata may be required to see correct runtime functionality
when using these features.
A.2.2.1.2. C11
GCC 4.7 and later provides experimental support for some of the features from the C11 revision of the
ISO C standard, and in addition to the previous (now deprecated) -std=c1x and -std=gnu1x
command line options, gcc now accepts -std=c11 and -std=gnu11. Note that since this support is
experimental, it may change incompatibly in future releases.
Examples for features that are supported are Unicode strings (including the predefined macros
100
Changes in Version 2.0
__ST DC_UT F_16__ and __ST DC_UT F_32__), nonreturning functions (_Noreturn and
<stdnoreturn.h>), and alignment support (_Alignas, _Alignof, m ax_align_t, and <stdalign.h>).
A.2.2.1.3. Parallelism and Concurrency
GCC 4 .7 and later provides improved support for programming parallel applications:
1. T he GCC compilers support the OpenMP API specification for parallel programming, version 3.1.
Refer to the OpenMP website for more information about this specification.
2. T he C++11 and C11 standards provide programming abstractions for multi-threaded programs.
T he respective standard libraries include programming abstractions for threads and threadrelated features such as locks, condition variables, or futures. T hese new versions of the
standard also define a memory model that precisely specifies the runtime behavior of a multithreaded program, such as the guarantees provided by compilers and the constraints
programmers have to pay attention to when writing multi-threaded programs.
Note that support for the memory model is still experimental (see below for details). For more
information about the status of support for C++11 and C11, refer to Section A.2.2.1.1, “C++11” and
Section A.2.2.1.2, “C11” respectively.
T he rest of this section describes two new GCC features in more detail. Both these features make it
easier for programmers to handle concurrency (such as when multiple threads do not run truly in parallel
but instead have to synchronize concurrent access to shared state), and both provide atomicity for
access to memory but differ in their scope, applicability, and complexity of runtime support.
C++11 T ypes and GCC Built-ins for Atomic Memory Access
C++11 has support for atomic types. Access to memory locations of this type is atomic, and appears as
one indivisible access even when other threads access the same memory location concurrently. T he
atomicity is limited to a single read or write access or one of the other atomic operations supported by
such types (for example, two subsequent operations executed on a variable of atomic type are each
atomic separately, but do not form one joint atomic operation).
An atomic type is declared as atom ic<T>, where T is the non-atomic base type and must be trivially
copyable (for example, atom ic<int> is an atomic integer). GCC does not yet support any base type T,
but only those that can be accessed atomically with the atomic instructions offered by the target
architecture. T his is not a significant limitation in practice, given that atomics are primarily designed to
expose hardware primitives in an architecture-independent fashion; pointers and integrals that are not
larger than a machine word on the target are supported as base types. Using base types that are not
yet supported results in link-time errors.
T he code generated for operations on atomic types, including the memory orders, implements the
semantics specified in the C++11 standard. However, support for the C++11 memory model is still
experimental, and for example GCC might not always preserve data-race freedom when optimizing code.
GCC also supports new built-ins for atomic memory accesses, which follow the design of the memory
model and new atomic operations. T he former set of synchronization built-ins (that is, those prefixed
with __sync) are still supported.
T ransactional Memory
Transactional Memory (T M) allows programs to declare that a piece of code is supposed to execute as
a transaction, that is, virtually atomically and in isolation from other transactions. GCC's transactional
memory runtime library, libitm , then ensures this atomicity guarantee when executing the compiled
program. Compared to atomic memory accesses, it is a higher-level programming abstraction, because it
is not limited to single memory locations, does not require special data types for the data it modifies, and
because transactions can contain arbitrary code and be nested within other transactions (with some
101
Red Hat D eveloper Toolset 2.x User Guide
restrictions explained subsequently).
GCC implements transactions as specified in the Draft Specification for T ransactional Language
Constructs for C++, version 1.1. T his draft does not yet specify the language constructs for C, but GCC
already supports a C-compatible subset of the constructs when compiling C source code.
T he main language constructs are transaction statements and expressions, and are declared by the
__transaction_atom ic or __transaction_relaxed keywords followed by a compound
statement or expression, respectively. T he following example illustrates how to increment a global
variable y if another variable x has a value less than 10:
__transaction_atomic { if (x < 10) y++; }
T his happens atomically even in a multi-threaded execution of the program. In particular, even though
the transaction can load x and y and store to y, all these memory accesses are virtually executed as
one indivisible step.
Note that in line with the C++11 memory model, programs that use transactions must be free of data
races. T ransactions are guaranteed to be virtually executed serially in a global total order that is
determined by the transactional memory implementation and that is consistent with and contributes to
the happens-before order enforced by the rest of the program (that is, transaction semantics are
specified based on the C++11 memory model, see the draft specification linked above). Nonetheless, if a
program is not data-race-free, then it has undefined behavior. For example, a thread can first initialize
some data and then make it publicly accessible by code like this:
init(data);
__transaction_atomic { data_public = true;}
// data_public is initially false
Another thread can then safely use the data, for instance:
__transaction_atomic { if (data_public) use(data); }
However, the following code has a data race and thus results in undefined behavior:
__transaction_atomic { temp = copy(data); if (data_public) use(temp); }
Here, copy(data) races with init(data) in the initializing thread, because this can be executed
even if data_public is not true. Another example for data races is one thread accessing a variable x
transactionally and another thread accessing it nontransactionally at potentially the same time. Note that
the data can be safely reclaimed using code like this (assuming only one thread ever does this):
__transaction_atomic { data_public = false; }
destruct(data);
Here, destruct() does not race with potential concurrent uses of the data because after the
transaction finishes, it is guaranteed that data_public is false and thus data is private. See the
specification and the C++11 memory model for more background information about this.
Note that even if transactions are required to virtually execute in a total order, this does not mean that
they execute mutually exclusive in time. T ransactional memory implementations attempt to run
transactions as much in parallel as possible to provide scalable performance.
T here are two variants of transactions: atomic transactions (__transaction_atom ic) and relaxed
transactions (__transaction_relaxed). T he former guarantee atomicity with regard to all other code,
102
Changes in Version 2.0
but allow only code that is known to not include nontransactional kinds of synchronization, such as
atomic or volatile memory access. In contrast, relaxed transactions allow all code (for example calls to I/O
functions), but only provide atomicity with regard to other transactions. T herefore, atomic transactions
can be nested within other atomic and relaxed transactions, but relaxed transactions can only be nested
within other relaxed transactions. Furthermore, relaxed transactions are likely to be executed with less
performance, but this depends on the implementation and available hardware.
GCC verifies these restrictions statically at compile time (for example, the requirements on code allowed
to be called from within atomic transactions). T his has implications for when transactions call functions
that are defined within other compilation unit (source file) or within libraries. T o enable such crosscompilation-unit calls for transactional code, the respective functions must be marked to contain code
that is safe to use from within atomic transactions. Programmers can do so by adding the
transaction_safe function attribute to the declarations of these functions and by including this
declaration when defining the function. In turn, GCC then verifies that the code in these functions is safe
for atomic transactions and generates code accordingly. If the programmer does not follow these
constraints and/or steps, compile-time or link-time errors occur. Note that within a compilation unit, GCC
detects automatically whether a function is safe for use within transactions, and the attributes therefore
typically do not need to be added. See the draft specification linked above for further details.
GCC's transactional memory support is designed in such a way that it does not decrease the
performance of programs that do not use transactions, nor the performance of nontransactional code,
except due to the normal kinds of interference by concurrent threads that use the same resources such
as the CPU.
T ransactional memory support in GCC and libitm is still experimental, and both the ABI and API could
change in the future if this is required due to the evolution of the specification of the language
constructs, or due to implementation requirements. Note that when executing applications built with the fgnu-tm command line option, it is currently a prerequisite to also have the appropriate version of the
libitm .so.1 shared library installed.
A.2.2.1.4 . Architecture-specific Options
Red Hat Developer T oolset 2.0 is only available for Red Hat Enterprise Linux 5 and 6, both for the 32-bit
and 64-bit Intel and AMD architectures. Consequently, the options described below are only relevant to
these architectures.
Optimization for several processors is now available through the command line options described in
T able A.1, “Processor Optimization Options”.
103
Red Hat D eveloper Toolset 2.x User Guide
T able A.1. Processor Optimization Options
Option
Description
-m arch=core2 and -m tune=core2
Optimization for Intel Core 2 processors.
-m arch=corei7 and -m tune=corei7
Optimization for Intel Core i3, i5, and i7
processors.
-m arch=corei7-avx and -m tune=corei7avx
Optimization for Intel Core i3, i5, and i7
processors with AVX.
-m arch=core-avx-i
Optimization for the Intel processor code-named
Ivy Bridge with RDRND, FSGSBASE, and F16C.
-m arch=core-avx2
Optimization for a next-generation processor from
Intel with AVX2, FMA, BMI, BMI2, and LZ CNT .
-m arch=bdver2 and -m tune=bdver2
Optimization for AMD Opteron processors codenamed Piledriver.
-m arch=btver1 and -m tune=btver1
Optimization for AMD family 14 processors codenamed Bobcat.
-m arch=bdver1 and -m tune=bdver1
Optimization for AMD family 15h processors
code-named Bulldozer.
Support for various processor-specific intrinsics and instructions is now available through the command
line options described in T able A.2, “Support for Processor-specific Intrinsics and Instructions”.
T able A.2. Support for Processor-specific Intrinsics and Instructions
Option
Description
-m avx2
Support for Intel AVX2 intrinsics, built-in functions, and code generation.
-m bm i2
Support for Intel BMI2 intrinsics, built-in functions, and code generation.
-m lzcnt
Implementation and automatic generation of __builtin_clz* using the
lzcnt instruction.
-m fm a
Support for Intel FMA3 intrinsics and code generation.
-m fsgsbase
Enables the generation of new segment register read/write instructions
through dedicated built-ins.
-m rdrnd
Support for the Intel rdrnd instruction.
-m f16c
Support for two additional AVX vector conversion instructions.
-m tbm
Support for T BM (T railing Bit Manipulation) built-in functions and code
generation.
-m bm i
Support for AMD's BMI (Bit Manipulation) built-in functions and code
generation.
-m crc32
Support for crc32 intrinsics.
-m m ovbe
Enables the use of the m ovbe instruction to implement
__builtin_bswap32 and __builtin_bswap64 .
-m xop, -m fm a4 , and m lwp
Support for the XOP, FMA4, and LWP instruction sets for the AMD Orochi
processors.
-m abm
Enables the use of the popcnt and lzcnt instructions on AMD
processors.
-m popcnt
Enables the use of the popcnt instruction on both AMD and Intel
processors.
104
Changes in Version 2.0
When using the x87 floating-point unit, GCC now generates code that conforms to ISO C99 in terms of
handling of floating-point excess precision. T his can be enabled by -fexcess-precision=standard
and disabled by -fexcess-precision=fast. T his feature is enabled by default when using
standards conformance options such as -std=c99.
Vectors of type vector long long or vector long are passed and returned using the same
method as other vectors with the VSX instruction set. Previously GCC did not adhere to the ABI for 128bit vectors with 64-bit integer base types (see GCC PR 48857).
T he -m recip command line option has been added, which indicates whether the reciprocal and
reciprocal square root instructions should be used.
T he -m veclibabi=m ass command line option has been added. T his can be used to enable the
compiler to auto-vectorize mathematical functions using the Mathematical Acceleration Subsystem
library.
T he -m single-pic-base command line option has been added, which instructs the compiler to avoid
loading the PIC base register in function prologues. T he PIC base register must be initialized by the
runtime system.
T he -m block-m ove-inline-lim it command line option has been added, which enables the user to
control the maximum size of inlined m em cpy calls and similar.
A.2.2.1.5. Link-time Optimization
Link-time optimization (LT O) is a compilation technique in which GCC generates an internal
representation of each compiled input file in addition to the native code, and writes both to the output
object file. Subsequently, when several object files are linked together, GCC uses the internal
representations of the compiled code to optimize inter-procedurally across all the compilation units. T his
can potentially improve the performance of the generated code (for example, functions defined in one file
can potentially be inlined when called in another file).
T o enable LT O, the -flto option needs to be specified at both compile time and link time. For further
details, including interoperability with linkers and parallel execution of LT O, refer to the documentation for
-flto in the GCC 4.7.0 Manual. Also note that the internal representation is not a stable interface, so
LT O will only apply to code generated by the same version of GCC.
Note
Use of Link-time Optimization with debug generation is not yet supported in gcc 4.7 and 4.8 and
so use of the -flto and the -g options together is unsupported in Red Hat Developer T oolset.
A.2.2.1.6. Miscellaneous
-Ofast is now supported as a general optimization level. It operates similar to -O3, adds options that
can yield better-optimized code, but in turn might invalidate standards compliance (for example, -ffastm ath is enabled by -Ofast).
GCC can now inform users about cases in which code generation might be improved by adding
attributes such as const, pure, and noreturn to functions declared in header files. Use the Wsuggest-attribute=[const|pure|noreturn] command line option to enable this.
Assembler code can now make use of a goto feature that allows for jumps to labels in C code.
105
Red Hat D eveloper Toolset 2.x User Guide
A.2.2.2. Language Compatibility
In this section, we describe the compatibility between the Red Hat Developer T oolset compilers and the
Red Hat Enterprise Linux system compilers at the programming-language level (for example, differences
in the implementation of language standards such as C99, or changes to the warnings generated by Wall).
Some of the changes are a result of bug fixing, and some old behaviors have been intentionally changed
in order to support new standards, or relaxed in standards-conforming ways to facilitate compilation or
runtime performance. Some of these changes are not visible to the naked eye and will not cause
problems when updating from older versions. However, some of these changes are visible, and can
cause grief to users porting to Red Hat Developer T oolset's version of GCC. T he following text attempts
to identify major issues and suggests solutions.
A.2.2.2.1. C
Constant expressions are now handled by GCC in a way that conforms to C90 and C99. For code
expressions that can be transformed into constants by the compiler but are in fact not constant
expressions as defined by ISO C, this may cause warnings or errors.
Ill-formed redeclarations of library functions are no longer accepted by the compiler. In particular, a
function with a signature similar to the built-in declaration of a library function (for example, abort() or
m em cpy()) must be declared with extern "C" to be considered as a redeclaration, otherwise it is illformed.
Duplicate Member
Consider the following struct declaration:
struct A { int *a; union { struct { int *a; }; }; };
Previously, this declaration used to be diagnosed just by the C++ compiler, now it is also diagnosed by
the C compiler. Because of the anonymous unions and structs, there is ambiguity about what .a actually
refers to and one of the fields therefore needs to be renamed.
A.2.2.2.2. C++
Header Dependency Changes
<iostream >, <string>, and other ST L headers that previously included <unistd.h> as an
implementation detail (to get some feature macros for gthr* .h purposes) no longer do so, because it
was a C++ standard violation. T his can result in diagnostic output similar to the following:
error: ‘truncate’ was not declared in this scope
error: ‘sleep’ was not declared in this scope
error: ‘pipe’ was not declared in this scope
error: there are no arguments to 'offsetof' that depend on a template
parameter, so a declaration of 'offsetof' must be available
T o fix this, add the following line early in the source or header files that need it:
#include <unistd.h>
Many of the standard C++ library include files have been edited to no longer include <cstddef> to get
namespace-std-scoped versions of size_t and ptrdiff_t. As such, C++ programs that used the
106
Changes in Version 2.0
macros NULL or offsetof without including <cstddef> will no longer compile. T he diagnostic
produced is similar to the following:
error: 'ptrdiff_t' does not name a type
error: 'size_t' has not been declared
error: 'NULL' was not declared in this scope
error: there are no arguments to 'offsetof' that depend on a template
parameter, so a declaration of 'offsetof' must be available
T o fix this issue, add the following line:
#include <cstddef>
Name Lookup Changes
G++ no longer performs an extra unqualified lookup that it incorrectly performed in the past. Instead, it
implements the two-phase lookup rules correctly, and an unqualified name used in a template must have
an appropriate declaration that:
1. is either in scope at the point of the template's definition, or
2. can be found by argument-dependent lookup at the point of instantiation.
Code that incorrectly depends on a second unqualified lookup at the point of instantiation (such as
finding functions declared after the template or in dependent bases) will result in compile-time errors.
In some cases, the diagnostics provided by G++ include hints how to fix the bugs. Consider the following
code:
template<typename T>
int t(T i)
{
return f(i);
}
int f(int i)
{
return i;
}
int main()
{
return t(1);
}
T he following diagnostics output will be produced:
In instantiation of ‘int t(T) [with T = int]’
required from here
error: ‘f’ was not declared in this scope, and no declarations were found by
argument-dependent lookup at the point of instantiation [-fpermissive]
note: ‘int f(int)’ declared here, later in the translation unit
T o correct the error in this example, move the declaration of function f() before the definition of
template function t(). T he -fperm issive compiler flag turns compile-time errors into warnings and
can be used as a temporary workaround.
107
Red Hat D eveloper Toolset 2.x User Guide
Uninitialized const
Consider the following declaration:
struct A { int a; A (); };
struct B : public A { };
const B b;
An attempt to compile this code now fails with the following error:
error: uninitialized const ‘b’ [-fpermissive]
note: ‘const struct B’ has no user-provided default constructor
T his happens, because B does not have a user-provided default constructor. Either an initializer needs
to be provided, or the default constructor needs to be added.
Visibility of T emplate Instantiations
T he ELF symbol visibility of a template instantiation is now properly constrained by the visibility of its
template arguments. For instance, users that instantiate standard library components like std::vector
with hidden user defined types such as struct m y_hidden_struct can now expect hidden visibility
for std::vector<m y_hidden_struct> symbols. As a result, users that compile with the fvisibility=hidden command line option should be aware of the visibility of types included from the
library headers used. If the header does not explicitly control symbol visibility, types from those headers
will be hidden, along with instantiations that use those types. For instance, consider the following code:
#include <vector>
// template std::vector has default visibility
#include <ctime>
// struct tm has hidden visibility
template class std::vector<tm>; // instantiation has hidden visibility
One approach to adjusting the visibility of a library header <foo.h> is to create a forwarding header on
the -I include path consisting of the following:
#pragma GCC visibility push(default)
#include_next <foo.h>
#pragma GCC visibility push
User-defined Literal Support
When compiling C++ with the -std={c++11,c++0x,gnu++11,gnu++0x} command line option, GCC
4.7.0 and later, unlike older versions, supports user-defined literals, which are incompatible with some
valid ISO C++03 code. In particular, white space is now needed after a string literal before something
that could be a valid user defined literal. Consider the following code:
const char *p = "foobar"__TIME__;
In C++03, the __T IME__ macro expands to some string literal and is concatenated with the other one. In
C++11, __T IME__ is not expanded and instead, operator "" __T IME__ is being looked up, which
results in a warning like:
error: unable to find string literal operator ‘operator"" __TIME__’
T his applies to any string literal followed without white space by some macro. T o fix this, add some white
space between the string literal and the macro name.
108
Changes in Version 2.0
T aking the Address of T emporary
Consider the following code:
struct S { S (); int i; };
void bar (S *);
void foo () { bar (&S ()); }
Previously, an attempt to compile this code produced a warning message, now it fails with an error. T his
can be fixed by adding a variable and passing the address of this variable instead of the temporary. T he
-fperm issive compiler flag turns compile-time errors into warnings and can be used as a temporary
workaround.
Miscellaneous
G++ now sets the predefined macro __cplusplus to the correct value: 199711L for C++98/03, and
201103L for C++11.
G++ now properly re-uses stack space allocated for temporary objects when their lifetime ends, which
can significantly lower stack consumption for some C++ functions. As a result of this, some code with
undefined behavior will now break.
When an extern declaration within a function does not match a declaration in the enclosing context, G++
now properly declares the name within the namespace of the function rather than the namespace which
was open just before the function definition.
G++ now implements the proposed resolution of the C++ standard's core issue 253. Default initialization
is allowed if it initializes all subobjects, and code that fails to compile can be fixed by providing an
initializer such as:
struct A { A(); };
struct B : A { int i; };
const B b = B();
Access control is now applied to typedef names used in a template, which may cause G++ to reject
some ill-formed code that was accepted by earlier releases. T he -fno-access-control option can
be used as a temporary workaround until the code is corrected.
G++ now implements the C++ standard's core issue 176. Previously, G++ did not support using the
injected-class-name of a template base class as a type name, and lookup of the name found the
declaration of the template in the enclosing scope. Now lookup of the name finds the injected-classname, which can be used either as a type or as a template, depending on whether or not the name is
followed by a template argument list. As a result of this change, some code that was previously accepted
may be ill-formed, because:
1. the injected-class-name is not accessible because it is from a private base, or
2. the injected-class-name cannot be used as an argument for a template parameter.
In either of these cases, the code can be fixed by adding a nested-name-specifier to explicitly name the
template. T he first can be worked around with -fno-access-control, the second is only rejected
with -pedantic.
A.2.2.2.3. C/C++ Warnings
GCC 4.7.0 and later adds a number of new warnings that are either enabled by default, or by using the Wall option. Although these warnings do not result in a compilation failure on their own, often -Wall is
109
Red Hat D eveloper Toolset 2.x User Guide
used in conjunction with -Werror, causing these warnings to act like errors. T his section provides a list
of these new or newly enabled warnings. Unless noted otherwise, these warnings apply to both C and
C++.
T he behavior of the -Wall command line option has changed and now includes the new warning flags Wunused-but-set-variable and, with -Wall -Wextra, -Wunused-but-set-param eter. T his
may result in new warnings in code that compiled cleanly with previous versions of GCC. For example,
consider the following code:
void fn (void)
{
int foo;
foo = bar ();
}
/* foo is never used.
*/
T he following diagnostic output will be produced:
warning: variable "foo" set but not used [-Wunused-but-set-variable]
T o fix this issue, first see if the unused variable or parameter can be removed without changing the
result or logic of the surrounding code. If not, annotate it with __attribute__((__unused__)). As a
workaround, you can use the -Wno-error=unused-but-set-variable or -Wno-error=unusedbut-set-param eter command line option.
T he -Wenum -com pare option causes GCC to report a warning when values of different enum types
are being compared. Previously, this option only worked for C++ programs, but now it works for C as
well. T his warning is enabled by -Wall and may be avoided by using a type cast.
Casting integers to larger pointer types now causes GCC to display a warning by default. T o disable
these warnings, use the -Wno-int-to-pointer-cast option, which is available for both C and C++.
Conversions between NULL and non-pointer types now cause GCC to report a warning by default.
Previously, these warnings were only displayed when explicitly using -Wconversion. T o disable these
warnings, use the new -Wno-conversion-null command line option.
GCC can now warn when a class that has virtual functions and a non-virtual destructor is destroyed by
using delete. T his is unsafe to do because the pointer might refer to a base class that does not have
a virtual destructor. T he warning is enabled by -Wall and by a new command line option, -Wdeletenon-virtual-dtor.
New -Wc++11-com pat and -Wc++0x-com pat options are now available. T hese options cause GCC
to display a warning about C++ constructs whose meaning differs between ISO C++ 1998 and ISO C++
2011 (such as identifiers in ISO C++ 1998 that are keywords in ISO C++ 2011). T his warning is enabled
by -Wall and enables the -Wnarrowing option.
A.2.2.2.4 . Fortran
A.2.2.2.4 .1. New Features
A new compile flag -fstack-arrays has been added. T his flag causes all local arrays to be put on
stack memory, which can significantly improve the performance of some programs. Note that
programs that use very large local arrays may require you to extend your runtime limits for stack
memory.
Compile time has been significantly improved. For example, the improvement may be noticeable when
110
Changes in Version 2.0
working with programs that use large array constructors.
T o improve code generation and diagnostics, the -fwhole-file compile flag is now enabled by
default, and can be used with a newly supported -fwhole-program flag. T o disable it, use the
deprecated -fno-whole-file flag.
A new command line option -M is now supported. Similarly to gcc, this option allows you to generate
Makefile dependencies. Note that the -cpp option may be required as well.
T he -finit-real= command line option now supports snan as a valid value. T his allows you to
initialize REAL and COMPLEX variables with a signaling NaN (not a number), and requires you to
enable trapping (for example, by using the -ffpe-trap= command line option). Note that compiletime optimizations may turn a signaling NaN into a quiet NaN.
A new command line option -fcheck= has been added. T his option accepts the following
arguments:
T he -fcheck=bounds option is equivalent to the -fbounds-check command line option.
T he -fcheck=array-tem ps option is equivalent to the -fcheck-array-tem poraries
command line option.
T he -fcheck=do option checks for invalid modification of loop iteration variables.
T he -fcheck=recursive option checks for recursive calls to subroutines or functions that are
not marked as recursive.
T he -fcheck=pointer option performs pointer association checks in calls, but does not
handle undefined pointers nor pointers in expressions.
T he -fcheck=all option enables all of the above options.
A new command line option -fno-protect-parens has been added. T his option allows the
compiler to reorder REAL and COMPLEX expressions with no regard to parentheses.
When OpenMP's WORKSHARE is used, array assignments and WHERE will now be run in parallel.
More Fortran 2003 and Fortran 2008 mathematical functions can now be used as initialization
expressions.
T he GCC$ compiler directive now enables support for some extended attributes such as ST DCALL.
A.2.2.2.4 .2. Compatibility Changes
T he -Ofast command line option now automatically enables the -fno-protect-parens and fstack-arrays flags.
Front-end optimizations can now be disabled by the -fno-frontend-optim ize option, and
selected by the -ffrontend-optim ize option. T he former is essentially only desirable if invalid
Fortran source code needs to be compiled (for example, when functions—as compared to
subroutines—have side-effects) or to work around compiler bugs.
T he GFORT RAN_USE_ST DERR environment variable has been removed, and GNU Fortran now
always prints error messages to standard error.
T he -fdum p-core command line option and the GFORT RAN_ERROR_DUMPCORE environment
variable have been removed. When encountering a serious error, GNU Fortran now always aborts
the execution of the program.
T he -fbacktrace command line option is now enabled by default. When a fatal error occurs, GNU
Fortran now attempts to print a backtrace to standard error before aborting the execution of the
program. T o disable this behavior, use the -fno-backtrace option.
GNU Fortran no longer supports the use of the -M command line option to generate Makefile
dependencies for the module path. T o perform this operation, use the -J option instead.
T o significantly reduce the number of warnings, the -Wconversion command line option now only
111
Red Hat D eveloper Toolset 2.x User Guide
displays warnings when a conversion leads to information loss, and a new command line option Wconversion-extra has been added to display warnings about other conversions. T he Wconversion option is now enabled with -Wall.
A new command line option -Wunused-dum m y-argum ent has been added. T his option can be
used to display warnings about unused dummy arguments, and is now enabled with -Wall. Note
that the -Wunused-variable option previously also warned about unused dummy arguments.
T he COMMON default padding has been changed. Previously, the padding was added before a
variable. Now it is added after a variable to increase the compatibility with other vendors, as well as
to help to obtain the correct output in some cases. Note that this behavior is in contrast with the
behavior of the -falign-com m ons option.
GNU Fortran no longer links against the libgfortranbegin library. T he MAIN__ assembler
symbol is the actual Fortran main program and is invoked by the m ain function, which is now
generated and put in the same object file as MAIN__. Note that the libgfortranbegin library is
still present for backward compatibility.
A.2.2.2.4 .3. Fortran 2003 Features
Improved but still experimental support for polymorphism between libraries and programs and for
complicated inheritance patterns.
Generic interface names which have the same name as derived types are now supported, which
allows the creation of constructor functions. Note that Fortran does not support static constructor
functions; only default initialization or an explicit structure-constructor initialization are available.
Automatic (re)allocation: In intrinsic assignments to allocatable variables, the left-hand side will be
automatically allocated (if unallocated) or reallocated (if the shape or type parameter is different). T o
avoid the small performance penalty, you can use a(:) = ... instead of a = ... for arrays and
character strings — or disable the feature using -std=f95 or -fno-realloc-lhs.
Experimental support of the ASSOCIAT E construct has been added.
In pointer assignments it is now possible to specify the lower bounds of the pointer and, for a rank-1
or a simply contiguous data-target, to remap the bounds.
Deferred type parameter: For scalar allocatable and pointer variables the character length can now
be deferred.
Namelist variables with allocatable attribute, pointer attribute, and with a non-constant length type
parameter are now supported.
Support has been added for procedure-pointer function results and procedure-pointer components
(including PASS).
Support has been added for allocatable scalars (experimental), DEFERRED type-bound procedures,
and the ERRMSG= argument of the ALLOCAT E and DEALLOCAT E statements.
T he ALLOCAT E statement now supports type-specs and the SOURCE= argument.
Rounding (ROUND=, RZ, ...) for output is now supported.
T he INT _FAST {8,16,32,64 ,128}_T format for ISO_C_BINDING intrinsic module type
parameters is now supported.
OPERAT OR(* ) and ASSIGNMENT (=) are now allowed as GENERIC type-bound procedures (i.e. as
type-bound operators).
A.2.2.2.4 .4 . Fortran 2003 Compatibility
Extensible derived types with type-bound procedure or procedure pointer with PASS attribute now have
to use CLASS in line with the Fortran 2003 standard; the workaround to use T YPE is no longer
supported.
112
Changes in Version 2.0
A.2.2.2.4 .5. Fortran 2008 Features
A new command line option -std=f2008ts has been added. T his option enables support for
programs that conform to the Fortran 2008 standard and the draft T echnical Specification (T S)
29113 on Further Interoperability of Fortran with C. For more information, refer to the Chart of Fortran
T S 29113 Features supported by GNU Fortran.
T he DO CONCURRENT construct is now supported. T his construct can be used to specify that
individual loop iterations do not have any interdependencies.
Full single-image support except for polymorphic coarrays has been added, and can be enabled by
using the -fcoarray=single command line option. Additionally, GNU Fortran now provides
preliminary support for multiple images via an MPI-based coarray communication library. Note that the
library version is not yet usable as remote coarray access is not yet possible.
T he ST OP and ERROR ST OP statements have been updated to support all constant expressions.
T he CONT IGUOUS attribute is now supported.
Use of ALLOCAT E with the MOLD argument is now supported.
T he ST ORAGE_SIZE intrinsic inquiry function is now supported.
T he NORM2 and PARIT Y intrinsic functions are now supported.
T he following bit intrinsics have been added:
the POPCNT and POPPAR bit intrinsics for counting the number of 1 bits and returning the parity;
the BGE, BGT , BLE, and BLT bit intrinsics for bitwise comparisons;
the DSHIFT L and DSHIFT R bit intrinsics for combined left and right shifts;
the MASKL and MASKR bit intrinsics for simple left and right justified masks;
the MERGE_BIT S bit intrinsic for a bitwise merge using a mask;
the SHIFT A, SHIFT L, and SHIFT R bit intrinsics for shift operations;
the transformational bit intrinsics IALL, IANY, and IPARIT Y.
T he EXECUT E_COMMAND_LINE intrinsic subroutine is now supported.
T he IMPURE attribute for procedures is now supported. T his allows the use of ELEMENT AL
procedures without the restrictions of PURE.
Null pointers (including NULL()) and unallocated variables can now be used as an actual argument
to optional non-pointer, non-allocatable dummy arguments, denoting an absent argument.
Non-pointer variables with the T ARGET attribute can now be used as an actual argument to
POINT ER dummies with INT ENT (IN).
Pointers that include procedure pointers and those in a derived type (pointer components) can now
also be initialized by a target instead of only by NULL.
T he EXIT statement (with construct-name) can now be used to leave the ASSOCIAT E, BLOCK, IF,
SELECT CASE, and SELECT T YPE constructs in addition to DO.
Internal procedures can now be used as actual arguments.
T he named constants INT EGER_KINDS, LOGICAL_KINDS, REAL_KINDS, and CHARACT ER_KINDS
of the intrinsic module ISO_FORT RAN_ENV have been added. T hese arrays contain the supported
'kind' values for the respective types.
T he C_SIZEOF module procedures of the ISO_C_BINDINGS intrinsic module and the
COMPILER_VERSION and COMPILER_OPT IONS module procedures of the ISO_FORT RAN_ENV
intrinsic module have been implemented.
T he OPEN statement now supports the NEWUNIT = option. T his option returns a unique file unit and
therefore prevents inadvertent use of the same unit in different parts of the program.
Unlimited format items are now supported.
113
Red Hat D eveloper Toolset 2.x User Guide
T he INT {8,16,32} and REAL{32,64 ,128} format for ISO_FORT RAN_ENV intrinsic module type
parameters are now supported.
It is now possible to use complex arguments with the T AN, SINH, COSH, T ANH, ASIN, ACOS, and
AT AN functions. Additionally, the new functions ASINH, ACOSH, and AT ANH have been added for real
and complex arguments, and AT AN(Y,X) now serves as an alias for AT AN2(Y,X).
T he BLOCK construct has been implemented.
A.2.2.2.4 .6. Fortran 2008 Compatibility
T he implementation of the ASYNCHRONOUS attribute in GCC is now compatible with the candidate draft
of TS 29113: Technical Specification on Further Interoperability with C.
A.2.2.2.4 .7. Fortran 77 Compatibility
When the GNU Fortran compiler is issued with the -fno-sign-zero option, the SIGN intrinsic now
behaves as if zero were always positive.
A.2.2.3. ABI Compatibility
T his section describes compatibility between the Red Hat Developer T oolset compilers and the system
compilers at the application binary interface (ABI) level.
A.2.2.3.1. C++ ABI
Because the upstream GCC community development does not guarantee C++11 ABI compatibility
across major versions of GCC, the same applies to use of C++11 with Red Hat Developer T oolset.
Consequently, using the -std=c++11 option is supported in Red Hat Developer T oolset 2.0 only when
all C++ objects compiled with that flag have been built using the same major version of Red Hat
Developer T oolset. T he mixing of objects, binaries and libraries, built by the Red Hat Enterprise Linux 5
or 6 system toolchain GCC using the -std=c++0x or -std=gnu++0x flags, with those built with the std=c++11 or -std=gnu++11 flags using the GCC in Red Hat Developer T oolset is explicitly not
supported.
As later major versions of Red Hat Developer T oolset may use a later major release of GCC, forwardcompatibility of objects, binaries, and libraries built with the -std=c++11 or -std=gnu++11 options
cannot be guaranteed, and so is not supported.
T he default language standard setting for Red Hat Developer T oolset is C++98. Any C++98-compliant
binaries or libraries built in this default mode (or explicitly with -std=c++98) can be freely mixed with
binaries and shared libraries built by the Red Hat Enterprise Linux 5 or 6 system toolchain GCC. Red
Hat recommends use of this default -std=c++98 mode for production software development.
Important
Use of C++11 features in your application requires careful consideration of the above ABI
compatibility information.
Aside from the C++11 ABI, discussed above, the Red Hat Enterprise Linux Application Compatibility
Specification is unchanged for Red Hat Developer T oolset. When mixing objects built with Red Hat
Developer T oolset with those built with the Red Hat Enterprise Linux v5.x/v6.x toolchain (particularly .o/.a
files), the Red Hat Developer T oolset toolchain should be used for any linkage. T his ensures any newer
library features provided only by Red Hat Developer T oolset are resolved at link-time.
A new standard mangling for SIMD vector types has been added to avoid name clashes on systems with
114
Changes in Version 2.0
vectors of varying length. By default the compiler still uses the old mangling, but emits aliases with the
new mangling on targets that support strong aliases. -Wabi will now display a warning about code that
uses the old mangling.
A.2.2.3.2. Miscellaneous
GCC now optimizes calls to various standard C string functions such as strlen(), strchr(),
strcpy(), strcat() and stpcpy() (as well as their respective _FORT IFY_SOURCE variants) by
transforming them into custom, faster code. T his means that there might be fewer or other calls to those
functions than in the original source code. T he optimization is enabled by default at -O2 or higher
optimization levels. It is disabled when using -fno-optim ize-strlen or when optimizing for size.
When compiling for 32-bit GNU/Linux and not optimizing for size, -fom it-fram e-pointer is now
enabled by default. T he prior default setting can be chosen by using the -fno-om it-fram e-pointer
command line option.
Floating-point calculations on x86 targets and in strict C99 mode are now compiled by GCC with a
stricter standard conformance. T his might result in those calculations executing significantly slower. It
can be disabled using -fexcess-precision=fast.
A.2.2.4 . Debugging Compatibility
GCC now generates DWARF debugging information that uses more or newer DWARF features than
previously. GDB contained in Red Hat Developer T oolset can handle these features, but versions of
GDB older than 7.0 cannot. GCC can be restricted to only generate debugging information with older
DWARF features by using the -gdwarf-2 -gstrict-dwarf or -gdwarf-3 -gstrict-dwarf
options (the latter are handled partially by versions of GDB older than 7.0).
Many tools such as Valgrind, SystemT ap, or third-party debuggers utilize debugging information. It is
suggested to use the -gdwarf-2 -gstrict-dwarf options with those tools.
Note
Use of Link-time Optimization with debug generation is not yet supported in gcc 4.7 and 4.8 and
so use of the -flto and the -g options together is unsupported in Red Hat Developer T oolset.
A.2.2.5. Other Compatibility
GCC is now more strict when parsing command line options, and both gcc and g++ report an error
when invalid command line options are used. In particular, when only linking and not compiling code,
earlier versions of GCC ignored all options starting with --. For example, options accepted by the linker
such as --as-needed and --export-dynam ic are not accepted by gcc and g++ anymore, and
should now be directed to the linker using -Wl,--as-needed or -Wl,--export-dynam ic if that is
intended.
Because of the new link-time optimization feature (see Section A.2.2.1.5, “Link-time Optimization”),
support for the older intermodule optimization framework has been removed and the -com bine
command line option is not accepted anymore.
A.3. Changes in binutils
Red Hat Developer T oolset 2.0 is distributed with binutils 2.23.52, which provides a number of bug
fixes and feature enhancements over the Red Hat Enterprise Linux system version and the version
115
Red Hat D eveloper Toolset 2.x User Guide
included in Red Hat Developer T oolset 1.1. Below is a comprehensive list of new features in this release.
T he GNU assembler (as), GNU linker (ld), and other binary tools that are part of binutils are now
released under the GNU General Public License, version 3.
A.3.1. GNU Linker
Another ELF linker, gold, is now available in addition to ld, the existing GNU linker. gold is intended to
be a drop-in replacement for ld, so ld's documentation is intended to be the reference documentation.
gold supports most of ld's features, except notable ones such as MRI-compatible linker scripts, crossreference reports (--cref), and various other minor options. It also provides significantly improved link
time with very large C++ applications.
In Red Hat Developer T oolset 2.0, the gold linker is not enabled by default. Users can explicitly switch
between ld and gold by using the alternatives mechanism.
A.3.1.1. New Features
Changes Since Red Hat Enterprise Linux 6.4
T he following features have been added since the release of binutils included in Red Hat Enterprise
Linux 6.4:
A new INPUT _SECT ION_FLAGS keyword has been added to the linker script language. T his
keyword can be used to select input sections by section header flags.
A new SORT _BY_INIT _PRIORIT Y keyword has been added to the linker script language. T his
keyword can be used to sort sections by numerical value of the GCC init_priority attribute
encoded in the section name.
A new SORT _NONE keyword has been added to the linker script language. T his keyword can be
used to disable section sorting.
A new linker-provided symbol, __ehdr_start, has been added. When producing ELF output, this
symbol points to the ELF file header (and nearby program headers) in the program's memory image.
Changes Since Red Hat Enterprise Linux 5.9
T he following features have been added since the release of binutils included in Red Hat Enterprise
Linux 5.9:
GNU/Linux targets now support the ST B_GNU_UNIQUE symbol binding, a GNU extension to the
standard set of ELF symbol bindings. T he binding is passed on to the dynamic linker, which ensures
that in the entire process there is only one symbol with the given name and type in use.
Note
T he implementation of this feature depends on capabilities only found in newer versions of
the glibc library. Consequently, this feature is currently available in Red Hat Developer
T oolset for Red Hat Enterprise Linux 6.
A new command line option --no-export-dynam ic has been added. T his option can be used to
undo the effect of the -E and --export-dynam ic options.
A new command line option --warn-alternate-em has been added. T his option can be used to
display a warning if an ELF format object file uses an alternate machine code.
A new linker script function REGION_ALIAS has been added. T his function can be used to create
116
Changes in Version 2.0
alias names of memory regions.
A new command line option -T text-segm ent address has been added for ELF-based targets.
T his option can be used to set the address of the first byte of the text segment.
A new linker script command INSERT has been added. T his command can be used to augment the
default script.
In a linker script input section, it is now possible to specify a file within an archive by using the
archive:file syntax.
T he --sort-com m on command line option now accepts ascending and descending as optional
arguments. T his can be used to specify which sorting order to use.
A new command line option --build-id has been added for ELF-based targets. T his option can be
used to generate a unique per-binary identifier embedded in a note section.
A new command line option --default-script=file_name (or -dT file_name) has been
added. T his option can be used to specify a replacement for the built-in linker script.
A new command line option -Bsym bolic-functions has been added. When creating a shared
library, this option will cause references to global function symbols to be bound to the definitions with
the shared library, if such exist.
T he new command line options --dynam ic-list-cpp-new and --dynam ic-list-data have
been added, which can be used to modify the dynamic list.
A.3.1.2. Compatibility Changes
Changes Since Red Hat Enterprise Linux 6.4
T he following compatibility changes have been made since the release of binutils included in Red Hat
Enterprise Linux 6.4:
T he --copy-dt-needed-entries command line option is no longer enabled by default. Instead, -no-copy-dt-needed-entries is now the default option.
Evaluation of linker script expressions has been significantly improved. Note that this can negatively
affect scripts that rely on undocumented behavior of the old expression evaluation.
Changes Since Red Hat Enterprise Linux 5.9
T he following compatibility changes have been made since the release of binutils included in Red Hat
Enterprise Linux 5.9:
T he --add-needed command line option has been renamed to --copy-dt-needed-entries in
order to avoid confusion with the --as-needed option.
For GNU/Linux systems, the linker no longer processes any relocations made against symbols of the
ST T _GNU_IFUNC type. Instead, it emits them into the resulting binary for processing by the loader.
Note
T he implementation of this feature depends on capabilities only found in newer versions of
the glibc library. Consequently, this feature is currently available in Red Hat Developer
T oolset for Red Hat Enterprise Linux 6.
T he --as-needed command line option has been adapted to link in a dynamic library in the
following two cases:
1. if the dynamic library satisfies undefined symbols in regular objects, and
2. if the dynamic library satisfies undefined symbols in other dynamic libraries unless the library
117
Red Hat D eveloper Toolset 2.x User Guide
is already found in a DT _NEEDED entry of one of the libraries that are already linked.
T he -l:file_name command line option now searches the library path for a file name called
file_name without adding the .a or .so file extension.
A.3.2. GNU Assembler
A.3.2.1. New Features
Changes Since Red Hat Enterprise Linux 6.4
T he following features have been added since the release of binutils included in Red Hat Enterprise
Linux 6.4:
T he GNU Assembler no longer requires double ampersands in macros.
A new --com press-debug-sections command line option has been added to enable
compression of DWARF debug information sections in the relocatable output file. Compressed debug
sections are currently supported by the readelf, objdum p, and gold tools, but not by ld.
Support for .bundle_align_m ode, .bundle_lock, and .bundle_unlock directives for x86
targets has been added..
On x86 architectures, the GNU Assembler now allows rep bsf, rep bsr, and rep ret syntax.
Changes Since Red Hat Enterprise Linux 5.9
T he following features have been added since the release of binutils included in Red Hat Enterprise
Linux 5.9:
GNU/Linux targets now support gnu_unique_object as a value of the .type pseudo operation.
T his value can be used to mark a symbol as globally unique in the entire process.
Support for the new discriminator column in the DWARF line table with a discriminator operand for the
.loc directive has been added.
T he .type pseudo operation now accepts a type of ST T _GNU_IFUNC. T his can be used to indicate
that if the symbol is the target of a relocation, its value should not be used. Instead, the function
should be invoked and its result used as the value.
A new pseudo operation .cfi_val_encoded_addr has been added. T his pseudo operation can
be used to record constant addresses in unwind tables without runtime relocation.
A new command line option -m sse-check=[none|error|warning] has been added for x86
targets.
T he -a command line option now accepts g as a valid sub-option. T his combination can be used to
enable assembly listings with additional information about the assembly, including the list of supplied
command line options or the assembler version.
A new command line option -m sse2avx has been added for x86 targets. T his option can be used to
encode SSE instructions with VEX prefix.
x86 targets now support the Intel XSAVE, EPT , MOVBE, AES, PCLMUL, and AVX/FMA instructions.
New command line options -m arch=cpu[,+extension… ], -m tune=cpu, m m nem onic=[att|intel], -m syntax=[att|intel], -m index-reg, -m naked-reg, and m old-gcc have been added for x86 targets.
New pseudo operations .string16, .string32, and .string64 have been added. T hese
pseudo operations be used to generate wide character strings.
T he i386 port now supports the SSE5 instruction set.
A new pseudo operation .reloc has been added. T his pseudo operation serves as a low-level
118
Changes in Version 2.0
interface for creating relocations.
A.3.3. Other Binary Tools
A.3.3.1. New Features
Changes Since Red Hat Developer T oolset 1.1
T he following features have been added since the release of binutils included in Red Hat Developer
T oolset 1.1:
A manual page for the dwp utility has been added.
T he binary tools now provide support for the AMD Family 15h processors, models 02h and 10-1fh.
Changes Since Red Hat Enterprise Linux 6.4
T he following features have been added since the release of binutils included in Red Hat Enterprise
Linux 6.4:
T he readelf and objdum p tools can now display the contents of the .debug.m acro sections.
New --dwarf-start and --dwarf-end command line options have been added to the readelf
and objdum p tools. T hese options are used by the new Emacs mode (see the dwarf-m ode.el
file).
A new --interleave-width command line option has been added to the objcopy tool to allow
the use of the --interleave to copy a range of bytes from the input to the output.
A new --dyn-sym s command line option has been added to the readelf tool. T his option can be
used to dump dynamic symbol table.
A new tool, elfedit, has been added to binutils. T his tool can be used to directly manipulate ELF
format binaries.
A new command line option --addresses (or -a for short) has been added to the addr2line
tool. T his option can be used to display addresses before function and source file names.
A new command line option --pretty-print (or -p for short) has been added to the addr2line
tool. T his option can be used to produce human-readable output.
Support for dwz -m optimized debug information has been added.
T he devtoolset-2-binutils-devel package now provides the dem angle.h header file.
Changes Since Red Hat Enterprise Linux 5.9
T he following features have been added since the release of binutils included in Red Hat Enterprise
Linux 5.9:
A new command line option --insn-width=width has been added to the objdum p tool. T his
option can be used to specify the number of bytes to be displayed on a single line when
disassembling instructions.
A new command line option --relocated-dum p=name|number has been added to the readelf
tool. T his option can be used to display the relocated contents of a section as a sequence of bytes.
A new command line option --external-sym bols-table=filename has been added to the
gprof tool. T his option can be used to read a symbol table from a certain file.
bfd now supports a plugin target, which can be used to get basic support for new file formats by
having the plugin target load the same shared objects used by gold.
T he --dwarf (or -W for short) command line option of the objdum p tool has been adapted to be
as flexible as the --debug-dum p (or -w) option of readelf.
119
Red Hat D eveloper Toolset 2.x User Guide
New command line options --prefix=prefix and --prefix-strip=level have been added to
the objdum p tool. T hese options can be used to add absolute paths for the --source (or -S for
short) option.
A new command line option -wL has been added to the readelf tool. T his option can be used to
dump decoded contents of the .debug_line section.
“T hin” archives are now supported. Instead of containing object files, such archives contain just
pathnames pointing to those files.
A new command line option -F has been added to the objdum p tool. T his option can be used to
include file offsets in the disassembly.
A new command line option -c has been added to the readelf tool. T his option can be used to
allow string dumps of archive symbol index.
T he i386 port now supports the SSE5 instruction set.
A new command line option -p has been added to the readelf tool. T his option can be used to
allow string dumps of sections.
A.3.3.2. Compatibility Changes
Changes Since Red Hat Enterprise Linux 5.9
T he following compatibility changes have been made since the release of binutils included in Red Hat
Enterprise Linux 5.9:
T he --as-needed command line option has been adapted to link in a dynamic library in the
following two cases:
1. if the dynamic library satisfies undefined symbols in regular objects, and
2. if the dynamic library satisfies undefined symbols in other dynamic libraries unless the library
is already found in a DT _NEEDED entry of one of the libraries that are already linked.
A.4. Changes in elfutils
Red Hat Developer T oolset 2.0 is distributed with elfutils 0.155, which provides a number of bug fixes
and feature enhancements over the Red Hat Enterprise Linux system version and the version included
in Red Hat Developer T oolset 1.1. Below is a comprehensive list of new features in this release.
A.4.1. Changes Since Red Hat Developer Toolset 1.1
T he following features have been added since the release of elfutils included in Red Hat Developer
T oolset 1.1:
In the libdw library, the DW_LANG_Objc constant has been correctly renamed to DW_LANG_ObjC.
Note that any existing source code that uses the old name needs to be updated accordingly.
T he libdw library now supports new constants DW_AT E_UT F and DW_OP_GNU_param eter_ref.
In addition, it also defines a family of constants to support the .debug_m acro section, namely
DW_MACRO_GNU_define, DW_MACRO_GNU_undef, DW_MACRO_GNU_start_file,
DW_MACRO_GNU_end_file, DW_MACRO_GNU_define_indirect,
DW_MACRO_GNU_undef_indirect, and DW_MACRO_GNU_transparent_include.
When working with the libelf library, both elf32_xlatetom d and elf64 _xlatetom d now
work for cross-endian ELF note data.
T he elf_getshdr() function provided by the libelf library has been corrected to work
consistently on non-mmapped ELF files after making the elf_cntl(ELF_C_FDREAD) function call.
T he libelf library now supports ar archives with a 64-bit symbol table.
120
Changes in Version 2.0
T he eu-readelf command is now able to display the contents of the .debug_m acro section.
T he eu-readelf command now correctly recognizes the DW_OP_GNU_param eter_ref DWARF
GNU extension opcode in location expressions.
A.4.2. Changes Since Red Hat Enterprise Linux 6.4
T he following features have been added since the release of elfutils included in Red Hat Enterprise
Linux 6.4:
T he libdw library now handles compressed debuginfo sections. T he dwarf_highpc() function
now handles the DWARF 4 DW_AT _high_pc constant form.
T he eu-elflint utility now accepts executables produced by the gold linker.
T he eu-nm utility now supports C++ demangling.
T he eu-ar utility now supports a new modifier D for deterministic output with no UID, GID, or mtime
info. T he U modifier is the inverse.
T he eu-readelf utility can now print SDT ELF notes (SystemTap probes) and the .gdb_index
GDB section. It can now also print DW_OP_GNU_entry_value and DW_AT _GNU_call_site
families of DIE attributes.
T he eu-strip utility now recognizes a new command line option, --reloc-debug-sections.
A.4.3. Changes Since Red Hat Enterprise Linux 5.9
In addition to the above changes, the following features have been added since the release of elfutils
included in Red Hat Enterprise Linux 5.9:
DWARF 4 is now supported. As well, support for DW_OP_GNU_im plicit_pointer and
ST B_GNU_UNIQUE has been added.
T he libdwfl library now supports automatic decompression of files compressed with gzip, bzip2
and lzm a, and of Linux kernel images made with gzip, bzip2 or lzm a. Files named with
compression suffixes are searched for Linux kernel images. Core file support was improved. Support
has been added for decoding DWARF CFI into location description form. Support has been added for
some new DWARF 3 expression operations, which were previously omitted. A new function,
dwfl_dwarf_line(), has been added.
T he eu-elfcm p utility now supports a new command line option --ignore-build-id to ignore
differing build ID bits. T he new option --verbose (or -l for short) prints all differences.
T he eu-strip utility now recognizes a new command line option --strip-sections to remove
section headers entirely.
T he libdw library now has new functions dwarf_next_unit(), dwarf_offdie_types(),
dwarf_lineisa(), dwarf_linediscrim inator(), dwarf_lineop_index(),
dwarf_getlocation_im plicit_pointer(), and dwarf_aggregate_size().
T he eu-addr2line utility now recognizes a new command line option --flags (or -F for short)
to print more DWARF line information details.
T he libelf library now supports using more than 65536 program headers in a file. In addition, a
new function elf_getphdrnum () has been added.
T he eu-addr2line utility now accepts the --section=name option (or -j name for short) in the
interests of binutils compatibility.
libcpu Intel SSE4 disassembler support has been added.
T he eu-readelf utility now implements call frame information and exception handling dumping.
T he -e command line option has been added; this is enabled implicitly by -a.
121
Red Hat D eveloper Toolset 2.x User Guide
A.5. Changes in dwz
Red Hat Developer T oolset 2.0 is distributed with dwz 0.11, which provides a number of bug fixes and
enhancements over the version included in Red Hat Developer T oolset 1.1. Below is a comprehensive
list of changes in this release.
A.5.1. Changes Since Red Hat Developer Toolset 1.1
T he following features have been added since the release of dwz included in Red Hat Developer
T oolset 1.1:
T he DW_FORM_data4 , DW_FORM_data8, and DW_AT _high_pc attributes have been optimized.
T he dwz utility now allocates more memory when recomputing abbreviations and no longer
terminates unexpectedly.
T he dwz utility no longer crashes when processing debugging information that contains several
copies of the same Debugging Information Entry (DIE) within the same compilation unit.
T he dwz utility no longer writes an incorrect DW_FORM code for a compilation unit version.
T he dwz utility now supports version 8 of the .gdb_index section.
A.6. Changes in GDB
Red Hat Developer T oolset 2.0 is distributed with GDB 7.6, which provides a number of bug fixes and
feature enhancements over the Red Hat Enterprise Linux system version and the version included in
Red Hat Developer T oolset 1.1. Below is a comprehensive list of new features in this release.
A.6.1. Changes Since Red Hat Developer Toolset 1.1
T he following features have been added since the release of GDB included in Red Hat Developer
T oolset 1.1:
T arget record has been renamed to record-full. Consequently, you can now use the record
full command to record or replay an execution log. In addition, the following commands have been
renamed:
T he set record insn-num ber-m ax and show record insn-num ber-m ax commands
have been renamed to set record full insn-num ber-m ax and show record full
insn-num ber-m ax.
T he set record m em ory-query and show record m em ory-query commands have been
renamed to set record full m em ory-query and show record full m em ory-query.
T he set record stop-at-lim it and show record stop-at-lim it commands have
been renamed to set record full stop-at-lim it and show record full stop-atlim it.
A new record target, record-btrace, has been added. T his target uses hardware support to
record the control flow of a process and can be enabled by using the record btrace command.
T his record target does not support replaying the execution.
Important
T he record-btrace target is only available on Intel Atom processors and requires the
Linux kernel in version 2.6.32 or later.
122
Changes in Version 2.0
New record instruction-history and record function-call-history commands have
been added. T hese commands allow you to view information about an execution log without having to
replay it. T he record instruction-history command displays the execution history at
instruction granularity and the record function-call-history displays the execution history
at function granularity. T he commands are only supported by the record btrace command.
A new command line option, -nh, has been added. T his option allows you to disable automatic
loading of the ~/.gdbinit file without disabling other initialization files.
T he -epoch command line option has been removed. T his option was used by GDB mode in Epoch,
a deprecated clone of the Emacs text editor.
T he ptype and whatis commands have been updated to accept an argument to control the type
formatting.
T he info proc command has been updated to work on some core files.
T he cd command has been enhanced and no longer requires a directory path as its first argument.
When executed with no arguments, the command now changes to the home directory.
GDB now uses GNU v3 ABI as the default C++ ABI. T his has been the default option for GCC since
November 2000.
T he info tracepoints command has been enhanced to display installed on target or
not installed on target for each non-pending location of a tracepoint.
A new command, fo, has been added. T his commands serves as a shorter variant of the forwardsearch command.
A new command, catch signal, has been added. T his command can be used to catch signals by
their names and is similar to the handle command, but also allows you to attach additional
conditions or commands.
A new command, m aint info bfds, has been added. T his command can be used to list all binary
files (BFDs) opened by GDB.
T wo new commands, python-interactive [command] and its shorter variant pi [command],
have been added. T hese commands allow you to start an interactive Python prompt or evaluate a
Python command and print the results to standard output.
A new command, py [command], has been added. T his command serves as a shorter variant of the
python [command] command.
New enable type-printer [name...] and disable type-printer [name...] commands
have been added. T hese commands allow you to enable or disable type printers.
New set print type m ethods on|off and show print type m ethods commands have
been added. T hese commands allow you to control whether method declarations are displayed by
the ptype command. T his functionality is enabled by default.
New set print type typedefs on|off and show print type typedefs commands have
been added. T hese commands allow you to control whether typedef definitions are displayed by
the ptype command. T his functionality is enabled by default.
New set filenam e-display basenam e|relative|absolute and show filenam edisplay commands have been added. T hese commands allow you to control the way in which file
names are displayed: the basenam e option displays only the base name of a file name, relative
displays a path relative to the compilation directory, and absolute displays an absolute path to the
file. T he default option is relative to preserve the previous behavior.
New set trace-buffer-size and show trace-buffer-size commands have been added.
T hese commands allow you to control the size of the trace buffer for a target.
New set rem ote trace-buffer-size-packet auto|on|off and show rem ote tracebuffer-size-packet commands have been added. T hese commands allow you to control the
123
Red Hat D eveloper Toolset 2.x User Guide
use of the remote protocol QT Buffer:size packet.
New set debug notification and show debug notification commands have been
added. T hese commands allow you to control whether to display debugging information for
asynchronous remote notification. T his functionality is disabled by default.
New convenience functions $_m em eq(buf1, buf2, length), $_streq(str1, str2),
$_strlen(str), and $_regex(str, regex) have been added.
T he following changes have been made to the Python scripting support since the release of GDB
included in Red Hat Developer T oolset 1.1:
Users can now create vectors by using the gdb.T ype.vector() method.
T he atexit.register() method is now supported.
Users can now pretty-print types by using the Python API.
In addition to Python 2.4 and later, GDB now also supports Python 3.
A new class, gdb.Architecture, has been added. T his class exposes the internal representation
of the architecture in the Python API.
A new method, Fram e.architecture, has been added. T his method can be used to return the
gdb.Architecture object corresponding to the frame's architecture.
Frame filters and frame decorators have been added.
T he following MI changes have been made since the release of GDB included in Red Hat Developer
T oolset 1.1:
A new async record, =cm d-param -changed, has been added. T his async record reports that a
command parameter has changed.
A new async record, =tracefram e-changed, has been added. T his async record reports that a
trace frame has been changed by using the tfind command.
New async records =tsv-created, =tsv-deleted, and =tsv-m odified have been added.
T hese async records report that a trace state variable has been created, deleted, or modified.
New async records =record-started and =record-stopped have been added. T hese async
records report that a process record has been started or stopped.
A new async record, =m em ory-changed, has been added. T his async record reports that the
memory has changed.
When the source is requested, the -data-disassem ble command now includes a new fullnam e
field containing an absolute path to the source file name.
A new optional parameter, COUNT , has been added to the -data-write-m em ory-bytes
command. T his parameter can be used to allow pattern filling of memory areas.
New commands -catch-load and -catch-unload have been added. T hese commands can be
used to intercept shared library load/unload events.
T he response to breakpoint commands and breakpoint async records now includes a new
installed field. T his field reports the current state of each non-pending tracepoint location: when
the tracepoint is installed, the value of this field is y, otherwise the value is n.
T he output of the -trace-status command now includes a new trace-file field. T his field is
only present when examining a trace file and contains the name of this file.
T he fullnam e filed is now always present along with the file field. T his field is included even if
GDB cannot find the file.
A number of new remote packets have been added since the release of GDB included in Red Hat
Developer T oolset 1.1. See T able A.3, “New Remote Packets” for a complete list.
124
Changes in Version 2.0
T able A.3. New Remote Packets
Remote Packet
Description
QT Buffer:size
Sets the size of the trace buffer. T he remote stub reports
support for this packet to the qSupported query.
Qbtrace:bts
Enables branch tracing based on Branch Trace Store (BT S) for
the current thread. T he remote stub reports support for this
packet to the qSupported query.
Qbtrace:off
Disables branch tracing for the current thread. T he remote stub
reports support for this packet to the qSupported query.
qXfer:btrace:read
Reads the traced branches for the current thread. T he remote
stub reports support for this packet to the qSupported query.
qXfer:librariessvr4 :read's annex
T he previously unused annex of the qXfer:librariessvr4 :read packet is now used to support passing of an
argument list. T he remote stub reports support for this argument
list to the qSupported query.
T he defined arguments are start and prev. T hese arguments
are used to reduce work necessary for updating the library list
and significantly speed up the process.
A.6.2. Changes Since Red Hat Enterprise Linux 6.4
T he features below have been added since the release of GDB included in Red Hat Enterprise Linux
6.4.
New Features
Support for linespecs has been improved (in particular, a more consistent handling of ambiguous
linespecs, some support for labels in the program's source, and FILE:LINE support now extends to
further linespecs types). Breakpoints are now set on all matching locations in all inferiors and will be
updated according to changes in the inferior.
New inferior control commands skip function and skip file have been added. T hese
commands can be uses to skip certain functions and files when stepping.
T he info threads command now displays the thread name as set by prctl or
pthread_setnam e_np. In addition, new commands thread nam e and thread find have been
added. T he thread nam e command accepts a name as an argument and can be used to set the
name of the current thread. T he thread find command accepts a regular expression and allows
the user to find threads that match it.
GDB now provides support for reading and writing a new .gdb_index section. T he command gdbadd-index can be used to add .gdb_index to a file, which allows GDB to load symbols from that
file faster. Note that this feature is already present in Red Hat Enterprise Linux 6.1 and later.
T he watch command has been adapted to accept -location as an optional argument.
T wo new special values can now be used when specifying the current search path for
libthread_db: $sdir represents the default system locations of shared libraries, and $pdir
stands for the directory with the libthread that is used by the application.
A new command info m acros has been added. T his command accepts linespec as an optional
argument and can be used to display the definitions of macros at that linespec location. Note that in
order to do this, the debugged program must be compiled with the -g3 command line option to have
125
Red Hat D eveloper Toolset 2.x User Guide
macro information available in it.
A new command alias has been added. T his command can be used to create an alias of an
existing command.
T he info m acro command now accepts -all and -- as valid options.
T o display a function parameter's entry value (that is, the value at the time of function entry), the
suffix @ entry can be added to the parameter. GDB now displays @ entry values in backtraces, if
available.
New set print entry-values and show print entry-values commands have been added.
T he set print entry-values command accepts both, com pact, default, if-needed, no,
only, and preferred as valid arguments and can be used to enable printing of function
arguments at function entry. T he show print entry-values command can be used to determine
whether this feature is enabled.
New set debug entry-values and show debug entry-values commands have been added.
T he set debug entry-values command can be used to enable printing of debugging information
for determining frame argument values at function entry and virtual tail call frames.
!command has been added as an alias of shell command.
T he watch command now accepts m ask mask_value as an argument. T his can be used to create
masked watchpoints.
New set extended-prom pt and show extended-prom pt commands have been added. T he
set extended-prom pt command enables support for a defined set of escape sequences that
can be used to display various information. T he show extended-prom pt command can be used
to determine whether the extended prompt is enabled.
New set basenam es-m ay-differ and show basenam es-m ay-differ commands have been
added. T he set basenam es-m ay-differ command enables support for source files with multiple
base names. T he show basenam es-m ay-differ command can be used to determine whether
this support is enabled. T he default option is off to allow faster GDB operations.
A new command line option -ix (or --init-com m and) has been added. T his option acts like -x (or
--com m and), but is executed before loading the debugged program.
A new command line option -iex (or --init-eval-com m and) has been added. T his option acts
like -ex (or --eval-com m and), but is executed before loading the debugged program.
T he info os command has been changed and can now display information on several objects
managed by the operating system, in particular:
T he info os procgroups command lists process groups.
T he info os files command lists file descriptors.
T he info os sockets command lists internet-domain sockets.
T he info os shm command lists shared-memory regions.
T he info os sem aphores command lists semaphores.
T he info os m sg command lists message queues.
T he info os m odules command lists loaded kernel modules.
GDB now has support for Static Defined Tracing (SDT ) probes. Currently, the only implemented back
end is for SystemT ap probes (the sys/sdt.h header file). You can set a breakpoint by using the
new -probe, -pstap, or -probe-stap options, and inspect the probe arguments by using the new
$_probe_arg family of convenience variables.
T he sym bol-reloading option has been deleted.
gdbserver now supports ST DIO connections, for example:
126
Changes in Version 2.0
(gdb) target remote | ssh myhost gdbserver - hello
GDB is now able to print flag enums. In a flag enum, all enumerator values have no bits in common
when pairwise AND-ed. When GDB prints a value whose type is a flag enum, GDB shows all the
constants; for example, for enum E { ONE = 1, T WO = 2}:
(gdb) print (enum E) 3
$1 = (ONE | TWO)
T he file name part of a linespec now matches trailing components of a source file name. For example,
break gcc/expr.c:1000 now sets a breakpoint in the build/gcc/expr.c file, but not in
build/libcpp/expr.c.
T he info proc and generate-core-file commands now work on remote targets connected to
gdbserver.
T he command info catch has been removed.
T he Ada-specific catch exception and catch assert commands now accept conditions at the
end of the command.
T he info static-tracepoint-m arker command now works on native targets with an inprocess agent.
GDB can now set breakpoints on inline functions.
T he .gdb_index section has been updated to include symbols for inline functions. By default, GDB
now ignores older .gdb_index sections until their .gdb_index sections can be recreated. T he
new command set use-deprecated-index-sections on causes GDB to use any older
.gdb_index sections it finds. If this option is set, the ability to set breakpoints on inline functions is
lost in symbol files with older .gdb_index sections.
T he .gdb_index section has also been updated to record more information about each symbol.
GDB now provides Ada support for GDB/MI Variable Objects.
GDB now supports breakpoint always-inserted m ode in the record target.
gdbserver now supports evaluation of breakpoint conditions. Note that you can instruct GDB to
send the breakpoint conditions in bytecode form, but gdbserver only reports the breakpoint trigger
to GDB when its condition evaluates to true.
T he z0/z1 breakpoint insertion packets have been extended to carry a list of conditional
expressions over to the remote stub depending on the condition evaluation mode. You can use the
set rem ote conditional-breakpoints-packet command to control the use of this
extension.
A new RSP packet QProgram Signals can be used to specify the signals the remote stub can
pass to the debugged program without GDB involvement.
A new command -info-os has been added as the MI equivalent of info os.
Output logs, such as set logging and related, now include MI output.
New set use-deprecated-index-sections on|off and show use-deprecated-indexsections on|off commands have been added. T hese commands allow you to control the use of
deprecated .gdb_index sections.
New catch load and catch unload commands have been added. T hese commands allow you
to stop execution of a debugged program when a shared library is loaded or unloaded.
A new command enable count has been added. T his command allows you to auto-disable a
breakpoint after several hits.
A new command info vtbl has been added. T his command allows you to show the virtual method
tables for C++ and Java objects.
127
Red Hat D eveloper Toolset 2.x User Guide
A new command explore has been added. It supports two subcommands explore value and
explore type, and allows you to recursively explore values and types of expressions. Note that
this command is only available with Python-enabled GDB.
A new command dprintf location,format,args... has been added. T his command allows you
to create a dynamic printf-type breakpoint, which performs a printf-like operation and then
resumes program execution.
New set print sym bol and show print sym bol commands have been added. T hese
commands allow you to control whether GDB attempts to display the symbol, if any, that corresponds
to addresses it prints. T his functionality is enabled by default, but you can restore the previous
behavior by running the set print sym bol off command.
New set breakpoint condition-evaluation and show breakpoint conditionevaluation commands have been added. T hese commands allow you to control whether
breakpoint conditions are evaluated by GDB (the host option), or by gdbserver (the target
option). T he default option, auto, chooses the most efficient available mode.
New set dprintf-style gdb|call|agent and show dprintf-style commands have been
added. T hese commands allow you to control the way in which a dynamic printf is performed: the
gdb option requests a GDB printf command, call causes dprintf to call a function in the
inferior, and agent requests that the target agent such as gdbserver does the printing.
New set dprintf-function expression, show dprintf-function, set dprintfchannel expression, and show dprintf-channel commands have been added. T hese
commands allow you to set the function and optional first argument to the call when using the call
style of dynamic printf.
New set disconnected-dprintf on|off and show disconnected-dprintf commands
have been added. T hese commands allow you to control whether agent-style dynamic printfs
continue to be in effect after GDB disconnects.
T he following changes have been made to the C++ language support since the release of the GNU
Debugger included in Red Hat Enterprise Linux 6.2:
When debugging a template instantiation, parameters of the template are now put in scope.
T he following changes have been made to the Python scripting support since the release of the GNU
Debugger included in Red Hat Enterprise Linux 6.2:
T he register_pretty_printer function in module gdb.printing now takes an optional
replace argument.
T he m aint set python print-stack on|off command has been deprecated and will be
deleted in GDB 7.5. T he new command set python print-stack none|full|m essage has
replaced it.
A prompt substitution hook (prom pt_hook) is now available to the Python API.
A new Python module gdb.prom pt has been added to the GDB Python modules library.
Python commands and convenience-functions located in
data_directory/python/gdb/com m and/ and data_directory/python/gdb/function/ are
now automatically loaded on GDB start-up.
Blocks now provide four new attributes: global_block, static_block, is_static, and
is_global.
T he gdb.breakpoint function has been deprecated in favor of gdb.breakpoints.
A new class gdb.FinishBreakpoint is provided.
T ype objects for struct and union types now allow access to the fields using standard Python
128
Changes in Version 2.0
dictionary (mapping) methods.
A new event gdb.new_objfile has been added.
A new function deep_item s has been added to the gdb.types module.
T he function gdb.Write now accepts an optional keyword stream .
Parameters can now be sub-classed in Python, which allows for implementation of the get_set_doc
and get_show_doc functions.
Symbols, Symbol T able, Symbol T able and Line, Object Files, Inferior, Inferior T hread, Blocks, and
Block Iterator APIs now have an is_valid method.
Breakpoints can now be sub-classed in Python, which allows for implementation of the stop function
that is executed each time the inferior reaches that breakpoint.
A new function gdb.lookup_global_sym bol has been added. T his function can be used to look
up a global symbol.
GDB values in Python are now callable if the value represents a function.
A new module gdb.types has been added.
A new module gdb.printing has been added.
New commands info pretty-printers, enable pretty-printer, and disable prettyprinter have been added.
A new gdb.param eter("directories") function call is now available.
A new function gdb.newest_fram e has been added. T his function can be used to return the
newest frame in the selected thread.
T he gdb.InferiorT hread class now supports a new nam e attribute.
Support for inferior events has been added. Python scripts can now add observers in order to be
notified of events occurring in the process being debugged.
GDB commands implemented in Python can now be put in the gdb.COMMAND_USER command class.
T he m aint set python print-stack on|off command has been removed and replaced by
set python print-stack.
A new class gdb.printing.FlagEnum erationPrinter has been added. T his class can be
used to apply flag enum -style pretty-printing to enums.
T he gdb.lookup_sym bol function now works correctly when there is no current frame.
T he gdb.Sym bol object now has an additional attribute line. T his attribute holds the line number
in the source at which the symbol was defined.
T he gdb.Sym bol object now has an additional attribute needs_fram e, and a new method value.
T he needs_fram e attribute indicates whether the symbol requires a frame to compute its value,
and the value method computes the symbol's value.
T he gdb.Value object now has a new method referenced_value. T his method can be used to
dereference a pointer as well as C++ reference values.
T he gdb.Sym tab object now has two new methods, global_block and static_block. T hese
methods return the global and static blocks (as gdb.Block objects) of the underlying symbol table
respectively.
A new method gdb.find_pc_line returns the gdb.Sym tab_and_line object associated with a
PC value.
T he gdb.Sym tab_and_line object now has an additional attribute last. T his attribute holds the
end of the address range occupied by the code for the current source line.
Compatibility Changes
129
Red Hat D eveloper Toolset 2.x User Guide
A new command info auto-load has been added and can be used to display the status of
various automatically loaded files. T he info auto-load gdb-scripts command lists
automatically loaded canned sequences of commands, info auto-load python-scripts
displays the status of automatically loaded Python scripts, info auto-load local-gdbinit
displays whether a local .gdbinit file in the current working directory is loaded, and info autoload libthread-db displays whether the inferior-specific thread debugging shared library is
loaded.
New commands set auto-load and show auto-load have been added and can be used to
control automatic loading of files:
T he set auto-load gdb-scripts and show auto-load gdb-scripts commands control
automatic loading of GDB scripts.
T he set auto-load python-scripts and show auto-load python-scripts
commands control automatic loading of Python scripts.
T he set auto-load local-gdbinit and show auto-load local-gdbinit commands
control automatic loading of .gdbinit from the current working directory.
T he set auto-load libthread-db and show auto-load libthread-db commands
control automatic loading of inferior-specific libthread_db.
T he set auto-load scripts-directory and show auto-load scripts-directory
commands control the list of directories from which to automatically load GDB and Python scripts.
T he set auto-load safe-path and show auto-load safe-path commands control the
list of directories from which it is safe to automatically load all previously mentioned items.
T he set debug auto-load and show debug auto-load commands control displaying of
debugging information for all previously mentioned items.
T he set auto-load off command can be used to disable automatic loading globally. You can
also use show auto-load with no subcommand to display current settings of all previously
mentioned items.
T he m aint set python auto-load on|off command has been replaced with set autoload python-scripts on|off.
T he m aintenance print section-scripts command has been renamed to info autoload python-scripts [pattern] and is no longer classified as a maintenance-only command.
Support for the Guile extension language has been removed.
T he GNU Debugger has been adapted to follow GCC's rules on accessing volatile objects when
reading or writing target state during expression evaluation.
A.6.3. Changes Since Red Hat Enterprise Linux 5.9
In addition to the above changes, the features below have been added since the release of GDB
included in Red Hat Enterprise Linux 5.9.
New Features
For remote targets, debugging of shared libraries is now supported by default.
New commands set observer and show observer have been added. T he set observer
command accepts on or off as an argument and can be used to allow or disallow the GNU
Debugger to affect the execution of the debugged program. Use the show observer command to
determine whether observer mode is enabled.
A new convenience variable $_thread has been added. T his variable stores the number of the
current thread.
T he source command now accepts -s as a valid option. T his option can be used to search for the
130
Changes in Version 2.0
script in the source search path regardless of the path in the file name.
Support for tracepoints, including fast and static tracepoints, has been added to gdbserver.
T he --batch command line option has been adapted to disable pagination and queries.
Direct support for the reading and writing byte, word, and double-word x86 general purpose registers
such as $al has been added.
T he com m ands command now accepts a range of breakpoints as an argument.
T he rbreak command now accepts a file name as part of its argument. T his can be used to limit the
functions selected by the supplied regular expression to those that are defined in the specified file.
Support for multi-program (sometimes referred to as multi-executable or multi-exec) debugging has
been added. In particular, the GNU Debugger now supports the following commands:
T he add-inferior command can be used to add a new inferior.
T he clone-inferior command can be used to create a copy of an inferior with the same
executable loaded.
T he rem ove-inferior command accepts an inferior ID as an argument and can be used to
remove an inferior.
Support for trace state variables has been added. In particular, the GNU Debugger now supports the
following commands:
T he tvariable $variable_name [= expression] command can be used to define or
modify a trace state variable.
T he info tvariables command can be used to display a list of currently defined trace state
variables and their values.
T he delete tvariable $variable_name... command can be used to delete one or more
trace state variables.
A new ftrace has been added. T his command accepts a function name, a line number, or an
address as an argument, and can be used to define a fast tracepoint at that location.
Support for disconnected tracing, trace files, and circular trace buffer has been added.
A new teval command has been added. T his command accepts one or more expressions to
evaluate at a tracepoint.
T he GNU Debugger has been adapted to parse the 0b prefix of binary numbers exactly the same
way as the GNU Compiler Collection.
T he GNU Debugger now supports the following commands for process record and replay:
New commands set record m em ory and show record m em ory have been added. T he
set record m em ory command accepts on or off as an argument and can be used to enable
or disable stopping the inferior when a memory change of the next instruction cannot be
recorded. Use the show record m em ory-query command to determine whether this feature
is enabled.
A new command record save has been added. T his command accepts a file name as an
argument and can be used to save the execution log to a file.
A new command record restore has been added. T his command accepts a file name as an
argument and can be used to restore the execution log from a file.
A new command eval has been added. T his command accepts a format string followed by one or
more arguments, transforms it to a command, and then executes it.
A new command save breakpoints has been added. T his command accepts a file name as an
argument and can be used to store all currently defined breakpoints to a file. T o restore the saved
breakpoints from this file, use the source command.
New commands set m ay-write-registers, set m ay-write-m em ory, set m ay-insertbreakpoints, set m ay-insert-tracepoints, set m ay-insert-fast-tracepoints, and
131
Red Hat D eveloper Toolset 2.x User Guide
set m ay-interrupt have been added. All of these commands accept either on or off as an
argument, and can be used to set individual permissions for the target.
A new command m ain info program -spaces has been added. T his command can be used to
display information about currently loaded program spaces.
New commands set rem ote interrupt-sequence and show rem ote interruptsequence have been added. T he set rem ote interrupt-sequence command accepts CtrlC, BREAK, and BREAK-g as valid arguments, and can be used to specify which interrupt sequence to
send to the remote target in order to interrupt its execution. Use the show rem ote interruptsequence to determine the current setting.
New commands set rem ote interrupt-on-connect and show rem ote interrupt-onconnect have been added. T he set rem ote interrupt-on-connect accepts either on or
off as an argument, and can be used to enable sending an interrupt sequence to the remote target
when the GNU Debugger connects to it. Use the show rem ote interrupt-on-connect
command to determine whether this feature is enabled.
T he set rem otebreak and show rem otebreak commands have been deprecated and users
are advised to use set rem ote interrupt-sequence and show rem ote interruptsequence instead.
T he disassem ble command has been adapted to accept two arguments in the form of
start,+length.
T he source command can now be used to read commands from Python scripts.
T he following changes have been made to the C++ language support since the release of the GNU
Debugger included in Red Hat Enterprise Linux 5.8:
Argument-dependent lookup (ADL) now directs function search to the namespaces of its arguments
regardless of whether the namespace has been imported.
In addition to member operators, the GNU Debugger can now look up operators that are:
defined in the global scope,
defined in a namespace and imported via the using directive,
implicitly imported from an anonymous namespace, or
the argument-dependent lookup (ADL operators.
Support for printing of static const class members that are initialized in the class definition has been
enhanced.
Support for importing of namespaces has been added.
T he C++ expression parser has been adapted to handle the cast operators static_cast<>,
dynam ic_cast<>, const_cast<>, and reinterpret_cast<>.
T he following changes have been made to the Python scripting support since the release of the GNU
Debugger in Red Hat Enterprise Linux 5.8:
T he GNU Debugger is now installed with a new directory located at /opt/rh/devtoolset2/root/usr/share/gdb/python/. T his directory serves as a standard location for Python
scripts written for GDB.
T he Python API has been adapted to provide access to symbols, symbol tables, program spaces,
breakpoints, inferiors, threads, and frame's code blocks. Users are now also allowed to create
custom GDB parameters from the API and manipulate them by using the set and show commands.
New functions gdb.target_charset, gdb.target_wide_charset, gdb.progspaces,
gdb.current_progspace, and gdb.string_to_argv have been added.
A new exception gdb.GdbError has been added.
132
Changes in Version 2.0
T he GNU Debugger now searches pretty-printers in the current program space.
T he GNU Debugger can now enable or disable pretty-printers individually.
T he GNU Debugger has been adapted to look for names of Python scripts to automatically load in a
special section named .debug_gdb_scripts.
A.7. Changes in strace
Red Hat Developer T oolset 2.0 is distributed with strace 4 .7, which provides a number of bug fixes and
feature enhancements over the Red Hat Enterprise Linux system version. Below is a comprehensive list
of new features in this release.
A.7.1. Changes Since Red Hat Enterprise Linux 6.4 and 5.9
T he following features have been added since the release of strace in Red Hat Enterprise Linux 6.4 and
5.9:
A new command line option, -y, has been added. T his option can be used to print file descriptor
paths.
A new command line option, -P, has been added. T his option can be used to filter system calls
based on the file descriptor paths.
A new command line option, -I, has been added. T his option can be used to control how interactive
strace is.
A new command line utility, strace-log-m erge, has been added. T his utility can be used to merge
timestamped strace output into a single file.
T he strace utility now uses optimized interfaces to extract data from the traced process for better
performance.
T he strace utility now provides improved support for decoding of arguments for various system
calls. In addition, a number of new system calls are supported.
A.8. Changes in SystemTap
Red Hat Developer T oolset 2.0 is distributed with SystemT ap 2.1, which provides a number of bug
fixes and feature enhancements over the Red Hat Enterprise Linux system version and the version
included in Red Hat Developer T oolset 1.1. Below is a comprehensive list of new features in this release.
A.8.1. Changes Since Red Hat Developer Toolset 1.1
T he following features have been added since the release of SystemT ap included in Red Hat Developer
T oolset 1.1:
SystemT ap has been updated to provide experimental support for Dyninst-based probing in the
user space. Users can now execute the stap utility with the --dyninst command line option to
instrument their own programs without the need to acquire root privileges.
SystemT ap is now distributed with a number of manual pages that provide a detailed explanation of
common errors:
T he error::buildid(7stap) manual page documents build-id verification failures.
T he error::dwarf(7stap) manual page documents common DWARF debuginfo quality
problems.
T he error::fault(7stap) manual page documents memory access faults.
T he error::inode-uprobes(7stap) manual page documents current limitations of inodeuprobes.
133
Red Hat D eveloper Toolset 2.x User Guide
T he error::pass1(7stap) manual page documents pass 1 (parsing) errors.
T he error::pass2(7stap) manual page documents pass 2 (elaboration) errors.
T he error::pass3(7stap) manual page documents pass 3 (translation) errors.
T he error::pass4 (7stap) manual page documents pass 4 (compilation) errors.
T he error::pass5(7stap) manual page documents pass 5 (execution) errors.
T he error::process-tracking(7stap) manual page documents user-space process
tracking errors.
T he error::reporting(7stap) manual page documents how to report SystemT ap bugs.
T he scripting language used by SystemT ap now supports the =~ operator. Users can use this
operator to match regular expressions.
T he preprocessor used by the stap utility now supports an experimental macro facility. Users can
use the following construct to define new macros:
@define name(parameter...) %( body %)
Refer to the PREPROCESSOR MACROS section of the stap(1) manual page for more information
on how to use this feature.
T he backtrace-related tapset functions have been improved and standardized.
A.9. Changes in OProfile
Red Hat Developer T oolset 2.0 is distributed with OProfile 0.9.8, which provides a number of a number
of bug fixes and feature enhancements over the Red Hat Enterprise Linux system version and the
version included in Red Hat Developer T oolset 1.1. Below is a comprehensive list of new features in this
release.
A.9.1. Changes Since Red Hat Developer Toolset 1.1
T he following features have been added since the release of OProfile included in Red Hat Developer
T oolset 1.1:
A new command line utility, operf, has been added. T his utility can be executed by a non-root user
and can be used to collect profiling data.
Important
T he operf utility relies on a kernel feature that is currently not available in Red Hat
Enterprise Linux 5. Consequently, this utility only works and is supported on Red Hat
Enterprise Linux 6.
OProfile now supports Intel processors code-named Ivy Bridge.
A.9.2. Changes Since Red Hat Enterprise Linux 5.9
T he following features have been added since the release of OProfile included in Red Hat Enterprise
Linux 5.9:
OProfile now supports AMD family11h, family12h, family14h, and AMD family15h processors.
Generation of XML output has been corrected.
Handling of the --session-dir command line option has been improved and a possible buffer
134
Changes in Version 2.0
overflow in the XML generator has been fixed.
A.10. Changes in Valgrind
Red Hat Developer T oolset 2.0 is distributed with Valgrind 3.8.1, which provides a number of bug fixes
over the version included in Red Hat Developer T oolset 1.1. Below is a comprehensive list of changes in
this release.
A.10.1. Changes Since Red Hat Developer Toolset 1.1
T he following features have been added since the release of Valgrind included in Red Hat Developer
T oolset 1.1:
T he DWARF debug information for Valgrind is now distributed in a separate package, devtoolset-2valgrind-debuginfo.
T he SGCHECK OPTIONS section of the valgrind(1) manual page has been corrected and no
longer includes the BBV options. As well, the BBV options are now listed in a separate section.
A.10.2. Changes Since Red Hat Enterprise Linux 5.9
In addition to the above changes, the following features have been added since the release of Valgrind
3.5.0 included in Red Hat Enterprise Linux 5.9:
When running in 64-bit mode, Valgrind now supports the SSE4.2 instruction set with the exception of
SSE4.2 AES instructions. In 32-bit mode, Valgrind only provides support up to and including the
SSSE3 instruction set.
A new processing script cg_diff has been added to Cachegrind. T his processing script can find
the difference between two profiles, and can therefore be used to evaluate the performance effects
of a change in a program.
T he behavior of the cg_annotate's rarely-used --threshold option has been changed.
Callgrind now supports branch prediction simulation and can optionally count the number of
executed global bus events. Note that in order to use this functionality for a better approximation of a
“Cycle Estimation” as a derived event, you must manually update the event formula in KCachegrind.
T o accommodate machines with three levels of caches, both Cachegrind and Callgrind now refer
to the LL (last-level) cache rather than the L2 cache. When Cachegrind or Callgrind auto-detects
the cache configuration of such a machine, it now runs the simulation as if the L2 cache is not
present. Consequently, the results are less likely to match the true result for the machine and should
not be considered authoritative, but provide a general idea about a program's locality.
A new command line option --pages-as-heap has been added to Massif. When this option is
enabled, Massif tracks memory allocations at the level of memory pages (as mapped by m m ap, brk
and similar functions) instead of tracking allocations at the level of heap blocks (as allocated with
m alloc, new, or new[]). Each mapped page is treated as its own block. Interpreting the page-level
output is harder than the heap-level output, but allows you to account for every byte of memory used
by a program. By default, the --pages-as-heap option is disabled.
New command line options --free-is-write and --trace-alloc have been added to DRD.
T he --free-is-write option allows you to detect reading from already freed memory, the -trace-alloc can be used to trace of all memory allocations and deallocations.
A number of new allocations have been added to DRD. As well, you can now annotate custom barrier
implementations and benign races on static variables.
DRD's happens before and happens after annotations have been enhanced and can be used to
annotate, for example, a smart pointer implementation.
Helgrind's annotation set has been significantly improved to provide a general set of annotations to
135
Red Hat D eveloper Toolset 2.x User Guide
describe locks, semaphores, barriers, and condition variables. In addition, Helgrind now supports
annotations to describe thread-safe reference counted heap objects.
A new command line option --show-possibly-lost has been added to Memcheck. By default
this option is enabled and causes the leak detector to show possibly-lost blocks.
A new experimental heap profiler, DHAT (Dynamic Heap Analysis T ool), has been added. DHAT
keeps track of allocated heap blocks, and also inspects every memory reference to see which block
(if any) is being accessed. T his gives a lot of insight into block lifetimes, utilization, turnover, liveness,
and the location of hot and cold fields. You can use DHAT to do hot-field profiling.
Support for unfriendly self-modifying code has been improved, and the extra overhead incurred by -sm c-check=all has been reduced by approximately a factor of 5 as compared with the previous
version of Valgrind.
A new command line option --fullpath-after has been added. T his option can be used to
display directory names for source files in error messages, and is combined with a flexible
mechanism for specifying which parts of the paths should be shown.
A new command line option --require-text-sym bol has been added. T his option stops the
execution if a specified symbol is not found in a given shared object when loaded into the process.
As a result, working with function intercepting and wrapping is now safer and more reliable.
Valgrind now implements more reliable stack unwinding on amd64-linux, particularly in the presence
of function wrappers, and with gcc-4.5 compiled code.
Valgrind now implements modest scalability (performance improvements) for very large, long-running
applications.
Valgrind now provides improved support for analyzing programs that are running in Wine. Users can
now include the valgrind/valgrind.h, valgrind/m em check.h, and valgrind/drd.h
header files in Windows programs that are compiled with MinGW or one of the Microsoft Visual
Studio compilers.
136
Revision History
Revision History
Revision 1.0-2
T ue 10 Sep 2013
Red Hat Developer T oolset 2.0 GA release of the User Guide.
Jaromír Hradílek
Revision 1.0-1
T ue 06 Aug 2013
Jaromír Hradílek
Red Hat Developer T oolset 2.0 Beta-2 release of the User Guide.
Revision 1.0-0
T ue 28 May 2013
Jaromír Hradílek
Red Hat Developer T oolset 2.0 Beta-1 release of the User Guide.
Index
A
ABI
- compatibility, ABI Compatibility
addr2line
- features, New Features
- overview, binutils
- usage, Using Other Binary T ools
application binary interface (see ABI)
ar
- overview, binutils
- usage, Using Other Binary T ools
as (see GNU assembler)
assembling (see GNU assembler)
B
bfd
- features, New Features
binutils
-
documentation, Additional Resources
features, Main Features
installation, Installing binutils
overview, binutils
usage, Using the GNU Assembler, Using the GNU Linker, Using Other Binary T ools
version, About Red Hat Developer T oolset, binutils
C
C programming language
137
Red Hat D eveloper Toolset 2.x User Guide
- compiling, Using the C Compiler, Preparing a Program for Debugging
- running, Running a C Program
- support, GNU C Compiler
C++ programming language
- compiling, Using the C++ Compiler, Preparing a Program for Debugging
- running, Running a C++ Program
- support, GNU C++ Compiler
C++11 (see GNU Compiler Collection)
c++filt
- overview, binutils
- usage, Using Other Binary T ools
C11 (see GNU Compiler Collection)
Cachegrind
- overview, Valgrind
- usage, Using Valgrind
Callgrind
- overview, Valgrind
- usage, Using Valgrind
compatibility
- GNU Compiler Collection, Language Compatibility, Compatibility Changes, Fortran 2003
Compatibility, Fortran 2008 Compatibility, Fortran 77 Compatibility, ABI Compatibility,
Debugging Compatibility, Other Compatibility
- Red Hat Developer T oolset, Compatibility
compiling (see GNU Compiler Collection)
Customer Portal
- Connect menu, T he Connect Menu
- Deploy menu, T he Deploy Menu
- overview, Accessing the Customer Portal
- Plain menu, T he Plan Menu
D
debugging (see GNU Debugger)
Developer T oolset (see Red Hat Developer T oolset)
documentation
- Red Hat Product Documentation, Accessing Red Hat Product Documentation
DRD
138
Revision History
- overview, Valgrind
- usage, Using Valgrind
dwp
- overview, binutils
- usage, Using Other Binary T ools
dwz
-
documentation, Additional Resources
installation, Installing dwz
overview, dwz
usage, Using dwz
version, About Red Hat Developer T oolset, dwz
-
documentation, Additional Resources
installation, Installing Dyninst
overview, Dyninst
usage, Using Dyninst
version, About Red Hat Developer T oolset, Dyninst
-
configuration, Using the Red Hat Enterprise Linux T oolchain
documentation, Additional Resources
installation, Installing Eclipse
overview, Eclipse
usage, Using Eclipse
version, About Red Hat Developer T oolset, Eclipse
Dyninst
E
Eclipse
elfedit
- features, New Features
- overview, binutils
- usage, Using Other Binary T ools
elfutils
-
documentation, Additional Resources
installation, Installing elfutils
overview, elfutils
usage, Using elfutils
version, About Red Hat Developer T oolset, elfutils
eu-addr2line
- features, Changes Since Red Hat Enterprise Linux 5.9
- overview, elfutils
- usage, Using elfutils
139
Red Hat D eveloper Toolset 2.x User Guide
eu-ar
- features, Changes Since Red Hat Enterprise Linux 6.4
- overview, elfutils
- usage, Using elfutils
eu-elfcmp
- features, Changes Since Red Hat Enterprise Linux 5.9
- overview, elfutils
- usage, Using elfutils
eu-elflint
- features, Changes Since Red Hat Enterprise Linux 6.4
- overview, elfutils
- usage, Using elfutils
eu-findtextrel
- overview, elfutils
- usage, Using elfutils
eu-make-debug-archive
- overview, elfutils
- usage, Using elfutils
eu-nm
- features, Changes Since Red Hat Enterprise Linux 6.4
- overview, elfutils
- usage, Using elfutils
eu-objdump
- overview, elfutils
- usage, Using elfutils
eu-ranlib
- overview, elfutils
- usage, Using elfutils
eu-readelf
- features, Changes Since Red Hat Enterprise Linux 6.4, Changes Since Red Hat
Enterprise Linux 5.9
- overview, elfutils
- usage, Using elfutils
eu-size
14 0
Revision History
- overview, elfutils
- usage, Using elfutils
eu-strings
- overview, elfutils
- usage, Using elfutils
eu-strip
- features, Changes Since Red Hat Enterprise Linux 6.4, Changes Since Red Hat
Enterprise Linux 5.9
- overview, elfutils
- usage, Using elfutils
eu-unstrip
- overview, elfutils
- usage, Using elfutils
F
feedback
- contact information for this manual, We Need Feedback
Fortran programming language
- compiling, Using the Fortran Compiler
- running, Running a Fortran Program
- support, GNU Fortran Compiler
G
g++ (see GNU Compiler Collection)
GAS (see GNU assembler)
GCC (see GNU Compiler Collection)
gcc (see GNU Compiler Collection)
GDB (see GNU Debugger)
gfortran (see GNU Compiler Collection)
Global Support Services
- contacting, Contacting Global Support Services
GNU assembler
- documentation, Additional Resources
- installation, Installing binutils
- overview, binutils
- usage, Using the GNU Assembler
14 1
Red Hat D eveloper Toolset 2.x User Guide
GNU Binutils (see binutils)
GNU Compiler Collection
- C support, GNU C Compiler
- C++ support, GNU C++ Compiler
- compatibility, Language Compatibility, Compatibility Changes, Fortran 2003 Compatibility,
Fortran 2008 Compatibility, Fortran 77 Compatibility, ABI Compatibility, Debugging
Compatibility, Other Compatibility
- documentation, Additional Resources
- features, Main Features, Status and Features, New Features, Fortran 2003 Features,
Fortran 2008 Features
- Fortran support, GNU Fortran Compiler
- installation, Installing the C Compiler, Installing the C++ Compiler, Installing the Fortran
Compiler
- overview, GNU Compiler Collection (GCC)
- usage, Using the C Compiler, Using the C++ Compiler, Using the Fortran Compiler,
Preparing a Program for Debugging
- version, About Red Hat Developer T oolset, GNU Compiler Collection (GCC)
GNU Debugger
- documentation, Additional Resources
- features, Main Features
- installation, Installing the GNU Debugger
- overview, GNU Debugger (GDB)
- preparation, Preparing a Program for Debugging
- usage, Running the GNU Debugger, Listing Source Code, Setting Breakpoints, Starting
Execution, Displaying Current Values, Continuing Execution
- version, About Red Hat Developer T oolset, GNU Debugger (GDB)
GNU linker
- documentation, Additional Resources
- installation, Installing binutils
- overview, binutils
- usage, Using the GNU Linker
gprof
- features, New Features
- overview, binutils
- usage, Using Other Binary T ools
GSS (see Global Support Services)
H
Helgrind
- overview, Valgrind
- usage, Using Valgrind
help
14 2
Revision History
-
accessing the Customer Portal, Accessing the Customer Portal
getting help, Do You Need Help?
Global Support Services, Contacting Global Support Services
Red Hat Product Documentation, Accessing Red Hat Product Documentation
L
ld (see GNU linker)
linking (see GNU linker)
M
Massif
- overview, Valgrind
- usage, Using Valgrind
Memcheck
- overview, Valgrind
- usage, Using Valgrind
memstomp
- documentation, Additional Resources
- installation, Installing memstomp
- overview, memstomp
- usage, Using memstomp
- version, About Red Hat Developer T oolset
N
nm
- overview, binutils
- usage, Using Other Binary T ools
O
objcopy
- features, New Features
- overview, binutils
- usage, Using Other Binary T ools
objdump
- features, New Features
- overview, binutils
- usage, Using Other Binary T ools
opannotate
14 3
Red Hat D eveloper Toolset 2.x User Guide
- overview, OProfile
- usage, Using OProfile
oparchive
- overview, OProfile
- usage, Using OProfile
opcontrol
- overview, OProfile
- usage, Using OProfile
opgprof
- overview, OProfile
- usage, Using OProfile
ophelp
- overview, OProfile
- usage, Using OProfile
opimport
- overview, OProfile
- usage, Using OProfile
opjitconv
- overview, OProfile
- usage, Using OProfile
opreport
- overview, OProfile
- usage, Using OProfile
OProfile
-
documentation, Additional Resources
installation, Installing OProfile
overview, OProfile
usage, Using OProfile
version, About Red Hat Developer T oolset, OProfile
oprofiled
- overview, OProfile
- usage, Using OProfile
R
14 4
Revision History
ranlib
- overview, binutils
- usage, Using Other Binary T ools
readelf
- features, New Features
- overview, binutils
- usage, Using Other Binary T ools
Red Hat Customer Portal (see Customer Portal)
Red Hat Developer T oolset
- compatibility, Compatibility
- documentation, Additional Resources, Accessing Red Hat Product Documentation
- features, Main Features
- installation, Installing Red Hat Developer T oolset
- overview, About Red Hat Developer T oolset
- subscription, Getting Access to Red Hat Developer T oolset
- support, About Red Hat Developer T oolset
- uninstallation, Uninstalling Red Hat Developer T oolset
- update, Updating Red Hat Developer T oolset
Red Hat Enterprise Linux
- documentation, Additional Resources, Accessing Red Hat Product Documentation
- supported versions, Compatibility
Red Hat Subscription Management
- subscription, Using Red Hat Subscription Management
RHN Classic
- subscription, Using RHN Classic
S
scl (see Software Collections)
size
- overview, binutils
- usage, Using Other Binary T ools
Software Collections
- documentation, Additional Resources, Accessing Red Hat Product Documentation
- overview, About Red Hat Developer T oolset
stap
- overview, SystemT ap
- usage, Using SystemT ap, Using Dyninst with SystemT ap
14 5
Red Hat D eveloper Toolset 2.x User Guide
stap-merge
- overview, SystemT ap
- usage, Using SystemT ap
stap-prep
- overview, SystemT ap
- usage, Installing SystemT ap
stap-report
- overview, SystemT ap
- usage, Using SystemT ap
staprun
- overview, SystemT ap
- usage, Using SystemT ap
stapsh
- overview, SystemT ap
- usage, Using SystemT ap
strace
-
documentation, Additional Resources
installation, Installing strace
overview, strace
usage, Using strace
version, About Red Hat Developer T oolset, strace
strings
- overview, binutils
- usage, Using Other Binary T ools
strip
- overview, binutils
- usage, Using Other Binary T ools
support
- Red Hat Developer T oolset, About Red Hat Developer T oolset
SystemT ap
- documentation, Additional Resources
- installation, Installing SystemT ap
- overview, SystemT ap
- usage, Using SystemT ap, Using Dyninst with SystemT ap
14 6
Revision History
- version, About Red Hat Developer T oolset, SystemT ap
V
Valgrind
-
documentation, Additional Resources
installation, Installing Valgrind
overview, Valgrind
usage, Using Valgrind
version, About Red Hat Developer T oolset, Valgrind
version
- version, memstomp
14 7