1
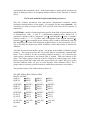
A user's guide to – Rfit2000 Contents 1. Introduction 2. How to run program ? 3. Input files and its format. 3.1 Command file 3.2 File of experimental data 3.3 File with model description and initial parameters. 3.4 File of constrains on parameters of model. 4. Run. 5. Out put files. 6. Questions and bugs. 7. References 1. Introduction The RFIT2000 program is created to fit X-ray and neutron reflectivity data. The search of global minima is done via successive descent from local minima [5]. This method can be treated as a loop of two stages repeated consequently. The first stage is the local minimization of the χ2 -like criterion and the second one is the descent from the most recent local minimum. This is a way how program search the global minimum. Minimal requirement for a computer: any PC with any Windows operation system. The program fits the model parameters to experimental data. Local minimization procedure is based on the algorithm called 'Downhill Simplex Method' [1]. One of the three methods to calculate reflectivity may be chosen optionally: • • • Fourier transformation of electron density [2]; Parratt algorithm [3]; Matrix method [4]. The reflectivity is calculated with taking into account an instrumental resolution function. That usually is not delta function due to wave length dispersion, divergence of the incident beam and finite aperture of a detector. Moreover the resolution function is function of scattering vector Qz=4*π*sin(θ)/λ. Where π is pi number, θ is grazing angle and λ is wave length. Optionally the program makes statistical analysis of found solution [6] that gives estimation of parameters uncertainties. The merit function has the next form 1 χ2 = N −M I exp( j ) − K ⋅ Ical ( j ) ∑ dI exp( j ) 2 Where j=1..N, and N is total number of experimental point; M is number of variable parameters and K scaling factor To learn more details about merit function and application of instrumental resolution in the program see ref. [6, 7, 8]. 2. How to run program ? Just click on file RFIT2000.EXE. There are four supplementary input files needed for the program operation: 1) Command file; 2) File with experimental data; 3) File with model description and 4) File with constrains on model parameters. There are examples of input and output files (input: glob.inp; glob.dat; glob.mdl; glob.lmt. output :glob.loc; glob.pct; glob.bst). These file will help to understand instructions given below and serve as a test. 3. Input files format. 3.1 Command file The definition of input files names and some miscellaneous information contains in command file. This file contains following information: • Names of experimental data file (*.dat) • Operation mode (Fit or Simulation) • Apply or not the scaling of the data • Presence or absence of uncertainty column (error bar) in the experimental data • Name of model file with parameters of initial guess (*.mdl) • Name of file with the constrains on parameters (min, max) (*.lmt) • Tolerance limit to stop fitting /2*(x2max - x2min)/(x2max + x2min)/. Default is 10-5 • Number of maximum iteration in the fit session. Default is 60000 • Cutoff Level. Default is 0. If the calculated intensity below the cutoff level then intensity takes the value of this level. • Calculation Method: One of three Matrix, Parratt, Fourier An example of command file has name glob.inp. If the experimental data is not normalized on intensity of incident beam the option APPLY SCALING have to be selected. There is no difference between Matrix and Parratt method of calculation in terms of result. However Matrix method takes less time in case of structure with a multiple repetition of a unit. 3.2 File of experimental data An example of such a kind of file has name glob.dat. The extension DAT for experimental data is not obligatory. The data are expected to be in a 2 or 3 column format. The first column is the grazing angle in degree or reciprocal Angstrom. The second column is the specular intensity or reflectivity (Iexp). Third column (optional) is the error bar for experimental data at given point (dIexp). Usually it is statistical errors of determination of Iexp. Error bar is used to weight the difference between experimental and calculated values. If the third column is missing then question will appear in dialog to choose as weighting method (fraction of the intensity or Fresnel curve). 3.3 File with model description and initial parameters. This file contains parameters that characterize instrumental resolution, model description and parameters of the model. An example file has name glob.mdl. All extensions are allowed except of BST, PCT and LOC that reserved for extension of output files. In RFIT2000, a model of scattering density profile of the film is represented as a pile of homogeneous slabs. A slab is a fundamental building block defined by 4 parameters: thickness (d) in Angstrom, real (δ) and imaginary (β) part of complex refractive index N = 1 - δ - i*β, and a value of roughness of the toppest interface (σ). Instead of δ and β the scattering power density profile could be determined with real and imaginary pert of the SLD (scattering length density) or electron density (el/A3). Top is towards the media from which irradiation comes and bottom is towards the substrate. All slabs are associated with three group. The group in the middle of film has special property. This group describes the set of slabs that are periodically repeated NRU times. This is made to be able to model periodical structures. So to describe the whole group a description of one Repeat Unit is enough. This unit consists of RU slabs. The others groups relatively to theirs location to central group have names Before repeat Units (BU slabs) and After repeat Units (AU slabs). BU part is at the interface Ambient / Film. AU part is at the interface Film / Substrate (Sub). This 3 groups allow to describe periodic structures with different structures at interfaces. The general format of file with model description is WL dWL dTheta dDet VdTheta VdDet BU RU AU NRU d_BU(1) δ_BU(1) β_BU(1) d_BU(2) δ_BU(2) β_BU(2) ................. ................. ................. d_BU(BU) δ_BU(BU) β_BU(BU) d_RU(1) δ_RU(1) β_RU(1) d_RU(2) δ_RU(2) β_RU(2) ................. ................. ................. d_RU(RU) δ_RU(RU) β_RU(RU) d_AU(1) δ_AU(1) β_AU(1) d_AU(2) δ_AU(2) β_AU(2) ................. ................. ................. d_AU(AU) δ_AU(AU) β_AU(AU) d_Sub≡0 δ_Sub β_Sub Here σ_BU(1) σ_BU(2) ................. σ_BU(BU) σ_RU(1) σ_RU(2) ................. σ_RU(RU) σ_AU(1) σ_AU(2) ................. σ_AU(AU) σ_Sub WL is wave length of irradiation in Angstrom. dWL is FWHM of wave length dispersion in Angstrom. dTheta,VdTheta define FWHM of incident beam divergence so that FWHM := dTheta + VdTheta*Theta. VdTheta takes in account variation of beam divergence with Theta. Units of FWHM, dTheta, Theta are degree. dDet, VdDetect define angular aperture of slit before detector (DFW) so that DFW := dDet + VdDet*Theta. VdDeta takes in account variation of slit width with Theta. Units of DFW, dDet are degree. BU, RU, AU - number of slubs in the model of the film for each group. Any number may take zero. To have unique format of data reading the thickness of the Substrate must to have any value (for example 0). 3.4 File of constrains on parameters of model. This file (*.lmt) defines a domain of interest, a domain where we search the solution. The limits file contains minimal and maximal values allowed for each parameter. Format of LMT file is similar to MDL file. The LMT files do not have first two lines of MDL file. On the place of one value in the MDL file, LMT file has 3 values, that are minimal and maximal values of interval of the parameter variation and integer number that defines the status of the parameter. The status is one of following • 0 means parameter fixed and does not change in the session • 1 parameter should be fit • -n negative integer value means that corresponding parameter takes the same value as the parameter in the line n. Lines are counted from the top to down. 4. Run Click on file RFIT2000.EXE. To be able to fit or simulate data you should fist define a name of command file. To do this click option <File> and then <Set Command File>. As far as the name of command file is defined the option <Run> becomes enable. Click on <Run> and redefine setting if there is a reason. When settings is defined click <OK>. The fit or simulate session will start. To interrupt fitting you should fist click on main window and then Ctrl+Q. During the fit information about number of done iterations, the best χ2 and the worst χ2 of the simplex, tolerance and stage (local or global) is updated in appropriate window. Each time when program finds a model with the χ2 better than the last one, a plot window will be updated. 5. Out put files. Three new file with extensions *.bst, *.pct, *.loc appear on the disk after fitting session. All of them have the same name as the name of the model file. The *.loc file contains values of variable parameters of the model at found local minima during the session. The *.pct file is the 3 column files. First column is incident angle in degree or 1/A. Second column is measured intensity. Third column is the intensity calculated for the best model with taking in to account of instrumental resolution. The *.bst file contains parameters of the best model and if it was requested an estimation of uncertainties of the variable parameters. This file may contain three models. One model that was found during fitting session. Second model that was found after Newton step. Third model that was found after optimization of Newton step. The final curve that is in the *.pct file is calculated for the model with that have the smallest χ2 value of these 3 models. 6. Questions and bugs. Please do not hesitate address to Oleg KONOVALOV E-mail: [email protected] 7. References 1. NUMERICAL RECIPES. The art of scientific computing, William H.Press, Brian P.Flannery, Saul A.Teukolsky, William T.Vetterling, Cambridge University Press, 1986. Chapter 10.4 Downhill Simplex Method in Multidimensions. 2. Lekner J., 1987, Theory of reflection. Dordrecht: Martinus Nijhoff.; Lekner J., 1991 Physica B (Utrecht) v.173, p.99-111. 3. Parratt L.G. Phys Rev v.95, 1954, p. 359. 4. Born M., Wolf E., 1980, Principles of optics, 6th ed. New York: Pergamon Pres 5. Samoilenko I.I., Shchedrin B.M., Feigin L.A. Global minimization in reconstraction of the scattering-length density profile by X-ray reflectivity data. Phys.B., v.221, 1996, p.542-546.; Samoilenko I.I., Shchedrin B.M., Feigin L.A Kristallografiya, 1995, v. 40, n. 5, p.801-808 (russian and english) 6. Konovalov O.V., Feigin L.A., Shchedrin B.M. Statistical evaluation of the accuracy of structure parameters determination from X-ray and neutron reflectivity data. Kristallografiya, 1996, v. 41, n. 4, p. 640-643 7. Konovalov O.V, Samoilenko I.I., Feigin L.A., Shchedrin B.M. Application of normalizing function in the simulation of X-ray and neutron reflectivity data. Kristallografiya, 1996, v. 41, n. 4, p.635-639 8. Konovalov O.V, Feigin L.A., Shchedrin B.M. Allowance for apparatus distortion in modeling the srtucture of Langmuir - Blodgett films from reflectivity data. Kristallografiya, 1996, v. 41, n. 4, p.629-634 9. I.I. Samoilenko, O.V. Konovalov, L.A. Feigin, B.M. Shchedrin, L.G. Yanusova, Processing of experimental reflectivity data within the REFLAN software package. Kristallografiya, 1999,v.44, n.2, p.310-318. 10. O.V. Konovalov, I.I. Samoilenko, L.A. Feigin, B.M. Shchedrin, L.G. Yanusova, Statistical substantiation of parametrization of a film model in reflectometry. Kristallografiya, 1999,v.44, n.2, p.319-323.