1
1
The Matrix Cube
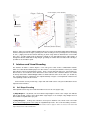
Cubix is a visualization interface for the exploration of dynamic networks with changing edge weights.
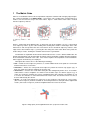
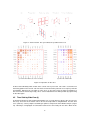
The central visualization is the Matrix Cube, a space-time cube resulting from stacking adjacency
matrices, one for each time step, in the order of time. Figure 1 shows how a matrix cube is created
from the adjacency matrices.
(a) Adjacency Matrices / Time
Slices
(b) Matrix Cube
(c) Vertex Slices
Figure 1: Contruction of the Matrix Cube. (a) Each time step of the network (1,2,3,4), is represented
as an adjacency matrix. (b) The cube resulting from stacking those matrices. Red edges of the cube
hold vertices and correspond to the rows and columns of the constituent adjacency matrices; blue
edges of the cube hold time steps. (c) Slicing the cube along one of the vertex dimensions yields one
vertex slice per vertex, showing the evolution of that vertex’s ego-network.
Visualization an exploration of three-dimensional models on the screen is difficult. With Cubix, we
provide transformation and decomposition operations which yield better readable 2D representations
of the information contained in the cube. This manual explains what operations and visualizations
Cubix supports and how they are employed.
Throughout this manual, we use the following terminology:
• Cell — Similar to cells in adjacency matrices, a cell in the Matrix Cube corresponds to a connection
between two vertices at one time.
• Time Slice — A time slice corresponds to the adjacency matrix for one time step (Figure 1(a)). A
time slice shows the network’s topology at one time step.
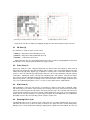
• Vertex Slice — A vertex slice results from cutting the cube orthogonally to time slices. It resembles
a table where a vertex’s neighbors are shown in rows and time steps are columns (Figure 1(c)). A
vertex slice shows the evolution of a vertex’s neighborhood over time (dynamic ego network). A cell
in a vertex slice indicates a connection between the vertex of the slice and the vertex in a row, at
the time indicated by the column.
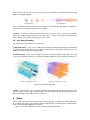
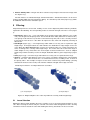
• Vector — A vector corresponds to a single line of cells inside the cube (Figure 2). Time vectors
(blue vector in Figure 2) show the evolution of connectivity between a node pair, while neigborhood
vectors (red vectors in Figure 2) show the neighborhood of one vertex at one time.
Figure 2: Edge (blue) and neighborhood vectors (red) in the matrix cube
2