1
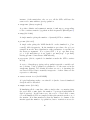
The function produces an object which is a list containing the two following matrices:
• YY
A matrix with nsnp rows and npop columns containing allele or read
counts for the reference allele.
• NN
A matrix with nsnp rows and npop columns containing the total allele
or read counts.
4.3.5
Example
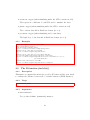
#source the baypass R functions (check PATH)
source("utils/baypass_utils.R")
#load the bovine BTA 14 data
counts.obj <- geno2YN("examples/geno.bta14")
5
Worked Examples
For illustration purposes, different types of analyses of the example files
(see 2.3) are detailed step by step. Users might try to reproduce the corresponding examples using the files included in the example directory.
5.1
5.1.1
Cattle allele count data
Analysis under the core model mode: MCMC is run under
the core model
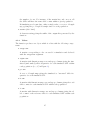
The following command allows to analyse the data under the core model (this
should take ca. 4 min with the i_baypass executable and ca. 7 min with
the g_baypass executable):
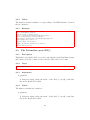
baypass -npop 18 -gfile geno.bta14 -outprefix anacore
To visualize the results, one may open an R session and proceed as follows:
require(corrplot) ; require(ape)
#source the baypass R functions (check PATH)
source("utils/baypass_utils.R")
#upload estimate of omega
omega=as.matrix(read.table("anacore_mat_omega.out"))
pop.names=c("AUB","TAR","MON","GAS","BLO","MAN","MAR","LMS","ABO",
"VOS","CHA","PRP","HOL","JER","NOR","BRU","SAL","BPN")
31