1
LAS réf.
VIR réf.
Issue
Date
VLT-PLA-VIRA1.0
Rév. 0.0
24-Oct-02
page
5
LIST OF FIGURES
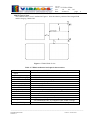
Figure 1: VIMOS field of view ..................................................................................................................... 9
Figure 2 ....................................................................................................................................................... 12
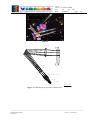
Figure 3: VIMOS optical layout (one channel only)................................................................................... 12
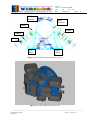
Figure 4: VIMOS opto-mechanical layout, top view.................................................................................. 13
Figure 5: Overall VIMOS view (CAD view).............................................................................................. 13
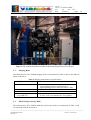
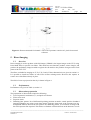
Figure 6: The VIMOS instrument installed on the Nasmyth plateform of UT3-Melipal ........................... 14
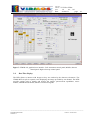
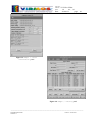
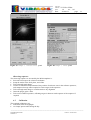
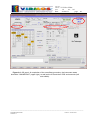
Figure 7: VIMOS OS graphical user interface. Left: instrument control panel, Middle,
detector control panel. Right: telescope control panel ........................................................................ 18
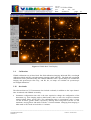
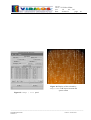
Figure 8: VIMOS Real Time Display ......................................................................................................... 19
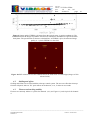
Figure 9: Image quality FWHM vs. distance from the optical center, in pixels (quadrant 4).
The FWHM measures the images of pinholes 300 microns in diameter distributed in a
grid at the mask focal plane. The specification is shown as a dashed line, as
FWHM=3.2pix, the measured image quality is ~2 pixels FWHM over the field............................... 23
Figure 10: PSF variation accross the VIMOS field at the field center and field edges (images
of 300 microns holes).......................................................................................................................... 23
Figure 11: flexures measured for channel 2. The circle represents a motion of 1 pixel from
central reference. ................................................................................................................................. 24
Figure 12: vmmps main panel..................................................................................................................... 28
Figure 13: vmmps / cross correlation panel ................................................................................................ 29
Figure 14: vmmps / catalog panel ............................................................................................................... 29
Figure 15: vmmps / slit panel...................................................................................................................... 30
Figure 16: Display of slits selected by vmmps/SPOC with objects location and spectra extent ................ 30
Figure 17: vmmps / curved slit panel .......................................................................................................... 31
Figure 18: vmmps / SPOC panel................................................................................................................. 31
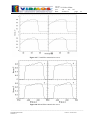
Figure 19: U’ band filter transmission curves............................................................................................. 34
Figure 20: B band filter transmission curves .............................................................................................. 34
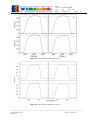
Figure 21: V band filter transmission curves .............................................................................................. 35
Figure 22: R band filter transmission curves .............................................................................................. 35
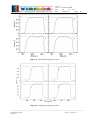
Figure 23: I band filter transmission curves................................................................................................ 36
Figure 24: z band filter transmission curves ............................................................................................... 36
Figure 25: OS1 filter transmission curves................................................................................................... 37
Figure 26: OS2 filter transmission curves................................................................................................... 37
Figure 27: GG435 filter transmission curves .............................................................................................. 38
Figure 28: GG475 filter transmission curves .............................................................................................. 38
Figure 29: sky spectrum, in CCD counts, 1440 sec integration, 1 arcsec slit, LRRED grism.................... 40
Figure 30: sky spectrum, flux calibrated (Fν)............................................................................................. 40
Figure 31: He + Ar arc spectrum with the LRRed grism ............................................................................ 41
Figure 32: He+Ar spectrum with the HROra grism.................................................................................... 41
_______________________________________________________________________________________
Word Windows 2000
manual-v1
Fichier : vimos-users-