1
HP 783Xx Series and HP 788Xx Series
Service Manual’- Volume 1
Patient Monitors and Neonatal Monitors
Ea
HEWLETT
PACKARD
HP Part No. 78354-90008
March 1993
Printed in Germany
Edition 8
Notice
The information
contained in this document is subject to change without
notice.
Hewlett-Packard makes no warranty of any kind with regard to this material, including, but
not limited to, the implied warranties of merchantability and fitness for a particular purpose.
Hewlett-Packard shall not be liable for errors contained herein or for incidental or
consequential damages in connection with the furnishing, performance, or use of this material.
Hewlett-Packard assumes no responsibility for the use or reliability
equipment that is not furnished by Hewlett- Packard.
of its software on
This document contains proprietary information, which is protected by copyright. All rights
are reserved. No part of this document may be photocopied, reproduced or translated to
another language without the prior written consent of Hewlett-Packard Company. The
information contained in this document is subject to change without notice.
Hewlett-Packard
Company
Medical Products Group (Europe)
Schickardstrasse
4
7030 Boeblingen
Federal Republic of Germany
@ Copyright
Hewlett-Packard
Company, 1991. All rights reserved.
Printing History
New editions are complete revisions of the manual. Update packages, which are issued
between editions, contain additional and replacement pages to be merged into the manual by
the customer. The dates on the title page change only when a new edition or a new update is
published.
Preface
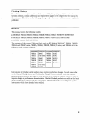
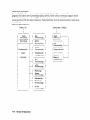
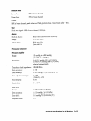
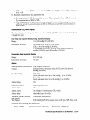
This manual covers the following models:
w MODELS 78352A/78352C/78353A/78353B/78354A/78354C
w MODELS 78832A/78833A/78833B/78834A/78834C
PATIENT
NEONATAL
MONITORS
MONITORS
w MODEL 78356A GAS MONITOR
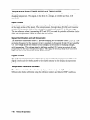
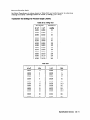
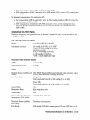
The contents of this manual (Volume One) apply to HP Models 78352A/C, 78353A, 78353B,
78354A and 78354C series, 78832A, 78833A, 78833B, 78834A/C series, and 78356A with the
following serial numbers prefixed:
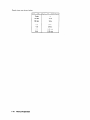
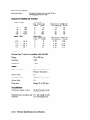
MODELS
78352A
78352C
78353A
78353B
78354A
78354C
78356A
PREFIX
2640G
First Issue
2348G
2612G
2613G
First Issue
2717G
MODEL
78832A
78833A
78833B
78834A
78834C
PREFIX
2412G
2413G
2610G
2611G
First Issue
Instruments with higher serial numbers may contain production changes. In such cases refer
to the Manual Change sheets and Publication Change Notices enclosed with this manual.
Hewlett-Packard reserves the right to make changes in its products without notice in order to
improve design or performance characteristics. Hewlett-Packard products are sold on the basis
of the specifications valid on the day of purchase. Hewlett-Packard is not obliged to update
instruments which have already been retailed.
...
III
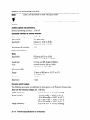
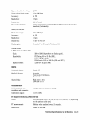
CONTENTS OVERVIEW
This manual contains service information for the Hewlett-Packard
78356A monitors. The information is divided into two sections:
n
Chapter 1 -
Theory of Operation
n
Chapter 2 -
Maintenance
78352/3/4,
78832/3/4 and
Checks
q
Chapter 2a -
Performance Assurance Checks
q
Chapter 2b -
Specification Checks
q
Chapter 2c -
Technical Specifications for all Monitors
Further sections covering disassembly and reassembly of the monitor, switch programming and
adjustments, schematic diagrams and replaceable parts lists, are contained in Volume 2 of the
manual (part number 78354-90010).
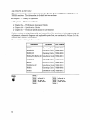
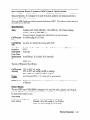
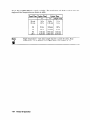
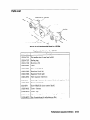
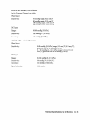
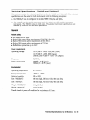
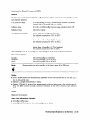
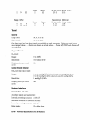
Documentation
relating to these monitors:
Instrument
Note
iv
Document
Part Number
78352A
Operating Guide
78352-90001
78353B/4A
Operating Guide
78354-90001
78352C/4C
Operating Guide
78354-92001
78352A/2C/3B/4A/4C
Installation
78354-90011
78833B/4A
Operating Guide
78834-91001
78834C
Operating Guide
78834-92001
78833B/4A/4C
Installation
78834-90011
78356A
Operating Guide
78356-90001
78356A
Installation
78356-90011
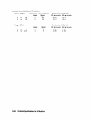
783528
78362C
783638
783538
783548
78354C
)
3
)
)
3
3
monitors
are
referred
to
in text es
783Xx Series
Guide
Guide
Guide
end
788328
78833A
708338
788348
78334C
3
1
3
3
3
monitors
are
referred
to
in text as
788Xx Series
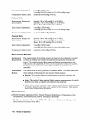
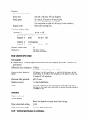
Special Notation
Notes, cautions, and/or warnings may accompany the instructions
defined below:
Note
I
VI!
Notes provide emphasis to information
from a procedure.
or additional
in this manual. They are
inforniation
“off line”
Caution
Cautions highlight
recorder.
procedures that must be followed to avoid damage to the
Warning
Warnings highlight procedures that must be followed to avoid hazards to human
life or safety.
Contents
1.
Theory Of Operation
.............................
Introduction
Functional description ........................
Shared Memory and Data Transfer ...................
General ..............................
Power Fail .............................
..................
Time Slices
Mother Board 78353-66501 and 78354-66501 ...............
Video Amplifier ...........................
Horizontal Deflection Circuit .....................
......................
Vertical Deflection Circuit
........................
High Voltage Circuits
Power-On Reset ..........................
...........................
5 V Buffering.
Extender Board ..........................
Display UP Boards 78353-66502 (16K byte), 78354-66502 (40K byte)
78354-66602 and 78354-66702 (48K byte) ...............
Character Generation ........................
..................
Slow/fast Sync. Signal Generation
..........................
Clock Generation
2 ms Interrupt Signal Generation ...................
......................
Alarm Trigger Generation
.........................
Power Fail Circuit
Display Software ..........................
Single Channel Interpolation Board 78352-66503 .............
.............
D-A Convertor and Sample and Hold Circuits
Shuffle Mux
............................
Video Pulse Generator ........................
..........................
Ramp Generator
Raster Line Control ..........................
..........................
Erase Bar Latch
Wave Length Latch .........................
Start-up Delay ...........................
Three-Channel Interpolation Board 78353-66503 .............
Power Supply Board 78351-66506 ....................
..........................
+5 V DC Supply
f12 V DC Supplies .........................
t17V DC Supply ..........................
Audio Board 78353-66512 .......................
......................
Battery Board 78832-66519
.......................
Battery Charge Circuit
Alarm Lamp Drive Circuit ......................
1-1
1-1
1-2
1-2
1-2
1-2
1-5
1-5
1-5
1-5
1-6
1-6
1-6
1-6
1-8
1-8
1-9
1-9
1-9
1-9
1-10
1-10
1-13
1-13
1-13
1-13
1-14
1-14
1-14
1-14
1-14
1-16
1-18
1-18
1-18
1-18
1-19
1-21
1-21
1-21
Contents-1
ECG Board (Full Lead) 78354-66522(42) and78354-66722(42) ........
Floating Input Circuit ........................
..........................
Right-Leg Drive
.......................
INOP Detection Circuit
........................
Lead Selector Circuit
.......................
Grounded Input Circuit
Digital Circuits ...........................
......................
ECG Parameter Software
ECG Board (3 Lead) 78832-66522 (50 Hz) and 78832-66542 (60 Hz) .....
Floating Input Circuit ........................
..........................
Right-Leg Drive
.......................
INOP Detection Circuit
........................
Lead Selector Circuit
.......................
Grounded Input Circuit
Digital Circuits ...........................
......................
ECG Parameter Software
Pressure Board 78353-66532 (Single Channel) and 78353-66534 (Dual Channel)
Transducer Excitation Circuits ....................
...............
Transducer Signal Demodulation Circuits
Analog to Digital Conversion .....................
Transducer Disconnected Detection ..................
.................
Zero, Calibration and Test Functions
Digital Circuits ...........................
Pressure Parameter Software .....................
Non-Invasive Blood Pressure (NIBP) Board 78352-66535 ..........
General Principle of Operation ....................
.................
NIBP Parameter Board 78352-66535
Pressure Transducer ........................
Amplification and Filtering .....................
Analog to Digital Conversion ....................
..........................
Digital Circuit
..................
Safety and Valve/Pump Control
NIBP Parameter Software .....................
Non-Invasive Blood Pressure (NIBP) Board 78352-66358 ..........
Specifications ............................
Patient Modes ...........................
.......................
Measurement Principle
General Principle of Operation ....................
.................
NIBP Parameter Board 78352-66538
The Analog Board-Hardware
Description ...............
..............
Pressure Transducers and Input Amplifier
Oscillation Channel ........................
Multiplexer and A/D Conversion ..................
.......................
EEPROM and Latch
........................
Hardware Description
Valve Drivers ...........................
Pump Motor ...........................
...............
The Digital Board-Hardware
Description
Partial CO2 Pressure Board 78354-66540 and 78356-66540 .........
....................
General Principle of Operation
CO2 Parameter Board 78354-66540 and 78356-66540 ..........
Contents-2
1-22
1-22
1-22
1-22
1-22
1-23
1-23
1-24
1-26
1-26
1-26
1-26
1-27
1-27
1-28
1-28
1-30
1-30
1-30
1-30
1-31
1-31
1-31
1-32
1-35
1-35
1-37
1-37
1-37
1-37
1-37
1-38
1-38
1-41
1-41
1-41
1-42
1-43
1-44
1-44
1-44
1-44
1-44
1-45
1-45
1-45
1-45
1-46
1-49
1-49
1-50
..........................
Motor Circuit
Temperature Control Circuit ....................
...........................
Preamplifier
Analog to Digital Conversion ....................
Digital Circuits ..........................
Oxygen Board 78354-66541 and 78356-66541 ...............
General Principle of Operation ....................
Preamplifier Circuit .........................
Temp/Pleth/Aux
Board 78353-66552 and 78354-66552 ...........
.....................
Pleth Floating Input Circuit
Test Function Generator .......................
.......................
INOP Detection Circuit
Pleth Sensor Circuit .........................
Temperature Floating Input Circuit ..................
Temperature Grounded Circuit ....................
: ......
Aux Input Circuit ...................
Digital Circuits ...........................
Temp/Pleth/Aux
Parameter Software .................
Temperature Board 78832-66552 and 78834-66552 .............
...........................
Input Circuits
Signal Rectification and A/D Conversion ................
Digital Circuits ...........................
Temperature Parameter Software ...................
Dual Temperature Board 78353-66554 and 78354-66554 ..........
...........................
Input Circuits
Signal Rectification and A/D Conversion ................
Digital Circuits ...........................
Temperature Parameter Software ...................
Respiration Board 78832-66562 .....................
...........................
Input Circuits
..........................
INOP Detection
Respiration Wave Signal Circuits ...................
......................
Feedback Loop Operation
..........................
A/D Conversion
A. Initial conditions ........................
B. Patient impedence increases to 1.5 kohm + 10 ...........
C. Summing point again at zero volts ................
Test Signals ............................
Digital Circuits ...........................
Respiration Parameter Software ....................
Transcutaneous Partial CO2 and O2 Board 78834-66572 ..........
.......................
Transducer Recognition
...........................
tcpCO2 Input
tcpO2 Input
............................
Polarization Voltage .........................
...........................
Heater Circuit
........................
Temperature Control
.........................
Analog Multiplexer
..................
Analog to Pulse Width Conversion
...........................
Repolarization
.......................
Floating Power Supply
1-50
1-50
1-53
1-53
1-53
1-54
1-54
1-54
1-57
1-57
1-57
1-57
1-57
1-57
1-57
1-58
1-58
1-58
1-60
1-60
1-60
1-60
1-60
1-63
1-63
1-63
1-63
1-63
1-67
1-67
1-67
1-67
1-67
1-68
1-68
1-68
1-68
1-69
1-69
1-69
1-73
1-73
1-73
1-73
1-73
1-74
1-74
1-74
1-75
1-76
1-76
Contents-3
Digital Circuits ...........................
Clock ..............................
Watchdog Circuit .........................
EAROM .............................
....................
Barometer Board Information
Parameter Software .........................
Barometer Board 78834-66573 .....................
Circuit Operation ..........................
.........
Oxygen Saturation/Pleth
(SPO2) Board 78354-66510/520
..........................
Floating Section
ESU Rejection ..........................
Ambient Light Rejection ......................
: .........
.................
Amplification
Compensation for Ambient Light ..................
The Transducer ..........................
Multiplexer
...........................
LEDs ..............................
Selftest .............................
Grounded Section ..........................
...........
780 System Interface (Non-Annotating)
78353-66590
...........................
Input Circuits
Beat-to-beat Heart Rate .......................
Average Heart Rate .........................
System Control Signals .......................
Status byte
...........................
ECG Wave. ............................
Respiration Wave ..........................
780 Interface Board (Annotating) 78353-66592 ..............
Digital Circuits ...........................
Analog Circuits ...........................
System Board Software .......................
SDN Board 78353-66595 ........................
Microprocessor Interface Circuit and I/O RAM .............
System Interface Controller (SIC) ...................
Data Synchronization Circuit .....................
Control Logic ............................
Signature RAM ...........................
RS-232C Interface Board 78354-66598 ..................
General Principle of Operation ....................
............................
ROM/RAM
Counter-timer Circuit ........................
Serial Interface ...........................
Watchdog Circuit ..........................
Contents-4
1-76
1-76
1-77
1-77
1-77
1-78
1-80
1-80
1-83
1-83
1-84
1-84
1-84
1-84
1-85
1-85
1-85
1-85
1-86
1-89
1-89
1-89
1-89
1-90
1-90
1-90
1-90
1-92
1-92
1-92
1-92
1-97
1-97
1-97
1-97
1-98
1-98
1-100
1-100
1-100
1-101
1-101
1-101
2.
2a.
Maintenance
Introduction
Checks
. . . . . . . . . . . . . . . . . . . . . . . . . . . . .
Performance Assurance Checks
Introduction
.............................
General ..............................
Test equipment ............................
General checks ...........................
Monitor Service Test Mode ......................
Display Intensity
..........................
Checks in ECG Setup Mode .....................
Filter/Diagnostic
Mode Check ...................
Parameter Set-up Keys .......................
Pressure Channel Check and Calibration ................
CO2 and O2 Calibration and Adjustments
...............
Temperature Channel Checks .....................
Plethysmograph Channel Checks ...................
Barometer Board Checks .......................
tcpCO2/tcpO2 Channel Checks and Transducer .............
HP 15210A Calibration Unit ......................
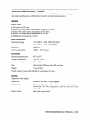
Installation .............................
Description .............................
Unpacking the Instrument
......................
Initial Inspection
.........................
Claims For Damage ........................
Repacking for Shipment or Storage .................
Instrument Identification .......................
Specification ............................
Operating Environment
.......................
Operating Information ........................
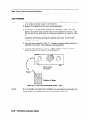
Fitting the Gas Cylinders
......................
Storage of Gas Cylinders .......................
Disposal of Used Gas Cylinders ....................
Routine Maintenance
.........................
Changing the Gas Cylinders
.....................
Care and Cleaning
.........................
Theory of Operation
.........................
Gas Flow Performance Checks .....................
Test Procedure ...........................
Disassembly .............................
Parts List ..............................
Transducer Troubleshooting
......................
SpO2 Channel Checks ........................
2-1
2a-1
2a-1
2a-2
2a-2
2a-2
2a-4
2a-4
2a-5
2a-6
2a-7
2a-9
2a-10
2a-11
2a-11
2a-11
2a-15
2a-15
2a- 15
2a-15
2a-15
2a-15
2a-16
2a-16
2a-16
2a-17
2a-17
2a-17
2a-17
2a-17
2a-18
2a-18
2a-18
2a-19
2a-20
2a-20
2a-22
2a-25
2a-26
2a-30
Contents-5
2b. SpecificationChecks
.............................
Introduction
.................
Specification Checks Test Equipment
...........................
ECG Channel
Pressure Channel ..........................
Transformer Test Settings for Pressure Output Linearity ........
Plethysmograph channel .......................
Respiration Channel .........................
..................
NIBP Calibration and Adjustments
NIBP Calibration and Adjustments (HP7xxxC
Only) ..........
......................
RS 232C Interface Checks
....................
Barometer Board Adjustment
TcpCO2 /tcpO2 Channel .......................
SpO2 Board ............................
2c.
Technical Specifications for all Monitors
.............................
Introduction
...................
Technical Specifications 78352A/C
General ..............................
..........................
Patient safety
Power requirements: ........................
Environment: ...........................
..............................
Display
Superaster video display: ......................
......................
ECG Channel (Full lead)
..........................
ECG Amplifier
Patient Safety: ..........................
Cardiotach ............................
Digital cardiotach .........................
..........................
Analog output
.....................
ECG wave on phone-jack.
.............................
Alarms
.........................
Test/Calibration
ST Segment Monitoring (78354-66722) ................
Noninvasive Blood Pressure (NIBP) ..................
General .............................
Modes ..............................
Alarms
.............................
Temperature Channel ........................
Trend..
.............................
General .............................
..........................
ECG Channel
Pressure Channel .........................
Dual Temperature Channel .....................
..........................
System Interface
..........................
System outputs
............................
SpO2 /Pleth
.............................
Alarms
Pleth Amplifier ..........................
Cardiotach ............................
Graticule lines ..........................
Contents-6
2b-1
2b-1
2b-1
2b-9
2b-11
2b-12
2b-12
2b-14
2b-17
2b-18
2b-20
2b-21
2b-21
2c-1
2c-1
2c-1
2c-1
2c- 1
2c-1
2c-2
2c-2
2c-2
2c-2
2c-2
2c-2
2c-2
2c-3
2c-3
2c-3
2c-3
2c-3
2c-4
2c-4
2c-5
2c-5
2c-5
2c-6
2c-6
2c-6
2c-6
2c-6
2c-6
2c-6
2c-7
2c-7
2c-7
2c-7
2c-8
Test ...............................
Technical Specifications 78353A .....................
General ..............................
Patient safety: ..........................
Power requirements: ........................
..........................
Environmental:
..............................
Display
ECG Channel (3 lead) ........................
..........................
ECG Amplifier
Cardiotach ............................
Analog Output ..........................
.............................
Alarms
Test ...............................
......................
Plethysmograph Channel
Pleth. amplifier ...........................
Cardiotach. ............................
Graticule lines ..........................
Test ...............................
Alarms
.............................
Pressure Channel ..........................
Pressure amplifier .........................
Auto zero ............................
Pressure wave display .......................
Alarms
.............................
Calibration/test
signal .......................
........................
Rear panel output
Temperature Channel ........................
Auxiliary Input Channel .......................
General .............................
Auxiliary input - 78205D Pressure module ..............
Graticule line labelling and resolution ................
Auxiliary input - 47210 Capnometer .................
System 780 Annotating Interface ...................
General .............................
Auxiliary signals and parameters .................
Selectable channels for external recorder ..............
ECG System Outputs .......................
Wave .............................
Pressure system outputs ......................
Wave (All the following voltages are f 50 mV.) ...........
..................
Plethysmograph system outputs
Wave .............................
DC output (HR) ........................
....................
Temperature system output
DC output ...........................
System 780 Non-Annotating Interface .................
ECG Wave. ...........................
Heart Rate ............................
Control Signals ..........................
Alarm Relay (only loaded on request) ................
.............
Technical Specifications - 78353B and 78354A/C
2c-8
2c-9
2c-9
2c-9
2c-9
2c-9
2c-9
2c-10
2c-10
2c-10
2c-10
2c-11
2c-11
2c-11
2c-11
2c-11
2c-12
2c-12
2c-12
2c-12
2c-12
2c-12
2c-13
2c-13
2c-13
2c-13
2c-14
2c-14
2c-14
2c-14
2c-15
2c-15
2c-16
2c-16
2c-16
2c-16
2c-16
2c-16
2c-16
2c-16
2c-17
2c-17
2c-17
2c-17
2c-17
2c-18
2c-18
2c-18
2c-18
2c-18
2c-19
Contents-7
General ..............................
Patient safety
..........................
Power requirements ........................
Enviromental ...........................
Display
..............................
......................
ECG Channel (Full lead)
ECG Amplifier
..........................
Cardiotach ............................
Analog output
..........................
Alarms
..............................
Test/Calibration
.........................
ST Segment Monitoring (78354-66722) ................
......................
Plethysmograph Channel
Pleth. amplifier ..........................
Cardiotach ............................
Graticule lines ..........................
Autofix
.............................
Test ...............................
Alarms
.............................
Pressure Channel ..........................
Pressure amplifier .........................
Auto zero ............................
Pressure wave display .......................
Graticule line labelling and resolution: ................
Pulse Rate ............................
Alarms
.............................
Test/calibration
.........................
Noninvasive Blood Pressure (NIBP) ..................
General .............................
Modes ..............................
Alarms
.............................
Alarm Limit Adjustments (78354C): .................
Respiration Channel .........................
Respiration amplifier
.......................
Respiration trigger
........................
Alarms
.............................
Fractional Inspired Oxygen ......................
Alarms
.............................
Carbon Dioxide ...........................
General .............................
Instantaneous CO2 Wave Display ..................
.................
End Tidal CO2 Numerical Display
Respiration Rate Numerical Display .................
Alarms
.............................
Temperature Channel ........................
Auxiliary Input Channel .......................
General .............................
Auxiliary input - 78205D Pressure module ..............
Graticule line labelling and resolution. ................
Auxiliary input - 47210 Capnometer .................
SpO2 / Pleth ............................
Contents-8
2c-19
2c-19
2c-19
2c-19
2c-20
2c-20
2c-20
2c-20
2c-21
2c-21
2c-21
2c-21
2c-22
2c-22
2c-22
2c-23
2c-23
2c-23
2c-23
2c-23
2c-23
2c-23
2c-24
2c-24
2c-24
2c-24
2c-24
2c-25
2c-25
2c-25
2c-25
2c-25
2c-26
2c-26
2c-26
2c-26
2c-26
2c-27
2c-27
2c-27
2c-27
2c-27
2c-28
2c-28
2c-29
2c-29
2c-29
2c-29
2c-29
2c-30
2c-30
Alarms
.............................
...........................
Pleth Amplifier
............................
Cardiotach
..........................
Graticule lines
Test ...............................
Alarms
.............................
..........................
System Interface
General (Opt. J11 only) ......................
.......................
ECG system outputs
......................
Pressure system outputs
.....................
Respiration
system output
..................
Plethysmograph
system outputs
....................
Temperature
system output
Trend..
.............................
.............................
General
..........................
ECG Channel
Respiration
Channel ........................
.........................
Pressure Channel
..........................
Pleth Channel
..........................
AUX Channel
....................
Single Temperature
Channel
Dual Temperature
Channel .....................
.........................
Oxygen Channel
Carbon Dioxide Channel ......................
......................
SpO2 Channel (78354C)
Technical Specifications
- 78832A ....................
..............................
General
...........................
Patient safety
........................
Power Requirements
..........................
Environmental
..............................
Display
......................
Superaster video display
...........................
ECG Channel
..........................
ECG Amplifier
..........................
Patient Safety:
............................
Cardiotach
..........................
Analog Output
Alarms
.............................
.........................
Test/Calibration
........................
Temperature
Channel
.........................
Respiration
Channel
.......................
Respiration
amplifier
........................
Respiration
trigger
........................
Respiration
alarms
780 Annotating
Interface .......................
.............................
General
.......................
ECG System Outputs
.....................
Respiration-system
output
Temperature
- system output ....................
Trend..
.............................
.............................
General
2c-30
2c-30
2c-31
2c-31
2c-31
2c-31
2c-31
2c-31
2c-31
2c-32
2c-32
2c-32
2c-32
2c-33
2c-33
2c-33
2c-33
2c-33
2c-33
2c-34
2c-34
2c-34
2c-34
2c-34
2c-35
2c-36
2c-36
2c-36
2c-36
2c-36
2c-36
2c-36
2c-37
2c-37
2c-37
2c-37
2c-37
2c-37
2c-38
2c-38
2c-38
2c-38
2c-39
2c-39
2c-39
2c-39
2c-39
2c-40
2c-40
2c-40
2c-40
Contents-9
ECG Channel
..........................
Respiration Channel ........................
Technical Specifications - 78833A ....................
General ..............................
Patient safety
..........................
Power Requirements ........................
Environmental
..........................
..............................
Display
Superaster video display ......................
ECG Channel
...........................
ECG Amplifier
..........................
Patient Safety: ..........................
Cardiotach ............................
Analog Output ..........................
Alarms
.............................
Test/Calibration
.........................
Respiration Channel .........................
Respiration amplifier
.......................
Respiration trigger
........................
Respiration alarms ........................
Pressure Channel ..........................
Pressure amplifier .........................
Auto zero ............................
Pressure wave display .......................
Pulse rate ............................
Graticule line labelling and resolution: ................
Alarms
.............................
Test/calibration
.........................
780 Annotating Interface .......................
General .............................
ECG System Outputs .......................
Respiration-system output .....................
Pressure system output (P1 only) ..................
.............................
Trend..
General .............................
ECG Channel
..........................
Respiration Channel ........................
Pressure Channel .........................
Technical Specifications - 78833B and 78834A/C
.............
General ..............................
Patient safety
..........................
Power requirements ........................
Environmental
..........................
..............................
Display
ECG Channel
...........................
ECG Amplifier
..........................
Cardiotach ............................
..........................
Analog output
.............................
Alarms
.........................
Test/Calibration
Temperature Channel ........................
Contents-10
2c-40
2c-41
2c-42
2c-42
2c-42
2c-42
2c-42
2c-42
2c-42
2c-43
2c-43
2c-43
2c-43
2c-43
2c-43
2c-44
2c-44
2c-44
2c-44
2c-45
2c-45
2c-45
2c-45
2c-45
2c-45
2c-46
2c-46
2c-46
2c-47
2c-47
2c-47
2c-47
2c-47
2c-48
2c-48
2c-48
2c-48
2c-48
2c-49
2c-49
2c-49
2c-49
2c-49
2c-50
2c-50
2c-50
2c-51
2c-51
2c-51
2c-51
2c-52
Respiration Channel .........................
.......................
Respiration amplifier
........................
Respiration trigger
Respiration alarms ........................
Pressure Channel ..........................
Pressure amplifier .........................
Auto zero ............................
Pressure wave display .......................
Graticule line labelling and resolution: ................
Pulse Rate ............................
.............................
Alarms
Test/calibration
Transcutaneous O2 and CO2 Channel (tcpO2 and tcpCO2) : : : : : : : :
General .............................
Transducer Heating ........................
Alarms
.............................
...........................
Test Signal:
780 Annotating Interface .......................
General .............................
.......................
ECG system outputs
Respiration system output .....................
....................
Temperature system output
......................
Pressure system output
tcpO2 and tcpCO2 system output ..................
Plethysmograph system outputs (78834C) ..............
Oxygen system output (78834C) ..................
Carbon Dioxide system output (78834C) ...............
.............................
Trend..
General .............................
..........................
ECG Channel
Pressure Channel .........................
Respiration Channel ........................
Dual Temperature Channel .....................
....................
tcpO2 and tcpCO2 Channel
Pleth Channel (78834C) ......................
Oxygen Channel (78834C) .....................
.................
Carbon Dioxide Channel (78834C)
SpO2 Channel (78834C) ......................
......................
SpO2 / Pleth (78834C)
Alarms
.............................
Pleth Amplifier ..........................
Cardiotach ............................
Graticule lines ..........................
Autofix
.............................
Test ...............................
......................
Pulse rate alarm limits
Noninvasive Blood Pressure (NIBP) ..................
. .........
General ...................
Modes ..............................
Alarms
.............................
.....................
Alarm Limit Adjustments:
2c-52
2c-52
2c-52
2c-52
2c-53
2c-53
2c-53
2c-53
2c-53
2c-54
2c-54
2c-54
2c-55
2c-55
2c-55
2c-55
2c-56
2c-56
2c-56
2c-56
2c-56
2c-56
2c-57
2c-57
2c-57
2c-57
2c-57
2c-58
2c-58
2c-58
2c-58
2c-58
2c-58
2c-59
2c-59
2c-59
2c-59
2c-59
2c-60
2c-60
2c-60
2c-60
2c-60
2c-60
2c-61
2c-61
2c-61
2c-61
2c-61
2c-62
2c-62
Contents-11
.......
Fractional Inspired Oxygen (78834C) ..........
.......
Alarms
Carbon Dioxide (78834C)
: : : : : : : : : : : : : : : .......
.......
General ......................
.......
...........
Instantaneous CO2 Wave Display
.......
..........
End Tidal CO2 Numerical Display
.......
Respiration Rate Numerical Display ..........
.......
......................
Alarms
.......
Graticule Line Labelling and Resolution: .......
.......
Technical Specifications - 78356A .............
.......
General .......................
.......
...................
Patient safety
.......
Power requirements .................
.......
Environment
....................
.......
.......................
Display
.......
...................
Inspired Oxygen
.......
Carbon Dioxide ....................
.......
......................
General
.......
Instantaneous CO2 Wave Display ...........
End Tidal and Inspired Minimum CO2 Numerical Display .......
.......
Respiration Rate Numerical Display ..........
.......
......................
Alarms
.......
Trend ........................
.......
General ......................
.......
..................
Oxygen Channel
.......
Carbon Dioxide Channel ...............
.......
...................
System Interface
.......
General (Opt. J11 only) ...............
.......
Instantaneous CO2 .................
.......
End Tidal CO2 ...................
.......
Respiration Rate ..................
.......
02 ........................
A.
Ordering Information
Main Sales and Support Offices ..............
...............
United States of America
Other International Areas ...............
Contents-12
.......
.......
.......
2c-62
2c-62
2c-62
2c-62
2c-63
2c-63
2c-63
2c-63
2c-64
2c-65
2c-65
2c-65
2c-65
2c-65
2c-65
2c-66
2c-66
2c-66
2c-67
2c-67
2c-67
2c-67
2c-68
2c-68
2c-68
2c-68
2c-68
2c-68
2c-69
2c-69
2c-69
2c-69
A-1
A-1
A-2
Figures
1-1.
1-2.
1-3.
1-4.
1-5.
1-6.
1-7.
1-8.
1-9.
1-10.
1-11.
1-12.
1-13.
1-14.
1-15.
1-16.
1-17.
1-18.
1-19.
1-20.
1-21.
1-22.
1-23.
1-24.
1-25.
1-26.
1-27.
1-28.
1-29.
1-30.
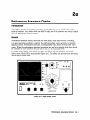
2a-1.
2a-2.
2a-3.
2a-4.
2a-5.
2a-6.
2a-7.
2a-8.
2a-9.
2a-10.
2a-11.
2a-12.
Allocation of Function Blocks to Time Slices ..............
Shared Memory System .......................
....................
Mother Board Block Diagram
Address/Character Distribution on the screen .............
.............
Display Microprocessor Board Block Diagram
Single Channel Interpolation Board Block Diagram ...........
Interpolation Board Block Diagram ..................
Voltage Sensing and Regulation ....................
Audio Board Block Diagram .....................
ECG Board Block Diagram (Full Lead) ................
.................
ECG Board Block Diagram (3 Lead)
Pressure Board Block Diagram ....................
Non-Invasive Blood Pressure Board Block Diagram (78352-66535) .....
Non-Invasive Blood Pressure Board Block Diagram (78352-66538) .....
.................
14360A Sensor, Mechanical Diagram
CO2/02 Board Block Diagram ....................
Temp/Pleth/Aux
Board Block Diagram ................
Temperature Board Block Diagram ..................
Dual Temperature Board Block Diagram ................
Feedback Loop Operation - Stage 1 ..................
Feedback Loop Operation - Stage 2 ..................
Feedback Loop Operation - Stage 3 ..................
Respiration Board Block Diagram ...................
..................
TcpCOz/Oz Board Block Diagram
Barometer Board Block Diagram ...................
.....................
SpOn Board Block Diagram
..........
780 System Board (Non-Annotating)
Block Diagram
780 System Board (Annotating) Block Diagram .............
SDN Board Block Diagram ......................
RS232C Block Diagram .......................
Rigel Safety Tester .........................
..........................
Display Intensity
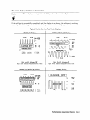
.............
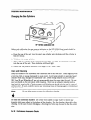
Position of Photoresistor in A and B monitors
Position of Photoresistor Monitor in “C” series monitors .........
Initial Set-up Displays for Pressure, Pleth and Respiration ........
..................
Equipment for Pressure Calibration
Mercury Calibration Set-up Display ..................
..............
Pressure Display after successful Calibration
Resistive Simulator for 0 and 200mmgh ................
Block diagram - Internal Components .................
Gas Flow Performance Check - Test 1 .................
Gas Flow Performance Check - Test 2/3 ................
1-2
1-3
1-7
1-8
1-11
1-15
1-17
1-18
1-19
1-25
1-29
1-33
1-39
1-47
1-51
1-55
1-59
1-61
1-65
1-68
1-68
1-68
1-71
1-79
1-81
1-87
1-91
1-95
1-99
1-102
2a-1
2a-4
2a-4
2a-4
2a-6
2a-7
2a-7
2a-8
2a-8
2a-19
2a-20
2a-21
Contents-13
2a-13.
2a-14.
2a-15.
2a-16.
2a-17.
2a-18.
2b-1.
2b-2.
2b-3.
2b-4.
2b-5.
2b-6.
2b-7.
2b-8.
2b-9.
2b-10.
2b-11.
............
Cover Securing Screws (veiwed from underneath)
...........................
Control Knob
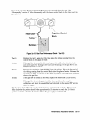
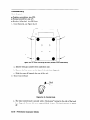
Regulator Control Block Securing Screws ...............
Regulator and Valve Control Blocks ..................
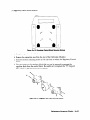
.....................
Tubing and Flow Regulator
Replaceable Parts for 15210A .....................
ECG Amplifier Gain Frequency Response Test Set-up ..........
Trigger Sensitivity Check Set-up ...................
ECG Amplifier Noise Test Set-up ...................
..................
ECG Noise with 50Hz Component
....................
1 mV Calibration Test Set-up
Common Mode Rejection Set-up ...................
...............
Notch Filter Test Response Characteristic
............
Equipment for Zero and Range Accuracy Check
Plethysmograph Channel Test Circuit .................
Test Circuit for INOP check .....................
Test Equipment for Respirotach Range Check .............
Contents-14
2a-22
2a-22
2a-23
2a-23
2a-24
2a-25
2b-4
2b-5
2b-6
2b-6
2b-7
2b-8
2b-9
2b-10
2b-12
2b-13
2b-13
Tables
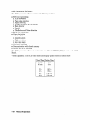
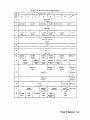
1-1.
1-2.
2b-1.
2b-2.
Test Signals and Results .......................
....................
System Output Configurations
Test Equipment Requirements for Specification Checks
mmHg Test ............................
.........
1-69
1-93
2b-3
2b-11
Contents-15
1
Theory Of Operation
Introduction
This section contains an overall functional
description of the following monitors:
n
78352A,78352C,78353A,78353B,78354A,78354C
n
78832A,78833A,78833B,78834A,78354C
n
78356A gas monitor
series of adult monitors
series of neonatal monitors
Also, more detailed descriptions of the individual
sub-assemblies are contained in this section.
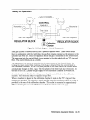
Functional description
The measured physiological signals are routed directly to the parameter board, where
they are amplified and then A/D converted. The digital information is processed by the
parameter board microprocessor. The digital section of the Parameter Board contains the
microprocessor, the ROM storing the parameter program and a general purpose memory
(RAM).
The results of the parameter processing are transferred to the shared memory. Here they are
accessed by the display microprocessor for further processing. The shared memory, which is
located on the Display UP Board, is used to store all parameter and waveform information.
This information is used by the display microprocessor to update the wave RAM and the
numerics RAM.
The wave information is routed from the display microprocessor through
to the Interpolation Board. At the same time, alphanumeric information
RAM (character generator) is parallel-serial converted. The video driver
combines these two signals to drive the CRT. The CRT controller on the
triggers the driver circuits on the Mother Board.
a D/A converter
from the numerics
on the Mother Board
Display UP Board
Data entered via the keyboard (e.g. alarm limits, lead configuration) is passed via the display
microprocessor and stored in the shared memory, where it is accessed by the parameter
board for appropriate action. When the parameter board reports back that the action has
been carried out, the data is passed to the Display Board microprocessor, which initiates the
appropriate display.
Theory Of Operation
l-l
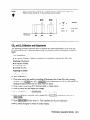
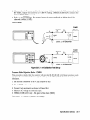
Shared Memory and Data Transfer
General
Data transfer in the 783Xx series, the 788Xx series and the 78356A is carried out via a
common memory area, to which all function blocks have access. This common memory is the
Shared Memory chip U40 on A2 Display UP board. The local bus systems are separated from
the main shared memory bus by tri-state buffers.
Power Fail
In the event of power fail the configuration
in the shared memory for 15 seconds.
of the instrument
at the time of power fail is held
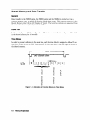
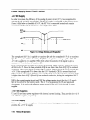
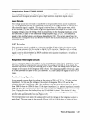
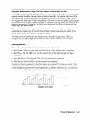
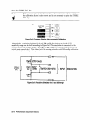
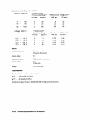
Time Slices
In order to prevent collisions in the main bus, each function block is assigned a defined 2 ms
time slice within the 20 ms CRT frame period. In this time slice it has sole right of access to
the shared memory.
/_
20,ms
LINE COUNTER START
Figure l-l. Allocation of Function Blocks to Time Slices
1-2 Theory Of Operation
Blatt von alte Seite l-3 hier horizontal einfiigen
Figure 1-2. Shared Memory System
Theory Of Operation
1-3
. ... .... ...
1-4 Theory Of Operation
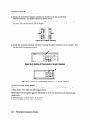
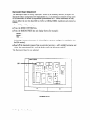
Mother Board 78353-66501 and 78354-66501
The Mother Board contains the video circuits for the display and the interconnections
the boards which are slotted into the respective connectors on the board.
between
The main functions of the Mother Board are listed below:
1.
2.
3.
4.
5.
6.
7.
Interconnection of boards slotted into the mother board
Video amplifier
Horizontal deflection circuits (slow sweep driver)
Vertical deflection circuits (fast sweep driver)
High-voltage circuits
Power-on reset
5-V buffering
The monitor display is a raster scanned CRT. It utilizes magnetic deflection and is refreshed
at a rate of 50 Hz. The CRT displays 720 vertical lines and operates at a vertical sweep
frequency of 40 kHz. The Display UP Board supplies the horizontal sync signal (SLOW
SYNC), the vertical sync signal (FAST SYNC) and the video drive signals to the Mother
Board.
Video Amplifier
Four waveform video inputs (4/4, 3/4, 2/4, l/4) and two numerics inputs (VIDEO NUM,
VIDEO NUM INVERSE) are applied to the video amplifier circuits (U2, U3). The waveform
and the numerics signals are applied to the CRT alternately. The positive 70 V supply for the
video amplifier is taken from the high voltage circuits. It is fed directly to the cathode voltage
regulator circuit, which also contains the black level adjust capability.
The basic trace intensity is dependent on the signal from the front-panel
the setting of the brightness potentiometer (R24 on the Audio Board).
photo resistor and
Horizontal Deflection Circuit
The slow horizontal sweep driver circuit generates a ramp (amplitude) which drives the
horizontal deflection yoke. This circuit is contained in integrated circuit U5.
The oscillator in U5 is synchronized by a positive-going pulse at pin 2 (SLOW SYNC
signal). Synchronization is inhibited during flyback time. The oscillator frequency is set with
potentiometer R21. The linearity can be adjusted with potentiometer R22. A + 17 V supply
is applied to Pin 8. Pin 9 provides the output to the deflection coil.
Vertical Deflection Circuit
The fast vertical sweep driver circuit utilizes the FAST SYNC signal from the Display
UP Board (A2) to develop a ramp (amplitude) which drives the vertical deflection yoke
and in turn deflects the cathode ray from the bottom of the screen to the top (18 us) and
then quickly back to the bottom (7 us). L2 is used to adjust the picture height and L3 the
linearity.
Theory Of Operation
l-5
High Voltage Circuits
The flyback transformer Tl is used to generate the high voltages required by the CRT and the
video amplifier.
The five supplies are:
1.
2.
3.
4.
5.
A
A
A
A
A
positive voltage of 10 kV for electron acceleration. This is the anode voltage.
positive 100, V supply for grid G2 of the CRT.
positive 300 V supply for grid G4 of the CRT (focus).
supply of virtual 0 V for grid Gl of the CRT.
positive 70 V supply for the video amplifier.
Control of the focus and black level is obtained by dividing the supply down with resistor
chains. Both of these chains have potentiometers in them so that adjustments can be made.
(R38 for focus and R55 for black level).
Power-On Reset
A power-on reset signal is generated from the + 5 V supply via UlOA, B and associated
components. It is used to reset all CPUs in the instrument.
5 V Buffering
The power-on reset signal and +5 V are applied to transistors Qll and &lo, respectively, to
generate the buffered + 5 V for use on the Display UP Board (A2) This is used in the event of
power fail to save stored data for approximately 15 s.
Extender Board
The extender board (78354-66504) in the full modules 78354A/C and 78834A/C, the
instrument is connected to the mother board with ribbon cables, and supports additional
parameters.
1-6 Theory Of Operation
Blatt von alte Seite l-5 hier einfiigen
Figure 1-3. Mother Board Block Diagram
Theory Of Operation
1-7
Display UP Boards 78353066502 (16K byte), 78354-66502 (40K byte)
78354-66602 and 78354966702 (48K byte)
The Display UP Board is the heart of the instrument.
1.
2.
3.
4.
5.
6.
7.
8.
It contains the following functions:
Shared memory
Character generation (numerics)
Slow/fast sync. signal generation
Clock generation
20 ms and 2 ms interrupt signal generation
Alarm trigger generation
Power fail circuit
Keyboard handling
The shared memory and data transfer are already described in “Shared Memory and Data
Transfer”.
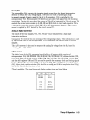
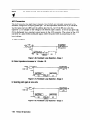
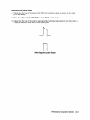
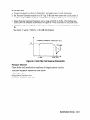
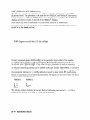
Character Generation
The screen has a capacity of 30 small characters or 15 large characters in horizontal direction
and 18 small characters or 9 large characters in vertical direction (4 small characters can be
joined together to make 1 large character). The screen is thus divided up into a maximim of
540 small characters. Each character position is definedby a specific address. The hexadecimal
addresses begin at the bottom left of the screen with address OOOH,progress up to the top left
(address 012H) and finish at the top right of the screen with address 21BH.
Address
012H
Address
21BH
30 small
15 large
Address
OOOH
Figure 1-4. Address/Character
Distribution on the screen
With each address from the CRT controller U20, the numerics RAM U16 passes information
on the character to be displayed to latch U18 (6-bit ASCII data information code for
character definition, plus one bit to define whether large or small character and one bit to
define whether inverse or not).
The lo-bit data is passed to the character generator U12: the 6-bit character information, the
3 bits from the column counter and the inverse bit. The data from the character generator is
then latched into the parallel-serial shift register Ull for output to the video circuits on the
Mother Board.
1-8 Theory Of Operation
The sweep is delayed by two clock signals so that it does not start until the character
information has reached the parallel-serial shift register Ull; i.e. with one clock pulse, address
1 data is latched into the parallel-serial register, address 2 data is latched into U18 and
address 3 data presented to the numerics RAM from the CRT controller.
The CRT controller U20 is programmed to provide 24 fast sweeps per row of addresses. The
character size information is passed to column counter U14 to determine the number of fast
sweeps per column. With an 8x8 dot matrix per small character, this gives 3 fast sweeps for
every column for a small character, and 6 fast sweeps for every column for a large character.
The character size information is also passed to the load and clock multiplexer. The shift rate
for small characters is twice as high as the shift rate for the large characters. In the wave area
the characters are smaller than in the numeric area, 4x6 dot matrix instead of 5x7 dot matrix.
All characters in the wave area and the inverse characters in the numeric area are displayed
with half intensity.
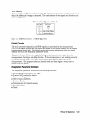
Information from the CPU can only be written into the numerics RAM during the 2 ms
horizontal retrace time. For large characters the ASCII information is written into the
numerics RAM four times altogether.
I
Add X
I
Small character
addressed once
4-l
Add
X
Add
X
Add
X
Add
x
Large character
addressed
four times
Slow/fast Sync. Signal Generation
The CRT controller U20 also provides the slow sync. and the fast sync. signals for the video
circuits on the Mother Board and the display enable (DE) signal for the interpolation circuits
on A3.
Clock Generation
Clock chip Ul provides the clock signal for the clock divider U6. The clock signals generated
here are used in the entire instrument.
2 ms Interrupt Signal Generation
The 2 ms interrupt
signals.
circuit U2, U3, U8 is used to generate the shared memory access timing
Alarm Trigger Generation
The CPU generates the QRS, alarm and INOP trigger signals and latches these from the data
bus into U32 (alarm latch). U32 passes the trigger signals to the Audio Board for further
processing.
Theory Of Operation
1-9
Power Fail Circuit
In the event of power fail, the shared memory, U40, is buffered for at least 15 s. If power
returns after these 15 s, the power fail signal is delayed (30 ms after the reset signal). This
creates a power-on reset, i.e. instrument set-up is reconfigured. If power returns before the
15 s are up, the instrument set-up is maintained.
Display Software
The Display software contains the following modules:
Initialisation of CRT controller
Self tests (ROM/RAMS/ sounds test) and error handling
n Service tests (CRT adjust, wave interpolation
check)
n Keyboard handling
n Soft key labeling
n Display editing
n Processing and issuing of alarms
H Wave handling (wave addressing, wave RAM loading, erase
n bar control)
n Communication
with the parameter software via the common shared memory
n
n
The display software is contained in one 32K x 8 EPROM (U26), and in one 8K x 8 EPROM
(U50) on board 78354-66502, in one 16K EPROM (U50) on boards 78354-66602 and
78354-66702.
Note
I
lb
l-10
78353-66502 Board U26 is 16K x 8,
U47,U52,U54 and U55)
)
) not included
<ON RESET
Theory Of Operation
Faltblatt
von alte Seite l-9 hier einfiigen
Figure l-5. Display Microprocessor
Board Block Diagram
Theory Of Operation
l-1 1
. .. . . ... . ..
1-12
Theory Of Operation
Single Channel Interpolation Board 78352-66503
The Interpolation Board contains most of the control circuit for generating the video pulses
for the waveform display.
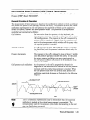
The Monitor display uses a vertical raster format of 720 vertical lines with a vertical raster
frequently of 40 kHz and a frame frequency of 50 Hz. To eliminate the quantitization of
sampled data, the Interpolation Board utilizes a smoothing algorithm. The smoothing
algorithm interpolates four consecutive waveform samples. Depending on the relative values
of the four samples, the intensity of the CRT beam is modulated to produce a continuous
waveform with a constant line width.
The main functions of the Interpolation
1.
2.
3.
4.
5.
6.
7.
8.
9.
10.
Board are listed below:
D-A converter
Sample and hold
Shuffle mux
Video pulse generator
Ramp generator
Raster line control
Erase bar latch
Wave length latch
Start-up delay
RAM for A2 display board (RAM 1)
D-A Convertor and Sample and Hold Circuits
The waveform is stored in digital form in the wave RAM 1 (U35). It is converted in U5 into
an analog voltage in order to perform the smoothing algorithm. The smoothing algorithm
uses four waveform samples. Analog multiplexer A (U8) acts as a 4 PST switch rotating one
position in between every raster line. The sample and hold circuit (UlO), therefore, holds the
dc level of the present and previous 3 waveform samples.
Shuffle MUX
Analog multiplexer B (Ull, Ul2) makes alternately available to the video pulse generator the
four stored dc levels, in the correct time relationship.
Video Pulse Generator
The weighted comparators (U14, U15, U16, U17) generate a series of pulses in response to the
waveform samples. The video pulse generator circuit translates the pulses from the weighted
comparators into video pulses that are used by the video circuits on the Mother Board (Al).
Theory Of Operation
1-13
Ramp Generator
The ramp generator (U28, Ql, Q2) generates a ramp for each raster line (fast sweep). The
ramp signals are used by the weighted comparators for each sample that is displayed. The
output combinational logic within the video pulse generator logically combines these pulses so
as to produce four digital outputs corresponding to four levels of CRT beam intensity.
Raster Line Control
During data input to the DA converter U5, the raster line control (UlA, UlB) sends a WAIT
signal back to the Display UP Board, in order to synchronize the CPU, which operates as a
line counter. This status is reversed by the display enable signal.
Erase Bar Latch
The erase bar latch (U4A) provides waveform blanking (fading effect of erase bar) by using
Data DO information.
Wave Length Latch
The wave length latch (U3A) is used to blank the wave after a defined number of raster lines
have been displayed.
Start-up Delay
The start-up delay (U7, U3B) d rives MUX A decoder (U9A, U32) and MUX B decoder (U2)
and ensures that the wave is blanked until all four samples are stored for the next frame.
1-14
Theory Of Operation
Faltblatt
von alte Seite l-11 hier einfiigen
Figure 1-6. Single Channel Interpolation Board Block Diagram
Theory Of Operation
1-15
Three-Channel Interpolation Board 78353-66503
The Interpolation Board (78353-66503) contains the control circuit for generating the video
pulses for the waveform display.
The main functions of the Interpolation
1.
2.
3.
4.
5.
6.
7.
8.
Board are listed below:
D-A conversion
Waveform smoothing
Load Control
Load Timing
Video Pulse generation
Ramp generation
Ramp timing
Erase bar latch
The 783Xx and 788Xx monitor series use a vertical raster format of 720 vertical lines
with a vertical raster frequency of 40 kHz and a frame frequency of 50 Hz. To eliminate
the quantization of sampled data, the Interpolation Board uses a smoothing algorithm.
The smoothing algorithm interpolates four consecutive waveform samples, and is carried
out separately for each of the three channels. Depending on the relative values of the four
samples, the intensity of the CRT beam is modulated to produce a continuous waveform with
a constant line width.
The waveform is stored in digital form in the wave RAM (U14). It is converted in DAC 1,
2 or 3 into an analog voltage, in order to perform the smoothing algorithm. The smoothing
algorithm uses four waveform samples.
In the Hybrid circuits the dc levels of the four waveform samples are compared with
the output signals of the ramp generators, resulting in a series of pulses. The output
combinational logic within the video intensity logic circuits logically combines these pulses
so as to produce four digital outputs corresponding to four levels of CRT beam intensity.
These video pulses are transferred to the video circuits on the mother board (to the 2 axis
amplifier).
Data input and output from the DAC stage is controlled by the load-control circuit which also
supplies a waveform-blanking signal for each channel, to the erase bar latch.
The load timing circuit controls the timing and sequence of signals into, and out of, the
Hybrid circuits. The load timing circuit also provides a wave-blanking signal, to blank all
waves, direct to the video intensity logic circuits.
The erase bar latch provides selective waveform blanking (fading effect of erase bar).
1-16
Theory Of Operation
Blatt von alte Seite 1-13 verkleinern and horizontal hier einfiigen
Figure 1-7. Interpolation Board Block Diagram
Theory Of Operation
1-17
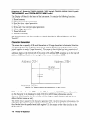
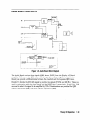
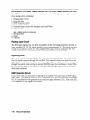
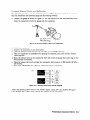
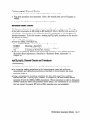
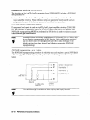
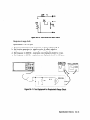
Power Supply Board 78351-66506
+5 V DC Supply
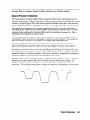
In order to increase
voltages (8.2 V and
if ever it falls below
connected until the
the efficiency of the analog dc power circuit (5 V), two unregulated dc
6 V) are provided. The 6 V dc supply is connected to the sensing circuit;
a threshold of 5.5 V, the 8.2 V dc is connected instead and remains
6 V dc returns to a value higher than 5.5 V.
8.2 V
uMo. DC
m!,!: DC
- 5.5 v 7HRLSHOLD
5VDC
ov
1
I
I
I
I
I
I
!
I
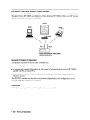
Figure 1-6. Voltage Sensing and Regulation
The unregulated 8.2 V dc is applied to transistor Q4 and the unregulated 6 V dc to transistor
Q5. The unregulated 6 V is divided by R15/R16 and applied to sensing amplifier U6A. The
-4 V ref is applied to 1:l amplifier U6B, which alters the polarity of the signal to give a
constant +4 V at the base of transistor Q7.
If the unregulated 6 V is higher than the 5.5 V threshold, CR12 conducts, setting the output
of U6A to 3.4 V. Since the base potential of QS is now lower than that of Q7, Q7 is rendered
conductive. This causes driver transistor Q5 to conduct, letting the +6 V pass to provide the
+5 V. If the unregulated 6V is lower than the 5.5 V threshold, CR12 is reverse-biased and
CR11 conducts. the output of U6A is now at 4.6V which means that the base potential of QS
is higher than that of Q7. QS and Q4 are rendered conductive, letting the unregulated 8.2 V
pass.
U6D is the current-sensing circuit and U6C the voltage sensing circuit for the f5 V supply.
Qll is the switch for the battery mode. The -4 V ref is generated by U3 and associated
components. It is used as the reference power source for the +5 V and the i-40 V power
supplies.
f12 V DC Supplies
Ul and U2 are linear power regulators with internal current limiting.
and -12 V dc supplies, respectively.
They provide the +12 V
+17V DC Supply
U5 is an adjustable power regulator with internal current limiting
provides the i-17 V dc supply.
1-18
Theory Of Operation
and overload protection.
It
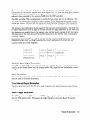
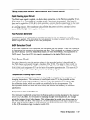
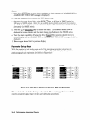
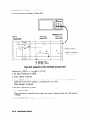
Audio Board 78353-665 12
r---
I
I
I
L ____
-----------
-----.-----
.-----~
I
ECG WAVE OUTPUT
---------~~----------~.~
OEFlERlLLATOR
INTERFACE
ClRculT
1
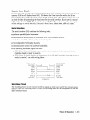
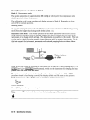
Figure 1-9. Audio Board Block Diagram
The Audio Board receives three signals (QRS, a1arm, INOP) from the Display UP Board.
Amplifier U3B creates the QRS tone, whereby appropriate jumpering (Sl on Al Mother
Board) can provide a differentiation between the standard and the Japanese QRS tones.
Divider Ul divides the 62.5 kHz signal to provide two signals (976 Hz and 488 Hz). These are
used in conjunction with the alarm signal and the INOP signal, respectively. Gates U2A, U2B
are used to select the signal to be amplified by U3A. Potentiometers are provided for QRS
volume adjustment (R22) and alarm volume adjustment (R23).
Theory Of Operation
1-19
All three signals are applied to audio amplifier U3C where they are amplified and applied
directly to the loudspeaker. The Audio Board also contains the external brightness
potentiometer R24 and houses the input jack (auxiliary inputs 2 and 21).
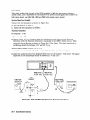
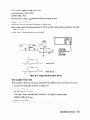
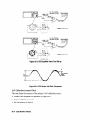
Defibrillator Interface circuit (78353-66511 only) - the defibrillator interface circuit is located
on the Audio Board. When the defibrillator senses an ECG wave from either the tip or the
ring of the phone jack, it sends back to the tip of the phone jack a marker pulse which is
detected by the Marker Detector Circuit. The marker is indicated as a vertical line on the
trace of the ECG wave.
Note
The Audio board 78353-66509 does not include this circuit.
3
,
l-20
Theory Of Operation
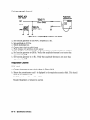
Battery Board 78832-66519
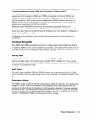
Battery Charge Circuit
When the unit is switched on, battery BTl is charged via U3C and U3D. In this situation the
j-5 V supply to the parameter boards is supplied via Q2. The power-on signal at the base of
Ql causes Ql, and hence Q2, to conduct. U3B is switched on and acts as a diode bringing the
base of U3A to +5 V. Hence U3A is reverse-biased and not conducting. So the i-5 V supply is
routed from the input connector via Q2 to the parameter boards.
When the power is switched off, Q2 is also switched off and the battery discharges power via
U3A to the parameter boards.
Alarm Lamp Drive Circuit
The alarm lamp signal and 20 ms SYNC signal are combined at gate UlA. When the alarm
lamp signal is low at the same time that the SYNC signal is low, the flip-flops (U2A, U2B) are
cleared and the lamps are off.
When there is one rising edge on the alarm lamp signal between SYNC pulses, the output of
U2B goes high and lamp Ll is switched on. When there are two rising edges the output of
U2A goes high and lamp L2 is switched on.
Theory Of Operation
1-21
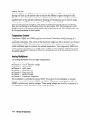
ECG Board (Full Lead) 78354-66522(42)and 78354-66722(42)
The ECG Board contains the entire circuit required for ECG signal processing. It consists of
an analog section containing:
1.
2.
3.
4.
5.
6.
Floating input circuit
Right leg drive
INOP detection circuit
Lead selector circuit
Grounded input circuity with bandpass and notch filters
A-D converter
and a digital section containing:
7. Microprocessor
8. ROM
9. RAM
Floating Input Circuit
The ECG input signals (C, LL, LA, RA) are applied, via the overvoltage protection circuits,
to input amplifiers Ul, U2 which provide a gain of 1. The signals are then routed to lead
selector switch U4, U3. The amplified (U6) ECG sr‘g na 1 is fed to modulator U6. The resulting
AC voltage is transferred to the grounded section by transformer T2.
Right-Leg Drive
The common-mode error signal that serves as input to the right leg drive circuit is derived
from the signals summed through R16 and R17. This common-mode error signal drives the
right-leg drive amplifier U9A. The output of the right-leg drive amplifier returns to the patient
through the patient cable, serving to prevent 50/60 Hz power line interference. Gates UlOA,
B, C switch this signal to the LL, LA or RA input (Ql, Q2, Q3, respectively) according to
which lead is selected (I, II, III) for the other lead positions, connection via RL is used.
INOP Detection Circuit
If any of the leads are disconnected, right-leg drive amplifier U5A generates an INOP signal
(logic high). This signal is p assed to INOP comparator U9B, and then switched to modulator
U6. It is transferred to the grounded circuit and once again detected (U15). From latch U21,
it is transferred to the digital ECG circuits.
Lead Selector Circuit
U24 receives lead information from the microprocessor U27 via the data bus. The serial
output from U24 drives the opto-coupler U39 via Q13, to transmit information to the floating
circuit. U8 receives this incoming serial data and transmits parallel output to the lead
switches U4, U3 and to the gates U7 and UlO.
1-22
Theory Of Operation
Grounded Input Circuit
Demodulator Ull provides the demodulated ECG signal. From here the signal is routed to
the bandpass filter U12, U14, which functions in conjunction with the FILTER/DIAGnostic
switching capability. When the FILTER ( monitoring) mode is selected, the ECG signal is
filtered, giving a bandwidth of 0.5 Hz to 30 Hz.
Pace Pulse Rejection: the demodulated signal is directed to the pace pulse hybrid circuit
which detects pace pulses and transmits this information to UP via Latch U21. This signal is
then transferred to the instrument’s shared memory.
The notch filter removes AC line frequency artifacts and the results of AC line rectification
from the waveform display during electrosurgery. The notch filter is bypassed in the
DIAGnostic mode.
After these two filter stages, the ECG signal is A/D converted via DAC (lo-bit) U16 and
comparator U17 on the basis of successive approximation. In operation, the microprocessor
first guesses a number, then U16 converts this to an analog signal and U17 compares it with
the input voltage. The output of the comparator returns to the microprocessor for further
processing.
Digital Circuits
The A/D converted ECG information is processed by the microprocessor U27 in the digital
circuit and the results passed to the shared memory on the Display UP Board (A2). The
digital circuit also processes data from the shared memory.
Theory Of Operation
1-23
ECG Parameter Software
The ECG parameter software contains the following modules:
n
ECG wave processing
A/D conversion
0 Pace pulse rejection
q Digital filtering
q Autofix/Autogain
for the display
q Beat detector
q Trend*
•I Fibrillation and Noise detection
Heart rate calculation
Alarm derivation
q Leads-off alarm
q Asystole alarm
q High rate alarm
0 Low rate alarm
Keyboard handling
Communication with shared memory
Selftest and error handling
q
n
n
n
n
n
The ECG parameter software is contained in one 16K x 8 EPROM (U28) located on the ECG
Board.
*Trend capability:
The ECG trend times and display update times are listed below
Trend Time 1Update Time
I
20 min
3.1 s
9.4 s
60 min
2h
4h
8h
24 h
1-24
Theory Of Operation
18.7 s
37.4 s
1.25 min
3.74 min
Faltblatt
von alte Seite 1-21 hier einfiigen
Figure l-10. ECG Board Block Diagram (Full Lead)
Theory Of Operation
1-25
ECG Board (3 Lead) 78832966522 (50 Hz) and 78832-66542 (60 Hz)
The ECG Board contains the entire circuitry
of an analog section containing:
1.
2.
3.
4.
5.
6.
required for ECG signal processing. It consists
Floating input circuit
Right leg drive
INOP detection circuit
Lead selector circuit
Grounded input circuit with bandpass and notch filters
A-D converter
and a digital section containing:
7. Microprocessor
8. ROM
9. 2 RAMS
Floating Input Circuit
The ECG input signals (LL, LA, RA) are applied, via the overvoltage protection circuits, to
input amplifiers Ul, U2, U3, which provide a gain of approximately 15. The signals are then
routed to lead selector switch U4. The amplified ECG signal is fed to modulator U6. The
resulting AC voltage is transferred to the grounded section by transformer T2.
Right-Leg Drive
The common-mode error signal that serves as input to the right leg drive circuit is derived
from the signals summed through R21 and R22. This common-mode error signal drives the
right-leg drive amplifier U5A. The output of the right-leg drive amplifier returns to the patient
through the patient cable, serving to prevent 50/60 Hz power line interference. Gates UlOA,
B, C switch this signal to the LL, LA or RA input (Ql, Q2, Q3, respectively) according to
which lead is selected.
INOP Detection Circuit
If any of the leads are disconnected, right-leg drive amplifier U5A generates an INOP signal
(logic high). Th is signal is passed to INOP comparator U5B, and then switched to modulator
U6. It is transferred to the grounded circuit and once again detected (U15). From latch U21,
it is transferred to the digital ECG circuits.
1-26
Theory Of Operation
Lead Selector Circuit
Frequency selector U18, U19 is clocked by the 1 MHz signal from clock divider U30. It also
receives lead select data (DO to D3) from latch U22. The frequency selector is used for lead
select coding:
45.46 kHz
31.25 kHz
38.47 kHz
25 kHz
18.52 kHz
= Lead I
= Lead II
= Lead III
TEST Signal (low)
TEST Signal (high)
The signal is then sent to power driver QS, Q7 and passed via transformer Tl to the floating
circuit. The floating lead select logic consists of monostable multivibrators U7A, U7B, counter
U8 and latch U9. The output signals are applied to lead selector U4 and right-leg drive gates
UlOA, B, C.
Grounded Input Circuit
Demodulator Ull provides the demodulated ECG signal. From here the signal is routed to
the bandpass filter U12, U14, which functions in conjunction with the FILTER/DIAGnostic
switching capability. When the FILTER ( monitoring) mode is selected, the ECG signal is
filtered, giving a bandwidth of 0.5 Hz to 30 Hz.
The notch filter removes AC line frequency artifacts and the results of AC line rectification
from the waveform display during electrosurgery. The notch filter is bypassed in the
DIAGnostic mode.
After these two filter stages, the ECG signal is A/D converted via DAC (lo-bit) U16 and
comparator U17 on the basis of successive approximation. In operation, the microprocessor
first guesses a number, then U16 converts this to an analog signal and U17 compares it with
the input voltage. The output of the comparator returns to the microprocessor for further
processing.
Theory Of Operation
1-27
Digital Circuits
The A/D converted ECG information is processed by the microprocessor U27 in the digital
circuit and the results passed to the shared memory on the Display UP Board (A2). The
digital circuit also processes data from the shared memory.
ECG Parameter Software
The ECG parameter software contains the following modules:
ECG wave processing
q A/D conversion
q Digital filtering
q Autofix gain for the display
q Beat detector
n Heart rate calculation
w Alarm derivation
q Leads-off alarm
o Asystole alarm
q High rate alarm
0 Low rate alarm
n Keyboard handling
m Communication with shared memory
n Selftest and error handling
n
The ECG parameter software is contained in one 8K x 8 EPROM (U28) located on the ECG
Board.
1-28 Theory Of Operation
Faltblatt
von alte Seite l-25 hier einfiigen
Figure l-11. ECG Board Block Diagram (3 Lead)
Theory Of Operation
1-29
Pressure Board 78353-66532 (Single Channel) and 78353-66534
(Dual Channel)
Note
I
Where block functions are repeated in both pressure channels, only channel 1
is described.
!b
The pressure board contains all the circuits required for processing two pressure signals. The
board supplies an excitation voltage to the transducers, and processes the resulting transducer
output signals for display and system use.
Transducer Excitation Circuits
Frequency divider (U19, UlO, Ull) divides down a 1 MHz square-wave input to give a 2400
Hz square-wave output. This is filtered to give a sine wave which is input to the push-pull
amplifier stage (Ql, Q2). This stage provides the excitation voltage and current to the
transducer across transformer T3.
Transducer Signal Demodulation
Circuits
The input signal from the transducer is transferred across transformer Tl to input-amplifier
Ul. This amplifier has a proportional gain of Xl or X8 for 40 UV or 5 UV transducers
respectively. When a 5 UV transducer is used, pins 5 of the front panel connector are shorted
together causing a light emitting diode to conduct, activating a light sensitive transistor
(U17). This transistor conduct switching FET Q7 on. With Q7 conducting Rl is connected to
ground thus increasing the gain of the amplifier (Ul) by a factor of 8.
After amplification the signal is filtered (U2) before demodulation. The synchronous
demodulator (U2, U3) rectifies the signal using an operational amplifier which has alternately
an inverting gain and non-inverting gain. The excitation-voltage signal is used to switch the
amplifier between inverting gain and non-inverting gain.
A 12 Hz low-pass filter (U7) then removes the excitation frequency to leave the dc pressure
signal. This signal goes via amplifier U19A to the system output, and also via the selector
switch (U12) to the analog to digital (A/D) conversion stage.
Analog to Digital Conversion
The analog to digital conversion uses a DAC (U14) and comparator (U13) in a method based
on successive approximations. In this method the microprocessor supplies a number, then U14
converts this to an analog signal and U13 compares it with the input voltage. The output of
the comparator returns to the microprocessor for further processing.
l-30
Theory Of Operation
Transducer Disconnected Detection
If the transducer is not connected, a change in load current is sensed by resistor R22 in the
push-pull amplifier stage (Q2, Q3). Th is resistor is connected to a differential amplifier
(U19B), which amplifies the voltage across the resistor. Hence when the current in R22
changes, as the result of transducer disconnection, the output of the amplifier (U19B) will also
change. This output voltage goes to the selector switch and then to the A/D conversion stage.
Here it is converted into a digital signal for use in the digital circuits, to generate an INOP
signal when necessary, and for storage in the shared memory to initiate pressure signal display.
Zero, Calibration and Test Functions
A DAC (U8) and amplifier (U5) are used to provide calibration and test functions to the
input amplifier (Ul). The same circuits also provide zero compensation for the transducer.
When testing the board the input from the transducer to the input amplifier (Ul) is grounded
using a signal applied from latch U24, on the digital section of the board. The alternative test
and calibration inputs are provided by the DAC (U8) as a result of the digital inputs to U8
from the microprocessor.
Digital Circuits
The A/D converted pressure information and transducer disconnected signal are processed
by the microprocessor (U27) in the digital circuits and the results are passed to the shared
memory on the display microprocessor board (A2). The digital circuits also process
information from the shared memory for use in the pressure parameter circuit.
The additional EAROM in the digital circuits is used as a RAM and ROM facility for
accurate storage and recall of the gain constant used by the internal software for the pressure
signal display and output.
The watchdog timer (U29, U26, U15) is a counter (U15) which has a 2 ms input and is reset
by a regular pulse via gate U29. If the microprocessor is not working correctly the pulse
to U29 does not occur regularly and the counter is not reset. The output from the counter
overflows via gate U26 to cause a reset in the microprocessor program, back to the initial
power on sequence etc.
Theory Of Operation
1-31
Pressure Parameter Software
The pressure parameter software contains the following modules:
n
n
n
n
n
n
n
Pressure signal processing
q Systolic/diastolic/mean
detection and calculation
q A/D conversion
q gain fixing and storage, for output and display
Alarm derivation
Communication with the shared memory
Self-test and error handling
“Watchdog” timer
0 CPU reset
Auto zero
Trend l:
q 78353B and 78354A/C:
trend times 20 min, 60 min, 2 h, 4 h, 8 h, 24 h
q 78833A, 78833B and 78834A/C: trend times 2 min, 20 min, 60 min, 2 h, 4 h, 8 h, 24 h
The pressure parameter software is contained in a 16K X8 EPROM (U28).
’ Trend capability: the pressure trend curve is the average values of mean,
diastolic and systolic pressures. The trend information is updated at specified
times dictated by the trend time selected - see table;
Note
I
lkend Time ! 1Update Time
2 min
20 min
60 min
12.5 s
37.4 s
2h
4h
8h
24 h
1.25 min
I
2.5 min
5 min
15 min
The screen is divided into 384 points and each trend data sample requires 4 points, therefore
the update time is calculated from: (trend time / 384) x 4
1-32
Theory
Of Operation
Faltblatt
von alte Seite l-29 hier einfiigen
Figure 1-12. Pressure Board Block Diagram
Theory Of Operation
1-33
,. .. ...
1-34
Theory Of Operation
Non-Invasive Blood Pressure (NIBP) Board 78352-66535
For the new NIBP board 78352-66538 used on 78xxxC monitors see “Non-Invasive
Pressure (NIBP) Board 78352-66358”.
Blood
General Principle of Operation
The measurement of blood pressure is based on the oscillometric method in which an inflated
cuff around the patient’s limb partially occludes the artery. The pulsatile arterial flow causes
oscillations superimposed on the cuff pressure, the amplitude of which can be analysed to
obtain the systolic, diastolic and mean pressure values. The procedure is microprocessor
controlled and summarized as follows;
Cuff inflation
On instruction from the operator, via the keyboard, the
microprocessor instructs the pump to inflate the cuff to about
180 mmHg pressure. The pressure in the cuff is measured by
a piezo-resistive transducer. Signals from the transducer are
sent to the microprocessor which’switches off the pump when
the required pressure is reached.
Arterial
At cuff pressures of about 180 mmHg the artery is occluded
(no blood flow) and th e p ressure transducer detects only the
cuff pressure.
occlusion
Pressure decrements
The pressure in the cuff is released in steps of about 7 mmHg
until the pressure partially occludes the artery. At this point
the, artery pressure oscillations are seen superimposed on
the cuff pressure.(Below cuff pressure of 30 mmHg the steps
reduce to 2 mmHg).
Cuff pressure and oscillations
As the pressure in the cuff is progressively released the
magnitude of the oscillation as a function of the cuff pressure
increases until the arterial mean pressure is reached. When
the cuff pressure falls below the arterial mean pressure the
oscillation magnitude decreases as illustrated in the following
diagram:
air pressure in cuff
maximum
oscillation
/
pressure
arterial
. mean
pressure
\
arterial
pressure curve
time
Note
This is a schematic representation only to demonstrate that the maximum
oscillation is reached as the arterial mean pressure is approached. The
microprocessor waits for two pressure cycles before decrementing to the next
step, see Oscillations paragraph.
Theory Of Operation
1-35
Oscillations
The pressure transducer detects both the cuff baseline
pressure and pressure oscillation. These signals are amplified
and filtered to separate the cuff baseline pressure and the
pressure oscillations. The micro processor compares successive
pressure oscillation magnitudes until it detects two oscillations
of similar amplitude. By checking two subsequent oscillations
it is possible to reject artefact due to patient movement. The
baseline cuff pressure and oscillation magnitudes are stored
in the memory and the cuff pressure is further decremented.
Subsequent oscillation magnitudes will show decreases until no
significant oscillations are seen.
Results
The microprocessor displays the arterial mean pressure
together with the systolic and diastolic pressures. The cuff is
completely deflated and depending on the selected cycle time
is inflated to when the next measurement is to be made
There are still some oscillations present above and below the systolic and
diastolic values)
Note
3
Safety circuit
If the cuff pressure exceeds 315mmHg f10, the safety circuit
cuts in to release the pressure via the release valve, and an
error message is displayed. (The circuit is essentially a bellows
which expands under pressure and trips a microswitch opening
the release valve.)
The block diagram below illustrates
non-invasive blood pressure.
Blatt von alte Seite 1-31 hier einfiigen
1-36
Theory Of Operation
the general principle of the
NIBP Parameter Board 78352-66535
The NIBP parameter board is located on the extended mother board, of the full module
78354A. The board contains the pressure transducer, release valve, and all the circuitry
necessary to operate the pressure pump and process the pressure signals. A safety circuit
prevents the cuff from overpressurizing and is also mounted on the parameter board.
Pressure Transducer
The pressure transducer is of the piezo-resistive type and supplied with 1OV dc from amplifier
(Ul). Pressure applied to the transducer causes a change in resistance and the output signal
ranges between O-70 mV.
Amplification and Filtering
The pressure transducer’s output signal is amplified by (76-152) at U3. Cut-off frequency at
U3 is 100 Hz. The amplified signal is sent to switch U8 directly and via the band pass filter
network. The signal arriving directly at U8 contains information on cuff pressure (baseline
cuff pressure and oscillation pressure) but the signal arriving from the band pass filter network
contains only oscillation pressure information. The band pass filter network comprises of a
2nd order LP filter (fc = 10 Hz) and a 1st order filter (fc = 1 Hz). The switch in the filter
network from U13 latch is included to obtain a fast decrease time for improved oscillation
pressure detection. Switch U8 switches alternately at a rate determined by software,
depending on the presence of oscillations.
Analog to Digital Conversion
The analog to digital conversion uses a 12 bit DAC and comparator (U5 & US). The method
used is successive approximation under the control of the uP.(In order to suppress noise
the supply to the DAC includes the accurate -8 V from the reference supply (U7). The UP
loads a value into the DAC which is compared to the voltage to be converted (i.e. pin 18).
The output of the comparator (U6) indicates to the UP if the value on the data bus is the
equivalent of the unknown input analog voltage.
Digital Circuit
The A/D converted pressure signals are sent to the Z8OL microprocessor (U21) and after
processing to the shared memory. ROM (U25) having 16K and RAM (U26) with 2K memory
provide the necessary storage and recall of cuff/oscillation pressure information. The ROM
contains the program for the control of the measurement process.
Clock divider U17A provides the microprocessor with a 2 MHz pulse. The watchdog timer
circuit includes counter (U19) and receives the same 2 ms input as the microprocessor. If the
microprocessor does not reset, the watchdog timer interrupts with a reset signal.
Theory Of Operation
1-37
Digital Circuit
The purpose of this circuit is to release the pressure in the
also to provide the control signals for the valve and pump.
five connections on the pressure valve and the valve is held
the pressure in the cuff exceeds 315 mmHg a metal bellows
holding the valve closed. If the power fails the safety valve
cuff pressure.
NIBP Parameter Software
The software contains the following modules;
A/D conversion in U5,
n systolic/diastolic/mean
pressure detection & calculation,
n alarm determination,
w communication with shared memory,
n Watchdog timer - to reset CPU,
n overpressure circuit controlled by CPU,
m Trend*
n
NIBP parameter software contained in 16K ROM (U25)
*NIBP Trend Times are:
Trend Tie
1-38
Theory Of Operation
Update Time
20 min
60 min
12.5 s
37.4 s
2h
4h
8h
24 h
1.25 min
2.5 min
5 min
15 min
cuff if it exceeds 315 mmHg and
The overpressure safety circuit has
closed via a 5 V relay switch. If
expands and cuts out the circuit
opens automatically to release any
Faltblatt
von alte Seite l-33 hier einfiigen
Figure 1-13. Non-Invasive Blood Pressure Board Block Diagram (78352-66535)
Theory Of Operation
1-39
. . . . . . . . ..
l-40
Theory Of Operation
Non-Invasive Blood Pressure (NIBP) Board 78352066358
The new NIBP board 78352-96538 is used in the HP78352C, HP78354C Adult and HP78834C
Neonatal Monitors. It is designed to be used with adult, pediatric and neonatal patients in
either an OR or ICU environment.
This new NIBP board uses surface-mounted technology (SMT). This does not allow repairs to
be carried out in the field.
Specifications
Complies with UL544, IEC 601-1, CSA C22.2 No. 125. Patient leakage
current < 10uA at lOOV/60Hz a.c.
Safety
Protected against damage from defibrillation
and electrosurgery.
Cuff Pressure
Range
0 to 280 mmHg (0 to 37 kPa).
Cuff Inflation
Rate
less than 10 s (typical for normal adult cuff).
Auto Mode
Repitition
2, 5, 10, 15, 30 and 60 minutes. Time Defaults: 5 minutes (OR), 15 minutes
(ICU)
STAT Mode
Cycle Time
Measurement
Time
5 minutes.
Auto/Manual:
35 s (adult), 20 s (neonatal)
STAT: 17 s
Typical at HR greater than 60 bpm.
Cuff Pressure
Accuracy
15°C to 25°C f3 mmHg.
10°C to 35°C f3 mmHg (fO.G% or reading).
0°C to 55OC f3 mmHg (f1.7% or reading)
Display
Update
Auto/Manual/STAT:
INOP Alarms
Trigger if a static pressure, an overpressure or an overlong measurement time
is detected.
< 2 s after end of measurement.
Patient Modes
The new NIBP board 78352-66538 is designed to be used with adult, pedatric and neonatal
patients. The Measurement Ranges, Limit Alarms and Overpressure Safety Limits are listed
for each patient mode in turn.
Adult Mode
Measurement Ranges and
Limit Alarms
Systolic: 30 to 270 mmHg (4 to 36 kPa).
Diastolic: 10 to 245 mmHg (1.5 to 32 kPa).
Mean: 20 to 255 mmHg (2.5 to 34 kPa)
Theory Of Operation
1-41
Limit Alarm Adjustment
5 mmHg (1 kPa) steps
2 mmHg (0.5 kPa) steps for 10 to 30 mmHg range.
Overpressure Safety Limits
maximum 330 mmHg (44 kPa).
Pediatric Mode
Measurement Ranges and
Limit Alarms
Systolic: 30 to 180 mmHg (4 to 24 kPa).
Diastolic: 10 to 150 mmHg (1.5 to 20 kPa)
Mean: 20 to 160 mmHg (2.5 to 22 kPa)
Limit Alarm Adjustment:
5 mmHg (1 kPa) steps,
2 mmHg (0.5 kPa) steps for 10 to 30 mmHg range.
Overpressure Safety Limits
maximum 220 mmHg (30 kPa).
Neonatal Mode
Measurement Ranges and
Limit Alarms
Systolic: 30 to 130 mmHg (4 to 17 kPa)
Diastolic: 10 to 100 mmHg (1.5 to 13 kPa)
Mean: 20 to 120 mmHg (2.5 to 16 kPa)
Limit Alarm Adjustment:
5 mmHg (1 kPa) steps,
2 mmHg (0.5 kPa) steps for 10 to 30 mmHg range.
Overpressure Safety Limits
maximum 165 mmHg (22 kPa).
Measurement Principle
Oscillometric
Measurement
The measurement of the blood pressure is based on the ocillometric method
in which an inflated cuff around the patients limb partially occludes the
artery. The pulsitile arterial flow causes oscillations superimposed on the
cuff pressure, the amplitude of which can be analyzed to obtain the systolic,
diastolic and mean pressure values. The procedure is microprocessor
controlled.
Measurement
Method
The board offers an adult, pediatric or neonatal mode. The board also offers
three methods of obtaining the non-invasive blood pressure.
n
Manual: This method takes one measurement of systolic, diastolic and
mean, on each request.
n
Auto: This method takes repeated blood pressure measurements of systolic,
diastolic and mean, at specific user-selected time intervals.
n
STAT: This method imediately takes repeated blood pressure measurements
of systolic, diastolic and mean, over a period of five minutes. This method
uses a faster measurement procedure.
Related Literature
n
Hewlett-Packard Application Note: Systolic Pressure Monitoring,
Oscillometric, Auscultatory and Invasive Techniques; 5954-2388.
n
The Direct and Indirect Measuring Of The Blood Pressure - Geddas L.A. Chicago: Year
Book Medical Publishers 1970; 104-5.
1-42
Theory Of Operation
A Comparison of the
General Principle of Operation
Cuff Inflation
The cuff around the patients limb is connected to the board via
a single tube. The cuff is inflated by the pressure pump once or
repeatedly (depending on the measurement method used) to a cuff
pressure above the patients systolic pressure.
For the first measurement, the cuff inflates to approximately 165
mmHg (Adult), 125 mmHg (Pedi) or 100 mmHg (Neo). For futher
measurements the cuff inflates to approximately 20 mmHg above the
previously measured systolic pressure.
Arterial
Occlusion
When the cuff is greater than the systolic pressure then the artery is
occluded and the pressure sensor only detects the cuff pressure.
Pressure Decrements
Cuff Deflation \ The pressure in the cuff is automatically released
by the deflation system on the board. The deflation occurs in
steps of approximately 7 mmHg until the cuff pressure is partially
occluding the artery. At this point the arterial pressure oscillations
are superimposed on the sensed pressure and are extracted by the
bandpass filter for measurement purposes.
Oscillations
As the cuff is deflated, that is the pressure is progressively released,
the magnitude of the oscillations as a function of the cuff pressure
increases until the mean arterial pressure is reached. The minimum
cuff baseline pressure which allows maximum amplitude of arterial
pressure oscillations is identical to the mean arterial pressure. When
the cuff pressure falls below the mean arterial pressure the oscillation
magnitude decreases. The systolic and diastolic blood pressure values
are deducted from the oscillometric signal by extrapolation, resulting
in empirical values. For the extrapolation the attenuation rate of the
signal on both sides of the maximum readings are used.
Safe Monitoring
The board has the following maximum limits which ensure the safety
of the patient:
1. A maximum measurement time of: 120 seconds (Adult
Pediatrics Modes), 60 seconds (Neonatal Mode).
and
2. A maximum time of 120 seconds for a cuff pressure greater than
15 mmHg for adults and pediatric modes or 60 seconds for a cuff
pressure greater than 5 mmHg for neonatal mode.
3. An overpressure system with the following limits:
a. 330 mmHg maximum (for adult mode)
b. 220 mmHg maximum (for pediatric mode)
c. 165 mmHg maximum (for neonatal mode)
Theory Of Operation
1-43
NIBP Parameter Board 78352-66538
The Analog Board-Hardware
Description
Pressure Transducers and Input Amplifier
The static inflation pressure of the cuff is measured by two identical solid-state transducers
(sensor 1 and 2). These transducers are mounted on either side of the input connector so that
the same pressure is measured by both. The transducers are duplicated for safety reasons so
that there is always a backup if one fails. If one channel produces a false value, the second
channel provides a reference signal by means of which the error can be detected.
The transducers use a bridge circuit to measure the pressure of the cuff. Two amplifiers
(Ul,U2 or U4,U5) supply the bridge excitation voltage of i-5 V (Ul) and -5 V (U2).
The excitation voltage is symmetrical so that a single-ended output is generated for A/D
conversion.
The voltage on the voltage divider (R6, R7/8) is -1.875 V at zero pressure with no offset.
The amplifier U2 adjusts the supply voltage for the transducer so that the voltage on the
output pin 4 (sensor output) is equal to the offset voltage from R38,R39 (f5 mV). The other
output of the transducer (pin 2) is amplified by U3 which has a gain of 111.
Oscillation Channel
An oscillation channel filters and amplifies the oscillations superimposed on the static cuff
pressure. The signal first passes through a low pass filter (U7B with R25,R26,C23,C24) with
a cutoff frequency of 3.5 Hz. The dc voltage is removed by two software-controlled high pass
filters (C25,R27 and C27,R34) with a cutoff frequency of 0.4 Hz. The recovered oscillation
signal is amplified by U7A, and output to the multiplexer U9.
Transistor Ql increases the gain of U7A for neonatal blood pressure monitoring. Increased
gain is needed when measuring neonatal blood pressure because of the smaller oscillations.
Switches U8A and U8C switch the time constant of the high pass filter to achieve rapid
baseline recovery each time the cuff is deflated. This is required because each time the
deflation valve opens, a strong signal is produced that creates an unwanted peak.
Multiplexer and A/D Conversion
The software-controlled multiplexer
to the A/D converter (Ull):
(U9) selects one of the following input signals for output
Static pressure channel
Static pressure channel
n Oscillation
channel
n Reference voltage (t3.8
n Referen’ce voltage (t1.5
w Reference voltage (t5.0
from U3)
from US)
n
n
1 (Output
2 (Output
V)
V)
mV)
The reference voltages are used for test purposes to ensure that the calibration
is valid.
The output from the multiplexer (pin 8) is buffered by the amplifier (UlOA) before it is input
to the A/D converter (U11). A/D conversion is made by the type 7548 12-bit DAC (Ull) and
comparator (U12), by means of a successive approximation algorithm.
1-44
Theory Of Operation
A reference voltage for the DAC of -6 V is produced by UlOB. The reference element (U13)
delivers a stable +5 V reference.
EEPROM and Latch
An EEPROM (U350) st ores the factory calibration values for the sensors and other values
required by the software. This non-volatile memory has a capacity of 128 8-bit words. Data
is loaded and read serially by the 80C88A microprocessor (U26) on the digital board. The
contents of the EEPROM are not lost when the module is unplugged.
The module is factory-calibrated by applying an accurate pressure of 220 mmHg to the
sensors. The values produced are stored in the EEPROM and used for future reference.
A type ‘574 latch (UlOO) is connected to the data bus and stores the switch settings for MUX
(U9), and switch (U8). It also transmits the signals to start the pump motor and close Valve
1.
Hardware Description
Note
No opto-couplers are required on this board because the board is grounded.
Valve Drivers
Two valves are used to inflate and deflate the different types of cuff. Valve 1 is normally open
(the valve for the adult cuff), and Valve 2 is normally closed (the valve for the neonatal cuff).
Valve 2 has two switches (Q3, Q4, Q9) and Valve 1 has only one switch (Q2, QS). There are
two switches to open and close Valve 2 to save power. A relatively high current is needed to
change the state of the switch but a very low current is required to hold the selected state.
Latch U310 on the Analog Board supplies the VALVE-2 signal. The valve is then held closed
with a reduced current from transistor Q3 limited by resistors R53, R54 and R55.
It is not necessary to use the same power conservation technique for Valve 1 because it is
activated very rarely in comparison with the adult valve. When it is activated, Valve 1 is
opened only for a very short period.
Diodes CR8, CR3 and CR4, CR5 are protection
valves are switched off.
diodes to limit the induction
voltage if the
Pump Motor
The pump motor is controlled by U12A, Q5, and the current limiting resistor R73, R74, R75,
R76. The pump is activated when a +5 V signal (PUMP) is received from latch UlOO at the
non-inverting input of U12B. When the motor is switched on, the inrush current is limited to
about 700 mA. When the motor is running, the current is reduced to between 300 and 400
mA depending on the load.
Diode CR9, CR2 protects the transistors from the back emf generated when the motor is
switched off.
Theory Of Operation
1-45
The Digital Board-Hardware
Description
The Digital Board is based around one microprocessor; an 8OC88 (U250). This processing
power is needed to generate an NIBP reading
The 8OC88 processes the signals from the analog board and runs the NIBP algorithm.
Application software is stored on the 128 k x 8 EPROM (U320), and the 32 k x 8 RAM
(U360).
The address decoder (U330) generates the chip select signals for the DAC (U210), and the
latches UlOO, U310, U340, U400, U410.
A Watchdog ASIC (U240) supervises the processor. If either the time interval is too long, or
the data bits are wrong, the ASIC sends a reset signal to restart the microprocessor.
1-46
Theory Of Operation
Bitte Faltblatt
von alter Seite 2-50a (VOLUME
2) hier einfiigen
Figure l-14. Non-Invasive Blood Pressure Board Block Diagram (78352-88538)
Theory Of Operation
1-47
.... .... .
1-48
Theory Of Operation
Partial CO2 Pressure Board 78354-66540 and 78356-66540
General Principle of Operation
The concentration of carbon dioxide (CO 2)
patient’s expired gases. Light arriving from
expired (or inspired) gas, a filter wheel and
by the photoresistor detector. The detector
is measured directly and continuously from the
an infra-red source passes successively through the
an optical interference filter and is then detected
output is processed by the CO2 parameter board.
The transducer is maintained at a constant temperature of 45OC to prevent condensation
developing at the windows of the Airway Adapter (the transducer clips onto this). This also
produces stable conditions for the optical filter inside the transducer to operate in. This is
controlled by the temperature control circuit.
The CO2 measurement technique is based on the absorbtion of infra-red energy by Con. A
rotating filter wheel chops the in-coming light to produce a series of pulses. These pulses are
used to calculate the value of CO2 present in the expired gas using algorithms.
The chopping filter wheel forms the rotor of the dc motor. Four permanent magnets are
placed symmetrically around the wheel to provide the magnetic attraction and repulsion
from a drive-coil pair mounted on the surrounding stator. A properly-phased drive signal is
obtained from the motor drive circuits by integrating and amplifying the voltage from a pair
of sensing coils, also located on the stator. The relationship of the drive coils, sense coils and
magnets are shown in the figure opposite. The motor is started by magnetically positioning a
permanent magnet over one sense coil, then pulsing the drive coils.
The filter wheel contains 2 sealed chambers, one filled with CO:! which is used as a reference
absorbtion and other chamber filled with N2 which does not absorb infra-red light. An
additional empty chamber in the filter wheel gives information on CO2 enclosed in the
transducer. The resulting analog signal at output of transducer’s preamplifier is shown below;
Theory Of Operation
1-49
CO2 Parameter Board 78354-66540 and 78356-66540
The CO2 parameter boards 78354-66540 and 78356-66540 contains the following main circuits:
H Motor and Temperature circuit,
n Preamplifier,
n Analog to Digital conversion,
n Digital circuits necessary to process data and transmit
data to the instrument‘s
memory.
shared
Motor Circuit
When a transducer is connected to an instrument, pin C on Jl is connected to ground which
in turn forces pin 11 on microcomputer U2 also to ground. The microcomputer recognizes the
presence of a transducer and sends a pulse to the start up pulse generator (U3/Ql) via port
10 (pin 13) of U2. The start up pulse generator sends a pulse to power the sense coils of the
transducer and start the filter wheel rotating. (If filter wheel start-up is not successful the
start up pulse generator repeats with a second pulse 2 s later until motor runs). When the
filter wheel rotates a sine wave voltage appears on the sense coils and the sine wave will be
phase shifted by integrator UlB and amplified by variable gain stage U5/Ul. The variable
gain amplifier drives power amplifier Q2 and Q3 to power motor drive coils in the transducer.
To control the motor speed the zero crossing at TPl (output UlB) is detected by Schmitt
trigger U3D, which gives the microcomputer data about actual speed of the motor. An
internal algorithm of the microcomputer controls the gain of U5 to the achieve correct motor
speed of 40 Hz. When the start-up pulse is generated the gain of U5 is 0, but in normal
operation when the motor is running the gain is between 0 and 1 to compensate for variations
in motor speed. To achieve a symmetrical Motor Drive voltage (UMD) around zero the
integrator UlD corrects the dc part of UMD by giving an offset to the flux integrator UlB (dc
restoring).
Temperature‘Control
Circuit
The sense thermistor of the transducer is part of a resistance bridge and its differential voltage
is amplified by UlA and then Analog to Digital converted by U4. The microcomputer U2 uses
an algorithm to filter the temperature data and provide a pulse width modulated signal at
P21. Q4 and associated components make a flyback converter to provide a dc voltage to the
heater thermistor in the transducer. The thermistor is only supplied with power when the
motor runs. While the correct transducer operating temperature is being reached the message
sensor warm up appears on the display.
l-50
Theory Of Operation
Faltblatt
von alte Seite l-35 hier einfiigen
Figure 1-15. 14360A Sensor, Mechanical Diagram
Theory Of Operation
1-51
l-52
Theory Of Operation
Preamplifier
The preamplifier U8A converts the incoming signal current from the biased photoresistor
detector to obtain the CO:! voltage signal. U8B and U15 build a variable gain stage
to generate enough dynamic range for the A to D conversion. U15 is contolled by the
microprocessor U13. Microcomputer U2 derives an auto zero (AZ) signal from the incoming
motorphase. During this zero signal the output of U8 will be integrated by U9 and output U9
controls the current source made up by QS, Q9 and QlO which in turn loads capacitor C6 to
a voltage that gives the correct current (93 uA) to the photoresistor detector. This current
source is supplied by 80 V derived by the circuit around Tl.
Analog to Digital Conversion
The values of the four samples, VR , VH, VS and VZ are measured by a dual slope
integrating technique.
Comparator Ull detects the zero crossing of the (integrating) slopes. This information is used
by the internal timer of the microprocessor U13 to determine the relative value of the four
samples.
This A/D converter is also used to measure the analog 02 voltage from the 02 board by
switching S2 and S3 of U16.
Digital Circuits
The digital part of the CO2 parameter board builds a UP system which consists of
microprocessor U13, 16K EPROM U28, 2K RAM U26, NOVRAM U27, address decoder U25,
input latch U23 and shared memory buffers U20, U21 and U22. The clock U32, counter U29
and the shift registers U30 and U31 are used to provide the necessary clock and timing signals
for the UP U13. The input latch U23 reads slotcode SCO, SC1 and SC2, the powerfail signal
(PF), 20 ms clock, option switches (SlA for kPa or mmHg and SlB for respiration from COZ)
and by Xl Calstick position (out or in).
*Trend capability:
The trend times and display update times are listed below
Trend Time
Update Time
20 min
60 min
3.1 s
9.4 s
2h
4h
18.7 s
37.4 s
8h
24h
1.25 min
3.74 min
Theory Of Operation
1-53
Oxygen Board 78354-66541 and 78356-66541
General Principle of Operation
The 02 transducer measures oxygen concentrations
the polarographic principle.
in ambient or inspired air, operating on
Preamplifier Circuit
A battery on the 02 parameter board supplies a reference voltage to the anode of the
transducer which, after a warm-up time, causes the transducer to produce current when it is
exposed to oxygen.
The current flows from the transducer to the 02 parameter board (78354-66541 or
78356-66541), w h ere it is amplified and converted to a voltage. This 02 signal is transferred to
the non-floating part of the 02 board by modulator U5, transformer Tl and demodulator U4.
After this signal has been filtered by R8 and Cl it passes to the the CO2 board (78354-66540
or 78356-66540), w h ere it is A/D converted and transmitted to the instrument shared
memory. The Oxygen value is displayed on the screen as a percentage.
1-54
Theory Of Operation
Faltblatt
von alte Seite l-37 hier einfiigen
Figure 1-16. C02/02 Board Block Diagram
Theory Of Operation
l-55
. . . . ..
l-56
Theory Of Operation
Temp/Pleth/Aux
Board 78353-66552 and 78354-66552
Pleth Floating Input Circuit
The Pleth input signal is applied, via diode clamp protection, to the Pleth pre-amplifier (UlA,
UlC) which is an active-feedback amplifier giving a band-pass characteristic. The signal is
then used in modulator (UlB, Ql), which provides a current directly proportional to the input
Pleth signal. This current is detected on the grounded side of the transformer (Tl) by means
of a sensing resistor. The transformer also provides the power to drive a constant-current
source (U36, U3, Q2) which supplies the lamp.
Test Function Generator
The frequency at the transformer is normally 250 kHz, but for test purposes a 125 kHz
frequency is applied. This stimulates the test generator to output a square wave of 101.7 bpm,
which is input as a test signal to the Pleth preamplifier.
INOP Detection Circuit
If the Pleth transducer is not connected the instrument can not operate. When the transducer
is disconnected the current to the lamp does not flow. This is detected as a change in load by
the INOP detector U18 with 78353-66552 board (U8 with 78354-66552), which generates an
INOP signal. From latch U21 this signal is transferred to the digital Pleth circuits.
Pleth Sensor Circuit
The signal detected across the sensing resistor in the grounded section is demodulated by
the Pleth Sensor and passed through a bandpass filter (UlO). The signal is then routed via
a selector switch (U15) to the A/D conversion stage. The signal is A/D converted by DAC
U16 (12 bit) and comparator U17 on the basis of successive approximation. This same A/D
conversion stage is also used for Temperature and Auxiliary signals.
Temperature Floating Input Circuit
The temperature measurement is based on the change in resistance of the transducer with
changing temperature. This resistance is transformed across T2 to the grounded section.
Two reference values (representing 40°C and 25°C) are also available at the input stage
for calibration checks, which are carried out periodically by the microprocessor. The
microprocessor checks for offset and drift errors, and removes the necessity for on-board
adjustments.
Temperature Grounded Circuit
The resistance transformed across from the floating section provides damping for the resonant
circuit (Tl, C26, R63). As the amount of damping changes with temperature, the voltage
across the resonant circuit also changes. This voltage signal is routed via a driver stage to a
full wave rectifier and filter. The output is a dc level proportional to the input temperature
signal. This dc signal is offset to make optimum use of the temperature range and then routed
to the A/D conversion stage via selector switch U15.
Theory Of Operation
1-57
Aux Input Circuit
The Aux parameter signal is routed, via selector switch U13, to the Aux buffer. This selector
switch can also give a zero signal for calibration purposes and allows software recognition of
the parameter cable which is connected, by identifying the particular series resistor in that
cable. The output signal from the detection circuit is then fed, via selector switch U15, to the
A/D conversion stage.
Digital Circuits
The A/D converted parameter information is processed by the microprocessor U27 in the
digital circuit and the results passed to the shared memory on the Display microprocessor
board. The digital circuits also processes information from the shared memory.
Temp/Pleth/Aux Parameter Software
The software contains the following modules:
Pleth:
Autofix gain
q Manual gain
q Peak finding
q Heart rate processing
q INOP detection
q Trend (78354-66552 BD)
w Temp:
q Calibration checks
q INOP detection
n Aux:
q Auto zero
q Parameter identification
0 Scaling
n
q
The PAT parameter software is contained in one 16K x 8EPROM (U28).
TREND: 8K x 8 RAM (U32) loaded. NO TREND: 2K x 8 RAM (U32) loaded. Trend times
are as follows:
‘&end
1-58 Theory Of Operation
Time
Update
Time
20 min
60 min
3.1 s
9.4 s
2h
4h
8h
24 h
18.7 s
37.4 s
1.25 min
3.74 min
Faltblatt von alte Seite l-39 hier einfiigen
Figure 1-17. Temp/Pleth/Aux Board Block Diagram
Theory Of Operation
1-59
Temperature Board 78832-66552 and 78834-66552
The temperature measurement is based on the change in resistance of the transducer with
changing temperature. This signal, in the form of a voltage, is rectified and then A/D
converted.
Input Circuits
Two reference resistors and two temperature inputs (in the form of resistances) are available
at the input section of the board. The microprocessor, through relays (K1,2,3) and transistor
switches (U7), controls which of the resistances is transformed across Tl to the next stage.
The two reference values (representing 40°C and 25OC) are used for periodic calibration checks
when the microprocessor checks for offset and drift errors.
Signal Rectification
and A/D Conversion
The resistance transformed across Tl provides damping for the resonant circuit (Tl, Cl). The
excitation frequency for the resonant circuit is supplied via frequently divider U3 and amplifier
U4. The voltage across the resonant circuit changes, as the amount of damping changes,
with temperature. This voltage signal is half-wave rectified (Ul) giving an output dc level
proportional to the input temperature signal. This signal is then dual slope A/D converted
(U8) and goes to the respiration board digital circuits.
Digital Circuits
The A/D converted temperature information is processed by the microprocessor U13 in the
digital circuits and the results passed to the shared memory on the display microprocessor
board.
Temperature Parameter Software
The software controls hardware functions (relays, switches etc.) and A/D conversion.
Software also checks calibration using the reference resistors and detects INOP conditions.
l-80
Theory Of Operation
Blatt von alte Seite 1-41 verkleinern und horizontal hier einfiigen
Figure 1-18. Temperature Board Block Diagram
Theory Of Operation
l-81
1-62 Theory Of Operation
Dual Temperature Board 78353-66554 and 78354-66554
The temperature measurement is based on the change in resistance of the transducer with
changing temperature. This signal, in the form of a voltage, is rectified and then A/D
converted.
Input Circuits
Two reference resistors and two temperature inputs (in the form of resistances) are available
at the input section of the board. The microprocessor, through relays (Kl, 2, 3) and transistor
switches (Ql, 2, 3), controls which of the reiistances is transformed across Tl to the next
stage. The two reference values (representing 40°C and 25°C) are used for periodic calibration
checks when the microprocessor checks for offset and drift errors.
Signal Rectification
and A/D Conversion
The resistance transformed across Tl provides damping for the resonant circuit (Tl, C3).
The excitation frequency for the resonant circuit is supplied via frequency divider UlO and
amplifier U5. The voltage across the resonant circuit changes, as the amount of damping
changes, with temperature. This voltage signal is full-wave rectified (U6) giving an output dc
level proportional to the input temperature signal. This signal is then A/D converted and
goes to the digital circuits.
Digital Circuits
The A/D converted temperature information is processed by the microprocessor U27 in the
digital circuits and the results passed to the shared memory on the display microprocessor
board.
Temperature Parameter Software
The software controls hardware functions (relays, switches etc.) and A/D conversion.
Software also checks calibration using the reference resistors and detects INOP conditions.
n
n
Board 78353-66554 contains 1K x 8 RAM and 8K x 8 EPROM
Board 78354-66554 contains 2K x 8 RAM and 8K x 8 EPROM
Theory Of Operation
1-63
Trend: Board 78354-66554 has trend capability. The trend times and display update times for
single and dual temperature are shown in table.
Trend
Time
20 min
60 min
2h
4h
8h
24 h
Note
I
I(cT
Update
Time
Update
Time
Tl
T2
Single Temp
3.6 s
3.1 s
10.7 s
24.9 s
1.25 min
21.4 s
42.7 s
1.42 min
2.5 min
5.0 min
10.0 min
4.27 min
30.0 min
9.4 s
18.7 s
37.4 s
1.25 min
3.74 min
Single temperature - each data sample requires 1 point of screen, Dual
temperature - T2 is updated every eighth point with respect to Tl.
1-64 Theory Of Operation
Blatt von alte Seite l-43 verkleinern und horizontal hier einfiigen
Figure 1-19. Dual Temperature Board Block Diagram
Theory Of Operation
l-85
1-66 Theory Of Operation
Respiration Board 78832-66562
The changing impedance, during respiration, between two ECG electrodes (RL & LL) is
measured and the signal processed to give a high resolution respiration signal output.
Input Circuits
The voltage across the two leads is transferred to the grounded section across transformer
Tl. In the grounded section the transformer forms part of a bridge network to which a 62.5
kHz sinusoidal signal is applied. This signal is derived from a 1 MHz square wave, which
is first divided (Ul) and then filtered to give an approximate sine shape at 62.5 kHz. The
changing voltage across the bridge, which is proportional to the changing impedance across
the electrodes, is input to the differential voltage amplifier (Q2, 3, 4, 5). The differential
signal is then rectified using a synchronous demodulator (U4). The output signal from the
demodulator is integrated (U5) and filtered to remove the excitation frequency and give a dc
respiration signal.
INOP Detection
This respiration signal is applied to a clamping amplifier (UlO) to limit the voltage to the
0 - 2 V range necessary for the analog to digital (A/D) converter. Together with a voltage
derived from the input of the synchronous demodulator, this absolute value of the respiration
signal is used to check whether an INOP condition exists (patient impedance > 2 kohms or
patient cable disconnected).
Respiration Wave Signal Circuits
The dc respiration signal is also applied to the summing point (R30, R31). Amplifiers U9 and
U6 form a feedback compensation loop and when the analog switch (Q7, 8, 9) is closed, the
feedback loop works to bring the summing point to zero. When the analog switch is open, the
voltage at the output of the integrator (U6) is fixed. The clamping amplifier (Ull) has a gain
of 33 and provides the input to the A/D converter. Ull also clamps the signal to the 0 to 2 V
range.
Feedback Loop Operation
As an example, assume that the voltage at the output of U8 is +3 V (i.e. 1.5 kohm patient
impedance). In this case the voltage at the output of integrator U6 is -3 V and at the
summing point 0 V (see Figure l-20). The resulting range for the A/D converter via Ull is
from 1500-10 ohms to 1500-l-10 ohms. If the input impedance (i.e. patient impedance) exceeds
1500+10 ohms the microprocessor closes the analog switch (via FET driver) for approximately
3 ms. During this time the feedback loop via U9 and R40 is closed. This results in a fast
change of the integrator output voltage until the voltage at the summing point is zero. This
process takes approximately lms (see Figure 1-21).
The microprocessor now opens the analog switch and the voltage at the integrator output is
again fixed. The new range in the example (Figure l-22) is 1510-10 ohms to 1510-l-10 ohms.
Theory Of Operation
1-67
Note
All values are only used as examples and are not actual values.
3
A/D Conversion
The A/D converter has eight input channels, two of which are internally connected to the
reference voltage and the input ground pin. The microprocessor controls the A/D converter
via the ramp start pin (RS) and the address pins AO, Al, A2. If the RS pin is low the
capacitor Cl5 is charged to the voltage at the selected input channel. If the RS pin goes high,
Cl5 is discharged via a constant current source in the A/D converter. The output of the A/D
converter is a pulse-width-modulated signal, where the pulse-width is proportional to the
input voltage.
A. Initial conditions
CLAMPING ‘
AMPL\FIER -
.I
+p&Lg
AMPLIFIER+
u9
Figure l-20. Feedback Loop Operation - Stage 1
B. Patient impedence increases to 1.5 kohm +lO
CLAMPING
AMPL!!IER .I
-,”
INTEGRATOR+U6
,g.N.&L~~
AMPLIFIER
u9
Figure 1-21. Feedback Loop Operation - Stage 2
C. Summing point again at zero volts
Figure l-22. Feedback Loop Operation - Stage 3
1-68 Theory Of Operation
Test Signals
Test signals Tl and T2 are applied to switch U2, bringing to ground one or both points across
which the differential voltage is measured. The combinations of test signals and functions are
shown in Table l-l.
Table l-l. Test Signals and Results
Key: 0 = CMOS low level, 1 = CMOS high level
Digital Circuits
The A/D converted respiration and INOP signals are processed by the microprocessor
(U13) in the digital circuits and the results are passed to the shared memory on the display
microprocessor board (A2). The digital circuits also process information from the shared
memory for use in the respiration parameter board.
Channel 1 of timer U16 is reset regularly during normal operation by a pulse from the
microprocessor, forming a watchdog function. If the microprocessor is not working correctly
it will not reset the timer. The timer then overflows and causes a hard reset of the
microprocessor. The program makes an internal check and then begins a warm start to
recover from the failure.
Respiration Parameter Software
The respiration parameter software has the following functions:
Control Hardware functions and ADC
w Prepare ADC-reading for display
w Respiration Trigger
n Derive Alarm conditions
n Evaluate Trends
n Communicate with shared memory
n Internal Selftest
n Trend
n
Theory Of Operation
1-69
Trend times are shown below:
* Trend
Time
2 min
l-70
Theory Of Operation
Update
Time
78353B/44
-
20 min
60 min
3.1 s
9.4 s
2h
4h
8h
24 h
18.7 s
37.4 s
1.25 min
3.75 min
Faltblatt
von alte Seite 1-47 hier einfiigen
Figure l-23. Respiration Board Block Diagram
Theory Of Operation
1-71
1-72 Theory Of Operation
Transcutaneous
Partial CO2 and 02 Board 78834-66572
The tcpC02/tcp02
(transcutaneous partial) pressure parameter board A72 is used in
conjunction with transducers 15204A and 15205A on neonatal instruments 78833A and
78834A. It can process signals from either the 15204A tcpOz transducer or the 15205A
tcpCOz transducer. With certain monitor configurations (78834A neonatal monitor) it is
possible to have two of these parameter boards in the same instrument which enables the
simultaneous measurement of tcpCO2 and tcpOz.
Barometer board 78834-66573 provides the transcutaneous parameter boards with
atmospheric pressure information for calibration purposes and is secured to the parameter
board with clips. Only one barometer board is necessary even if the Monitor is configured to
monitor both tcpC0, and tcp02.
The floating and non-floating circuits of the board are separated by opto-couplers and a
transformer.
Transducer Recognition
The 15204A and 15205A transducers each have a coding resistor which enables the Monitor
to recognize whether a CO2 or 02 transducer is connected. The coding resistor forms part of
a voltage divider and the resulting voltage produced when the transducer is connected to an
instrument is fed to channel 8 of the analog mutiplexer U520.
tcpC02 Input
+12 V, -12 V are fed from the parameter board to the 15205A tcpC0, transducer for the
internal amplifier supply. The tcpC02 input amplifier U5OlC amplifies the output voltage
from the amplifier situated inside the 15205A tcpCOz transducer. The output of U5OlC is fed
to channel 3 of multiplexer U520.
tcp02 Input
The tcp02 input amplifiers U502 and U501D converts the current produced by the 15204A
tcpOz transducer into an analog voltage which is fed to channel 4 of analog multiplexer U520.
L
Polarization Voltage
The 15204A tcpOz transducer requires a polarization voltage for operation. This polarization
voltage of -745 mV is fed to the cathode of the transducer, and is also required when the
monitor is switched off and the transducer is still connected, allowing it to remain polarized
and ready for use. This polarization voltage produced by the 2.5 V dc supply and associated
circuitry is backed up by a rechargeable battery BT501. The output of the battery is fed to
channel 7 of multiplexer U520 for monitoring the battery voltage.
Theory Of Operation
1-73
Heater Circuit
Both the 15204A and 15205A transducers contain a heating coil. When in operation the
heating coil heats up the patients skin to enhance the diffusion of gases through the skin.
The temperature of the skin and therefore of the heating coils must be carefully kept within
specified limits of the selected temperature (heating coil temperature can be selected using
softkeys; choice of 37°C or in the range 42OC to 45OC in steps of 1/2OC).
The microprocessor U6 provides a pulse width modulated heat signal which is transferred
from the non-floating to the floating circuits via opto-coupler U23. The heating coil circuit
U510B produces a dc heating voltage which is fed to the heating coil. This signal is also used
for the synchronisation of data transfer.
Temperature Control
Transducers 15204A and 15205A each have two internal thermistors which form part of a
bridge circuit. Tl thermistor with U504 and associated components and T2 with U505 with
associated components. The output of the thermistor bridges are fed to channel 5 and channel
6 of multiplexer U520. This information is used by the UP to feedback the required pulse
width modulated signal to maintain the selected temperature. Two comparators U506A and
U506B monitor the output of Tl bridge U504. If upper or lower specified temperature limits
are outside the defined temperature limits the comparators switch off the heating coil (this is
for patient safety).
Analog Multiplexer
The analog multiplexer U510 has eight analog inputs;
n Channel
w Channel
n Channel
n Channel
n Channel
n Channel
n Channel
w Channel
12345678-
floating ground
t2.5 V reference voltage
tcpCO2 input
tcpOz input
Temp input Tl
Temp input T2
Battery voltage
Transducer recognition
The multiplexer is controlled by counter U519. The output of the multiplexer is clamped
between + and -3.2 V by diodes CR505 and CR506. Thisoutput is then given an offset by
U508B to produce only positive voltages. These analog voltages are then fed, in sequence, to
the analog pulse width conversion circuit U508A and U509.
1-74 Theory Of Operation
Analog to Pulse Width Conversion
The analog to pulse width conversion operates as follows:
On the rising edge of the incoming heating pulse the output of flip-flop U523B is set high and
switch S (CR 508) is opened. This starts the integration of flV input of the integrator. The
integrator output increases until the VA analog input voltage has been reached. At this time
the comparator U509A resets the flip-flop U523B, so the output goes low and the switch S is
closed to reset the integrator. The output Q of flip-flop U509A is therefore the pulse width
modulated signal
Y-----20ms ,-I
I
The integrator output increases until the VA analog input voltage level has been reached, and
the integrator is reset (Sl closed *) The output of comparator U509A is therefore the pulse
Theory Of Operation
1-75
width modulated signal having widths tx, ty . . . and is proportional
voltages.
to the incoming analog
The 8 bit pulse width modulated signals, corresponding to the 8 analog voltages at
multiplexer U520, and a 9th synchronization pulse is transmitted serially and represents a
measurement cycle every 180 ms.
Heat
Pulse
l-l ---
-l--L
- - -----
cc
GND
FIEF
pco2
~02
Tl
T2
Batt
Sensor
Each pulse width signal is proportional to the input signals to multiplexer U520. The pulse
width modulated signals are then measured and the resulting information is processed by UP
U6.
Repolarization
The 15204A tcp0z transducer can be electrically cleaned by repolarization. The UP U6
initiates, via softkey, a repolarization signal which is routed from the non-floating to floating
circuit of the parameter board through relay Kl. The repolarization signal reverses the
polarization voltage applied to the 15204A tcp0z sensor’s cathode and electrically removes
deposits.
Floating Power Supply
The floating power supply consists of an alternator on the non-floating section of the
parameter board (Tl, T2, Ql, &2), T2 transforms the dc voltage from the non-floating to the
floating section of the board. On the floating side 7 different dc voltages are produced: +12
V, -12 V, LV+, LV-, i-5 V, j-2.5 Vref. and +l Vref.
Digital Circuits
The pulse width modulated signals received by the UP U6 are processed by the firmware
(EPROM US) and the results are passed onto the monitors shared memory on the display UP
board A2. Ul,U2 and U3 are buffers for communication with the shared memory.
Clock
The 16 MHz clock U12 and divider circuit UlO produce a 4 MHz clock frequency for the 6303
UP system and a 250 kHz frequency for driving the floating power supply circuit.
1-76 Theory Of Operation
Watchdog Circuit
Watchdog circuit provides reset information
system for more than 400 ms.
to the UP, if an error condition is present in the
EAROM
The additional EAROM in the digital circuits is used to store offset voltages of the floating
hardware.
Barometer Board Information
The 8 bit data word from the Barometer board latch (Ul on A73) is fed directly onto the data
bus. Bits BO (feedback for successive approximately A/D conversion on the barometer board)
and BI (barometer board recognition) are interfaced to the data bus via buffer U15.
*Trend capability:
The trend times and display update times are listed below
Trend
time
2
2 min
min
20 min
60 min
Update
Time
3.1 s
9.4 s
2h
18.7 s
4h
8h
24 h
37.4 s
1.25 min
3.74 min
Theory Of Operation
1-77
Parameter Software
The tcpOa/CO, software can be divided into 2 main blocks. These consist of the main
program that takes care of processing tcpOz/tcpCOz values and an interrupt program which
looks after timing tasks such as A/D conversion, temperature control of the sensors and
communication with the shared memory. Communication with the shared memory takes place
every 20 ms.
Software Block Diagram
Power On
I
I
------------Test
I
Routines
I
I Initialize
Routines
I
I ------------I
I
I Background
I
I
I
I
I
task
Control
Interrupt
I
I
I
l
I
I --- I
I
I
l---l
I
Key
Processing
I
1 Task
I________
I
I
Error
Processing
I
I
I Control
--------------------
--------------
--------------
Alarm
Processing
I
Transducer
Recognition
I ---I
-------------I
I
I po2
---I
Processing
I
I
I
I PC02
Processing
I ---I
-------------I
I Heating,
I
Power
I ---I
I Processing
I
I
I
I
I
I
--------------
I Barometer,
I
Pressure
I ---I
I Processing
-------------I
I
Trend
I
Processing
I ---I
I
I
I
I
I
I
-------------
1-78 Theory Of Operation
I
I
--------------
--------------
I
I
---------
-------------l
I
(20ms)
-----------me-
I
I
I
I
I
I
I
I
I
I
I
I
t
I A/D
I Conversion
----- -------
I
l-----l
I Temperature I
I Control
I ---------------I Shared
I
I----I Memory
I Communicat . I
------------
I
I
I
I
I
I
I
I
l
I
Faltblatt von alte Seite l-53 hier einfiigen
Figure l-24. TcpC02/02
Board Block Diagram
Theory Of Operation
1-79
Barometer Board 78834-66573
The Barometer Board (78834-66573) is secured and electrically connected to the tcpC0z/02
board and supplies atmospheric pressure information, via connection Xl, to this tcpCOz/Oz
board. Atmospheric pressure (room air pressure) is measured for calibration purposes.
Circuit Operation
The barometer board consists of a pressure transducer U7 (bridge network) and appropriate
circuit to provide the microprocessor U6 on the transcutaneous gas parameter board with an
8 bit digital word proportional to the barometric pressure. The temperature compensated
pressure transducer elements are arranged in a bridge circuit and powered by a dc voltage
supply of 10.0 V generated by U5A and U6. Leg 2 of the bridge circuit is held at zero by zero
driver U6 and barometer adjustment is made via potentiometer Rll. The pressure output
signal is amplified at U4 and its voltage output, which is proportional to the atmospheric
pressure, is fed to the feedback input of digital to analog converter U2.
The analog output of U2 is input to Schmitt trigger circuit U3 and this in turn is output (BO)
to the microprocessor on the tcpCOz/Oz parameter board, A72.
U2 is an 8 bit DAC which is used as an analog to digital converter via successive
approximation as follows:
The microprocessor U6 initiates an 8 bit digital signal equal to l/2 of the full scale output of
U2 and the analog signal produced by U2 is internally compared with the feedback voltage
from U4. The comparator (U3) switches depending on whether the feedback voltage is higher
or lower than the initial l/2 fullscale first guess value. On the basis of this, output BO is fed
back to the microprocessor U6 and the most significant bit of the 8 bit word is set High or
Low. The same then occurs for the next bit, bit 2, and this continues until 8 comparisons
have been made. The digital signal then present at the input of Ul and therefore at the input
of U2, is equal to the digitized voltage value from output of U4.
i-5 V, +12 V and -12 V are also fed from the parameter board to the barometer via connector
Xl.
A -4 Vref. signal is fed from the mother board via the parameter board where it is required
for A/D conversion, DAC U2 and generation of the transducer bridge voltage at U5A.
The barometric range is between 500 mmHg and 800 mmHg pressure which is equal to a
signal output at U4 of between 0.04 mV and 38.71 mV.
l-80
Theory Of Operation
Blatt von alte Seite l-55 hier einfiigen
Figure l-25. Barometer Board Block Diagram
Theory Of Operation
1-61
.... .... ...
1-82 Theory Of Operation
Oxygen Saturation/Pleth
(SPO2) Board 78354-66510/520
The Oxygen saturation/pleth (SpOz) parameter is based upon the principle of Pulseoximetry,
whereby arterial bloodflow through tissue is detected optically. An adaptor holds two LEDs
emitting red and infra-red light respectively, against one side of the patient’s finger, nose or
toe. Against the other side it holds a photodiode. The device is able to register small changes
in the conductivity of light through the finger, in response to patient pulse. By isolating the
pulsatile component of the signal, the SpO, board eliminates the effects of absorption from
tissue, bone and venous blood.
The more heavily blood is oxygenated, the brighter red it becomes. Hence an algorithm
comparing the conductivity of red and infra-red light, thereby measuring the colour of the
blood, can also offer an indication of oxygen saturation.
The SpOs board is divided into two distinct areas - floating and grounded. These are
connected by two high voltage optocouplers for data transfer, together with the power
transformer for power transfer.
Floating Section
The sampling of signals from the photo-diode is in four discrete phases.
a. Dark Phase. Neither red nor infra-red LEDs are lit. Only ambient light is measured.
b. Red Phase. The red LED is lit, and the conductivity
measured.
of the light through the finger
c. Infra-Red Phase. The infra-red LED is lit, and conductivity
d. Pleth Phase. Infra-red LED is lit and conductivity
measured.
measured.
Consecutive frames composed of these four phases are repeated 375 times per second. Both
the lighting of the LEDs and the sampling of the signal from the photo-diode is sequenced by
a time multiplexor governed by the microprocessor. In perfect conditions, (i.e. no noise and
constant ambient light), the signal from the photo-diode may be represented thus:
,_...-.’
.,........_.....
_,(,....... . . ...-
‘.‘....._,__.,,,
----a “........
“....,, . .. . .. ..._..........”
..
7
lab
c
d3-bc
dab
cdTb
cd
Diagram not to scale
Theory Of Operation
1-83
Notice how the line joining (d) readings indicates the (amplitude modulated) plethysmograph
wave.
The function of the floating section of the board is two fold:
a. To enable accurate reading of light conductivity
ambient light in the pulse train.
by removing noise and compensating for
b. To drive the two LEDs.
ESU Rejection
Two 4KHz low pass filters contained in U102 and U104A remove frequencies produced by
Electra Surgery Units.
Ambient Light Rejection
High pass filter U104A rejects ambient light.
Amplification
The output stream from the photodiode is amplified at various points:
a. Amplifier in U104A, which converts current to voltage.
b. Variable amplifier in U104A. This is software controlled and monitored by comparator
U 111, which checks for wave clipping.
c. Amplifier contained in U104A. The pulse train is also shifted here such that the signal
becomes symetrical to zero.
Compensation for Ambient Light
The series of switched low pass filters (LP RED, LP INFRA and LP PLETH) are used
together with the capacitor labelled “DARK” to separate the four phases within each frame of
the pulse train and compensate for the effects of ambient light. The sequence of operation is
software controlled and takes place as follows:
a. Dark Phase
Switch governing capacitor “Dark” is closed. Switches governing LP RED, LP INFRA and
PLETH are open. Capacitor “DARK” is charged by the pulse resulting from the ambient
light reading.
b. Red Phase
Switch governing LP RED is closed. All others are open. Capacitor LP RED is charged
by the pulse resulting from the red LED reading. The pulse received by amplifier A2 is
equivalent to the value of (ambient light + red light) minus (ambient light).
c. I&a-Red Phase
As (b) above, but using capacitor LP INFRA.
d. Pleth Phase
As (b) above, but using capacitor LP PLETH.
The second series of low pass filters following amplifier A2 is used for further noise rejection,
1-84 Theory Of Operation
The Transducer
As well as the connections to the transducer relating to the LEDs and photo-diode, two more
wires are used to check the transducer itself. These are connected to resistor R2 (within the
transducer), and enable monitoring to show:
a. That the transducer is properly connected.
b. What type the transducer is.
Multiplexer
Resistor Rl, together with the four phase output train from the photo-diode, are time
multiplexed by U107, which in turn is driven by the micro-processor UP.
LEDs
The LEDs are driven by controlled current source U121. Two demands must be met:
a. LEDs must be lit in their correct sequence, to produce the four phases of the pulse frame.
b. LEDs must be lit to an ideal intensity. This is dependent upon the light absorption of the
patient’s finger.
The pulse train from multiplexor U107 is converted into a digital signal by the software in
microprocessor U212 U204. A process of successive approximation is used, in conjunction with
DAC U153 and comparator U152.
DAC U120 controls the LED driver U121, using positive and negative analog pulses of
O-125 mA, thereby triggering it to light red and infra-red LEDs respectively. This produces
the required pulse train. The intensity of illumination is determined by the current of this
triggering pulse.
Notice that the link to the opto-couplers is taken from the microprocessor.
Selftest
Selftesting is achieved by closing the two switches
disconnecting the transducer signal, and replacing
controlled current source used to drive the LEDs.
frontend circuit, by measuring ranges and gain of
marked “Selftest”. This has the effect of
it with an input taken directly from the
Software can then check almost all of the
the signal received.
Theory Of Operation
1-85
Grounded Section
The grounded section of the SpO, board is completely digital. It is essentially a dedicated
microcomputer, and amongst other tasks, performs the following:
a. Calculation of the SpO, saturation percentage.
b. Control of the user-determined alarms.
c. Control of the “INOP”
alarms.
d. Establishment of automatic magnitude (wave display).
e. Calculations concerned with trending.
Since the layout of this section will be familiar to most readers, only a few comments on
unusual features will be made.
Input is via the two opto-couplers, U201 and U202, shared with the floating section of the
board.
Switch S301 is the dip-switch used to configure the software (see Volume II)
EPROM U303 holds the software and RAM U304 provides a working area.
Clock U314, together with dividers U310 and U311 provide clock pulses to the microprocessor
and the (switched mode) floating power supply.
The SpOz board has access to the motherboard during a 2 ms time slot within a 20 ms frame.
This is controlled by the interrupt line from the motherboard. Buffers U305, U306 and U307
provide access to the main Address and Data buses, and hence to the shared memory. There
is no Control bus as such, but a read/write line is included in the Address Bus.
1-88 Theory Of Operation
Fdtblatt
von alte Seite 1-59 hier einfiigen
Figure l-26. Sp02 Board Block Diagram
Theory Of Operation
1-87
. . .. .. .. . ..
l-88
Theory Of Operation
780 System Interface (Non-Annotating)
78353-66590
The system board provides the system and alarm interface to 780 systems. The board
provides the following functions:
1. System control signals:
a.
b.
c.
d.
e.
INOP
Alarm reset
Alarm on/off
Patient alarm
Recorder run
2. Heart rate:
a. Beat-to-beat or average
3. ECG or repiration wave
Input Circuits
Buffers Ul, U2 and U3 provide the TTL to CMOS interface to the system board. The control
signals needed to the system board are decoded from the shared memory during the write
cycle, using a 8K X 8 EPROM (U16). When the desired address appears on the bus a control
signal is generated at the output of the EPROM, which causes the corresponding data to be
latched in U4, U9, U12 and U15. Mutiplexer U14 selects either beat-to-beat heart rate for
neonatal applications, or average heart rate for adult applications (programmed by switch
setting).
Beat-to-beat Heart Rate
In the case of beat-to-beat heart rate the information is latched into U12. The information is
then subsequently moved to U13 and then converted into an analog output by D/A converter
U8 and opamp U7.
Average Heart Rate
Average heart rate information is presented in g-bit-format, a lower and an upper byte. When
the lower byte arrives it is latched into U12. When the upper byte arrives bit 9 is latched into
U15 and the lower byte is shifted into U13 so that the D/A converter sees 9 bits at once.
These are then converted as described above.
Theory Of Operation
1-89
System Control Signals
The system control signals are present in shared memory as a status byte.
Status byte
recorder run = high
alarm on = high
alarm reset = high
not used = high
emergency alarm = high
patient alarm = high
INOP = high
The status byte is latched in U9. INOP, alarm on/off and reset are open collector outputs
with U,,,= 30 V and I,,,=
30 mA.
No alarm reset = open collector Alarm reset = 0 V
ECG Wave
The analog ECG wave comes to the system board from the mother board. U5 and associated
components switch the gain of this wave in such a way that the analog wave appearing at
the output of U6 is approximately the same size as the display wave. The gain factor is also
present in shared memory and is latched by U4.
Respiration Wave
In units with respiration parameter, it is possible by changing the switch settings to have
the respiration wave at the output instead of the ECG wave. This signal requires no further
processing and passes via buffer amplifier U6B to the output.
l-90
Theory Of Operation
Blatt von alte Seite 1-61 verkleinern und horizontal hier einfiigen
Figure l-27. 780 System Board (Non-Annotating) Block Diagram
Theory Of Operation
1-91
780 Interface Board (Annotating)
78353-66592
The system board takes parameter and alarm information from the shared memory and
processes this information to provide output signals at the system output connector.
Digital Circuits
Parameter and alarm information in digital form from the shared memory is processed by the
microprocessor (Ul) in the digital circuits before D/A conversion (U25j U28). The watchdog
timer (U17, U19) consists of a counter which has a 20 ms input and is reset regularly during
normal operation by a pulse from the microprocessor. When the microprocessor is not
working correctly the pulse does not occur and the counter is not reset. In this case the
output of the counter overflows via gate U19 to cause a hard reset to the microprocessor. The
program checks this condition and then begins a warmstart to recover from the failure.
Analog Circuits
In the analog circuits the parameter signals (except ECG (60 Hz) and temperature) are
transferred via a multiplexer (U41) to a row of sample and hold filters. The temperature and
ECG (60 Hz) go directly to two separate, high resolution, sample and hold filters are then
routed to the system output connector. The alarm signal information (alarm on/off, INOP,
patient alarm) is transferred to the analog circuits via latch U12. The signals are filtered in
the alarm interface circuits and then routed to the system output connector. The system
output configurations are shown in Table l-2.
System Board Software
The system 780 board software contains the following modules:
n
n
n
n
Self-test
Offset-correction value storage
Output configuration storage
Signal processing
1-92 Theory Of Operation
Table 1-2. System Output Configurations
J92
pin
no.
Configurations
1
0
1*
2
pleth wave
encoded
deselect
pleth wave
4
encoded
deselect
pleth wave
recorder
data
encoded
alarm
recorder
data
alarm gnd.
6
heart rate average
7
INOP
8
reset
9
patient
tcpcoz
alarm
temp 1.
10
req.
11
A
*II*
tcp0z
recorder
data
encoded
alarm
5
12
6
signal gnd.
3
4
5#
3
ECG wave
analog
1
2
O-6
recorder
return
encoded
INOP
scaled
pressure 2
wave
B
rate
recorder
return
recorder
return
encoded
INOP
absolute
pressure 2
scaled
pressure 2
absolute
pressure 2
scaled
pressure 2
(60)
wave
(60)
wave
scaled
pressure 1
wave
absolute
pressure 1
(366)
Temp.2 ****
tcpcoz
scaled
pressure 1
wave
ECG wave
absolute
pressure 1
wave
C
systolic
pressure 1
absolute
pressure 2
wave
D
diastolic
pressure 1
absolute
pressure 3
wave
E
mean
pressure 2
F
H
S,‘EtOliC
pressure 2
CO2 /resp.
wave
resp.
wave
absolute
pressure 1
wave (300)
CO2
wave
resp .
wave
heart rate
CO2
wave
b-to-b
systolic
pressure 2
scaled
pressure 2
wave
cardio**
respirogram
mode
pleth wave
resp .
wave
Theory Of Operation
1-93
Table 1-2. System Output Configurations (continued)
592
pin
no.
J
1
0
I I
1*
C onfigurations
I
2
I
**
I
4
I
I
I
5s
I
diastolic
pressure 2
Fi 02
absolute
pressure 2
wave (60)
diastolic
pressure 2
***
I
Fi 02
mean
pressure 1
output configuration for CO2 /02 parameter
for cardiorespirogram mode, switch Sl on system board should be open
***
no Aux Wave because it is available as analog signal
****
output configuration not available in German Language Option (PTB)
#
only available in 788Xx series
l-94
6
ALARM ON/
OFF
M
*
I
3
recorder
channel 2
K
L
O-6
I
Theory Of Operation
ET CO2
Faltblatt von alte Seite l-63 hier einfiigen
Figure l-28. 780 System Board (Annotating) Block Diagram
Theory Of Operation
1-95
. . . . . . . . *..
1-96 Theory Of Operation
SDN Board 78353-66595
The SDN (serial distribution
network) board has two prime functions:
1. To receive data from the instrument’s shared memory, process it and make the information
ready for onward transmission to the SDN network.
2. To receive data from the SDN network, process it and transmit it to the shared memory,
where it can be accessed by the instrument.
The SDN board permits interfacing with a Central Station (HP 78508/504/509) and an
Arrhythmia System (HP 78720) via a system communication control (SCC), or via the
SDN Interface in a Central Station. The SDN board also allows communication with other
instruments in the branch. Connection to the SCC is by a single cable connected to the rear
of the instrument.
Microprocessor
Interface Circuit and I/O RAM
Incoming data from the instrument’s shared memory is copied into the I/O RAM (U8, US)
through the buffers (Ull, U12, U13) during the 4ms time interval of the instrument poll cycle.
During the 4 ms dead time of the SDN poll cycle, transmit data already in the I/O RAM is
copied into the SIC buffer RAM (U4, U5). During the rest of the remaining 32 ms SDN poll
cycle time the board’s UP (UlO) can access data in the I/O RAM to decode, process (using
ROMs U19, U31 and EPROM U16) and to load in new transmit data. RAM U21 serves as a
interim store for data being processed by the UP.
System Interface Controller (SIC)
The SIC chip receives serial SDN data from the System Communication Control (SCC). The
SIC uses a 12-bit shift register to convert incoming serial data into 12-bit parallel words to
make it UP readable. This data is then stored sequentially in the SIC buffer RAMS U4, U5
ready for transmission to the UP interface circuit. Instrument data previously received by the
SIC buffer RAM from the I/O RAM is put into serial form by the SIC chip and at the correct
time transmits this data over the SCC into the SDN. The SIC reads, stores and translates
only those messages specified by the board UP.
Data Synchronization
Circuit
The data synchronization circuit (U24) synchronizes the clock input of the SIC with the
incoming data so that it samples accurately the SDN data. The SCC has a 32 ms poll cycle
time to completely sample each of the connected instruments in the branch. The SDN receives
a sync. tap from the SCC and there follows a dead time of 4 ms whilst the SIC communicates
with the UP (and the I/O RAM transmits data to SIC buffer RAM and the converse).
After this time has elapsed information can be transferred between the SDN and the SCC
before the SCC switches to the next instrument. High priority information is sent first (all
wave forms, HR alarms etc). The data synchronization and SDN transceiver circuit (U26,
U28) ensures that all the board’s timings are correct.
Theory Of Operation
1-97
Control Logic
U22 contains the watchdog circuit which includes a counter to interrupt the UP with a reset
signal if the UP fails to reset itself in the normal way. It also contains the decoder circuitry
for the ROMs together with a buffer network between the SIC chip and shared memory
transceiver.
Signature RAM
The signature RAM (U2) is accessed by both the SIC chip and UP. The UP interface circuit
keeps a record of all possible signatures in this RAM to indicate which signatures the SIC chip
should address.
Note
l-99
Instrument internal board frame is 20 ms.
Theory Of Operation
Blatt von alte Seite 1-65 verkleinern und hier einfiigen
Figure l-29. SDN Board Block Diagram
Theory Of Operation
l-99
RS-232C Interface Board 78354-66598
Instruments with RS-232C interfaces allow connection to external devices such as HP 150 PC,
ThinkJet Printer HP 2225D and Digital to Video Interface HP 78355A. Other non HP devices
may be connected but must be compatible.
Monitor
Printer
HP 22250
Port
1
9-G
Port 2
rl
l
mm
General Principle of Operation
The primary functions of the RS 232C interface are;
n
access and sample relevant information in shared memory,
w to process and transmit information at the request of external devices such as HP 78355A
and HP 150 PC (or other PC),
n
on pressing the monitor’s record softkey, the interface processes and transmits data to a
ThinkJet printer.
The RS 232C interface can also drive two devices independently, and configuration can be
changed while the monitor is in operation.
ROM/RAM
ROM (U7) capacity is 24K and RAMS (U9-11) capacity is 32K.
l-100
Theory Of Operation
Counter-timer Circuit
Counter-timer U4 provides the correct timing for data to be read from the instument’s shared
memory (U40 on UP display board A3). U4 detects the 2 ms time slice within the 20 ms
frame slot for the interface board to access shared memory data. Two other counters are used
as clock dividers for generating the baud rates for the serial interface. Baud rate for channel
1 (Port 1) is fixed to 19200. Baud rate for channel 2 (Port 2) can be changed by altering the
switch settings on switch block Sl (Channel 2 Baud rates; 19200, 9600, 2400 and 1200).
Serial Interface
.
The serial interface (U6) combines the following tasks;
n
performs parrallel/serial
conversion
H communicates asynchronous in accordance with ANSI-Standard
n
data format is 8 bit without parity, 1 start,1 stop bit,
n
two independent full duplex channels,
n
communication control via hardware handshake,
n
the following handshake signals are’used:
Cl
0
RS232,
DTR (Data Terminal Ready) output enables the transmitter of the connected device
(interface board is ready to receive),
CTS (Clear To Send) enables the transmitter of the RS 232C interface (external device is
ready to receive) - see cable wiring below:
RS232 interface
external devices
SHLD GND 1 >--I
+---4
a-------- <
TxDy 2
RxDy 3 { -_____-----_-------- -___j
1 SHLD GND
RTSy 4 >-<
CTsy 5 ;-------‘----<
8 DCD
DTRy 20
SGN GND 7
2 TxDy
3 RxDy
5 CTSy
20 DTRy
/
7 SGN GND
Watchdog Circuit
The watchdog timer circuit receives the 20 ms signal as clock input and if the microprocessor
does not reset the watchdog timer in time, the watchdog resets all the components of the RS
232C interface board.
Theory Of Operation
l-101
Blatt von alte Seite l-68 hier einfiigen
Figure l-30. RS232C Block Diagram
l-102
Theory Of Operation
2
Maintenance
Checks
Introduction
Chapters 2a, 2b and 2c provide all the Mainenance Check information required for the 78XxX
Series Patient and Neonatal Monitors. The Maintenance Check chapters cover the following:
Chapter 2a Performance Assurance Checks
Chapter 2b Specification Checks
Chapter 2c Technical Specifications for all Monitors
Maintenance Checks
2-1
2a
Performance
Assurance
Checks
Introduction
This chapter contains performance assurance checks applicable to the 783Xx and 788Xx
series of monitors. Any checks which are valid for only one of the monitors are clearly labelled
with the appropriate monitor number.
General
Performance assurance checks,
is in good operating condition,
significant levels. Performance
repair. When the performance
be scheduled to cover monitors
done from the front panel, verify that the unit is working,
is safe for the staff and patient, and is accurate to clinically
assurance, including safety tests, should be done after every
assurance procedures are used as a periodic check they should
that are not in use, i.e. at unoccupied beds.
For safety tests a safety tester should be used. For ease of use and efficiency the RIGEL
Safety tester, Model 233 is recommended Figure 2a-1. For safety test procedure see operating
instructions of Model used.
Figure 2a-1. Rigel Safety Tester
Performance Assurance Checks
2a-1
Note
If a patient cable is used, additional leakage current will be introduced
because of the cable’s capacitance to ground. The maximum acceptable
leakage current measured at the end of the patient cable is 20 uA while the
specification at the instrument is 10 uA. However, the placement of the
patient cable totally adjacent to a ground plane will increase the capacitance
to ground during the test procedure and may increase the leakage current
beyond the maximum test limit. Since this capacitance to ground is difficult
to control, the test should be performed without a patient cable.
Test equipment
For the performance assurance checks the internal test function is used. The following test
equipment is required:
w Patient simulator (recommended:
Neurodyne Dempsey
Model 211A US
Model 212A Europe)
n
Temperature probe (or resistor)
n
Pressure simulation box (Figure 2a-9) or pressure gauge 14303A
n
Respiration simulation boxes (Figure 2b-10 and Figure 2b-11)
General checks
1. Check power cord and power plug for good mechanical condition.
2. Clean CRT and key panel (see operating guide for cleaning).
3. Open top cover. Inspect all internal cables and connections, and circuit board insertion
into mother board. Look for evidence of overheated or damaged components, or any other
suspicious symptoms.
4. Disconnect all signal inputs to the monitor.
5. Apply power to the monitor, checking for smooth operation of the on/off switch.
6. Close top cover.
Monitor Service lest Mode
Most of the performance assurance checks are done using the internal test function. To enter
service test mode, first leave monitor switched off for 20 s then press keys labelled 2 or
(n)
and JL or (CalMark) simultaneously, and keeping them pressed, switch the monitor
on. As soon as the monitor is switched on, the automatic self-test routine begins. (For a
detailed explanation of the error messages which may appear at this point refer to Volume 2
of the manual, Chapter I). When the test is successfully completed three tones sound, one
after the other (QRS tone, alarm tone and leads off tone).
2a-2
Performance Assurance Checks
The screen display should be as shown below:
These displays are typical and will depend on the monitor Option.
Note
3
If the self-test is successfully completed, and the display is as shown, the software is working
correctly. The following tests check that the keys and controls are fully operational.
Typical Monitor Service Test Mode Displays
78352A/C
78353A/3B/4A/4C
Display
,
1 ALARMS
OFF 1 m
Display
AIARMS SUSPENDED FOR 3 MN
1
Flmn
()
2’
60/O
(30)
Tl
40.0%
piiEwiq
NP
5 MIN
REPEAT
AIARMS
5100-150
T2
2fxPc
Tl
40.0X
~SERVKX TEST
Pl
Opt. no1/4: Alarms Off
Opt. no2: Alarms suspended for 3 min
78832A/3A/3B/4A/4C
FILTER
display
60-160
Pl
8
s
1
100-150
Opt. No1/4: Alarms off
Opt. No2: Alarms suspended for 3 min
I
I
78356A
1 ALARMS
display
OFF 1
100-150
RR
12
Tl
62
25.04;
40.05:
AFwEA>2os
Performance Assurance Checks
2a-3
Display Intensity
With the monitor in service test mode:
Rotate the screwdriver intensity control (on the side of the rear panel) fully
counter-clockwise. The display should be faintly visible.
Rotate the intensity control fully clockwise. The display should now be bright and well
focussed. The retrace should not be visible.
Figure 2a-2. Display Intensity
Check the automatic intensity control by covering the photo resistor for a few seconds. The
display should become less bright.
Figure 2a-3. Position of Photoresistor in A and B monitors
Figure 2a-4. Position of Photoresistor Monitor in ‘V
series monitors
Checks in ECG Setup Mode
With the monitor in test mode, press the ECG setup key to display the “ECG Setup 1”
softkey labels. Now check the following functions:
ECG Gain Press the a
respectively.
and a
keys repeatedly to check the maximum and minimum gain
w Maximum gain of ECG trace: 30 mm/mV
Minimum gain of ECG trace: 3 mm/mV
n
2a-4
Performance Assurance Checks
Filter/Diagnostic Mode Check
1. Check that the top of the pulse of the ECG test waveform slopes as shown on the right
(FILTER mode).
2. Press the softkey labelled FILTER to select DIAG- nostic mode.
3. Check that the top of the pulse is approximately horizontal (squarewave) and that there is
a definite difference from the FILTER mode pulse.
l-L
Filter Diagnostic pulse shapes
Performance Assurance Checks
2a-5
Alarms
a. Press E or [Suspend]key to turn alarm capability on (only necessary if ALARMS
ALARMS OFF FOR 3 MIN message is displayed)
OFF or
b. Press the ALARMS key to access the ECG alarm setup.
c. Decrease the upper alarm limit, using HIGH CT) key, to 95 bpm in 783Xx series (to
120 bpm in 788Xx series). After 10 s an audible alarm should sound and the numerics
should flash alternately in normal and inverse display. The alarm lamps should also flash
alternately (in 788Xx series).
key to silence the alarm. The numerics should now be
d. Press the & or (Silence/Reset)
displayed in inverse display and the alarm lamps stop flashing in the 78XxX series.
e. Turn the alarm capability off using the 8 or (Suspend)The numerics should return to
normal display and an ALARMS OFF or ALARMS OFF FOR 3 MIN message should be
displayed.
f. Return upper alarm limit to previous display.
Parameter Set-up Keys
With the monitor in test mode, press each of the remaining parameter setup keys in
turn to check that the correct display appears. The softkey label displays for pressure,
plethysmograph and respiration are shown in Figure 2a-5
Figure 2a-5. Initial Set-up Displays for Pressure, Pleth and Respiration
This concludes the checks for the keys and controls. The remaining performance checks
concern parameter signal input circuits and calibration procedures.
2a-6
Performance Assurance Checks
Pressure Channel Check and Calibration
The following procedure uses the calibration Gauge 14303A. For these checks it is assumed
that the transducer and pressure gauge are functioning correctly.
a. Connect the gauge as shown in Figure 2-6. Set the stopcock so that the manometer bulb
output is connected to both the gauge and the transducer.
dicporahle
dome
with Linden fittings
Figure 2a-6. Equipment for Pressure Calibration
b. Switch instrument on.
Connect the transducer to the instrument.
d”: Press the pressure setup key then set the scale to 180 mmHg (24 kPa).
e. Vent the transducer to atmosphere by opening the stopcock, and push the Zero button.
Close stopcock.
f. Open the release valve on the manometer bulb and rotate the gauge dial outer ring so that
zero pressure is indicated.
Close the release valve and increase the manometer bulb pressure to 200 mmHg (30 kPa =
225 mmHg).
h. Press CAL MERCURY key. Mercury calibration setup is displayed.
Figure 2a-7. Mercury Calibration Set-up Display
Adjust the pressure value shown in the softkey display (using the CAL MERCURY a
CAL MERCURY QJ key) until it equals the reading on the manometer.
or
Performance Assurance Checks
2a-7
Press the STORE CAL key.
If the pressure value is already correct i.e. does not require adjustment, then
the calibration factor is also correct and is not necessary to press the STORE
CAL key.
Note
!il
Pl
CAL
IJ-L_n
‘::oToR
~stop
pi&-)
~ElEJ#~
-ID=
maI#lolilecold]
Figure 2a-8. Pressure Display after successful Calibration
Alternatively, a resistive simulator for 0 and 200 mmHg functioning on the 40 uV/V
sensitivity range can be built according to Figure 2a-9 The simulation is connected to the
pressure input and provides either a 0 mmHg or 200 mmHg input signal (switch closed and
switch open respectively). This allows both the zeroing procedure and 200 mmHg calibration
to be checked, as in the previous procedure.
f(c)-
27011
5%
SWITCH(3101-1075)
40)
P
II
?Srn
1O/o
1
INPUT
Y1
o(A)-
Figure 2a-9. Resistive Simulator for 0 and 200mmgh
2a-8
Performance Assurance Checks
EXCITATION
Note
When two pressure boards (1 x PRESS and 2 x PRESS) are loaded (in
78354A) they should be in the positions shown below:
A34
a
I
A32
a
C
Slot
B
78354A
A
PI
#A21, #A24
Pi/P2
P2lP3
part of
front
panel
(
c
B
P3
P2
PI
#A22
Pl
CO2 and O2 Calibration and Adjustments
The following procedure describes how to calibrate and make adjustments to the CO:! and
02 parameter boards. Calibration/adjustments
are necessary when the following conditions
apply:
New installation:
n
set correct altitude to allow for variations in atmospheric pressure (for COz only),
Replacing CO2 board:
set correct altitude,
H set Calstik value,
n perform 02 zero,
n
Replacing 02 board:
n
02 zero calibration.
02 Zero Calibration:
1. First enter service test mode by switching off instrument for at least 2Os, then, pressing
softkeys IL or (Mark)
and & or @iGGJGZ) simultaneously,switch on the instrument but
keeping the keys pressed until the three tones are heard.
2. Plug in short circuit plug (PN 78354AK #890, or 78354-47601).
3. Press 02 setup key and display will change.
fi;;.:>;.y-,,,:‘:‘,:“;‘;,
: .,,...:
4. Press ALARMS key until Ii:ALARMS::OFF.::
is indicated on display.
...ZLd
j.> -.,,~.,>...‘:.
5. Press and hold key (normally >5s) labelled cf5, or (Patient)
until display changes to
i~~~,~~~~~~~~~
.,
6. Press L!~&~~$$~~I$!
i/.
;.:..l
.:..
..‘;‘.s.
,<
,.,.,.,..,,
:; ,..:.: key for about 1s. This completes the 02 zero calibration
Press 02 setup key again to return to normal display.
Performance Assurance Checks
2a-9
CO2 Service Setup
1. As in (1) above
4. Press key labelled m or (patient)
adjusted.
until STORE appears
on &splay.
Altitude
can now be
5. Using appropriate keys, adjust altitude reading to the correct value of that instrument’s
particular installation location (i.e height above sea level, adjustment
is made in 100 m
steps).
6.
press
STORE
key
for
about
1s
until
display
returns
to
~~~,'~,~~:~.~~~~~;~
'Y i"
:: :/:. I:.,.:;, ,,.,,. .: .,. :...:: ,,
Press CO2 setup key once again to return to normal display.
COa/Oa parameters are now calibrated/adjusted
Note
I
Ill
and ready for use.
Note:02 zero calibration needs to be performed when either 02 or CO2 boards
are replaced because the 02 zero calibration information is stored in the
NOVRAM U27 located on the CO2 board (78354-66540).
Temperature Channel Checks
a. Switch the instrument on.
b. Connect precision resistor 2814.0 ohm f 0.025% PN 0811-3444 to the temperature input.
This represents an input of 20°C f 0.2OC. Check that the temperature numerics displayed
are correct.
c. Connect precision resistor 984.20 ohm f 0.025% PN 0811-1681 (equivalent to 450 “C
fO.10 “C) to the temperature input. Check again that temperature numerics are correctly
displayed.
Note: On 78834A #A22 the temperature display alternates between Tl and T2 when both
temp. channels are loaded (at a rate of about 1s). This is because of limited display space.
2a-10
Performance Assurance Checks
Plethysmograph
Channel Checks
a. Apply pleth transducer to ear or finger (depending on type used).
b. Plug pleth transducer into instrument.
display.
After a few seconds pleth curve will appear on
c. Autogain should adjust wave signal to lie between gridlines.
Barometer Board Checks
The Barometer Board is factory calibrated and normally needs no adjustment. The range
of the built-in barometer is 500 mmHg to 800 mmHg (67 kPa to 106 kPa) with accuracy of
1% full scale. The accuracy of the barometric pressure reading may be checked against an
absolute barometer. To do this connect a working tcpCOz/tcpOz transducer to the monitor
and proceed as follows:
Press pCO2/pO2 setup key,
Press the MORE CONTRLS key,
m Press BAROM PRESS and the display shows; (for example)
indicating a barometric
BAROM.
pressure of 722 mmHg for a monitor configured
PRESS.
to mmHg (or 96.3 for kPa version).
722
n read off the barometer pressure from an accurate (accuracy = f0.5 mmHg) barometer.
(Barometer Board adjustment is described in “Barometer Board Adjustment” in
Chapter 2b.
n
n
tcpC02/tcp02
Channel Checks and Transducer
Troubleshooting
Performance assurance checks of the tcpC02/tcpOz
channel may be checked either:
n
by connecting working transducers to the transcutaneous inputs and performing
measurements and calibration procedures as described in the instrument and sensor
operating guides or
m
using a comprehensive transducer simulation test box, which apart from verifying
specifications (see “TcpCOa/tcpOz Channel” in Chapter 2b) can also simulate normal
operation of both the 15204A/15205A transducers. This is important in order to distinguish
between transducer defects and parameter board defects. For information on this simulation
test box contact the nearest HP Service Office regarding price and availability.
Performance Assurance Checks
2a-11
IMPORTANT:
NOVRAM
reprogramming
The circuitry on the tcpCOa/tcp02
used primarily to:-
parameter board (78834-66572) includes a NOVRAM
1. store reference values derived from specific components on the parameter board’s
input amplifier circuitry. These reference values are parameter board specific and are
programmed as part of the factory parameter board final test procedure.
2. to store operator configuration settings.
If component level repair is made on tcpCOz/tcpOz input amplifier circuitry (U5Ol,U502
etc. see schematic of parameter board) or if the NOVRAM itself has to be replaced then
NOVRAM reprogramming MUST be performed by HP Service in order to ensure accurate
transcutaneous gas measurements.
Exchange boards are already programmed at the factory (as in 1 above) and
do not require reprogramming by HP Service. Only configuration settings*
(as in 2 above) must be reprogrammed and this is only necessary if the
default settings have been altered (see following paragraphs NOVRAM
reprogramming).
Note
NOVRAM
reprogramming - as in 1 above.
The NOVRAM reprogramming procedure is relatively easy and requires a special NOVRAM
calibration jig. The individual parts, with part numbers and wiring connection are shown
below;
1
sensor recognition
thermistor 1
l
1
a4
42.2k 1%
0698-3450
thermistor 2
tcpC02 input
. D
3x l.Zk 0.01%
0699-1119
2x 2.253k 0.01%
0699-1120
Note
1251-4115
The calibration jig is suitable for both tcpC0a and tcp02 circuits.
3
2a-12
connector
Performance Assurance Checks
Proceed as follows;
n
switch instrument on (normal operating mode),
n
plug in the calibration jig,
n
if the measured reference values are in the allowed range the pCOa and PO:! numerics show
the CAL message after 2 to 3 s, if not the calibration jig or the parameter board is not
functioning correctly,
n
press pCOz or pop setup key and setup display should now show the CAL RUNNING
message; (if a combined pCOa and pOa setup key exists the display gives you a choice of
which to select eg. PO2 SETUP or PC02 SETUP, press either one)
PC02
CAL
-------RUNNING
[z---j
[XF-]
[OYeiview)
[-Eg$-]
[G]
EXIT
The NOVRAM
NOVRAM
-
Press and hold STOP softkey until the
CAL message disappears and display changes
to normal calibration entry setup’
eg. GAS 1
in the case of
CAL
tcpC02 monitoring
GAS 2
CAL
i
reprogramming - 1 procedure is now complete.
reprogramming - as in 2 above
Configuration settings must also be reprogrammed since the NOVRAM also stores current
operator configured settings which are necessary to ensure accurate tcpCOz/tcpOa
measurements. Proceed as follows:
n
n
n
n
n
n
n
n
n
n
plug in working transducer (or calibration jig),
press pCO2/pO2 setup key,
(if cal. jig connected press STOP softkey until CAL RUNNING message disappears as
described previously),
(if cal. jig connected press BACK TO SETUP softkey),
press MORE CONTRLS sofkey,
press MORE CONTRLS softkey again to access configuration setup,
press CHANGE CONFIG softkey,
now enter the (previous*) operator configured settings (in the case of tcpCO2 monitoring
these are; correction facility, site timer facility, {gain and offset values in the Correction
Setup mode}, and in the case of tcp0a monitoring are; room temperature, relative humidity,
site timer facility),
press STORE key to store data in NOVRAM.
repeat for other ~02 or pCOa if two separate inputs exist.
Performance Assurance Checks
2a-13
The NOVRAM reprogramming - 2 is now complete. Note: If this NOVRAM reprogramming
- 2 is not performed the NOVRAM will automatically revert to the default values for the
configuration settings listed as follows;
Note
n
If possible note the configuration settings before performing
NOVRAM/compone,nt repair so that the same values and status can be
re-entered (this of course will not be possible if the NOVRAM itself is defect).
tcp02 Configuration default settings:
Site timer: Off
Room temperature: 25OC
Relative Humidity: 50%
n
tcpCO2 Configuration default settings:
Site timer: Off
Correction : Off
2a-14
Performance Assurance Checks
HP 15210A Calibration Unit
Installation
Description
The HP 15210A Calibration Unit contains two gas cylinders (CAL 1 mixture and CAL
2 mixture) connected to a calibration chamber via a time controlled valve. The valve is
normally closed, ensuring that no gas is lost when the unit is not in use. When the timer is
turned to “CAL 2” this gas is directed to the calibration chamber for a period of 15 minutes.
After this time the valve automatically switches to “CAL 1” which in turn runs for 15
minutes.
This section provides the necessary information for you to install and service the HP 15210A.
Pressure
Black
Indicator
Zone
HP 15210A Calibration Unit
Unpacking the Instrument
If external damage to the shipping carton is evident, ask the carrier’s agent to be present
when the unit is unpacked.
Initial Inspection
Check the instrument for any external damage such as dents and scratches on panel surfaces.
If the shipping carton is not damaged, check the cushioning material and note any signs of
severe stress as an indication of rough handling in transit. Retain the packaging material for
possible repacking.
Claims For Damage
If physical damage is evident when the Calibration Unit is received or the unit does not
meet the specified operational requirements, please notify the carrier and the nearest
Hewlett-Packard Sales/Service office immediately. The Sales/Service office will arrange for
repair or replacement without waiting for settlement of the claim against the carrier.
Performance Assurance Checks
2a-15
Repacking for Shipment or Storage
If the Calibration Unit is to be shipped to a Hewlett-Packard Sales/Service office, securely
attach a tag showing the name and address of the owner, the model and serial number, and
the repair required or symptoms of the fault. If available and reusable, the original shipping
carton and packaging material should be used to provide adequate protection during shipping.
The Hewlett-Packard Sales/Service office will provide information and recommendations on
materials to be used if the original material is not available or reusable.
Instrument Identification
Hewlett-Packard uses a nine character sequence for instrument identification.
number is located on a plate attached to the rear panel of the instrument.
This serial
Specification
Gas supply:
2 low pressure cylinders.
Gas Cylinder Type
Disposable, lightweight, colour coded
(CAL 1 - brown and CAL 2 - green)
8 ml -l-4/-2 ml per minute for 15210-64010 and
Gas flow:
15210-64020
12 ml +4/-2 ml per minute for 15210-60010 and
15210-60020.
Cylinder pressure:
indicated by an integral pressure manometer.
Timer period:
CAL 1 - 20 minutes
CAL 2 - 20 minutes
Dimensions:
90mm (35.4in) high x 220mm (86.6in) wide x 235mm (92.5in) deep,
(without cylinder)
Weight:
2.4kg (5.31bs), (without cylinder)
-~
Note
I
!b
The 15210A is intended for use with Hewlett Packard CAL 1 and CAL 2 gas
cylinders.
Part Number: CAL 1:
15210-60010 or
15210-64010 for EUROPE and JAPAN only
Part Number: CAL 2:
15210-60020 or
15210-64020 for EUROPE and JAPAN only
2a-16
Performance Assurance Checks
Operating Environment
The environment where the HP 15210A will be used should be reasonably free from vibration,
dust, corrosive or explosive gases, extremes of temperature, humidity, etc. The HP 15210A
operates within specifications at ambient temperatures between 0°C and 55°C. The maximum
operating relative humidity is 95% at 40°C. Ambient temperatures or humidities which exceed
these limits could affect the accuracy of the calibration unit and cause damage to components.
Operating Information
Each HP 15210A is delivered with a multilingual collection of stick-on operating labels. Each
label summarizes day-to-day operating procedures using the Calibration Unit. It is intended
to be stuck to the top surface of the Unit, however it may be attached to any flat, grease-free
surface.
To attach label: clean the surface where the label is to be placed with soapy water to remove
any dirt or grease. Dry the surface thoroughly. Peel off the paper backing and carefully place
the label in the required position. Press down firmly with a clean dry cloth, paying particular
attention to the edges.
Fitting the Gas Cylinders
When the Calibration Unit is delivered, no gas cylinders are fitted. Before putting the unit
into service screw one cylinder of each type (CAL 1 and CAL 2) into the appropriate opening
in the rear panel. The openings are marked CAL 1 and CAL 2 and accept the cylinders
marked CAL 1 (b rown labelling) and CAL 2 (g reen labelling) respectively. Screw the cylinders
in until hand- tight (3 to 6 turns) and then ensure that the pressure indicators are showing
approximately 16.5 bar (10.7 bar -Europe only).
When new, the calibration unit will contain a small amount of normal air. To expel this air
before use and thus prevent inaccurate calibration, turn the timer control fully clockwise after
fitting the gas cylinders and allow it to run for the full period. The calibration unit is now
ready for use.
Storage of Ga,s Cylinders
New gas cylinders should be stored in a cool place and not exposed to direct sunlight.
Disposal of Used Gas Cylinders
Do not crush or incinerate used gas cylinders. They may be disposed of as scrap metal.
Performance Assurance Checks
2a-17
Routine Maintenance
Changing the Gas Cylinders
HP 15210A Calibration Unit
Before each calibration the gas pressure indicator on the HP 15210A front panel should be
read. If the indicator is in the “black” zone, change the gas cylinder as follows:
a. From the rear of the unit turn the empty gas cylinder anti-clockwise until the cylinder is
free (3-6 turns).
b. Withdraw
the empty cylinder.
c. Take a full gas cylinder of the appropriate type (CAL 1 or CAL 2) and insert it squarely
into the rear of the unit. Turn clockwise until hand tight.
d. Check that the pressure indicator is no longer in the “black” zone.
Care and Cleaning
Keep the surfaces of the calibration unit clean and free of dust and dirt. Clean regularly with
a lint-free cloth or sponge dampened in soapy water. Avoid using alcohol or ammonia based
cleaners which may damage the Calibration Unit. Other strong cleaners such as Povidine
RR, Lysol R and Mikroklene R are not recommended since they may stain the unit. Do not
pour any liquid on the instrument while cleaning . Never use an abrasive material such as
steel wool or metal polish. Cleaning agents and disinfectants should only be used in cases of
stubborn dirt. If used, carefully remove any remaining traces of cleaning agent or disinfectant
with clean water.
Note
Do not allow water to enter the calibration chamber.
To clean the calibration chamber: use cotton wool soaked in soapy water to remove any
deposits which may collect in the bottom of the chamber. Dry the chamber thoroughly after
cleaning. In the case of severe blockages, a thin length of wire may be used to free the outlet
pipe.
2a-16
Performance Assurance Checks
Theory of Operation
.- - - - - - - -. .-
CONTROL
/ Manometer
Gas Flow Regulator
‘-REGULATOR
BLOCK
Restriction
!
_ _ _
_I
REGULATOR BLOCK
Figure 2a-10. Block diagram - Internal Components
Each gas cylinder is screwed directly into a pressure regulator block. These blocks ensure
that, in combination with the restriction, the gas flow remains constant as the pressure in the
cylinders falls with use. From the regulation blocks the gas is channelled to the control block.
The gases pass into the control block via an opening in the side sealed with an “0”-ring and
filter. The control block acts as a switch.
The operation of the switch is controlled by the timer section of the Control Block. On
turning the timer control fully clockwise, CAL 2 gas is directed from the control block to
the Calibration Chamber. At the 12 o’clock position of the timer control the Control Block
automatically changes to CAL 1 gas. The two phases of the timer each last 15 minutes. At
the end of the CAL 1 phases the gas supply to the Calibration Chamber is switched off.
A restriction piece is fitted in the tubing connecting the control block to the calibration
chamber. The restriction helps to regulate the gas flow.
When a tranducer is placed in the calibration chamber it rests on the “O”- ring and thus
prevents gas escaping. To maintain a steady gas flow over the transducer surface an outlet is
provided in the rear of the calibration chamber. This outlet is connected to approximately
200mm of tubing for use in the “Performance Test” described on the next page.
Performance Assurance Checks
2a-19
Gas Flow Performance Checks
Hewlett-Packard recommends that the following gas flow check is conducted once a year.
Test Procedure
Test 1:
1. Check that the pressure indicators are not in the black zone (i.e. that there
.
is an adequate supply of gas in the cylinders).
2. Remove the Calibration Unit cover (see disassembly).
3. At the rear of the calibration chamber are two plastic tubes. One tube
goes to the control block and the other is not connected at one end. Take
the free end of the latter piece of tubing and immerse it in a glass of water.
4. Place a transducer in the calibration chamber in the normal manner (the
transducer prevents gas leaving the chamber other than via the outlet
tubing at the rear).
5. Turn the timer control to “CAL 1” - a steady stream of bubbles should be
observed in the water. This indicates a normal gas flow.
6. Turn the timer control to “CAL 2” - again a steady stream of bubbles
should be observed to indicate a normal gas flow.
1 m?i%tfii
16210A
\
:,..:.,.,.:
“,:,.a.‘.::.‘.
.,:.:.
:.,..,.,.
.:.,.,
,. ,.,,::,y::j,
,:A.),.::..:
..:...
ii~~~~~l~l~~~
:I.,j j:::j:
::,,..,,,
: :.:;,,,::.:
.,,,,.,
:.:,j:.. :‘.j’:
.::...:;y.
.: .:,
,::::..:.:::y:;::,; ..,.:.c,,
,.,,,
:,:,
.:>::
:
::.:jjj::jj:jj::j
::::j.jJ.:j’.]
,:,,
,./:
IT
CAL1 -
Callbratlon Chamber
wlth Transducer
Bubbles
in
Water
Figure 2a-11. Gas Flow Performance Check - Test 1
Action:
2a-20
If no air bubbles are observed or if bubbles are only released occasionally the
supply of gas is not adequate. In this case proceed to tests 2/3.
Performance Assurance Checks
For tests 2 and 3 the Regulator/Control Block must be removed from the unit. See
“Disassembly” section 3. After disassembly refit the timer control knob to the timer and the
gas cylinders.
Bubbles
Regulator/Control
Block
/
::.A..
:y;
.,.:
:::::::
::::
‘:,.,:::;.y,‘..:
.:.,:.::.:y.:
:.,.:
.\,
,,,,.,,.
.::,:j
..~,::.~:.::.:::::..,~:>;:~:.:,::~A:;.
:..::.:.::
.,.,.:.
.:.:A:;.:
:..,,,:
:.:.,:-::,
.
.
.
.
.
.,~
,.::
&$xX?
~Qyl::~:;::~~
.:::II,
,;,$iilii:jiij
i:.I:ii:;.:i:ii:~:iii:j’iiia.~ii~::ii:iii:i
,,.,,, ,.:::.:,.z.......
,.‘,::,.:‘i$.,:i’i
:
~~~~~i:1:.~~:~tl’:i!:P.
,j:,:I,i:,:~,.:::.‘j,
..:,..:;j
>.:
.,.:
..:..:::,
.~:
..,,..
..::..:.:::.:...‘.‘..,
._.
.,,..::...A...:>
;,.i’:l’:i’l:i:ili:j::::i
:2,:,
:,:,,,:
:::.,,:,
,,.,,.,
.,:.,
‘:‘.::‘.x:F
,.,.,.:
,...
,.,,.::,,,
.,..
,.
..,...:
.,.,.,..
::‘:‘,::.::,:
..:.:,::
.,:.:;:
:::,:x::::
::::y:
::,:j:
;yi::~?.;;
:‘!I
,iii::liji:;x:::,iii;z:
‘i:::;‘;,;:‘:;
,..... :.,.:.:,:.:.,.
.,.,,
,~.,‘:::‘,:..:,::j.:,:j:j:
Figure 2a-12. Gas Flow Performance Check - Test 2/3
Test 2:
Perform the test 1 again but this time place the tubing coming from the
control block in the glass of water.
Action:
If the gas flow is normal in this test, inspect the calibration chamber inlet
and outlet pipes for blockage (see Care and Cleaning). If the gas flow is not
adequate proceed to test 3.
Test 3:
Remove the restriction (15210-23701) from the tubing. Place the free end of
the tubing coming from the control block into the glass of water. Advance the
timer first to CAL 1 and then to the CAL 2 positions. In both timer positions
observe the gas flow.
Action:
If the gas flow is normal in this test, replace the restriction (15210-23701).
If the gas flow is not adequate in either timer position, the complete
calibration unit must be reassembled and returned to the nearest HP service
office for repair.
The function of the “Timer” may be checked using a normal watch or clock. When turned
fully clockwise the pointer should take approximately 15 minutes to reach the 12 o’clock
position and then a further 15 minutes before the gas supply is switched off.
Performance Assurance Checks
2a-2 1
Disassembly
Tools Required:
n
n
n
Pozidrive screwdriver, size GNl,
Normal screwdriver, size l/7,
Hex-key (Allen-key), size SW 3mm.
1. Cover Removal, see Figure 2a-13.
0
0
0
0
.n
Figure 2a-13. Cover Securing Screws (veiwed from underneath)
a. Remove both gas cylinders from calibration unit.
b. Remove the four screws on the base of the unit (see diagram).
c. Slide the cover off towards the rear of the unit.
2. Timer Control Knob
-Gnlb
Screw
Figure 2a-14. Control Knob
a. The timer control knob is secured with a “grub-screw” located in the side of the knob
(see diagram). Loosen this screw approximately 2 turns. The knob can now be pulled
Off.
2a-22
Performance Assurance Checks
3. Regulator/Control
Block Removal
0
Figure 2a-15. Regulator Control Block Securing Screws
a. Complete operations 1 and 2 above.
b. Remove the connection pipe from the rear of the Calibration Chamber.
c. Unscrew the four remaining screws on the unit base to release the Regulator/Control
Block.
d. The two screws on the regulator block side can now be removed to separate the
regulator block from the control block. Be careful not to misplace the “0”-ring and
filter which are fitted between the two blocks.
Flgure 2a-16. Regulator and Valve Control Blocks
Performance Assurance Checks
2a-23
4. Flow Regulator (Restriction)
Removal
Figure 2a-17. Tubing and Flow Regulator
a. Complete operations 1,2, and 3.
b. The flow regulator can now be removed by pulling the tubing off.
2a-24
Performance Assurance Checks
Parts List
Regulolor
Block
Lell
15210-67202
Block
15210-67701
Regulolor
Flow Regulolor
IRestrIction)
Block Right
15210-67203
15210-23701
Figure 2a-18. Replaceable Parts for 15210A
Replaceable Parts for the 15210A
Description
Part Number
15210-47101
Flat sealing ring (to seal gas bottle)
15210-47107
Sealing ring
15210-47106
Membrane foil
15210-62401
Clock
15210-67701
Valve control block
15210-67202
Regulator block left
15210-67203
Regulator block right
15210-23701
Flow regulator restriction
0905-0678
8mm ring - between valve control block and regulator block
15210-27401
Timer control knob
0515-0777
Screw M6x8 (for timer control knob)
15210-04101
Cover - bottom
15210-04102
Cover - top
15210-24702
Spacer - hexagonal nut for mounting regulator block
15210-68703
Set of restrictions for adjusting gas flow
Performance Assurance Checks
2a-25
Transducer Troubleshooting
tcpOz (transcutaneous partial pressure of oxygen) and tcpCOz (transcutaneous partial
pressure of oxygen) monitoring is a very application intensive procedure requiring the operator
to maintain and correctly calibrate the transducers to avoid measurement problems. The
physiological correlation between blood gas analysis derived partial 02 and CO2 values and
transcutaneous partial 02 and CO2 measurements must also be considered before suspecting a
transducer or instrument malfunction.
The general troubleshooting guide below covers mainly application and operator problems
(this troubleshooting is also covered in the 02 Operating Guide PN 15204-90001) and the
CO2 Operating Guide PN 15205-90001). tcpOs and tcpCOs monitoring error codes which
appear on the monitor display are detailed in Chapter 1, Volume 2 of this service manual (PN
78354-90010).
tcpO2 transducer:
1. Problem: Reading fluctuates.
Cause: Switching of nearby electrical equipment; defibrillation; discharge of static
electricity.
Solution: There is no entirely satisfactory solution to this problem other than to remove
the source of the interference.
2. Problem: After application of the transducer to the skin, it takes longer than specified to
reach a stable value.
Cause:
a. Impaired vasodilation.
b. Contact fluid layer too thick or air enclosed between transducer and skin.
Solution:
a. Evaluate patient status.
b. Re-apply transducer.
3. Problem: Transcutaneous reading remains at a constant value without fluctuations. Little
response to patient blood gas changes.
Cause:
a. Physiologic cause.
b. Contact fluid layer too thick.
c. Skin burn with blister formation underneath transducer.
Solution:
a. Evaluate patient status.
b. Re-apply transducer.
c. Change transducer site, reduce skin exposure time.
4. Problem: Reading fluctuates towards high values.
Cause: Transducer loosely attached.
Solution: Replace adhesive ring. Note, pop in air is much higher than the pa02 of the
blood.
2a-26
Performance Assurance Checks
5. Problem: tcp0z reading drifts significantly during measurements.
Cause:
a. Damaged membrane.
b. Transducer not polarized before calibration.
Solution:
a. Press lightly on the membrane surface with your finger. If the tcp0s reading first
falls slightly and then rises again the membrane is intact. If the tcp02 reading first
rises and then falls (or remains high), the membrane is defective.
b. Re-calibrate.
6. Problem: The transcutaneous reading deviates significantly from the result obtained from
blood gas analysis.
Cause:
a. Physiological cause.
b. Inappropriate transducer temperature.
c. Transducer incorrectly calibrated.
d. Inaccurate blood gas analysis, improper handling of blood sample.
Solution:
a. Evaluate patient status.
b. See Selection of Transducer Temperature below.
c. Re-calibrate.
d. Repeat analysis with blood gas analyzer.
7. Problem: Transducer can no longer be calibrated.
Cause:
a. Air bubble within electrolyte layer.
b. Transducer was not polarized before calibration.
c. The measuring surface of the transducer is contaminated.
Solution:
a. Repeat transducer preparation.
b. The tcpOz transducer must be polarized for 15 minutes before calibration. This
applies after each membrane change and after the transducer is plugged into the
instrument.
c. See “Cleaning the Measuring Surface”.
tcpCO2 transducer:
8. Problem: Reading fluctuates.
Cause:
a. Switching of nearby electrical equipment; defibrillation; discharge of static electricity.
b. Transducer cable damaged.
Solution:
a. There is no entirely satisfactory solution to this problem other than to remove the
source of the interference.
b. Replace transducer.
Performance Assurance Checks
2a-27
9. Problem: After application of the transducer to the skin, it takes an unusually long time
to reach a stable value.
Cause:
a. Impaired vasodilation.
b. No ‘Contact fluid’ present or air enclosed between transducer and skin.
Solution:
a. Evaluate patient status.
b. Re-apply transducer.
10. Problem: Transcutaneous reading remains at a constant value without fluctuations. Little
response to patient blood gas changes.
Cause:
a. Physiologic cause.
b. No ‘Contact fluid’ present of air enclosed between transducer and skin.
c. Skin burn with blister formation underneath transducer.
Solution:
a. Evaluate patient status.
b. Re-apply transducer.
c. Change transducer site, reduce skin exposure time.
11. Problem: tcpCO2 reading drifts significantly during measurements.
Cause:
a. Damaged membrane.
b. Transducer not stabilized before calibration.
Solution:
a. Replace membrane.
b. Wait for stabilization and recalibrate.
12. Problem: The transcutaneous reading deviates significantly from the result obtained from
blood gas analysis.
Cause:
a. Physiological cause.
b. Inappropriate transducer temperature.
c. Transducer incorrectly calibrated.
d. Inaccurate blood gas analysis, improper handling of blood sample.
Solution:
a. Evaluate patient status and refer to “Application”, use of correction factors.
b. See ‘Application - Transducer Temperature’.
c. Re-calibrate.
d. Repeat analysis with blood gas analyzer.
13. Problem: Transducer can no longer be calibrated.
Cause:
a. Air bubble within electrolyte layer.
b. Transducer was not stabilized before calibration.
c. Membrane working life exceeded.
Solution:
a. Remembrane transducer.
b. The tcpC02 transducer must be stabilized for 30 minutes before calibration. This
applies after each membrane change and after the transducer is plugged into the
instrument.
c. Remembrane transducer.
2a-28
Performance Assurance Checks
Selection of Transducer Temperature
General: The correlation* between transcutaneous and arterial pOz improves as the
transducer temperature is increased. However the skin becomes red as a result of the
hyperemization at the measuring point caused by the heating up of the transducer. Three
factors affect the degree of reddening:
a. Skin sensitivity at the point of contact.
b. Transducer temperature.
c. Application period.
In order to minimize the risk of blistering, the temperature should be as low as possible and
the application period limited in accordance with the selected temperature and the patients
skin sensitivity. Under certain circumstances it may take several days before the reddening of
the skin disappears.
Note
3
The tcpCOz transducer characteristics are dependent on the selected
transducer temperature. Therefore, after this temperature is changed, a full
calibration must be performed.
Under the following clinical situations there is, according to the present level of knowledge,
limited or no correlation between transcutaneous and arterial blood gas tensions:
a.
b.
c.
d.
e.
f.
Profound peripheral vascoconstriction
Circulatory centralization (shock)
Arterial occlusive diseases
Arterio-venous shunts (e.g. Ductus arteriosus)
Edema of the skin (e.g. Oedema neonatorum) and other amomalies
Hypothermia during surgery.
tcp Transducer Auto Cleaning
The transducerAuto
transducer.
Cleaning feature is only available in conjunction with the 15204A
The measuring surface must be cleaned when air calibration is no longer possible (indicated
by the message ERROR POLISH SENSOR) or after receiving persistant error messages
during zero calibration.
The measuring surface can be cleaned electro-chemically or manually. Manual cleaning is
only necessary when the electro-chemical process is not available on the monitor or not able
to restore the correct operation of the transducer (e.g. in the case of severe deposits on the
measuring surface).
For further information on this cleaning process consult transducer operating guide Pi’4
15204-90001.
Performance Assurance Checks
2a-29
Sp02 Channel Checks
Test Mode
1. Set the SpOs parameter so that the Pleth, and not the ECG, provides the Heart Rate
reading shown on the top right of the monitor display. (See the SpOz section in the
appropriate operating guide.)
2. Press the instrument setup key
El2
or
(Standard
Display)
.
3. Press and hold down the test key. The monitor indicates which key to press.
4. As an alternative to (2) and (3) ab ove, go into Service Test Mode. This gives a continuous
“hands off’ display. To do this, first leave the monitor switched off for 20 s, then
simultaneously press keys labelled JL or (CalMark) and &J or (Silence/Reset),
and turn on the
instrument.
The monitor display should show:
a. The SpO, numeric displays 100.
b. The Heart Rate is 100 bpm.
c. The SpOz wave is smooth and noise free.
Operating Mode
a. Attach the transducer to the finger of a normal, healthy person.
b. Plug the transducer into the 78XxX and switch on the instrument.
c. After a few seconds the pleth wave should appear on screen.
Check that:
a. The autogain adjusts the wave form displayed on screen, such that it lies between the
gridlines. In this way it is about 50% of possible channel height.
b. The SpO, numeric displays 97% +/- 2%. Providing the person being monitored is healthy
and unstressed, a reading far outside this range indicates a monitor or transducer error.
2a-30
Performance Assurance Checks
2b
Specification
Checks
Introduction
The following specification checks should be used to ensure that the monitor is operating in
accordance with the published specifications.
All specification checks assume that the internal controls of the monitor are
adjusted as described under Adjustments (VOLUME 2).
Note
3
In addition, these checks verify proper operation of various circuits in the monitor and can be
used:
n
As part of the incoming inspection check of the monitor (along with the performance
assurance checks);
n
Periodically, if maximum reliability is desired;
n
Before or after repairs or adjustments (along with the performance assurance checks) prior
to returning the monitor to regular service.
Specification Checks Test Equipment
See Table 2-l
ECG Channel
During all ECG channel checks the monitor must be programmed to output
the ECG wave at the rear panel jack (see Volume 2).
Note
I
!I?
ECG Amplifier
Input offset:
a. Connect DVM to jack on rear panel.
b. Set ECG-channel to DIAGnostic
mode.
c. Connect patient cable to the ECG input and short all 3 inputs together.
Test Limit:
V < 100 mV.
Input offset: (78352A/3B/4A
only)
a. Adjust to Max. Gain.
b. Connect DVM to jack on rear panel.
Specification Checks
2b-1
c. Set ECG-channel to DIAGnostic mode.
d. Connect patient cable to the ECG input and short all inputs together.
Test Limit:
2b-2
V < 300 mV
Specification Checks
Table 2b-1. Test Equipment Requirements for Specification Checks
Required
‘unction
ienerator
Minimum
Recommended
Characteristics
Model
Type
HP 3310B
HP 8011A
Output Level:
2OV p-p
Open Circuit
Frequency Range:
< 0.01 Hz to 500 kHz
Frequency Response (Sine Wave):
f 1% 0.01 Hz to 50 kHz
REF 1 kHz at full amplitude
into 50 Ohm
Iscilloscope
HP 1740A
Bandwidth:
Sensitivity:
Time Base:
>c
Joltmeter
HP 3435A
DC Volts Range:
Accuracy :
rest Cables
bnd
Zomponents
HP 1250-0781
BNC TEE
HP 11086A
BNC-BNC
HP 10501
BNC-Clipleads Cable
(Alligator Clips must be added
4 required)
HP 1251-1190
P.C. Edge Connector
HP 0757-0465
100 kohm f 1% Resistor
HP 0757-0442
10 kohm & 1% Resistor
HP 0757-0401
100 kohm f 1% Resistor
HP 0698-3159
26 kohm Resistor
HP 0813-0029
1 Ohm Resistor
HP 0160-3552
1 F Capacitor
HP 0160-3718
47 nF Capacitor
HP 0160-3726
1 uF Capacitor
HP 0757-0449
20 kohm Resistor
HP 2100-2066
2 kohm Potentiometer
HP 0813-0029
1 Ohm Resistor
HP 6214A
1 V dc Output
DC Power
jupply
Zertsch Transformer
dc to 100 MHz
lOmV/cm to 10 V/cm
0.1 s/cm to 0.5 s/cm
0.000 v to l,ooov
f 1mV
cable
(Ratio Transformer)
Specification Checks
2b-3
Gain Check
This check verifies that the gain of the ECG amplifier is 1000 for instruments without a
system board, and is adjustable for instruments with system boards (gains 300 to 3000 with
full system board, and 400, 800, 1600 and 3200 with simple system board).
System Board not Loaded
Connect the test equipment as shown in Figure 2b-1.
a. Set lead selector to Lead I.
b. Adjust the test equipment as follows:
Function Generator
n
Frequency: 10 Hz
n
Function: Sine Wave
n
Output Level: 5 V p-p (measure with the oscilloscope at the output of the Function
Generator while the Function Generator is connected to the 1OOO:ldivider circuit. Then
reconnect the oscilloscope as shown in Figure 2b-1) Test Limit: The signal amplitude on
oscilloscope should be between 4.2 V and 5.8 V p-p.
System Board Loaded (Option JlO or Jll)
n
using the same test setup adjust the output of the function generator to 1 V pp.
n
adjust for maximum size of the displayed ECG wave on the monitor.
amplitude on the oscilloscope should be between 2.4 V and 3.9 V.
783Xx Series
143070114467A
PATIENT CABLE
FUNCTION
GENERATOR
TEST
CIRCUIT
i_ ----J
‘$
Test Limit:
788XX Series
14337A114330A
PATIENT CABLE
REAR-PANEL
PHONE JACK
OSCILLOSCOPE
P.N.
10501A
Figure 2b-1. ECG Amplifier Gain Frequency Response Test Set-up
2b-4
Specification Checks
The signal
Gain Check: (78352A/C/3B/4A/C
n
Variable gain of 320 to 3200
n
Select Max. Gain:
n
Press: ECG - SIZE - a
only)
( several seconds) until signal is Max.
Trigger Sensitivity Check
w Connect the test equipment as shown in Figure 2b-2.
n
Set output level of function generator to 0.25 V pp (heart rate should be displayed and flash
light is visible).
w Test Limit:
Trigger should occur at 0.250 V.
TEST
CIRCUIT
14337A11499sA
PATKENT CABLE
Air3L
-I ‘Ch.’
I-
703xx
Series
l\-““-I\
-1
700XX
Series
I‘26.. 4
Figure 2b-2. Trigger Sensitivity Check Set-up
ECG Amplifier
Noise Check
This procedure checks the maximum allowable ECG amplifier noise with reference the input.
a. Connect test equipment as shown in Figure 2b-3.
b. Switch to DIAGnostic
mode.
c. Set lead selector to Lead I
Test Limit:
Noise, excluding hum, should be < 35 mVpp on external scope.
78352A/C/3B/4A/C
only:
d. Adjust to Max Gain.
Test Limit:
Noise, excluding hum, should be < 115 Vpp on external scope.
Specification Checks
2b-5
100
HZ EXTERNAL
783Xx
Series
! ___---_---:
SHIELDED
CASE
REAR-PANEL
100 HZ EXTERNAL
LOW-PASS
FILTER
788Xx
I
I
‘. - - _ _ - - - - - - ;
SHIELDED
CASE
Figure 2b-3. ECG Amplifier Noise Test Set-up
COMPONENT
Figure 2b-4. ECG Noise with 50Hz Component
1mV Calibration Accuracy Check
This test checks the accuracy of the internal 1 mV calibration source.
a. Connect test equipment as indicated in Figure 2b-5.
b. Switch to DIAGnostic mode.
c. Set lead selector to Lead I.
2b-6
Specification Checks
Series
d. Measure the +1 V source used in the test setup with an accurate dc Voltmeter, such as the
HP 3435A. Adjust the source for a i-1.000 V reading. (78352A/C/3B/4A/C:
measure the
t1.6 V source used. . . . . . . )
e. Push n or (Mark) key. On external scope the same amplitude as before should be
observed (within f 10%).
783Xx series:
100 KfL
as
POWER
SUPPLY
si _
loon
1100
1%
VDC
6214A
1
1OOO:l
100
ATTENUATOR
POWER
SUPPLY
KIL
.+
1.00
VDC
6214A
I
1OOO:l
ATTENUATOR
Figure 2b-5. 1 mV Calibration Test Set-up
Common Mode Rejection Ratio - CMRR
This procedure checks that the monitor will provide 90 dB (86 dB with Resp) common mode
rejection of unwanted interference signals with up to 51 kOhm/47nF of electrode impedance
imbalance.
1. Set function Generator to 20 V p-p (output 60 Hz)
2. Select DIAGnostic
mode.
3. Connect test equipment as shown in Figure 2b-6
4. Measure AC voltage on external scope.
5. 78352A/C/3B/4A/C
Test Limit:
only - Set gain to Max Gain (SIZE)
V < 320 mV (500mV with Resp)
Specification Checks
2b-7
! rINCLUOE6
STRAY
FUNCTION
GENERATOR
REAR-PANEL
6ntEulED BOX8”ou.D BE AT
A D18TANCE FROM GNU TO
YXNYYIZE
CAPACITY TO CID
P.M.
10601A
Figure 2b-6. Common Mode Rejection Set-up
Frequency Response
This check verifies the ECG Amplifier bandpass in diagnostic and monitoring modes and also
the CRT display bandpass.
a. Connect test equipment as shown in Figure 2b-1.
b. Switch to DIAGnostic
mode and set Lead Selector to I.
c. Set Function Generator to 10 Hz sinewave with an output level of approximately
and connect to A on Test circuit.
0.8 V pp
d. Adjust Function Generator to give external scope amplitude of 8 cm at sensitivity of 0.2
V/cm.
e. Set Function Generator to 0.5 Hz and measure the amplitude on the external scope. Test
Limit: Amplitude on Scope > 5.66 cm (3 dB down)
f. Set Function Generator to 100 Hz and measure amplitude on external scope. Test Limit:
Same test limit as described in e.
g. Select FILTER mode.
h. Set Function Generator to 10 Hz and adjust manually for an amplitude of 8 cm on external
scope (sensitivity 0.2 V/cm).
i. Set Function Generator to 0.5 Hz and measure amplitude on external scope.
j. Set Function Generator to 10 Hz, then measure the amplitude on monitor CRT.
k. Set Function Generator to 0.5 Hz and 30 Hz. The amplitude decrease should not be more
than 3 dB.
78352A/C/3B/4A/C:
two modes =
n
ICU-Mode : 100 Hz = -3 dB
n
OR-Mode : 30 Hz = -3 dB (Notch Filter)
2b-8
Specification Checks
Notch Filter Test
a. Connect equipment as shown in Figure 2b-1 and apply power to each instrument.
b. Set Function Generator output for a 10 V pp 10 Hz sine wave across test circuit points A
and C and adjust ECG amplitude until Oscilloscope displays 10 V p-p at rear panel jack.
c. Sweep Function Generator frequency over a range of 0.5 Hz to 70 Hz. The Oscilloscope
should show the response characteristic of Figure 2b-7 with instrument in FILTER mode.
d. Manually sweep the frequency of the Function Generator to the line frequency of exactly 50
Hz.
Test Limit:
V notch < 760 mV, > 22.4 dB Notch Depth
1v
0.71
t
Frequency
Response
Characteristic
V
I
I
I
I
I
I
I
I
0.5Hz
Figure 2b-7. Notch Filter Test Response Characteristic
Pressure Channel
These checks verify specification compliance of integral pressure circuitry.
Additional
equipment required for these checks:
n Ratio Transfomer
w Impedance Simulator box
n Pressure Connector 1251-4953
Specification Checks
2b-9
Pressure Zero and Range Accuracy Check
Connect instrument as shown in Figure 2b-8.
IMPEDANCE
SIMULATOR
RATIO
TRANSFORMER
I--------------------~
I
I
PRESSURE UN1 T
CONNECTOR
1251-4953
+C5 and 8 connected
= 5 @J/V sensitivity
5 and 8 not connected
= 40 pV/V sensitivity
I----_---_------------I
RI
~2
~1
0698-3444
0757-0308
0140-0131
3itiJ-l
75n
lo-7on
Figure 2b-8. Equipment for Zero and Range Accuracy Check
Specification : ZERO = f 1 mmHg (ZIZ0.1 kPa)
a. Set Ratio Transformer to 50000.
b. Press “PRESS” setup key.
c. Press “ZERO” softkey for at least 1 s. Prompt tone sounds when zeroing is completed.
DISPLAY should show 0 mmHg f 1 mmHg (0 kPa f 0.1 kPa)
When Zeroing is completed
d. set Ratio Transformer to 50800
e. press “CAL”
softkey
When calibration is completed the prompt tone sounds. Display should show 200 mmHg &
1 mmHg.
f. Press “STORE CAL” softkey to store the calibrated value.
2b-10
Specification Checks
Pressure linearity check
Set Ratio Transformer to values shown in Table 2b-2 and verify linearity by observing
readings on display. Readings should be within f mmHg (41 0.2 kPa).
Transformer Test Settings for Pressure Output Linearity
Table 2b-2. mmHg Test
SETT JGS
40 uv
5 uv
49920
50000
50080
50160
50240
50320
50400
50480
50560
50640
50720
50800
50880
50960
49990
50000
50010
50020
50030
50040
50050
50060
50070
50080
50090
50100
50110
50120
READING
1
=a
20
0
20
40
60
80
100
120
140
160
180
200
220
240
kPa Test
SETTINGS
40 uv
49910
50000
50090
50180
50270
50360
50450
50540
50630
50720
50810
50900
50990
READING
kPa
-3
0
3
6
9
12
15
18
21
24
27
30
33
SETTINGS
5 uv
READING
49989
kPa
-2.9
50000
50011
50023
50034
50045
50056
50068
50079
50090
50101
50113
50124
0
2.9
6.1
9.1
12.1
14.9
18.1
21.1
24.0
26.9
30.1
33.1
Specification Checks
2b-11
Plethysmograph
channel
PHONE JACK
(1251-0223)
TIP RING
lookn 1%
FUNCTION
GENERATCR
---p10157-oL65)
-
loonwe
(0757-0401)
Figure 2b-9. Plethysmograph Channel Test Circuit
a.
b.
c.
d.
e.
f.
g.
Set function generator to sine wave. Frequency 3.5 Hz.
Set amplitude to 10 Vpp.
Switch instrument on.
Connect test circuit to pleth input.
Pleth display with gridlines should appear.
Gain should be set automatically, so that waveform is positioned between gridlines.
Set function generator to 0.8 Hz. Verify that amplitude decrease is not more than
approximately 25%.
h. Set function generator to 11 Hz. Verify that amplitude decrease is not more than
approximately 25%.
Respiration Channel
INOP check
a. Connect instrument to test circuit shown in Figure 2b-10.
b. Rotate the potentiometer until - is displayed in the respiration numerics field. This should
occur at 2.1 kOhm f 15%.
Adult Respiration = between LL and RA
Neonate Respiration = between LL and LA
2b-12
Specification Checks
20K
1%
YRA
2K
Figure 2b-10. Test Circuit for INOP check
Respirotach range check
Specification: 0 to 170 rpm
a.
b.
c.
d.
e.
Connect instrument to test equipment as shown in Figure 2b-11
Set function generator to: negative pulse, dc offset, negative
Adjust level and offset level for negative 1 V pp signal.
Set frequency to 0.06 Hz - respiration rate displayed should be 4 rpm.
Set frequency to 2.8 Hz - respiration rate displayed should be 168 rpm.
FUNCTION
GENERATOR
OSCILLOSCOPE
Figure 2b-11. Test Equipment for Respirotach Range Check
Specification Checks
2b-13
NIBP Calibration and Adjustments
The following procedure describes how to calibrate and make adjustments to the NIBP
parameter board. The procedure is the same for the 78352A/C and 78354A/C instruments
but the displays are different (78352A/C h as more display space available). The 78352A/C
displays are shown in italics to the left of the 78354A/C displays.
First remove top cover of instrument to access switch block Sl on NIBP board.
On switch block Sl, switch 2 should be in the open position (in normal operation switch 2
should be in the closed position).
NIBP Diagram von alte Seite 2-31 hier einfiigen
Connect a pressure gauge (O-320 mmHg), to the parameter input socket of the monitor
via tubing used to connect a cuff to the monitor. Recommended pressure gauge kit can
be ordered under 78354AK #SSS. If any other mercury manometer is used an expansion
container, volume 250 ml *lo%, must be connected to the pressure circuit to simulate the cuff
air volume (connecting material can be ordered under part number 78354-67001). It should be
noted that a mercury manometer is not as accurate as the recommended pressure gauge and if
the manometer tolerance is >l mmHg calibration cannot be done within HP specifications.
Switch on instrument and the following information will appear on the screen where the blood
pressure values normally appear:
78352A/C
78354A/C
s
N
0
D 0
UD
pa3 0
The bottom numbers indicate the current Mode of calibration and can be 0.. . . 5. If 0 is
displayed, the monitor is in Mode 0 - which has no function.
2b-14
Specification Checks
Press Start/Stop
(S/S) key for <l s to advance to Mode 1
Mode 1 - Offset adj.
78354A/C
78352A/C
s 0
D 6
CD1
N O/6
pa3 l
Adjust the Offset pot. R3 until the displayed value equals zero, i.e. 0 on 78352A/C or O/O on
78354A/C
The / symbol represents a decimal point on the 78354A/C, and the numbers opposite S & D
on the 78352A/C mean 0.6 (in this example, both displays are reading 0.6 mmHg).
Press S/S key for <1 s to advance to Mode 2
Note: It is not possible to go on to Mode 2 unless zeroing has been done.
Mode 2 - Gain adj.
The pump pressurizes the system to approximately 280 mmHg. Note: The system will first
pressurize, release to approximately 0 and then repressurize to approximately 280 mmHg.
78352A/C
78354AlC
s
N XYZ/X
XYZ
Adjust Gain pot. R12 until display equals gauge pressure which is approx. 280/O.
Press S/S key for <l s to advance to Mode 3
Mode 3 - Range check
This Mode provides a linearity check of the pressure-sensor and input circuit. The pump
pressurizes the pneumatic system to approximately 50 mmHg and the pressure displayed on
the instrument should be checked against the gauge pressure reading. Each time the S/S key
is pressed the pump steps up the pressure and the values on the display are again checked
against the gauge pressure reading. This operation is to be repeated in steps of approximately
50 mmHg upto approximately 250 mmHg.
Press S/S key for <l s to advance to Mode 4
Mode 4 - Leakage mode
System pressurizes to approximately 280 mmHg (continues upwards from last step in Mode 3).
Wait 60 s. This is shown counting down on the display in the mode number field. When the
60 s is up the field above the mode number field indicates the leakage rate e.g.
78352A/C
78354AlC
Which indicates a leakage rate of 3.9 mmHg/GO s. Maximum leakage rate should not be >6
mmHg/GO s. (If you wait longer, the display shows a further pressure drop).
Specification Checks
2b-15
Press S/S key for <l s to advance to Mode 5
Mode 5 - Overpressure mode
The system pressurizes to approximately 300 mmHg at which point the overpressure valve
should open and release the pressure.
The calibration cycle is now complete and display returns to Mode 0. Remember to close
switch S2 for normal operation.
Reseting Modes
At any time during the test modes the Monitor can be reset and return to Mode 0 by pressing
the S/S key for longer than during mode checks (about 1 s).
Manometer Test Mode - The overall operation of the NIBP parameter board and accuracy
of the pressure transducer may be checked without the need to remove the top cover of the
instrument or to change switch settings. (No adjustments are possible in this mode). This test
can be used to check the entire pressure range tolerances with an external manometer. To do
this test connect the instrument, manometer and external pumping device as shown below:
Rubber bellows
or other
Enter service test mode by switching off instrument for at least 20 s, then, pressing keys n or
simultaneously, switch on the instrument but keeping the keys
(Cal]
and g or (GLZ&Z]
pressed until the three tones are heard.
The system can now be pressurized using the external pressurizing device. If the NIBP
parameter board is functioning correctly the display should read the same as the pressure
gauge (manometer). e.g. if gauge reads 60 mmHg the display should show:
N
Pa
60
within tolerances.
Press S/S key to release pressure in system.
Note
2b-16
This test mode does not use the internal pump of the monitor.
Specification Checks
NIBP Calibration and Adjustments (HP78xxxC Only)
The following procedures detail how to calibrate and test the NIBP board (78352-96538) fitted
in the 78352C, 78354C and 78834C monitors.
There are three procedures described in the following paragraphs. They are;
1. Calibration Procedure
2. Leakage Test Procedure
3. Linearity Test Procedure
Note
For use in Germany the calibration of NIBP boards must be accompanied
by confimation by the PTB. The calibration switch is then sealed with a
sacrificial PTB sticker so the board cannot be susequently calibrated without
destroying this sticker.
For the calibration procedure you will need first to remove the top cover of the monitor to
gain access to the calibartion switch.
For all the procedures you will need to place the monitor in Service Test mode. This is done
by switching off the monitor for at least 20 s, holding down the f$iXZMark)and [B)
keys
simultaneously and switching on the monitor.
A pressure gauge (O-320 mmHg), needs to be connected to the parameter input socket of the
monitor via tubing used to connect a cuff to the monitor. Recommended pressure gauge kit
can be ordered under 78354AK #888. If any other mercury manometer is used an expansion
container, volume 250 ml *lo%, must be connected to the pressure circuit to simulate the cuff
air volume (connecting material can be ordered under part number 78354-67001). See figure
in Manometer Test Mode. It should be noted that a mercury manometer is not as accurate
as the recommended pressure gauge and if the manometer tolerance is >l mmHg calibration
cannot be done within HP specifications.
Calibration Procedure
The calibration of the NIBP board is described in the following steps. If the NIBP board is
not for use in Germany, ignore references to PTB and PTB sticker.
1. Remove the PTB sticker to gain access to the calibration switch.
2. Press the calibration switch (S2) with a screwdriver.
3. Press the IT)
key to close the valves.
4. Apply pressure to the circuit until the pressure guage reads 280 mmHg. The display shows
values derived from the NIBP sensors.
5. Press-and-hold the (START/STOP)key for more than one second to calibrate the board.
The display will replace the mmHg reading with a 0 and then 280 mmHg. The calibration
is now completed.
6. Press the (START/STOP)key to open the valves and release the pressure. For Germany only:
7. The board must be checked by PTB and access to the calibration switch is sealed with a
PTB sticker.
Specification Checks
2b-17
Leakage Test
This test checks both the NIBP board and the Test pressure circuit used to calibrate the
board for leaks. The procedure is detailed in the following steps:.
1. Press the [Tj
key to close the valves.
2. Apply pressure to the cicuit until the pressure reads 280 mmHg. The display shows values
derived from the NIBP sensors.
3. Observe the pressure reading after 60 seconds. The pressure must not have decreased more
than 6 mmHg.
4. Press the (START/STOP)key to open the valves and release the pressure.
Linearity Test
This test checks the accuracy on the NIPB Parameter board across the measurable range.
The procedure is detailed in the following steps:
1. Press the (START/STOP)key to close the valves.
2. Apply pressure to the circuit until the pressure guage reads 300 mmHg.
3. Observe the pressure displayed is 300 mmHg f 5 mmHg.
4. Decrease the manometer pressure in 50 mmHg steps and check the pressure at 250, 200,
150, 100 and 50 mmHg are accurate to within f 4 mmHg.
5. Decrease the manometer pressure to 0 mmHg, the display must show a value between 0
and 3 mmHg.
6. Press the (j-j
key to open the valves and release the pressure.
RS 232C Interface Checks
This check is to test if the RS 232C board is functioning correctly.
a. Remove top cover and OPEN switch S7 on switch block Sl. The baud rate should be
switched to 19200.
b. Now enter monitor test mode by switching off instrument for at least 20 s, then, pressing
softkeys n or [-Mark) and B or I[Suspend_)
simultaneously, switch on th.e instrument but
keeping the keys pressed until the three tones are heard. The CRT grid should now appear
on the display.
c. Press softkey labelled
q or (Record)and part numbers to ROMs loaded are displayed.
The display now appears:
RS232
5180-XX?0
to indicate service/test mode.
Now short Port 1 to Port 2 with appropriate cable (cable is optional and can be ordered
under number: 78599AI #H16. This cable is approx. 1.5 m long). During this self test
Port 1 receives data from Port 2 and Port 2 receives data from port 1.
2b-18
Specification Checks
The display now appears:
RS232
5180-Xx:0
which indicates board is functioning correctly.
If the symbol ? remains the RS 232C board is not functioning correctly.
Note
XX are the 5th and 6th digits of an 8 digit EPROM part number.
I
!lr
Specification Checks
2b-19
Barometer Board Adjustment
The Barometer Board is factory calibrated. Should it be necessary however, to adjust the
Barometer Board (component level replacement etc.) it is necessary to remove the top cover
of the instrument to access the adjustment potentiometer Rll. Switch instrument on and
plug in either the test box described in 2.2.8 or a 15204A/15205A transducer and proceed as
follows;
n
Press PC02 or PO2 setup key,
w Press the MORE CONTRLS key,
w Press the BAROM PRESS key and display shows; (for example):
BAROM...
PRESS...
722.....
Indicating a barometric pressure of 722 mmHg for a monitor configured to mmHg (or 96.3
for kPa version).
n
Read off the barometer pressure from an accurate (accuracy = f0.5 mmHg) barometer and
adjust the potentiometer Rll until the display reads the barometer reading.
The Barometer Board is now adjusted.
l,
?603L-66573
I
.
l-l
n
l
.-
CR1 RZ RS -
-
R7 R6 RS -
-
._
RURlSRlL-
-
I
I
Location of Rll
2b-20 Specification Checks
8
1
TcpCO#cpOs
Channel
Complete specification checks can only be performed using a special comprehensive test box.
Linearity, temperature control, cable defect simulation etc. can be verified with this special
test box.
Note
3
This test box is different from the NOVRAM calibration jig described in
“tcpCOz/tcpOz Channel Checks and Transducer” in Chapter 2a. Contact the
nearest HP Service Office for details and availability.
Sp02 Board
Due to the sophisticated nature of the output / input signal of the SpO, board, it is not
possible to test the device with a simple test circuit.
Specification Checks
2b-21
2c
Technical Specifications
for all Monitors
Introduction
This chapter contains technical specifications in instrument numerical order.
Technical Specifications
78352A/C
This section contains the final specifications for the 78352A/C. The general instrument
specifications are followed by those for the individual parameters.
General
Patient safety
n
n
n
n
n
All inputs are CF-type.
Otion NO1 meets safety requirements CSA(C22.2 No.125).
Option NO2 meets safety requirements of IEC 601-l.
Option NO4 meets safety requirements of UL 544.
Defibrillator protection up to 5 kV.
Power requirements:
Operating voltage:
’
115 V/230 V tlO% -15% (IEC/USA)
115 V/230 V tlO% -22% (Japan)
(78352C): 100 V/200 V +lO% -22% (Japan)
Frequency:
50/60 Hz
Power consumption:
75 W (max)
(78352C): 55 W (max)
Environment:
Operating temperature:
0” to 55°C
(78352C): 0” to 40°C
Storage temperature &
relative humidity:
-40° to +75OC & 5% to 95%
Size:
160 mm high, 320 mm wide, 405 mm deep
Weight:
11 kg (24 lbs)
Trends stored at power off condition for a minimum of 1 hour.
Technical Specifications for all Monitors
2c-1
Display
Superaster video display:
Screen size:
140 mm x 105 mm; 178 mm diagonal
Sweep speed:
12.5 mm/s, 25 mm/s or 50 mm/s gives
8 s, 4 s or 2 s of display respectively.
(For respiration a speed of 6.25 mm/s is also available.)
Display mode:
fixed trace (moving bar).
Waveform display height:
Channel 1 64mm f 10%
(78352C): 55mm f 10%
Numeric update time:
2s
Resolution:
256 dots vertical, 500 dots horizontal.
500 dots horizontal.
ECG Channel (Full lead)
ECG Amplifier
Patient Safety:
Protected against defibrillator
Differential
input
and electrosurgery potentials.
Standard full lead selector.
impedance:
5 Mohm (at 10 Hz and including patient cable). (at 10 Hz and including patient cable).
Common
n
n
Mode Rejection
Ratio:
FILTering 110 dB (with Resp. >106 dB)
DIAGnostic 90 dB (with Resp. > 84 dB) at 1ine frequency with patient cable and 51
kohm/47 nF imbalance.
Electrode
offset potential:
f0.5 V max.
Baseline recovery:
1 s after defibrillation.
Noise:
35 uVpp, measured in the DIAGnostic mode
and referred to the input, with each lead
connected to ground through shielded
51 kohm/47 nF.
Cardiotach
Digital cardiotach
AUTO
MODE
Heart rate depends on upper alarm limit setting;
Upper alarm limit setting:
5 150
Range:
15 to 2 x upper alarm limit
Upper alarm limit setting:
> 150
Range:
15 to 300 bpm
202
Technical Specifications for all Monitors
Accuracy:
f 1%.
Resolution:
1 bpm.
Sensitivity:
200 UV peak.
Pace pulse rejection:
meets requirements of AAMI EC13-1983 standard for Cardiac
monitors (Automode).
MANUAL
MODE
Heart rate range:
15 to 300 bpm.
Accuracy:
f 1%
Resolution:
1 bpm.
Sensitivity:
-5 mV to t5 mV.
Display gain:
3 mm/mV to 30 mm/mV (channel 1).
(78352C only): 6 mm/mV to 55 mm/mV.
Analog output
ECG wave on phone-jack.
Gain:
320 to 3200 (dependent on display gain).
Bandwidth:
FILTering 0.5 to 25 Hz (OR),
0.5 to 100 Hz (ICU).
DIAGnostic 0.05 to 100 Hz (OR and ICU).
Baseline offset:
5100 mV at gain 1000.
Alarms
Technical alarm:
Leads Off.
Medical alarms:
Asystole
Ventricular Fibrillation
Heart rate
Alarm delay:
High rate < 10 s
Low rate < 6 s
Test/Calibration
ECG simulated test waveform and numerics:
n
n
100 bpm f2, waveform 1.5 cm pp.
(78352C Only): waveform 2.7 cm pp.
Calibration signal: 1 mV *lo%
ST Segment Monitoring (76354-66722)
Leads: One selectable from I, II, III, a VR, a VL, MCLl,
used.
V, depending on the patient cable
ST measurement:
Median value updated every 15 seconds.
Resolution:
Fixed: f 0.3 mm
Technical Specifications for all Monitors
2c-3
Measurement Range:
-20 mm to i-20 mm
Measurement Points Range:
Isolectric points range: -280 ms to t280 ms
ST point range: 0 to +280 ms
Measurment point resolution: 4ms
ST measurement points
Reference:
Referred to R wave of QRS complex
Trends:
20 min, l/2,4,8
and 24 h at
(10 set/l min) resolution.
Trend Types:
Graphical: 78354C, Tabular: 78352C
Event marker: (available in
Graphical trends only)
Automatic annotation: measurement points change, ECG
lead change.
Manual annotation available to the user at any time.
Parameter Display:
Permanent display of ST value
below HR numeric.
Physiological Alarms:
Range: -10 mm to +lOmm
Adjust steps: 0.2 mm
Alarm Delay: 30 sec.
Inop Alarms
Technical alarms:
“Erratic ST” occurs when the variation between measured ST
values over the sampling period exceeds limits for valid data.
“Can’t analyse ST” occurs when insufficient good beats are
collected over the sampling period to produce an ST value.
“ST paced beats” occurs when insufficient good beats are
collected and more than 50% of the beats are paced over the
sampling period.
Noninvasive Blood Pressure (NIBP)
General
Oscillometric method (with inflatable cuff) determines Mean arterial pressure (MAP), systolic
and diastolic pressure.
Cuff pressure range:
0 to 280 mmHg (37 kPa),
automatically released if pressure
exceeds 315 f 10 mmHg (42 f 1.5 kPa).
Inflation time:
6 to 10 s (to 280 mmHg) typical using standard adult cuff.
Deflation time:
30 to 35 s typical.
Cuff pressure accuracy:
Better than f3 mmHg (f0.4% kPa)
for ambient temperature 15°C to 25”C,
Better than f3 mmHg (t0.6% of reading)
for ambient temperature 10’ to 35°C
2c-4
Technical Specifications for all Monitors
Better than f3 mmHg (i-1.7% of reading)
for ambient temperature 0’ to 55°C.
Add rounding error of &l/2
digit (= f0.5 mmHg of f0.05 kPa) to above accuracies.
Measurement Range:
Systolic:
Diastolic:
MAP:
Note
30 to 270 mmHg (4 to 36 kPa).
10 to 245 mmHg (1.3 to 32 kPa).
20 to 255 mmHg (2.6 to 34 kPa).
Measurements are only possible in the heart range 40 to 220 bpm.
I
IF
Modes
Auto:
m Measurements are automatically
30 and 60 min).
repeated with a time interval set by the user (2, 5, 10, 15,
Manual:
w A single measurement is taken.
Statim:
n
(If fitted). A series of ten measurement cycles are taken over a five minute period. Only one
QRS complex causing a pressure oscillation in the cuff is sensed at each inflation level.
Alarms
High and low pressure.
Alarm Limit Adjustment
78352C:
n
5mmHg (1kPa) steps,
n
2mmHg (0.5kPa) steps, range 10 - 30 mmHg (1.5 - 4 kPa)
Temperature Channel
Range:
15°C to 45°C.
Resolution:
O.l”C.
Accuracy (at 0°C to 40°C
ambient temperature):
fO.l”C (25.O”C to 45.O”C)
f0.2OC (15.O”C to 24.9OC)
Average time constant:
10 s (At = 15OC)
Numeric display update time: 2 s. If out of range, no display. No alarm given.
Test temperature:
Tl = 40°C)
T2 = 25°C + O.l”C,
AT = 15°C f O.l”C.
Technical Specifications for all Monitors
205
Trend
General
One long trend (24, 8, 4, or 2 h) and one short trend (60 or 20 mins) available on each
parameter. Points on trend curve are averaged values. Alarms are shown as actual values.
Power off, INOP and Alarms off are indicated.
ECG Channel
Heart rate trend;
Range:
20 to 180 bpm.
Resolution:
1 bpm.
Display points per trend
curve:
384
Pressure Channel
The systolic, diastolic and mean values are combined in one display.
Range:
dependent on selected pressure scale.
Resolution:
1.2 mmHg (0.16 kPa).
Display points per trend
96
curve:
Each point contains one systolic, one diastolic and two mean readings.
Dual Temperature Channel
Tl and T2 are displayed. T trend is directly readable from the display.
Range:
25°C to 42°C.
Resolution:
O.l”C.
Display points per trend
table:
337 (Tl) and 48 (T2).
System Interface
System outputs
Wave
Bandwidth:
FILting 0.5 - 25 Hz (OR), 0.5 - 1OOHz(ICU).
DIAGnostic 0.05 - 100 Hz (OR and ICU).
Gain:
Variable between 320 and 3200,
dependent on display gain.
DC Output
(HR):
Range:
15bpm to 300 bpm = 0.15 V to 3 V;
0 V for < 15 bpm
Accuracy:
f 5 bpm
206
Technical Specifications for all Monitors
1 bpm.
Resolution:
SpOs/Pleth
SpOs is measured using a dual wavelength optical transducer. It measures pulse and SpO,.
Range:
0% to 100% saturation
Numeric display:
Averaging period selectable
l/2/4/8/16
beats, with default 4.
Settling time:
Typ. < 5 s
Accuracy:
1SD
80% to 100% f 1.5%
65% to 80% f 2.5%
0% to 65% unspecified
Accuracy NELLCOR SpOz
Transducers (78352C):
1SD
80% to 100% 5 3.0%
Alarms
Lower Alarm range:
50-95%, step l%, default=90%
Upper Alarm range:
70-99%, OFF, step l%, default=OFF
Alarm delay:
6s
(78352C):
10 s
HR derived from Pleth
High rate 10 s
Low rate 6 s
Alarm delay:
Pleth Amplifier
Bandwidth:
0.8-11.0 Hz f 25%
Settling time:
<3s
Cardiotach
Range:
30-300 bpm
Accuracy:
fl%
Resolution:
1 bpm
Technical Specifications for all Monitors
2c-7
Graticule lines
Lower line:
25% of wave channel
Upper line:
75% of wave channel
Autofix:
50% of wave channel, peak values on Pleth graticule lines. Gain
frozen after approximately 60 s.
Test
SpO, test signal:
100%
Pleth test signal:
50% of wave channel, 100 bpm.
206
Technical Specifications for all Monitors
Technical Specifications
78353A
This section contains the technical specifications for the 78353A. The general instrument
specifications are followed by those for the individual parameters:
General
Patient safety:
n
n
option NO4 meets safety requirement UL544
option NO2 meets safety requirement IEC 601-l
Power requirements:
Operating voltage:
115 V/230 V +10% -15% (IEC/USA)
115 V/230 V t 10% -22% (Japan)
Frequency:
50/60 Hz,
Power consumption:
55 w
Environmental:
Operating temperature:
0°C - 55°C
Storage temperature:
-40°C - f75”C
Size:
78353A 160 mm high, 320 mm wide, 405 mm deep
Weight:
78353A 11 kg (24 lbs)
Display
Superaster
video display:
Screen size:
140 mm x 105 mm; 178 mm diagonal
Sweep speed:
12.5 mm/s, 25 mm/s or 50 mm/s gives
8 s, 4 s or 2 s of display respectively
Display mode:
fixed trace (moving bar)
Waveform display height:
Channel 1
30 mm +/-
10%
32 mm +/-
10%
64 mm +/-
10%
-----------------------------------
Channel 2
normal
mode
Channel 3
----------------------------------Channel 2
overlapping
mode
Channel 3
Numeric update time:
2s
Resolution:
256 dots vertical,
500 dots horizontal.
Technical Specifications for all Monitors
2c-9
ECG Channel (3 lead)
ECG Amplifier
Patient safety:
Protected against defibrillator and electrosurgery
potentials. Standard full lead selector.
Patient isolation:
12 MOhm below 60 Hz
Differential input impedance:
5 MOhm
(at 10 Hz and including patient cable)
Common Mode Rejection Ratio:
FILTering 110 dB
DIAGnostic 90 dB at line frequency with patient cable
and 51 kohm /47 nF imbalance
Auxiliary
100 nA
current:
Electrode offset potential:
f 0.5 V max.
Baseline recovery:
2 s after defibrillation
Noise:
35 uVpp, measured in the DIAGnostic mode
and referred to the input, with each lead
connected to ground through shielded
51 kOhm/47 nF.
Maximum input signal:
&5mV
Cardiotach
Digital cardiotach:
Heart rate depends on upper alarm limit setting.
Upper alarm limit setting:
< 150
Range:
15 - 300 bpm,
(15 - 2 x upper heart rate limit)
Accuracy:
&l%
Resolution:
1 bpm
Sensitivity:
200 UV peak
Pace pulse rejection:
pace pulse width 0.2 - 2 ms any amplitude, relaxation time
constant 15 ms to 200 ms
Analog Output
ECG wave on phone-jack:
Constant gain:
1000
Bandwidth:
FILTering 0.5 - 30 Hz
DIAGnostic 0.05 - 100 Hz
Baseline offset:
< 100 mV at gain of 1000
2010
Technical Specifications for all Monitors
Alarms
Technical alarm:
Leads Off, occurs if electrode is detached, dry, or if
electrode offset potential out of spec.
Indication:
Three dashes flash in place of heart rate numerics and
audible alarm is given.
Medical alarms:
Asystole occurs when interval between two QRS
complexes exceeds 4 seconds.
Indication:
< 15 numerics flash and audible alarm is given.
Alarm range :
15-150 bpm, in steps of 5 bpm.
Heart rate alarm occurs when heart rate is outside of
selected alarm limits.
Indication:
Flashing heart rate numerics and audible alarm given.
Alarm delay:
High rate 10 s
Low rate 6 s.
Test
n
ECG simulated test waveform and numerics: 100 bpm & 2, waveform 1.5 cm pp
n
Calibration signal: 1 mV h 10%
Trend Mode
In trend mode, an averaged heart rate is displayed instead of the ECG waveform.
w Range: 50 to 210 bpm
n
Resolution:
1 bpm
In all trend modes, actual high or low HR alarms are shown as peaks of the appropriate
height.
Plethysmograph
Channel
Pleth. amplifier
Bandwidth:
0.8 - 11.0 Hz zt25%.
Settling time:
< 3 s.
Cardiotach
Range:
15-300 bpm.
Accuracy:
f 1%.
Resolution:
1 bpm.
Trigger sensitivity:
5 mm pp (32 mm display),
10 mm pp (64 mm display).
Technical Specifications for all Monitors
2011
Graticule lines
Lower line:
25% of wave channel.
Upper line:
75% of wave channel.
Autofix:
50% of wave channel, peak values on Pleth graticule lines. Gain
frozen after approx. 60 s.
Test
Pleth test signal:
50% of wave channel, 100 bpm.
Alarms
Medical Alarm:
Heart Rate derived from PLETH.
Alarm delay:
High rate 10 s
Low rate 6 s.
Pressure Channel
Pressure amplifier
Range:
-30 mmHg to i-300 mmHg
-4 kPa to +40 kPa
Sensitivity:
Automatic: 5 uV/V/mmHg
(37.5 uV/V/kPa)
Manual: 40 uV/V/ mmHg (300 uV/V/kPa)
Storage cycles of sensitivity values: 1000 cycles
Gain accuracy:
f 1%
Gain stability:
f 0.1 mmHg/‘C
Non-linearity:
0.5%
Bandwidth:
12 Hz
Minimum transducer load:
120 Ohm
f 0.013 kPa/“C
Auto zero
Range:
f 200 mmHg (& 26 kPa)
Zero accuracy:
f 1.0 mmHg (& 0.13 kPa)
Zero drift:
0.1 mmHg/‘C
Response time:
1s
2012
(0.013 kPa/‘C)
Technical Specifications for all Monitors
Pressure wave display
normal 3 channel wave range 32 mm overlapping wave 64 mm
Graticule lines:
Graticule line labelling and resolution:
Graticule
line labelling
lower
uPPer
0
30
0
60
0
120
0
180
Grat icule
line labelling
lower
upper
0
3
0
6
0
15
0
24
Range (mm&)
-5 -10 -20 -30 Range (kPa)
-0.5
-1.0
-2.5
-4.0
-
+45
+so
+180
t270
t4.5
cl.0
t22.5
-36.0
Resolution
64 mm
8
16
32
48
(mmHg/cm)
32 mm
16
32
64
96
Resolution
64 mm
0.78
1.56
4.16
6.25
(kPa/cm)
32 mm
1.56
3.12
8.33
12.5
Alarms
1. High and low pressure alarms occur when selected pressure is outside alarm limits.
Indication:
flashing pressure numerics and audible alarm.
Alarm delay:
8s
2. Transducer disconnect alarm occurs when transducer not connected to instrument.
Pl (or P2) NO TRANSDUCER message,
three dashes flash in place of
pressure numerics and audible alarm.
Indication:
3. Pressure disconnect alarm occurs when mean pressure falls below 10 mmHg
Indication:
Pl (or P2) DISCONNECT message,
flashing numerics and audible alarm.
Alarm delay:
8s
Calibration/test signal
Calibration signal (steps):
30/60/120/180 mmHg
(3/6/15/24 kPa)
Simulated Test waveform and Pl: 180 mmHg (24 kPa)
numerics (rate 100 bpm):
P2: 60 mmHg (6 kPa)
Duty cycle:
50% and frequency corresponds to 100 bpm.
Rear panel output
Output voltage range:
-0.3 V to j-3.0 V
Resolution:
10 mV/mmHg
(75 mV/kPa)
Technical Specifications for all Monitors
2013
Temperature Channel
Patient safety:
Leakage current: 10 uA
Dielectric strength: 5 kV
Range:
15OC to 45°C
Resolution:
O.l”C
Accuracy:
f O.lOC (25.0°C to 45.0°C)
f 0.2OC (15.OOCto 24.9OC)
Average time constant:
10 s (At = 15OC)
Numeric display update time: 2 s
No temperature display if measured temperature is beyond limits.
Test temperature:
40°C
No temperature alarm
Test temperature:
Tl = 40°C,
T2 = 25°C f O.l”C,
AT = 15OC f O.l”C.
Auxiliary Input Channel
General
Input impedance:
> 50 kOhm
Input voltage :
35 v
Bandwidth:
> 20 Hz
Input voltage range
(waveform):
Input sensitivity:
f 1.6 V
1 cm/V (32 mm waveform channel)
2 cm/V (64 mm waveform channel).
Baseline for external devices: 50% of waveform
No graticule lines.
Auxiliary input - 78205D Pressure module
(mmHg only. Not possible with Option E20).
2c-14
Technical Specifications for all Monitors
Graticule line labelling and resolution
As for Pressure Channel, see table.
Wave Input
Sensitivity:
45 mmHg range; 62.5 mm/V
90 mmHg range; 31.3 mm/V
180 mmHg range; 15.6 mm/V
270 mmHg range; 10.4 mm/V
DC-Input
Range:
O-300 mmHg (35 kPa).
Sensitivity:
100 mmHg/V
Accuracy:
f3 mmHg (0.3 kPa).
(10 kPa).
Auxiliary input - 47210 Capnometer
Wave Input
Sensitivity:
O-60 mmHg (0.9 kPa) range; 9.5 mm/V (6.3 mm/V),
graticule line at 40 mmHg (6 kPa).
0 - 90 mmHg (0 - 13.5 kPa) range; 6.3 mm/V (4.2
mm/V) graticule line at 60 mmHg (9 kPa).
DC-Input
Range:
O-150 mmHg (O-17.5 kPa).
Sensitivity:
50 mmHg/V
Accuracy:
f3 mmHg (i-O.3 kPa).
Speed selection:
6.25 mm/s.
(5 kPa/V).
Technical Specifications for all Monitors
2c-15
System 780 Annotating Interface
There is no annotation of NIBP and SpOz values.
Note
Auxiliary signals and parameters.
Internal processing accuracy:
f 50 mV
Selectable channels for external recorder.
Internal processing accuracy:
f 50 mV
Delay mode:
12 s delay time
Bandwidth:
Channel 1: 0 Hz to 50 Hz
Channel 2: 0 Hz to 15 Hz
Parameters off condition:
-1 v
ECG System Outputs
Wave.
Bandwidth:
FILtering 0.5 Hz to 25 Hz
DIAGnostic 0.05 Hz to 100 Hz
Amplitude:
2.5 Vpp (at 50% display)(78354A).
Gain:
variable between 320 and 3200,
dependent on display gain.
DC output (HR)
Range:
15 bpm to 300 bpm = 0.15 V to 3 V;
< 15 bpm = OV
Accuracy:
f 5 bpm
Resolution:
1 bpm
Pressure system outputs
The following accuracies are additional to those given in the Pressure Channel data.
Wave (All the following voltages are f 50 mV.).
Range (absolute):
-0.25 V to 2.7 V = -25 to 270 mmHg
Range (scaled):
- 5 to 45 mmHg = -0.50 V to 4.5 V,
- 10 to 90 mmHg = -0.50 V to 4.5 V,
-20 to 180 mmHg = -0.40 V to 3.6 V,
-25 to 270 mmHg = -0.25 V to 2.7 V.
Range (absolute):
-0.33 V to 3.6 V = -25 to 270 mmHg
2c-18
Technical Specifications for all Monitors
Range (scaled):
-0.5 to 4.5 kPa = -0.50 V to 4.5 V,
- 1.0 to 9.0 kPa = -0.50 V to 4.5 V,
-2.5 to 22.5 kPa = -0.50 V to 4.5 V,
-3.3 to 36.0 kPa = -0.33 V to 3.6 V.)
Bandwidth:
0 Hz to 12 Hz.
DC Output
Range (systolic, diastolic and
mean) :
-30 mmHg to 300 mmHg = -0.3 V to 3 V IfI 50 mV
(-4 kPa to 40 kPa = -0.4 V to 4 V f 50 mV)
Scaled wave on selectable channels for external recorder with offset of -2 V.
Plethysmograph system outputs
Wave.
Amplitude:
2.5 Vpp (at 50% display)
DC output (HR).
Range:
15 bpm to 300 bpm = 0.15 V to 3 V;
<15bpm=OV
Accuracy:
f 5 bpm
Resolution:
1 bpm
Temperature system output
DC output.
Range:
15OC to 45°C = -0.5V to 2.5 V
Accuracy:
f O.lOC for 25OC < T < 45°C
f 0.2”C for 15°C < T < 24.9OC
Resolution:
O.l”C (at ambient temperature of 0°C to 406C)
Note
The only temperature available at the system output is Tl.
Technical Specifications for all Monitors
2~17
System 780 Non-Annotating
Interface
ECG Wave
Frequency response:
FILTering 0.5 Hz to 25 Hz
DIAGnostics 0.05 Hz to 100 Hz
Output amplitude:
2.5 Vpp - at 50% display
5 Vpp - at 100% display
Heart Rate
Range:
15 to 300 bpm = 0.15 to 3 V
< 15 bpm = 0 V
Accuracy:
f 3 bpm
Control Signals
Reset:
active < 0.3 V/30 mA
Alarm off:
active < 1.1 V/30 mA
INOP:
active < 1.1 V/30 mA
Patient alarm:
active < 1.1 V/30 mA
Alarm Relay (only loaded on request)
Voltage:
30 V dc
Current:
2A
Resist ante:
50 mohm
2018
Technical Specifications for all Monitors
Technical Specifications
- 78353B and 78354A/C
This section contains the technical specifications for the 78353B and 78354A/C. The technical
specifications are the same for both instruments with the following exceptions:
a. the 78354A/C can be configured to include NIBP, CO2/02 and SpOz.
b. The 78353B is a 3/4 module instrument and the 78354A is a full module instrument
instrument. The 78354C comes in both sizes. The general instrument specifications are
followed by those for the individual parameters:
General
Patient safety
All inputs are CF-type.
w Option NO1 meets safety requirements CSA(C22.2 No.125)
w Option NO2 meets safety requirements of IEC 601-l.
n Option NO4 meets safety requirements of UL 544.
n Defibrillator
protection up to 5 kV.
n
Power requirements
Operating voltage:
115 V/230 V -i-10% -15% (IEC/USA)
115 V/230 V i-10% -22% (Japan)
(78352C):lOO V/200 V +15% - 5% (Japan)
Frequency:
50/60 Hz,
Power consumption,
78353B - 75 W (max)
78354A/C - 80 W (max)
Enviromental
Operating temperature
0°C to 55°C
Storage temperature
-40°C to t75Oc
Relative humidity
5% to 95%
Size: 78353B/4C
160 mm high, 320 mm wide, 405 mm deep
Size: 78354A/C
160 mm high, 425 mm wide, 405 mm deep
Weight: 78353B/4C
11 kg (24 lbs)
Weight: 78354A/C
14 kg (31 lbs)
Trends stored at power off condition for a minimum of 1 hour,
Technical Specifications for all Monitors
2c-19
Display
m Superaster video display
Screen size:
140 mm x 105 mm; 178 mm diagonal
Sweep speed:
12.5 mm/s, 25 mm/s or 50 mm/s gives
8 s, 4 s or 2 s of display respectively.
(For respiration a speed of 6.25 mm/s is also available.)
Display mode:
fixed trace (moving bar).
Waveform display height:
30 mm + 10%
Channel 1
_---------------------------------normal
Channel 2
32 mm + 10%
mode
Channel 3
_---------------------------------overlapping
Channel 2
64 mm + 10%
mode
Channel 3
Numeric update time:
2s
Resolution:
256 dots vertical,
500 dots horizontal.
ECG Channel (Full lead)
ECG Amplifier
n
Patient safety: Protected against defibrillator
lead selector.
and electrosurgery potentials.
Standard full
Differential input impedance:
5 Mohm
(at 10 Hz and including patient cable).
Common Mode Rejection
Ratio:
FILTering 110 dB (with Resp. > 106 dB) DIAGnostic 90 dB
(with Resp. > 84 dB) at 1ine frequency with patient cable and
51 kohm/47 nF imbalance.
Electrode offset potential:
f0.5 V max
Baseline recovery:
1 s after defibrillation.
Noise:
35 uVpp, measured in the DIAGnostic mode and referred to
the input, with each lead connected to ground through shielded
51 kohm/47 nF.
Cardiotach
Digital cardiotach
AUTO MODE
Heart rate depends on upper alarm limit setting.
Upper alarm limit setting:
1150
Upper alarm limit range:
15 to 2 x upper alarm limit
2020
Technical Specifications for all Monitors
Upper alarm limit setting
1150
Upper alarm limit range:
15 to 300 bpm
Accuracy:
f 1%
Resolution:
1 bpm
Sensitivity:
200 UV peak
Pace pulse rejection:
meets requirements of AAMI EC13-1983 standard for Cardiac
monitors (Automode).
MANUAL
MODE
Heart rate range:
15 to 300 bpm
Accuracy:
f 1%
Resolution:
1 bpm
Sensitivity:
-5 mV to 4-5 mV
Display gain:
3 mm/mV
to 30 mm/mV
(channel 1)
Analog output
n
ECG wave on phone-jack.
Gain:
320 to 3200 (dependent on display gain).
Bandwidth:
FILTering 0.5 to 25 Hz (OR),
0.5 to 100 Hz (ICU).
DIAGnostic 0.05 to 100 Hz (OR and ICU).
Baseline offset:
5100 mV at gain 1000.
Alarms
Technical Alarm:
Leads Off
Medical Alarms:
Asystole.
Ventricular Fibrillation.
Heart rate
Alarm delay:
High rate < 10 s
Low rate < 6 s
Test/Calibration
ECG simulated test
waveform and numerics:
1OObpm f2, waveform 1.5 cm pp
Calibration signal:
1 mV flO%
ST Segment Monitoring (78354-66722)
Leads:
One selectable from I, II, III, a VR, a VL, MCLl,
on the patient cable used.
ST measurement:
Median value updated every 15 seconds.
Resolution:
Fixed: f 0.3 mm
V, depending
Technical Specifications for all Monitors
2~21
Measurement Range:
-20 mm to +20 mm
Measurement Points Range:
Isolectric points range:
-280 ms to i-280 ms
ST point range: 0 to i-280 ms
Measurment point resolution: 4ms
ST measurement points
reference:
Referred to R wave of QRS complex
Trends:
20 min, l/2,4,8
and 24 h at
(10 set/l min) resolution
Trend Types:
Graphical: 78354C, Tabular: 78352C
Event Marker: (available in
graphical trends only)
Automatic annotation: measurement points
change, ECG lead change
Manual Annotation: available to the
user at any time.
Parameter Display:
Permanent display of ST value
below HR numeric
Physiological Alarms:
Range: -10 mm to +lOmm
Adjust steps: 0.2 mm
Alarm Delay: 30 sec.
Inop Alarms / Technical
Alarms:
‘Erratic ST’ occurs when the variation between measured ST
values over the sampling period exceeds limits for valid data.
‘Can’t analyse ST’ occurs when insufficient good beats are
collected over the sampling period to produce an ST value.
‘ST paced beats’ occurs when insufficient good beats are
collected and more than 50% of the beats are paced over the
sampling period.
Plethysmograph
Channel
Pleth. amplifier
Bandwidth:
0.8 - 11.0 Hz f:
Settling time:
53s
25%
Cardiotach
Range:
15-300 bpm
(78354C): 30-300 bpm
Accuracy:
f 1%
Resolution:
1 bpm
Trigger
sensitivity:
5 mm pp (32 mm display)
10 mm pp (64 mm display)
2022
Technical Specifications for all Monitors
Graticule lines
Lower line:
25% of wave channel
Upper line:
75% of wave channel
Autofix
50% of wave channel, peak values on Pleth graticule lines. Gain frozen after - 60 s.
Test
Pleth test signal: 50% of wave channel, 100 bpm.
Alarms
Medical Alarm:
Heart Rate (derived from PLETH).
Range:
15 to 250 bpm.
Alarm delay:
High rate 10 s,
Low rate 6 s.
Pressure Channel
Pressure amplifier
Range:
-25 mmHg to f300 mmHg
(-3.3 kPa to i-40 kPa)
Sensitivity:
5 uV/Vf mmHg (37.5 uV/V/kPa)
or 40 uV/V/mmHg (300 uV/V/kPa)
selected automatically
Transducer load impedance:
120-500 Ohm
Gain accuracy:
f 1%
Gain stability:
f 0.1 mmHg/OC (f 0.013 kPa/“C)
Gain adjustment range:
f 10%
(78354C): &7%
Non-linearity:
0.5%
Bandwidth:
0 to 12 Hz
Auto zero
Range:
f 200 mmHg (III 26 kPa)
Zero accuracy:
f 1.0 mmHg ( f 0.13 kPa)
Zero drift:
0.1 mmHg/‘C
Response time:
1s
(0.013 kPa/‘C)
Technical Specifications for all Monitors
2c-23
Pressure wave display
Normal 3 channel wave range 32 mm,
Overlapping wave 64 mm
Graticule lines:
Graticule line labelling and resolution:
Range (mmHg)
-5 -10 -20 -25 Range (kPa)
-0.5
-1.0
-2.5
-3.3
-
+45
+so
+180
+270
+4.5
+s.o
+22.5
+36
Graticule
line labelling
lower
upper
0
3
0
60
0
120
0
180
Graticule
line labelling
lower
upper
0
3
0
6
0
15
0
24
Pulse Rate
Derived
from Pl only (not available
with Opt.E20).
Range:
25 to 300 bpm
Accuracy:
Itl%
Resolation:
1 bpm
Alarms
Technical Alarms:
Transducer disconnect.
Pressure disconnect
Alarm delay:
8s
Medical Alarms:
High and low pressure
Alarm delay:
8s
Pulse rate:
Range 25 to 250 bpm
Test/calibration
Calibration signal (steps):
30/60/120/180 mmHg
(3/6/15/24 kPa)
Simulated test waveform and Pl: 120 mmHg 15 kPa
numerics:
P2: 60 mmHg 6 kPa
2024
Technical Specifications for all Monitors
Resolution
(mmHg/cm)
overlapping
normal
8
16
16
32
32
64
48
96
Resolution
overlapping
0.78
1.56
4.16
6.25
(kPa/cm)
normal
1.56
3.12
8.33
12.5
Noninvasive Blood Pressure (NIBP)
General
Oscillometric method (with inflatable cuff) determines Mean arterial pressure (MAP), systolic
and diastolic pressure.
Cuff pressure range:
0 to 280 mmHg (37 kPa), automatically released if pressure
exceeds 315 f 10 mmHg (42 f 1.5 kPa).
Inflation time:
6 to 10 s (to 280 mmHg) typical using standard adult cuff.
Deflation time:
30 to 35 s typical
Cuff pressure accuracy:
better than f3 mmHg (f0.4% kPa)
for ambient temperature 15°C to 25°C
better than f3 mmHg (ztO.S% of reading)
for ambient temperature 10°C to 35”C,
better than rt3 mmHg (i-1.7% of reading)
for ambient temperature 0°C to 55°C.
Add rounding error of f l/2 digit (= f0.5 mmHg of f0.05 kPa) to above accuracies.
Measurement Range:
30 to 270 mmHg (4 to 36 kPa)
10 to 245 mmHg (1.3 to 32 kPa)
20 to 255 mmHg (2.6 to 34 kPa)
Systolic:
Diastolic:
MAP:
Note
Measurements are only possible in the heart range 40 to 220 bpm.
I
Q
Modes
w Auto:..measurements are automatically repeated with a time interval set by the user (2, 5,
10, 15, 30 and 60 min).
n MunzlaZ:..a single measurement is taken.
n Statim:..(If
fitted) A series of ten measurement cycles are taken over a five minute period.
Only one QRS complex causing a pressure oscillation in the cuff is sensed at each inflation
level.
Alarms
High and low pressure.
Alarm Limit Adjustments (78354C):
n
n
5 mmHg (1kPa) steps
2 mmHg (0.5kPa steps for 10 to 30 mmHg (1.5 to 4kPa)
Technical Specifications for all Monitors
2c-25
Respiration Channel
Respiration amplifier
Patient Protection:
Protected against defibrillator
Differential input impedance:
> 1 Mohm
(at < 50 Hz with ECG in parallel)
Sensing current:
< 80 uA rms, measured at 62.5 kHz
Isolation voltage:
5 kV
Noise:
(display) < 3 mm measured at full size
Test signal:
amplitude equivalent to impedance change
of 1 ohm f 10% at a rate of 25 f 5%
Respiration trigger
Monitor automatically
sets to automatic triggering
AUTO MODE:
Auto trigger level is set automatically
Sensitivity:
< 180 mohm at a Resp. rate of 30 rpm
Respiration rate range:
4 to 100 rpm
Accuracy:
f 3 rpm
MANUAL
MODE:
Nominal level:
Trigger level dependent on display size
M Triggermark. Signals must be greater
than this mark to be triggered.
Alarms
Respiration rate:
High rate 10 s Alarm delay: \HR/RR
only)
Apnea: Alarm delay:
10 s - 40 s
coincidence (manual mode
Fractional Inspired Oxygen
Range:
10% to 110%
Resolution:
1%
Instrument Accuracy:
f 2.5% of full Scale (21% calibration) or
f 2.0% of full Scale (100% calibration).
Warm up time using 15203A from standby, less than 1 min,
transducer:
unpolarized, less than 2 hours
Instrument back up time
(internal battery):
2026
greater than 4 days.
Technical Specifications for all Monitors
Alarms
Medical Alarms
(audible and visual):
High 02 alarm
(limit selectable from 24 to 100%)
Low 02 alarm
(limit selectable from 18 to 90%)
Alarm delay:
15 s
Technical Alarm (audible and Transducer disconnected
Break in sensor cable.
visual):
Test Signal:
21% 02
Carbon Dioxide
General
Warm up Time:
15 min. (accuracy within 0.3 mmHg CO2).
(78354C): 30 min. (accuracy within 0.3 mmHg of its
final value).
Stability:
fl
Response Time:
< 125 ms (for step from 10% to 90%)
mmHg (over 7 day period).
The following errors are due to 02/N20
accuracies given in the sections below.
compensation and are additional to instrument
I. Continuous measurement of 02 (02 between 10% and 100%)
a. 02 compensation: error in CO2 reading less than 61%.
b. N20 compensation (N20 is assumed to be 100% minus 02%): error in CO2 reading less
than &l%.
II. Standard compensation (02 parameter off)
a. 02 compensation (45% 02 assumed): error in CO2 reading lessthan f3%, for actual 02
concentrations of 20% to 70%.
b. N20 compensation (if selected, 55% N20 assumed): error inCO2 reading less than
&6%, for actual 02 concentrations of 20% to 70% and actual N20 concentrations of
30% to 80%.
instantaneous CO2 Wave Display
Waveform displayed, with graticule lines, in channel 2 (height 32 mm) or over channels 2 and
3 (height 64 mm).
End Tidal CO2 Numerical Display
Range:
1 to 150 mmHg (0 to 20 kPa)
Instrument accuracy:
f2 mmHg (0.29 kPa) &l/2 LSD*
(CO2 = 0 to 40 mmHg (5.34 kPa),
f5.5% &l/2 LSD
(CO2 = 40 mmHg (5.34 kPa)
Technical Specifications for all Monitors
2c-27
to 100 mmHg (13.3 kPa)).
*LSD = Least Significant Digit,
Respiration Rate Numerical Display
Range:
0 to 150 rpm
Instrument Accuracy:
f 2 rpm
Alarms
Medical Alarms (audible and CO2 WAVE Inspired Minimum
Indicated when minimum value of CO2 wave
visual):
lies above 4 mmHg (0.53 kPa).
End Tidal CO2:
l.High CO2
Limit selectable from 20 to 100 mmHg
(2 to 14 kPa)
2.Low co2
Limit selectable from 10 to 95 mmHg
(1 to 13 kPa)
Alarm Delay:
15 s
Respiration Rate:
High respiration rate
’
Alarm delay:
10 s
Apnea alarm (no change in
instananeous CO2 value):
Alarm delay:
selectable from 10 to 40 s.
Technical Alarms (audible
and visual):
Test Signal:
Transducer disconnected.
O/40 mmHg (O/6 kP a ) square wave at 25 rpm, 50% duty cycle.
Graticule Line Labelling and Resolution:
Range hmHg)
0
0
to
to
60
90
Craticule
Line Labeling
Lower
Upper
0
40
0
60
Range (kPa)
0
0
2c-28
to
to
9
13.5
Lower
0
0
Upper
6
9
Technical Specifications for all Monitors
Resolution
32 mm scale
20.8
31.2
(mmHg/cm)
64 mm scale
10.4
15.6
Resolution
(kPa/cm)
32 mm scale 64 mm scale
3.12
1.56
4.69
2.34
Temperature Channel
Range:
15OC to 45OC
Resolution:
O.l”C
Accuracy (at 0°C to 40°C
ambient temperature):
fO.l”C
f0.2°C
Average time constant:
10 s (At = 15OC)
(25.O”C to 45.O”C)
(15.O”C to 24.9”C)
Numeric display update time: 2 s
If out of range, no display.
No alarm given.
Tl = 40°C
T2 = 25OC f O.l”C,
AT = 15°C i O.l”C.
Test temperature:
Auxiliary Input Channel
General
Input impedance:
> 50 kohm
Max. voltage:
35 v
Bandwidth:
2 20 Hz
Input voltage range
(waveform):
xt ;1.6 V
Input sensitivity:
1 cm/V (32 mm waveform channel).
2 cm/V (64 mm waveform channel).
Baseline for external devices: 50% of waveform.
No graticule lines.
Auxiliary input - 78205D Pressure module
(mmHg only. Not possible with Opt.E20).
Graticule line labelling and resolution.
As for Pressure Channel, see table.
Wave Input
Sensitivity
DC Input
Range :
Sensitivity:
Accuracy :
:
45 mmHgrange; 62.5 nun/V
90 mmHgrange; 31.3 mm/V
180 mmHgrange; 15.6 mm/V
270 mmHgrange; 10.4 mm/V
o-300 mmHg (35 kPa)
100 rnmHg/V (10 kPa)
+3 mmHg (0.3 kPa)
Technical Specifications for all Monitors
2c-29
Auxiliary input - 47210 Capnometer
Wave Input Sensitivity:
O-60 mmHg (O-9 kPa) range;
9.5 mm/V (6.3 mm/V),
graticule line at 40 mmHg (6 kPa)
O-90 mmHg (O-13.5 kPa) range;
9.5 mm/V (6.3 mm/V),
graticule line at 60 mmHg (9 kPa).
DC Input Range:
O-150 mmHg (O-17.5 kPa).
Sensitivity:
50 mmHg/V
Accuracy:
f3 mmHg (kO.3 kPa).
Speed selection:
6.25 mm/s.
(5 kPa/V).
Sp02 / Pleth
SpO2 is measured using a dual wavelength optical transducer. It measures pulse and SpO,.
Range:
0% to 100% saturation
Numeric display:
Averaging period selectable
l/2/4/8/16
beats, with default 4.
Settling time:
< 5 s typical
Accuracy:
1SD
80% to 100% f 1.5%
65% to 80% f 2.5%
0% to 65% unspecified
Accuracy with HP M1190A
transducer (78354C):
1SD
80% to 100% f 1.5%
65% to 80% f 2.5%
0% to 65% unspecified
Accuracy with NELLCOR
transducers (78354C):
1SD
80% to 100% f 3%
Alarms
Lower Alarm range:
50-95%, step l%, default = 90%
Upper Alarm range:
70-99%, OFF, step l%, default = OFF
Alarm delay:
10 s
HR derived from Pleth, High Rate 10 s
Alarm Delay:
Low Rate 6 s
(78354C): Low Rate 10 s
Pleth Amplifier
Bandwidth:
0.8 - 11.0 Hz f 25%
Settling time:
<5s
2c-30
Technical Specifications for all Monitors
Cardiotach
Range:
30 - 300 bpm
Accuracy:
f 1%
Resolution:
1 bpm
Graticule lines
Lower line: . . . 25% of wave channel
Upper line: . . . 75% of wave channel
Autofix:
50% of wave channel, peak values on Pleth graticule lines. Gain frozen after 60 s
approximately
Test
n
n
SpO2 test signal: 100%
Pleth test signal: 50% of wave channel, 100 bpm.
Alarms
HR derived from
Pleth/ Alarm delay:
High Rate 10 s Low Rate 6 s
(78354C): Low Rate 10 s
System Interface
General (Opt. Jll
Note
only)
There is no annotation of NIBP and SpO2 values.
Auxiliary signals and
parameters, Internal
processing accuracy:
Selectable channels for
external recorder, Internal
processing accuracy:
f50mV
Delay mode:
12 s delay time
Bandwidth:
Channel 1 = 0 Hz to 50 Hz
Channel 2 = 0 Hz to 15 Hz
Parameters
off condition:
f50 mV
-1 v
ECG system outputs
Wave Bandwidth:
FILTering 0.5 to 25 Hz (OR),
0.5 to 100 Hz (ICU).
DIAGnostic 0.05 to 100 Hz (OR and ICU).
Gain:
variable between 320 and 3200,
dependent on display gain.
Technical Specifications for all Monitors
2c-31
DC Output (HR) Range:
15 bpm to 300 bpm - 0.15 V to 3 V;
< 15 bpm - 0 V
Accuracy:
f 5 bpm
Resolution:
1 bpm
Pressure system outputs
The following accuracies are additional to those given in the Pressure Channel data.
Wave (All the following voltages are f 50 mV):
Range (absolute):
-25 to 270 mmHg = -0.25 V to 2.7 V
(-3.3 to 36 kPa = -0.33 V to 3.6 V)
Range (scaled):
- 5 to 45 mmHg = -0.50 V to 4.5 V,
(-0.5 to 4.5 kPa = -0.50 V to 4.5 V)
-10 to 90 mmHg = -0.50 V to 4.5 V
(-1.0 to 9.0 kPa = -0.50 V to 4.5 V)
-20 to 180 mmHg = -0.40 V to 3.6 V
(-2.5 to 22.5 kPa = -0.50 V to 4.5 V)
-25 to 270 mmHg = -0.25 V to 2.7 V
(-3.3 to 36.0 kPa = -0.33 V to 3.6 V)
Bandwidth:
0 Hz to 12 Hz
DC-Output Range (systolic,
diastolic and mean):
-30 mmHg to 300 mmHg = -0.3 V to 3 V f 50mV
(-4 kPa to 40 kPa = -0.4 V to 4 V)
Scaled wave on selectable channels for external recorder with offset of -2 V.
Respiration system output
Wave Bandwidth:
2.5 Hz
Amplitude:
2.5 V (at 50% display height)
DC-Output
5 resp/min to 100 resp/min = 0.1 V to 2 V
(RR) Range:
Accuracy:
f 3 resp/min
Plethysmograph system outputs
Wave Amplitude:
2.5 Vpp (at 50% display)
DC-Output
Range:
15 bpm to 300 bpm = 0.15 V to 3 V;
< 15 bpm = 0 V
(HR)
Accuracy:
f 5 bpm
Resolution:
1 bpm
Temperature system output
DC Output (Tl only) - 15°C to 45°C = -0.5V to 2.5V
Range:
Accuracy:
f O.l”C for 25°C 5 T I 45OC (Opt.Nl2)
f 0.2”C for 15°C < T 5 24.9OC
2032
Technical Specifications for all Monitors
Resolution:
O.lOC
(at ambient temperature of 0°C to 40°C)
Trend
General
One long trend (24, 8, 4, or 2 h) and one short trend (60 or 20 mins) available on each
parameter. Points on trend curve are averaged values. Alarms are shown as actual values.
Power off, INOP and Alarms off are indicated.
ECG Channel
Heart Rate Trend Range:
20 to 180 bpm
Resolution:
1 bpm
Display points per trend
curve:
384
Respiration Channel
Respiration Rate Trend
Range:
0 to 60 rpm
Resolution:
1 rpm
Display points per trend
curve:
384
Pressure Channel
The systolic, diastolic and mean values are combined in one display.
Range:
dependent on selected pressure scale.
Resolution:
1.2 mmHg (0.16 kPa)
96
Display points per trend
curve:
Each point contains one systolic, one diastolic and two mean readings.
Pleth Channel
The pleth trend curve shows peak-to-peak amplitude of the wave.
Range:
0 to 100%
(78354C): 0 to 1; 1 represents amplitude after
autogain freeze.
Resolution:
1%
(78354C): 0.01
Display points per trend
curve:
384
Technical Specifications for all Monitors
2c-33
AUX Channel
CO2 end tidal value trend.
Pressure, mean value trend.
Display points per trend curve: 384
Single Temperature Channel
Range:
25°C to 42OC
Resolution:
O.l”C
Display points per trend
curve:
384
Dual Temperature Channel
Tl and T2 are displayed. AT trend is directly readable from the display.
Range:
25OC to 42OC
Resolution:
O.l”C
Display points per
trend curve:
337 (Tl) and 48 (T2)
Oxygen Channel
02 trend.
Range:
0 to 100%
Resolution:
1% volume of 02
Display points per
trend curve:
384
Carbon Dioxide Channel
CO2 end tidal value trend.
Range:
0 to 60 mmHg/S kPa
(selected scale 40 mmHg/G kPa),
or 0 to 90 mmHg/13.5 kPa
(selected scale 60 mmHg/S kPa).
Resolution:
1 mmHg/0.13 kPa.
Display points per trend
curve:
Respiration rate trend.
384
Range:
0 to 60 rpm
Resolution:
1 rpm
Display points per trend
curve:
384
2c-34
Technical Specifications for all Monitors
SpO2 Channel (78354C)
Range:
60% to 100%
Resolution:
2%
Display points per
trend curve:
384
Technical Specifications for all Monitors
2~35
Technical Specifications
- 78832A
This section contains the technical specifications for the 78832A. The general instrument
specifications are followed by those for the individual parameters.
General
Patient safety
All inputs are CF-type.
Option NO1 meets safety requirements of CSA (C22.2 No. 125).
n Option NO2 meets safety requirements of IEC 601-l.
w Option NO4 meets safety requirements o UL 544.
n Defibrillator
protection up to 5 kV.
n
n
Defibrillator
protection:
up to 5 kV
Power Requirements
Operating voltage:
115 V/230 V tlO% -15% (USA/IEC)
115 V/230 V tlO% -22% (Japan)
Frequency:
50/60 Hz
Power consumption:
40 w
Environmental
Operating temperature:
o”c to 55°C
Storage temperature:
-40°C to -k75OC
Relative humidity:
5% to 95%
Size:
160 mm high, 320 mm wide, 405 mm deep
Weight:
11 kg (24 lbs)
Display
Superaster video display
Screen size:
140 x 105 mm; 178 mm diagonal
Sweep speed:
12.5 mm/s, 25 mm/s or 50 mm/s gives 8 s, 4 s or 2 s of display
respectively.
For respiration, a speed of 6.25 mm/s is also available
Display mode:
fixed trace (moving bar)
Waveform display height
Channel 1 30 mm &lo%
Channel 2 32 mm &lo%
Numeric update time:
2s
Resolution per waveform:
256 dots vertical, 500 dots horizontal
2~38
Technical Specifications for all Monitors
Trends are stored at power off for a minimum of 1 hour.
ECG Channel
ECG Amplifier
Patient Safety:
Protected against defibrillator and electrosurgery potentials. Standard full lead selector,
Differential input impedance:
Common Mode Rejection
Ratio:
1 Mohm (at 10 Hz and including patient cable).
n
n
FILTering 106 dB
DIAGnostic > 86 dB at line frequency with patient cable and
51 kohm/47 nF imbalance and respiration in parallel.
Electrode offset potential:
f0.5 V max.
Baseline recovery:
2 s after defibrillation.
Noise:
<35 uVpp, measured in the DIAGnostic mode and referred to
the input, with each lead connected to ground through shielded
51 kohm/47 nF.
Cardiotach
Digital cardiotach, beat to beat rate:
Range :
15-350 bpm
Accuracy:
&l% of displayed value
Resolution:
lbpm
Sensitivity:
250 UV peak
No pace pulse rejection.
Analog Output
ECG wave on phone-jack:
Constant gain:
1000
Bandwidth:
FILtering 0.5 to 25 Hz
DIAGnostic 0.5 to 100 Hz
Baseline offset:
</=
1OOmV at gain of 1000
Alarms
Technical alarm:
Leads off
occurs if electrode offset potential out of spec.
Indication:
-?- three dashes flash in place of heart rate numerics and
audible alarm is given.
Technical Specifications for all Monitors
2c-37
Medical alarms:
Asystole
occurs when interval between 2 QRS compexes exceeds four
seconds.
Indication:
< 15 numerics flash, alarm lamps flash,
and an audible alarm is given.
Heart rate alarm occurs when heart rate is outside of selected alarm limits.
Indication:
flashing heart rate numerics and audible alarm given.
Alarm range:
15-30 bpm in steps of 5 bpm.
Alarm delay:
High rate 10 s, low rate 5 s.
Test/Calibration
1 ECG simulated test waveform and numerics: 125bpm f 2, waveform 2.5cm pp
n
Calibration signal: 1 mV &lo%
Temperature Channel
Range:
15°C to 45°C
Resolution:
O.l”C
Accuracy:
h O.l°C (25.0°C to 45.0°C)
f 0.2”C (15.OOCto 24.9”C)
Average time constant:
10 s (At = 15°C)
Numeric display update time: 2 s
If out of range, no display
No alarm given. .
Test temperature:
Tl = 40°C,
T2 = 40°C f O.l”C,
T = 0°C f O.l”C.
Isolation voltage:
5kV
Respiration Channel
Respiration amplifier
Patient Protection:
Protected against defibrillator
potentials
Differential input impedance:
> 1 Mohm (at < 50 Hz with ECG in parallel)
Sensing current:
< 80 uA rms, measured at 62.5 kHz
Isolation voltage:
5 kV
Noise (display):
< 3 mm measured at full size
Test signal:
amplitude equivalent to impedance change
of 1 ohm f 10% at a rate of 60 f 5% rpm
2038
Technical Specifications for all Monitors
Respiration trigger
Monitor automatically
sets to automatic triggering
Auto mode:
Auto trigger level is set automatically
Sensitivity:
< 180 mohm at a Resp. rate of 60 rpm
Respiration rate range:
< 170 rpm
Accuracy:
f 3 rpm
Manual mode:
Trigger level dependent on CRT display size
Nominal level:
M Triggermark. Signals must be greater
than this mark to be triggered.
Respiration alarms
Apnea alarm: activated when no valid breath is detected within present apnea delay time.
Delay time:
10 to 40 s,
adjustable in increments of 5 s
Indication:
APNEA message, 000 flashes, alarm lamps flash
and audible alarm is given.
High rate
alarm..Range:
50 to 170 rpm, in steps of 5rpm
Coincidence alarm:
(in manual mode only) activated if the interval between two detected
QRS complexes equals the time between two breaths f 12.5%
Indication:
HR=RR message
780 Annotating Interface
General
Annotating output for HP-annotating
instantaneous heart rate (CRG).
Delay time:
2.5 mins
Parameters of
condition:
-1 v
recorder. Delayed outputs for respiration wave and
ECG System Outputs
m Wave
n
Bandwidth:
FILtering 0.5 Hz to 25 Hz
DIAGnostic 0.05 Hz to 100 Hz
Amplitude:
2.5 Vpp (at 50% display height)
DC output (HR)
Range average (HR):
15 bpm to 300 bpm = 0.15 V to 3 V;
Range instant (HR):
15 bpm to 240 bpm = 0.15 to 2.4V
Accuracy:
f 5 bpm
Technical Specifications for all Monitors
2c-39
1 bpm
Resolution:
Respiration-system
output
Wave:
Bandwidth:
2.5 Hz
Amplitude:
2.5 V (50% display height)
DC-output:
Range:
5 resp/min to 150 resp/min = 0.1 V to 3 V
accuracy:
f3 resp/min
Temperature - system output
DC-output
(Tl only):
Range:
AT 0°C to 30°C = 0 V to 3 V
Range:
Tl:
Accuracy:
fO.l”C for 25°C < T < 45°C
f0.2”C for 15°C < T < 24.9”C
(at ambient temperature of 0°C to 4O’C)
Resolution:
O.l”C
15°C to 45’C = -0.5 V to 2.5 V
AT is standard, Tl is internally selectable
Trend
General
One long trend (24, 8, 4, or 2 h) and one short trend (60 or 20 or 2 mins) available on ECG
(heart rate, 2 min is beat to beat), respiration (wave and apnea events). Points on trend curve
are averaged values (except respiration). Alarms are shown as actual values. Power off, INOP
and Alarms off are indicated.
ECG Channel
Heart Rate Trend Range:
50 to 210 bpm
Resolution:
1 bpm
Display points per trend
curve:
384 (468 for 2 min trend)
2c-40
Technical Specifications for all Monitors
Respiration Channel
Length of apnea event(s) ( in seconds) displayed as a vertical bar.
Maximum height of bar:
60 s to 360 s
(dependent on selected trend time)
Resolution of bar:
1s
Number of bars per display:
192
Wave (2 min trend only)
Display points per trend
curve:
468
Technical Specifications for all Monitors
2c-41
Technical Specifications
- 78833A
This section contains the technical specifications for the 78833A. The general instrument
specifications are followed by those for the individual parameters.
General
Patient safety
All inputs are CF-type.
Option NO1 meets safety requirements of CSA (C22.2 No. 125).
1 Option NO2 meets safety requirements of IEC 601-l.
n Option NO4 meets safety requirements o UL 544.
n Defibrillator
protection up to 5 kV.
n
n
Defibrillator
protection:
up to 5 kV
Power Requirements
Operating voltage:
115 V/230 V +10% -15% (USA/IEC)
115 V/230 V tlO% -22% (Japan)
Frequency:
50/60 Hz
Power consumption:
40 w
Environmental
Operating temperature:
0°C to 55°C
Storage temperature:
-40°C to +75OC
Relative humidity:
5% to 95%
Size:
160 mm high, 320 mm wide, 405 mm deep
Weight:
11 kg (24 lbs)
Trends are stored at power off for a minimum of 1 hour.
Display
Superaster video display
Screen size:
140 x 105 mm; 178 mm diagonal
Sweep speed:
12.5 mm/s, 25 mm/s or 50 mm/s gives 8 s, 4 s or 2 s of display
respectively.
For respiration, a speed of 6.25 mm/s is also available
Display mode:
fixed trace (moving bar)
Waveform display height:
Channel 1 30 mm &lo%
Channel 2 normal 32 mm &lo%
Channel 3 mode
2~42
Technical Specifications for all Monitors
Channel 2 overlapping 64 mm &lo%
Channel 3 mode
Numeric update time:
2s
Resolution per waveform:
256 dots vertical, 500 dots horizontal
ECG Channel
ECG Amplifier
Patient Safety:
Protected against defibrillator
and electrosurgery potentials.
Differential
> 1 Mohm (at 10 Hz and including patient cable).
Common
input
impedance:
Mode Rejection
Standard three lead selector.
Ratio:
w FILTering 106 dB
n DIAGnostic
> 86 dB at line frequency with patient cable and 51 kohm/47 nF imbalance.
Electrode
offset potential:
f0.5 V max.
Baseline recovery:
2 s after defibrillation.
Noise:
<35 uVpp, measured in the DIAGnostic mode
and referred to the input, with each lead
connected to ground through shielded
51 kohm/47 nF.
Cardiotach
Digital cardiotach, beat to beat heart rate
Range:
15 - 350 bpm
Accuracy:
f 1% of displayed value
Resolution:
1 bpm
Sensitivity:
250 uV peak
No pace pulse rejection
Analog Output
ECG wave on phone-jack:
Constant gain:
1000
Bandwidth:
FILtering 0.5 to 25 Hz
DIAGnostic 0.5 to 100 Hz
Baseline offset:
< 1OOmV at gain of 1000
Alarms
Technical alarm: Leads off,
occurs if electrode offset potential out of spec.
Technical Specifications for all Monitors
2c-43
three dashes flash in place of heart rate
numerics and audible alarm is given.
Indication:
Medical alarms: Asystole, . . . occurs when interval between 2 QRS compexes exceeds four
seconds.
< 15 numerics flash, alarm lamps flash,
and an audible alarm is given.
Indication:
Heart rate alarm occurs when heart rate is outside of selected alarm limits.
Indication:
flashing heart rate numerics
and audible alarm given.
Alarm range:
15-30 bpm in steps of 5 bpm.
Alarm delay:
High rate 10 s, low rate 5 s.
Test/Calibration
n
ECG simulated test waveform and numerics: 125bpm f2, waveform 2.5cm pp
n
Calibration signal: 1 mV &lo%
Respiration Channel
Respiration amplifier
Patient Protection:
Protected against defibrillator
Differential input impedance:
> 1 Mohm
(at < 50 Hz with ECG in parallel)
Sensing current:
< 80 uA rms, measured at 62.5 kHz
Isolation voltage:
5 kV
Noise:
(display) < 3 mm measured at full size
Test signal:
amplitude equivalent to impedance change
of 1 ohm f 10% at a rate of 60 f 5%
Respiration trigger
Monitor automatically
sets to automatic triggering.
Auto trigger:
Auto trigger level is set automatically
Sensitivity:
< 180 mohm at a Resp. rate of 60 rpm
Respiration rate range:
< 170 rpm
Accuracy:
f 3 rpm
Manual trigger:
Trigger level dependent on CRT display size
Nominal level:
M Triggermark. Signals must be greater
than this mark to be triggered.
2044
Technical Specifications for all Monitors
Respiration alarms
Apnea alarm activated when no valid breath is detected within present apnea delay ime.
Delay time:
10 to 40 s
adjustable in ecrements of 5 s.
Indication:
APNEA message, 000 flashes, alarm lamp flashes
and audible alarm is given.
High rate alarm range:
50 -170 rpm, in steps of 5rpm
Coincidence alarm:
(in manual mode only) activated if the
interval between two detected QRS complexes
equals the time between two breaths f 12.5%.
Indication:
HR=RR message
Pressure Channel
Pressure amplifier
Range:
-35 mmHg to +300 mmHg (-4 kPa to i-40 kPa)
Sensitivity:
5 uV/V/mmHg
40 uV/V/mmH
Gain accuracy:
f 1%
Gain stability:
f 0.1 mmHg/“C
Gain adjustment range:
f 10%
Non-linearity:
0.5%
Bandwidth:
12 Hz
(37.5 uV/V/kPa)
(300 uV/V/kPa)
or ( selected
( automatically
f 0.013 kPa/‘C
Auto zero
Range:
f 200 mmHg (& 26 kPa)
Zero accuracy:
f 1.0 mmHg (& 0.13 kPa)
Zero drift:
0.1 mmHg/“C
Response time:
IS
(0.013 kPa/“C)
Pressure wave display
Graticule lines:
normal 3 channel wave range 32 mm
overlapping wave 64mm.
Pulse rate
Derived from Pl only (not available with Opt. E20)
Range:
25 to 300 bpm
Accuracy:
f 1%
Resolution:
1 bpm
Technical Specifications for all Monitors
2045
Graticule line labelling and resolution:
++Range hmHg)++
-5
-10
-20
-25
-
0
0
0
0
+45
+90
+180
+270
-
++Range (kPa)tt
-0.5
-1.0
-2.5
-3.3
t+Graticule++
ttline
labellingtt
ttlower
upper++
ttResolution
++64 mm
30
60
120
180
++Graticule++
ttLine labellingtt
ttlower
upper++
t4.5
t9.0
t22.5
-36.0
0
0
0
0
3
6
15
24
8
16
32
48
++Resolution
-64 mm
0.78
1.56
4.16
6.25
Alarms
Technical Alarms:
Transducer disconnect
Pressure disconnect
Alarm delay:
8s
Medical Alarms:
High and low pressure,
Alarm delay:
8s
Pulse rate
Range:
25 to 300 bpm
Test/calibration
Simulated test waveform and numerics:
n
Pl:....
120 mmHg (15 kPa)
w Pl:. . . . 60 mmHg (6 kPa)
Calibration signal (steps): 30/60/120/180 mmHg (316115124 kPa)
2046
Technical Specifications for all Monitors
hmHg/cdtt
32 mm++
16
32
64
96
(kPa/cm)++
32 mm++
1.56
3.12
8.33
12.5
780 Annotating Interface
General
Annotating output for HP-annotating recorders.
Delayed outputs for respiration wave and instantaneous heart rate (CRG).
n
n
Delay time: 2.5 mins
Parameter off condition: -1 V
ECG System Outputs
n
n
Wave
Bandwidth:
FILtering 0.5 Hz to 25 Hz
DIAGnostic 0.05 Hz to 100 Hz
Amplitude:
2.5 Vpp (at 50% display).
DC output (HR):
Range average HR:
15 bpm to 300 bpm = 0.15 V to 3 V;
Range beat-beat HR:
15 bpm to 240 bpm 0.15 V to 2.4 V
Accuracy:
rt 5 bpm
Resolution:
1 bpm
Respiration-system output
Wave Bandwidth:
2.5 Hz
Amplitude:
2.5 V (50% display height)
DC-output
(RR) Range:
Accuracy:
5 resp/min to 150 resp/min = 0.1 V to 3V
f 3 resp/min
Pressure system output (Pl only)
Wave scaled:
Range:
-5 V to 45 mmHg =
-0.3
. . . . . -10 V to 90 mmHg =...-0.3
. . . . . -20 V to 180 mmHg =...-0.3
. . . . . -25 V to 270 mmHg =...-0.25
. . . . . -0.5 to 4.5 Kpa
=...-0.5
. . . . . -1 to 9 Kpa
=...-0.5
. . . . . -2.5 to 22.5 Kpa =...-0.5
. . . . . -3.3 to 36 Kpa
=...-0.33
Accuracy:
Bandwidth:
DC-output
Range S/D/M:
v to
V to
V to
V to
V to
V to
V to
V to
4.5 v
4.5 V
3.6 V
2.7V
4.5 V
4.5 V
4.5 V
3.6 V
f50mV
0 Hz to 12 Hz
-30 to 300 mmHg = -0.3 V to 3 V f 50 mV
-4 to 40 Kpa = -0.4 V to 4 V f 50 mV
Scaled wave on selectable channels for external recorder with offset of -2.V
Technical Specifications for all Monitors
2c-47
General
One long trend (24, 8, 4, or 2 h) and one short trend (60 or 20 or 2 mins) available on ECG
(heart rate , 2 min is beat to beat), respiration (wave and apnea events) and pressure (systolic
diastolic and mean). Points on trend curve are averaged values (except respiration).Alarms
are shown as actual values. Power off, INOP and Alarms off are indicated.
ECG Channel
Heart Rate Trend Range:
50 to 210 bpm
Resolution:
1 bpm
Display points per trend
curve:
384 (468 for 2 min trend)
Respiration Channel
Length of apnea event(s) ( in seconds) displayed as a vertical bar.
Maximum height of bar:
60 s to 360 s (dependent on selected trend time)
Resolution of bar:
1s
Number of bars per display:
192
WAVE (2 min trend only)
Display points per trend
curve:
468
Pressure Channel
The systolic, diastolic and mean values are combined in one display.
Range:
dependent on selected pressure scale.
Resolution:
1.2 mmHg (0.16 kPa)
Display points per trend
curve:
96 (117 for 2 min trend)
Each point contains one systolic, one diastolic and two mean values.
2048
Technical Specifications for all Monitors
Technical Specifications
- 788336 and 78834A/C
This section contains the technical specifications for the 78833B and 78834A/C. The technical
specifications are the same for both instruments with the following exceptions:
a. The 78833B is a 3/4 module instrument and the 78834A is a full module instrument.
b. The 78834C comes in both sizes.
The general instrument specifications are followed by those for the individual parameters:
General
Patient safety
All inputs are CF-type.
Option NO1 meets safety requirements CSA(C22.2 No.125).
n Option NO2 meets safety requirements of IEC 601-l.
n Option NO4 meets safety requirements of UL 544.
m Defibrillator protection up to 5 kV.
n
n
Power requirements
Operating voltage:
115 V/230 V tlO% -15% (IEC/USA)
115 V/230 V +lO% -22% (Japan)
Frequency:
50/60 Hz,
Power consumption:
78833B - 75 W (max)
78834A - 80 W (max)
Environmental
Operating temperature:
0°C to 55°C
Storage temperature:
-4OOCto +75”c
Relative humidity:
5% to 95%
Size: 78833B/4C:
160 mm high, 320 mm wide, 405 mm deep
Size: 78834A/C:
160 mm high, 425 mm wide, 405 mm deep
Weight: 78833B/4C:
11 kg (24 lbs)
Weight: 78834A/C:
14 kg (31 lbs)
Trends stored at power off condition for a minimum of 1 hour.
Technical Specifications for all Monitors
2c-49
Display
Superaster
video display:
Screen size:
140 mm x 105 mm; 178 mm diagonal
Sweep speed:
12.5 mm/s, 25 mm/s or 50 mm/s gives
8 s, 4 s or 2 s of display respectively.
(For respiration a speed of 6.25 mm/s is also available.)
Display mode:
fixed trace (moving bar).
Waveform display height: \
30 mm f
Channel 1
----------------------------------normal
Channel 2
mode
32 mm f
Channel 3
----------------------------------overlapping
Channel 2
mode
64 mm f
Channel 3
10%
10%
10%
Numeric update time:
2s
Resolution:
256 dots vertical,
500 dots horizontal.
ECG Channel
ECG Amplifier
Patient Safety: Protected against defibrillator
lead selector.
and electrosurgery potentials.
Protected against defibrillator
Standard three lead selector.
Standard three
and electrosurgery potentials.
Differential input impedance:
5 Mohm ( at 10 Hz and including patient cable)
;;,,;,c
1 Mohm(at 10 Hz and including patient cable).
,:. . . . . . . . . . .
Common Mode Rejection
Ratio:
FILTering 110 dB (with Resp. 2 106 dB)
DIAGnostic 90 dB (with Resp. 2 84 dB) at
line> frequency with patient cable and
51 kohm/47 nF imbalance.
Electrode offset potential:
f0.5 V max
Baseline recovery:
2 s after defibrillation.
(78834C):. . . . . . . . :
1 s after defibrillation
Noise:
< 35 uVpp, measured in the DIAGnostic mode
and referred to the input, with each lead
connected to ground through shielded 51 kohm/47 nF.
2050
Technical Specifications for all Monitors
Cardiotach
Digital cardiotach, beat to beat rate.
AUTO MODE
Upper alarm limit range:
15 to 300 bpm
Accuracy:
f 1%
Resolution:
1 bpm
Sensitivity:
250 UV peak
No Pace pulse rejection
MANUAL
MODE
Heart rate range:
15 to 350 bpm
Accuracy:
f 1%
Resolution:
1 bpm
Sensitivity:
-5 mV to t5 mV
Display gain:
3 mm/mV
to 30 mm/mV
(channel 1)
:
Analog output
n
ECG wave on phone-jack
Gain:
320 to 3200 (dependent on display gain).
Bandwidth:
FILTering 0.5 to 25 Hz
DIAGnostic 0.5 to 100 Hz
Baseline offset:
</=;
100 mV at gain 1000.
Alarms
Technical Alarm:
Leads Off, occurs if electrode is detached,
dry or if electrode offset potential out of spec.
Medical Alarms:
Asystole, occurs when interval between two QRS complexes
exceeds four seconds.
Indication:
< 15 numerics Aash, alarm lamps flash and
an audible alarm is given.
Alarm delay:
High rate < 10 s
Low rate < 6 s
Test/Calibration
ECG simulated test
waveform and numerics:
1OObpm f2, waveform 1.5 cm pp
(78834C): 125 bpm f 2 waveform 1.5 cm pp
Calibration signal:
1 mV &lo%
Technical Specifications for all Monitors
2c-51
Temperature Channel
Range:
15°C to 45°C
Resolution:
O.l”C
Accuracy:
f O.l”C (25.O”C to 45.O”C)
f 0.2”C (15.0°C to 24.9OC)
Average time constant:
10 s (At = 15OC)
Numeric display update time: 2 s
If out of range, no display
No alarm given.
Test temperature:
Tl = 40°C
T2 = 40°C f O.lOC,
T = 0°C f O.lOC.
Isolation voltage:
5kV
Respiration Channel
Respiration amplifier
Patient Protection:
Protected against defibrillator potentials
Differential input impedance:
> 1 Mohm (at < 50 Hz with ECG in parallel)
Sensing current:
< 80 uA rms, measured at 62.5 kHz
Isolation voltage:
5 kV
Noise (display):
< 3 mm measured at full size
Test signal:
amplitude equivalent to impedance change
of 1 ohm f 10% at a rate of 60 5 5%
Respiration trigger
Monitor automatically
sets to automatic triggering
Auto mode:
Auto trigger level is set automatically
Sensitivity:
< 180 mohm at a Resp. rate of 60 rpm
Respiration rate range:
< 170 rpm
Accuracy:
f 3 rpm
Manual mode:
Trigger level dependent on CRT display size
Nominal level:
M Triggermark. Signals must be greater
than this mark to be triggered.
Respiration alarms
Apnea alarm: activated when no valid breath is detected within present apnea delay time.
2052
Technical Specifications for all Monitors
Delay time:
10 to 40 s,
adjustable in increments of 5 s
Indication:
APNEA message, 000 flashes, alarm lamps flash
and audible alarm is given.
High rate
alarm..Range:
50 to 170 rpm, in steps of 5rpm
Coincidence alarm:
(in manual mode only) activated if the
interval between two detected QRS complexes
equals the time between two breaths f 12.5%
Indication:
HR=RR message
Pressure Channel
Pressure amplifier
Range:
-25 mmHg to i-300 mmHg
(-3.3 kPa to +40 kPa)
Sensitivity:
5 uV/V/ mmHg (37.5 uV/V/kPa)
or 40 uV/V/mmHg
(300 uV/V/kPa)
selected automatically
Gain accuracy:
f 1%
Gain stability:
f 0.1 mmHg/OC (k 0.013 kPa/‘C)
Gain adjustment range:
f 10%
(78834C): f7%
Non-linearity:
0.5%
Bandwidth:
0 to 12 Hz
Auto zero
Range:
f 200 mmHg (& 26 kPa)
Zero accuracy:
f 1.0 mmHg ( f 0.13 kPa)
Zero drift:
0.1 mmHg/OC (0.013 kPa/“C)
Response time:
1s
Pressure wave display
Graticule lines:
Normal 3 channel wave range 32 mm,
Overlapping wave 64 mm
Graticule line labelling and resolution:
Range bm-dg)
-5
-10
-
+45
+90
Graticule
line labelling
lower
upper
0
3
0
60
Resolution
(mmHg/cm)
64mm
32mm
8
16
16
32
Technical Specifications for all Monitors
2053
-20
-25
-
+180
+270
Range (kPa)
-0.5
-1.0
-2.5
-3.3
-
+4.5
+9.0
+22.5
+36
0
0
120
180
Graticule
line labelling
lower
upper
0
3
0
6
0
15
0
24
32
48
Resolution
64mm
0.78
1.56
4.16
6.25
64
96
(kPa/cm)
32mm
1.56
3.12
8.33
12.5
Pulse Rate
Derived
from Pl only (not available
with Opt.E20).
Range:
25 to 300 bpm
Accuracy:
1%
Resolation:
1 bpm
Alarms
High and low pressure alarms: occur when selected pressure is outside alarm limits.
Indication:
flashing pressure numerics and audible alarm.
Alarm delay:
8s
Pulse rate:
range 25 to 300 bpm
Transducer disconnect alarm: occurs when transducer not connected to instrument.
Indication:
Pl (or P2) NO TRANSDUCER message, three
dashes flash in place of pressure numerics and
an audible alarm is given
Alarm delay:
8s
Pressure disconnect alarm: occurs when mean pressure falls below 10 mmHg.
Indication:
Pl (or P2) DISCONNECT message, flashing
numerics and audible alarm is given,
Alarm delay:
8s
Test/calibration
Simulated test waveform and Pl: 120 mmHg (15 kPa)
numerics:
P2: 60 mmHg (6 kPa)
2054
Technical Specifications for all Monitors
Transcutaneous
02 and CO* Channel (tcpO* and tcpC02)
General
tcp02 Numerical Display
Range (3 Digits):
0 to 800 mmHg (0 to 99.9 kPa)
Non-linearity:
0.5% f 1 digit
Temperature Drift:
-c 0.1% per “C
tcpC02 Numerical Display
Range (3 Digits):
0 to 150 mmHg (0 to 20 kPa)
Non-linearity:
1% f 1 digit
Temperature Drift:
< 0.1% per “C
Transducer Heating
Selectable temperature
settings:
37, 42, 42.5, 43, 43.5, 44, 44.5, 45°C
Accuracy:
f 0.1 “C
Maximum Heating Power:
833 mW (using transducers 15204A and 15295A),
640 mW (using transducers 15207A and 15208A).
Maximum Heating Power
(78834C):
833 mW (using transducers 15204A and 15205A),
600 mW (using transducers 15207A and 15209A).
Temperature safeguards:
Temperature Sensors (within
transducer):
2
(788346): 2 (15204A/15205A/15209A)
1, (15207A)
To prevent overheating, the heating power is switched off and an error message (delay 30 s) is
generated under each of the following conditions:
a.
b.
c.
d.
temperature greater than 46 “C
temperature out of range
temperature sensor broken or shorted
microprocessor operation is interrupted.
Alarms
Medical Alarms
(Audible and Visual):
High tcpOz
(limit selectable from 20 to 300 mmHg - 2 to 40 kPa)
Low tcpoz
(limit selectable from 10 to 95 mmHg - 1 to 9.5 kPa)
I
High tcpC0,
(limit selectable from 20 to 150 mmHg - 2 to 20 kPa)
Low tcpcoa
(limit selectable from 10 to 95 mmHg- 1 to 9.5 kPa)
Technical Specifications for all Monitors
2~45
Alarm Delay:
8 s.
Technical Alarms (Audible
and Visual):
Transducer disconnected.
Site timer elapsed (limit selectable from lh to 7 hs, in steps of 1
h.
Test Signal:
60 mmHg (8.0 kPa)
40 mmHg (5.3 kPa)
tcpoz:
tcpcos:
780 Annotating Interface
General
Annotating output for HP-annotating recorders.
Delayed outputs for respiration wave and instantaneous heart rate (CRG).
Delay time:
2.5 mins
Parameter off condition:
-1 v
ECG system outputs
Wave Bandwidth:
FILTering 0.5 to 25 Hz
DIAGnostic 0.5 to 100 Hz
Amplitude:
2.5 Vpp (0 50% display height)
DC Output (HR):
Range average HR:
15 bpm to 300 bpm = 0.15 V to 3 V
Range instant HR;
15 bpm to 240 bpm = 0.15 V to 2.4 v
Accuracy:
f 5 bpm
Resolution:
1 bpm
Respiration system output
Wave Bandwidth:
2.5 Hz
Amplitude:
2.5 V (at 50% display height)
DC-Output
5 resp/min to 150 resp/min = 0.1 V to 3 V
(RR) Range:
Accuracy:
f 3 resp/min
Temperature system output
DC Output (Tl
only) . . . Range:
5°C to 45°C = -0.5V to 2.5V
(78834C): Tl: 15’C to 45’C = -0.5 V to 2.5 V
Accuracy:
f O.l”C for 25°C 5 T 5 45’C
III 0.2”C for 15 “C 5 T 5 24.9’C
(at ambient temperature of 0°C to 4O’C)
Resolution:
O.l”C
2~56
Technical Specifications for all Monitors
’
Pressure system output
The following accuracies are additional to those given in the Pressure Channel data.
Wave
(All the following voltages are + 50 mV)
\ -5 to 45 mmHg =
-0.50
-10 to 90 mmHg = -0.50
-20 to 180 mmHg = -0.40
-25 to 270 mmHg = -0.25
(-0.5 to 4.5 kPa = -0.50
-1.0 to 9.0 kPa = -0.50
-2.5 to 22.5 kPa = -0.50
(-3.3 to 36.0 kPa =-0.33
Range (scaled):
v to 4.5
V to 4.5
V to 3.6
V to 2.7
V to 4.5
V to 4.5
V to 4.5
V to 3.6
v
V
V
V
V
V
V
V)
0 Hz to 12 Hz
Bandwidth:
DC Output:
Range (systolic, diastolic and -30 mmHg to 300 mmHg = -0.3 V to 3 V
(-4 kPa to 40 kPa = -0.4 V to 4 V)
mean) :
Scaled wave on selectable channels for external recorder with offset of -2 V:
tcpO2 and tcpCO2 system
output
The following accuracies are traditional
DC-Output
(tcpOz)
0 to 450 mmHg (0 to 60 kPa) = 0 to 4.5 V f 50 mV
Range:
DC-Output
to those given in the tcpO2 and tcpCO2 channel data.
(tcpC02)
Range:
0 to 150 mmHg (0 to 20 kPa) = 0 to 3 V f 50 mV
Plethysmograph system outputs (78834C)
Wave Amplitude:
2.5 Vpp (at 50% display)
DC Output (HR) . . . Range:
15 bpm to 300 bpm = 0.15 V to 3 V; OV for <15bpm
Accuracy:
f 5 bpm
Resolution:
1 bpm
Oxygen system output (78834C)
DC Output
Range:
0 to 100% = 0 to 3 v
Carbon Dioxide system output (78834C)
Wave Range:
0 to 60 mmHg ( 0 to 6 kPa) = 0 to 3.0 V
0 to 90 mmHg ( 0 to 9 kPa) = 0 to 4.5 V
Technical Specifications for all Monitors
2c-57
Trend
General
One long trend (24, 8, 4, or 2 h) and one short trend (60 or 20 or 2 mins) available on ECG
(heart rate, 2 min is beat to beat), respiration (wave and apnea events) and pressure (systolic,
diastolic and mean). Points on trend curve are averaged (except respiration). Alarms are
shown as actual values. Power off, INOP and Alarms off are indicated.
ECG Channel
Heart Rate Trend Range:
50 to 210 bpm
Resolution:
1 bpm
Display points per trend
curve:
384 (468 for 2 min trend)
Pressure Channel
The systolic, diastolic and mean values are combined in one display.
Range:
dependent on selected pressure scale.
Resolution:
1.2 mmHg (0.16 kPa)
Display points per trend
curve:
96 (117 for 2 min trend)
Each point contains one systolic, one diastolic and two mean values.
Respiration Channel
Length of apnea event(s) ( in seconds) displayed as a vertical bar.
Maximum height of bar:
60 s to 360 s (dependent on selected trend time)
Resolution of bar:
1s
Number of bars per display:
192
Wave (2 min trend only)
n
Display points per trend curve: 468.
Dual Temperature Channel
Tl and T2 are displayed
AT trend is directly readable from the display
Range:
25°C to 42°C
Resolution:
O.l”C
Display points per trend
curve:
337(Tl) and 48(T2)
2058
Technical Specifications for all Monitors
tcpO2 and tcpCO2 Channel
tcpOz trend
Range:
0 to 600 mmHg (0 to90kPa) dependent on selected scale
Maximum Resolution:
0.27 mmHg (0.04 kPa)
Display points per trend
curve:
tcpCOz trend
384
Range:
0 to 240 mmHg (0 to 36 kPa) dependent on selected scale
Maximum Resolution:
0.27 mmHg (0.04 kPa)
Display points per trend
curve:
384
Pleth Channel (78834C)
The pleth trend curve shows peak-to-peak amplitude of the wave.
Range:
0 to 1; 1 represents amplitude after autogain freeze.
Resolution:
2%
Display points per trend
curve:
384
Oxygen Channel (78834C)
02 trend.
Range:
0 to 100%
Resolution:
1% volume of 02
Display points per
trend curve:
384
Carbon Dioxide Channel (78834C)
COz end tidal value trend.
Range:
0 to 60 mmHg/S kPa (selected scale 40 mmHg/G kPa), or 0 to
90 mmHg/13.5 kPa (selected scale 60 mmHg/S kPa).
Resolution:
1 mmHg/0.13 kPa.
SpO2 Channel (78834C)
Range:
60% to 100%
Resolution:
2%
Display points per
trend curve:
384
Technical Specifications for all Monitors
2c-59
SpO2 / Pleth (78834C)
SpOs is measured using a dual wavelength optical transducer. It measures pulse and SpOz.
Range:
0% to 100% saturation
Numeric display:
Averaging period selectable
l/2/4/8/16
beats, with default 4.
Settling time:
< 5 s typical
Accuracy HP M1190A
1SD
80% to 100% t/- 1.5%
65% to 80% t/- 2.5%
0% to 65% unspecified
Transducer:
Accuracy NELLCOR
1SD
80% to 100% t/-
Transducers:
3.0%
Alarms
Lower Alarm range:
50-95%, step l%, default = 90%
Upper Alarm range:
70-99%, OFF, step l%, default = OFF
Alarm delay:
10 s
HR derived from Pleth
High Rate 10 s
Low Rate 10 s
Alarm Delay:
Pleth Amplifier
Bandwidth:
0.8 - 11.0 Hz t/-
Settling time:
< 5s
25%
Cardiotach
Range:
30 - 300 bpm
Accuracy:
f 1%
Resolution:
1 bpm
Graticule lines
Lower line:
25% of wave channel
Upper line:
75% of wave channel
Autofix
50% of wave channel, peak values on Pleth graticule lines.
Gain frozen after 60 s approximately.
2c-60
Technical Specifications for all Monitors
Test
SpOs test signal:
100%
Pleth test signal:
50% of wave channel,
100 bpm.
Pulse rate alarm limits
High and Low
Ranges:
30 to 250 bpm.
Noninvasive Blood Pressure (NIBP)
General
Oscillometric method (with inflatable cuff) determines Mean arterial pressure (MAP), systolic
and diastolic pressure.
Cuff pressure range:
0 to 280 mmHg (37 kPa), automatically released if pressure
exceeds 315 f 10 mmHg (42 f 1.5 kPa).
Inflation time:
6 to 10 s (to 280 mmHg) typical using standard adult cuff.
Deflation time:
30 to 35 s typical
Cuff pressure accuracy:
better than f3 mmHg (f0.4% kPa)
for ambient temperature 15°C to 25’C
better than f3 mmHg (&O.S% of reading)
for ambient temperature 10°C to 35’C,
better than f3 mmHg (i-1.7% of reading)
for ambient temperature 0°C to 55°C.
Add rounding error of f l/2 digit (= f0.5 mmHg of f0.05 kPa) to above accuracies.
Measurement Range:
Systolic:
30 to 130 mmHg (4 to 17 kPa)
Diastolic:
10 to 200 mmHg (1.3 to 13 kPa)
MAP:
20 to 120 mmHg (2.5 to 16 kPa)
Note
Measurements are only possible in the heart range 40 to 300 bpm.
Modes
n
n
Auto: measurements are automatically repeated with a time interval set by the user (2, 5,
10, 15, 30 and 60 min).
Manual: a single measurement is taken.
Technical Specifications for all Monitors
2061
n
Statim: (If fitted) A series of ten measurement cycles are taken over a five minute period.
Only one QRS complex causing a pressure oscillation in the cuff is sensed at each inflation
level.
Alarms
High and low pressure.
Alarm Limit Adjustments:
n
n
5 mmHg (1kPa) steps
2 mmHg (0.5kPa steps for 10 to 30 mmHg (1.5 to 4kPa)
Fractional Inspired Oxygen (78834C)
Range:
10% to 110%
Resolution:
1%
Instrument Accuracy:
f 2.5% of full Scale (21% calibration) or
f 2.0% of full Scale (100% calibration).
Warm up time using 15203A from standby, less than 1 min,
unpolarized, less than 2 hours
transducer:
Instrument back up time
(internal battery):
greater than 4 days.
Alarms
Medical Alarms
(audible and visual):
High 02 alarm
(limit selectable from 24 to 100%)
Low 02 alarm
(limit selectable from 18 to 90%)
Alarm delay:
15 s
Technical Alarm (audible and Transducer disconnected
Break in sensor cable.
visual):
Test Signal:
21% 02
Carbon Dioxide (78834C)
General
Warm up Time:
30 min. (accuracy within 0.3 mmHg of its final value).
Stability:
fl
Response Time:
< 125 ms (for step from 10% to 90%)
mmHg (over 7 day period).
The following errors are due to 02/N20
accuracies given in the sections below.
compensation and are additional to instrument
I. Continuous measurement of 02 (02 between 10% and 100%)
2062
Technical Specifications for all Monitors
a. 02 compensation: error in CO2 reading less than &l%.
b. N20 compensation (N20 is assumed to be 100% minus 02%): error in CO2 reading less
than &l%.
II. Standard compensation (02 parameter off)
a. 02 compensation (45% 02 assumed): error in CO2 reading lessthan f3%, for actual 02
concentrations of 20% to 70%.
b. N20 compensation (if selected, 55% N20 assumed): error in CO2 reading less than
&6%, for actual 02 concentrations of 20% to 70% and actual N20 concentrations of
30% to 80%.
Instantaneous CO2 Wave Display
Waveform displayed, with graticule lines, in channel 2 (height 32 mm) or over channels 2 and
3 (height 64 mm).
End Tidal CO2 Numerical Display
Range:
1 to 150 mmHg (0 to 20 kPa)
Instrument accuracy:
3t2 mmHg (0.29 kPa) &l/2 LSD*
(CO;! = 0 to 40 mmHg (5.34 kPa),
f5.5% f1/2 LSD
(CO2 = 40 mmHg (5.34 kPa)
to 100 mmHg (13.3 kPa)).
*LSD = Least Significant Digit.
Respiration Rate Numerical Display
Range:
0 to 150 rpm
Instrument Accuracy:
f 2 rpm
Alarms
Medical Alarms (audible and CO2 WAVE Inspired Minimum Indicated when minimum value
of CO2 wave lies above 4 mmHg (0.53 kPa).
visual):
End Tidal COz:
l.High CO2
Limit selectable from 20 to 100 mmHg (2 to 14 kPa)
2.Low co2
Limit selectable from 10 to 95 mmHg (1 to 13 kPa)
Alarm Delay:
15 s
Respiration Rate:
High respiration rate
Alarm delay:
10 s
Apnea alarm (no change in
instananeous CO2 value):
Alarm delay:
Technical Alarms (audible
and visual):
Test Signal:
selectable from 10 to 40 s.
Transducer disconnected.
O/40 mmHg (O/6 kP a) square wave at 25 rpm, 50% duty cycle.
Technical Specifications for all Monitors
2~63
Graticule Line Labelling and Resolution:.
Range hmHg)
0
0
to
to
60
90
Graticule
Line Labeling
Lower
Upper
0
40
0
60
Range (kPa)
0
0
2c-64
to
to
9
13.5
Lower
0
0
Upper
6
9
Technical Specifications for all Monitors
Resolution
32 mm scale
20.8
31.2
hmHg/cm)
64 mm scale
10.4
15.6
Resolution
32 mm scale
3.12
4.69
(kPa/cm)
64 mm scale
1.56
2.34
Technical Specifications
- 78356A
This section contains the technical specifications for the 78356A gas monitor. The general
instrument specifications are followed by those for the individual parameters.
General
Patient safety
H All inputs are CF-type.
n Option NO1 meets safety requirements CSA(C22.2 No.125).
n Option NO2 meets safety requirements of IEC 601-l.
n Option NO4 meets safety requirements of UL 544.
n Defibrillator
protection up to 5 kV.
Power requirements
Operating voltage:
115 V/230 V +10% -15% (IEC/USA)
115 V 1230 V +lO% -22% (Japan)
Frequency:
50/60 Hz,
Power consumption:
78356A - 95 W (max)
Environment
Operating temperature:
0°C to 55OC
Storage temperature:
-40°C to f75”C
Relative humidity:
5% to 95%
Size:
160 mm high, 320 mm wide, 405 mm deep
Weight:
11 kg (24 lbs)
Trends stored at power off condition for a minimum of 1 hour.
Display
Superaster video display:
Screen size:
140 mm x 105 mm; 178 mm diagonal
Sweep speed:
12.5 mm/s, 25 mm/s or 50 mm/s gives 8 s, 4 s or 2 s of display
respectively. (For COz capnogram, a speed of 6.25 mm/s is also
available.)
Display mode:
fixed trace (moving bar).
Technical Specifications for all Monitors
2~65
Waveform display height:
Channel 1
30 mm f 10%
-____-----------------------------Channel 2
normal
Channel 3
mode
32 mm f 10%
----_-----------------------------Channel 2
overlapping
Channel 3
mode
64 mm It 10%
Numeric update time:
2s
Resolution:
256 dots vertical,
500 dots horizontal.
Inspired Oxygen
Range:
18% to 110%
Resolution:
1%
Instrument Accuracy:
+2.5% of full Scale (21% calibration) or
+2.0% of full Scale (100% calibration).
Warm up time using 15203A from standby, less than 1 min,
unpolarized, less than 2 hours
transducer:
Instrument back up time
(internal battery):
greater than 4 days.
Medical Alarms (audible and High 02 alarm
(limit selectable from 24 to 100%)
visual):
Low 02 alarm
(limit selectable from 18 to 90%)
Alarm delay:
15 s
Technical Alarm (audible and Transducer disconnected
Break in sensor cable.
visual):
Test Signal:
21% 02
Carbon Dioxide
General
Warm up Time:
15 min. (accuracy within 0.3 mmHg CO2).
+1 mmHg (over 7 day period).
< 25 ms (for step from 10 to 90%)
Stability:
fl
Response Time:
< 25 ms (for step from 10% to 90%)
mmHg (over 7 day period).
The following errors are due to Oz/N20
accuracies given in the sections below.
compensation and are additional to instrument
I. Continuous measurement of 02 (02 between 10% and 100%)
a. 02 compensation: error in CO2 reading less than +l%.
2066
Technical Specifications for all Monitors
b. N20 compensation (N20 is assumed to be 100% minus 02%): error in CO2 reading less
than +l%.
II. Standard compensation (02 parameter off)
a. 02 compensation (45% 02 assumed): error in CO2 reading less than +3%, for actual
02 concentrations of 20% to 70%.
b. N20 compensation (if selected, 55% N20 assumed): error in CO2 reading less than
+S%, for actual 02 concentrations of 20% to 70% and actual N20 concentrations of
30% to 80%.
Instantaneous CO2 Wave Display
Waveform displayed, with graticule lines, in channel 2 (height 32 mm) or over channels 2 and
3 (height 64 mm).
End Tidal and Inspired Minimum CO2 Numerical Display
Range:
1 to 150 mmHg (0 to 20 kPa)
Instrument accuracy:
-l-2 mmHg (0.27 kPa) for CO2 values
(CO2 = 0 to 40 mmHg (5.34 kPa),
< 40 mmHg (5.34 kPa), f5% for CO2 values between 40
mmHg (5.34 kPa) and 100 mmHg (13.3 kPa).
Respiration Rate Numerical Display
Range:
0 to 150 rpm
Instrument Accuracy:
i-2 rpm
Alarms
Medical Alarms (audible and CO;! Inspired Minimum
Indicated when minimum value of CO2 wave lies above 4
visual):
mmHg (0.53 kPa).
End Tidal CO2:
High CO2
Limit selectable from 20 to 100 mmHg - (2 to 14 kPa)
Low co2
Limit selectable from 10 to 95 mmHg (1 to 13 kPa)
Alarm Delay:
15 s
Respiration Rate:
High respiration rate
Alarm delay:
10 s
Apnea alarm:
(no change in instananeous CO2 value)
Alarm delay:
selectable from 10 to 40 s.
Technical Alarms (audible
and visual):
Test Signal:
Transducer disconnected.
O/40 mmHg (O/6 kP a) square wave at 25 rpm, 50% duty cycle.
Graticule Line Labeling and Resolution:
Range bmHg)
Graticule
Line Labeling
Resolution
(mmHg/cm)
Technical Specifications for all Monitors
2~67
0
0
to
to
60
90
Lower
0
0
UPPer
40
60
Range (kPa)
0
0
to
to
9
13.5
Lower
0
0
UPPer
6
9
32 mm scale
20.8
31.2
64 mm scale
10.4
15.6
Resolution
32 mm scale
3.12
4.69
(kPa/cm)
64 mm scale
1.56
2.34
Trend
General
Long trend:
24, 8, 4, or 2h
Short trend:
60 or 20 mins
One long trend and one short trend are available on each parameter. Points on trend curve
are averaged values. . . . Alarms are shown as actual values. , , . Power off, INOP and Alarms off
are indicated.
Oxygen Channel
02 trend:
Range:
0 to 100%
Resolution:
1% volume of 02
Display points per trend
curve:
384
Carbon Dioxide Channel
CO2 end tidal value trend:
Range:
0 to 60 mmHg/SkPa (selected scale 40 mmHg/GkPa), or
0 to 90 mmHg/l3.5kPa (selected scale 60 mmHg/SkPa)
Resolution:
1 mmHg/O.lS kPa
Display points per trend
curve:
384
System Interface
General (Opt. Jll
Auxiliary
only)
signals and parameters:
Internal processing accuracy:
f 50 mV
Selectable channels for external recorder:
Internal processing accuracy:
f50 mV
Delay mode:
12 s delay time
2c-68
Technical Specifications for all Monitors
Parameters off condition:
-1 v
Instantaneous CO2
Range:
O-90 mmHg (O-9 kPa) O-4 V
Test:
square wave with 0 and 40 mmHg, 30 bpm
End Tidal CO2
Range:
O-150 mmHg (O-15 kPa) O-3 V
Test:
40mmHg
Respiration Rate
Range:
O-150 rpm, O-3 V
Test:
30 rpm
02
Range:
O-100%, o-3 v
Test:
100% 02
Technical Specifications for all Monitors
2c-69
A
Ordering Information
Main Sales and Support Offices
United States of America
United States of America
Customer Information Center
(800) 752-0900
6:00 AM to 5 PM Pacific Time
Eastern USA
Hewlett-Packard Co.
2101 Gaither Road
ROCKVILLE,
MD 20850
Tel: (301) 670-4300
Midwestern USA
Hewlett-Packard Co.
5201 Tollview Drive
ROLLING MEADOWS,
Tel: (708) 255-9800
Southern USA
Hewlett-Packard Co.
2015 South Park Place
ATLANTA, GA 30339
Tel: (404) 955-1500
Western USA
Hewlett-Packard Co.
5161 Lankershim Blvd.
NORTH HOLLYWOOD,
Tel: (818) 505-5600
IL 60008
CA 91601
Ordering Information
A-l
Other International Areas
European Headquarters
Hewlett-Packard S.A.
150 Route du Nante-d’Avri1
CH-1217, Meyrin 2
Geneva, Switzerland
Tel: ($41 22) 780 81 11
Canada
Hewlett-Packard Ltd.
6877 Goreway Drive
Mississauga,
Ontario
L4V lM8
Tel: (416) 678-9430
Latin America
Hewlett-Packard Latin America
5200 Blue Lagoon Drive
Suite 950
Miami, FL 33126
Tel: (305) 267-4220
Japan
Hewlett-Packard Asia Pacific, Ltd.
l-3-2, Murotani, Nishi-ku
Kobe-shi, Hyogo 651-22,
Japan
Tel: (+81 78) 993-2628
Australia/New
Zealand
Asia Pacific
Hewlett-Packard Singapore (Sales) Pte. Ltd. Hewlett-Packard Australia Ltd.
31-41 Joseph Street
150 Beach Road, #29-00
Blackburn,
Victoria 3130
Gateway West,
Australia
(ACN
004 394 763)
Singapore 0718
Tel:
(03)
272
2895
Tel: (65) 291-9088
Austria/Central
Europe
Austria Office
Tel: (+43 222) 2500 0
Belgium/Luxembourg
Belgium Office
Tel: (+32 2) 761 31 11
Denmark
Tel: 45 99 10 00
Finland
Tel: (90) 887 21
France
Tel: (1) 69 82 60 60
Germany
Tel: (06172) 16-O
Italy
Tel: (02) 92 19 91
Middle East/Africa/Greece/Turkey
Geneva Office
Tel: ($41 22) 780 41 11
Netherlands
Tel: (020) 547 6335
Spain
Tel: (91) 626 19 01
Sweden
Tel: (08) 750 20 00
Switzerland
Tel: (057) 31 21 11
United Kingdom
Tel: (0344) 369269
A-2
Ordering Information