1
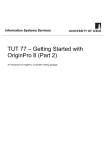
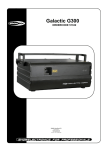
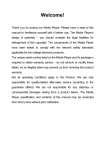
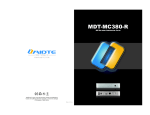
Chapter 8: Plotting: Origin’s Built-in Graph Types
Plotting: Origin’s Built-in
Graph Types
2D Line, Scatter, and Line + Symbol Graphs
2D Line, Scatter, and Line + Symbol Graphs • 181
Chapter 8: Plotting: Origin’s Built-in Graph Types
2 Point Segment Graph
Data Requirements
Requires a selection of at least one Y column of values (or a range from at least one column). If the Y
column(s) has an associated X column, then the X column supplies the X values. Otherwise, the
worksheet’s default X values are used.
Creating the Graph
Select Plot:Special Line/Symbol:2 Point Segment or click the 2 Point Segment button
Graphs Extended toolbar.
on the 2D
Template
The 2 point segment graph is created from the LINESYMB.OTP template located in the Origin folder.
Notes
The line connection between points alternates between a straight line and no line (the connection type is set
to Segment on the Line tab of the Plot Details dialog box (Format:Plot)). Thus, every two consecutive
data points are connected by a line (the first and second data points, the third and fourth data points, etc.).
The data points are displayed as symbols.
2D Line, Scatter, and Line + Symbol Graphs • 182
Chapter 8: Plotting: Origin’s Built-in Graph Types
3 Point Segment Graph
Data Requirements
Requires a selection of at least one Y column of values (or a range from at least one column). If the Y
column(s) has an associated X column, then the X column supplies the X values. Otherwise, the
worksheet’s default X values are used.
Creating the Graph
Select Plot:Special Line/Symbol:3 Point Segment or click the 3 Point Segment button
Graphs Extended toolbar.
on the 2D
Template
The 3 point segment graph is created from the LINESYMB.OTP template located in the Origin folder.
Notes
The line connection display alternates between a straight line for three data points, then no line to the next
data point, a straight line for three data points, etc. (the connection type is set to Segment 3 on the Line tab
of the Plot Details dialog box (Format:Plot)). Thus, every three consecutive data points are connected by
two lines (the first, second, and third data points; the fourth, fifth, and sixth data points; etc.). The data
points are displayed as symbols.
2D Line, Scatter, and Line + Symbol Graphs • 183
Chapter 8: Plotting: Origin’s Built-in Graph Types
Horizontal Step Graph
Data Requirements
Requires a selection of at least one Y column of values (or a range from at least one column). If the Y
column(s) has an associated X column, then the X column supplies the X values. Otherwise, the
worksheet’s default X values are used.
Creating the Graph
Select Plot:Special Line/Symbol:Horizontal Step or click the Horizontal Step button
Graphs Extended toolbar.
on the 2D
Template
The horizontal step graph is created from the LINE.OTP template located in the Origin folder.
Notes
Each data point in the data plot is connected by a line. The line connection type is set to a step horizontal
connection on the Line tab of the Plot Details dialog box (Format:Plot). The step horizontal connection
creates a right angle connection between data points, with an initial horizontal line. The data points are not
displayed.
2D Line, Scatter, and Line + Symbol Graphs • 184
Chapter 8: Plotting: Origin’s Built-in Graph Types
Line Graph
Data Requirements
Requires a selection of at least one Y column of values (or a range from at least one column). If the Y
column(s) has an associated X column, then the X column supplies the X values. Otherwise, the
worksheet’s default X values are used.
Creating the Graph
Select Plot:Line or click the Line button
on the 2D Graphs toolbar.
Template
The line graph is created from the LINE.OTP template located in the Origin folder.
2D Line, Scatter, and Line + Symbol Graphs • 185
Chapter 8: Plotting: Origin’s Built-in Graph Types
Line Series Graph
Data Requirements
Requires a selection of two or three Y columns of values.
Creating the Graph
Select Plot:Special Line/Symbol:Line Series or click the Line Series button
Extended toolbar.
on the 2D Graphs
Template
The line series graph is created from the LSER2.OTP template (two Y columns) or the LSER3.OTP
template (three Y columns) located in the Origin folder.
Notes
After clicking the Line Series button, Origin creates a new (hidden) worksheet, LineSeriesn. This
worksheet includes two columns that contain the selected Y column numbers (1, 2, or 3) and the associated
cell values.
2D Line, Scatter, and Line + Symbol Graphs • 186
Chapter 8: Plotting: Origin’s Built-in Graph Types
For example, select the three Y columns in the following worksheet and click the Line Series button.
This action produces the following (modified) LineSeries1 worksheet (To view the worksheet, doubleclick on the LineSeries1 worksheet icon on the right pane of the Project Explorer).
The line series graph emphasizes the trend in values with a worksheet row. Each series of row values
comprises a line + symbol data plot. The data plot’s X values are determined by the selected Y column
number (1, 2, or 3). The data plot’s Y values are determined by the actual cell values in the selected
column.
2D Line, Scatter, and Line + Symbol Graphs • 187
Chapter 8: Plotting: Origin’s Built-in Graph Types
Line+Symbol Graph
Data Requirements
Requires a selection of at least one Y column of values (or a range from at least one column). If the Y
column(s) has an associated X column, then the X column supplies the X values. Otherwise, the
worksheet’s default X values are used.
Creating the Graph
Select Plot:Line+Symbol or click the Line + Symbol button
on the 2D Graphs toolbar.
Template
The line+symbol graph is created from the LINESYMB.OTP template located in the Origin folder.
2D Line, Scatter, and Line + Symbol Graphs • 188
Chapter 8: Plotting: Origin’s Built-in Graph Types
2D Scatter Graph
Data Requirements
Requires a selection of at least one Y column of values (or a range from at least one column). If the Y
column(s) has an associated X column, then the X column supplies the X values. Otherwise, the
worksheet’s default X values are used.
Creating the Graph
Select Plot:Scatter or click the Scatter button
on the 2D Graphs toolbar.
Template
The scatter graph is created from the SCATTER.OTP template located in the Origin folder.
2D Line, Scatter, and Line + Symbol Graphs • 189
Chapter 8: Plotting: Origin’s Built-in Graph Types
Spline Connected Graph
Data Requirements
Requires a selection of at least one Y column of values (or a range from at least one column). If the Y
column(s) has an associated X column, then the X column supplies the X values. Otherwise, the
worksheet’s default X values are used.
Creating the Graph
Select Plot:Special Line/Symbol:Spline or click the Spline Connected button
Extended toolbar.
on the 2D Graphs
Template
The spline connected graph is created from the LINESYMB.OTP template located in the Origin folder.
Notes
Each data point in the data plot is connected by a line. The line connection type is set to a spline
connection on the Line tab of the Plot Details dialog box (Format:Plot). The data points are displayed as
symbols.
2D Line, Scatter, and Line + Symbol Graphs • 190
Chapter 8: Plotting: Origin’s Built-in Graph Types
Vertical Drop Line Graph
Data Requirements
Requires a selection of at least one Y column of values (or a range from at least one column). If the Y
column(s) has an associated X column, then the X column supplies the X values. Otherwise, the
worksheet’s default X values are used.
Creating the Graph
Select Plot:Special Line/Symbol:Vertical Drop Line or click the Vertical Drop Line button
2D Graphs Extended toolbar.
on the
Template
The vertical drop line graph is created from the DROPLINE.OTP template located in the Origin folder.
Notes
This graph type emphasizes the difference in magnitude between data points in a data plot. The data points
are displayed as symbols. A vertical line displays from each data point symbol to the X axis.
2D Line, Scatter, and Line + Symbol Graphs • 191
Chapter 8: Plotting: Origin’s Built-in Graph Types
Vertical Step Graph
Data Requirements
Requires a selection of at least one Y column of values (or a range from at least one column). If the Y
column(s) has an associated X column, then the X column supplies the X values. Otherwise, the
worksheet’s default X values are used.
Creating the Graph
Select Plot:Special Line/Symbol:Vertical Step or click the Vertical Step button
Extended toolbar.
on the 2D Graphs
Template
The vertical step graph is created from the LINE.OTP template located in the Origin folder.
Notes
Each data point in the data plot is connected by a line. The line connection type is set to a step vertical
connection on the Line tab of the Plot Details dialog box (Format:Plot). The step vertical connection
creates a right angle connection between data points, with an initial vertical line. The data points are not
displayed.
2D Line, Scatter, and Line + Symbol Graphs • 192
Chapter 8: Plotting: Origin’s Built-in Graph Types
2D Bar and Column Graphs
2D Bar Graph
Data Requirements
Requires a selection of at least one Y column of values (or a range from at least one column). If the Y
column(s) has an associated X column, then the X column supplies the X values. Otherwise, the
worksheet’s default X values are used.
Creating the Graph
Select Plot:Bar or click the Bar button
on the 2D Graphs toolbar.
Template
The bar graph is created from the BAR.OTP template located in the Origin folder.
Notes
The Y value of each data point in the data plot is represented as the length of a horizontal bar. Each bar
has a fixed width, and each worksheet row of bar values is centered at the associated X value. The X
values plot along the vertical axis.
2D Bar and Column Graphs • 193
Chapter 8: Plotting: Origin’s Built-in Graph Types
To establish Y=1 as the "floor", or Y value which alters the direction of bar graphs displayed on a
logarithmic scale, select the Log Scale use 1 as Floor check box on the Graph tab in the Options dialog box
(Tools:Options). To display a line when Y=0, select the Bar Graph Show Zero Values check box on the
Graph tab of the Options dialog box (Tools:Options).
2D Bar and Column Graphs • 194
Chapter 8: Plotting: Origin’s Built-in Graph Types
Column Graph
Data Requirements
Requires a selection of at least one Y column of values (or a range from at least one column). If the Y
column(s) has an associated X column, then the X column supplies the X values. Otherwise, the
worksheet’s default X values are used.
Creating the Graph
Select Plot:Column or click the Column button
on the 2D Graphs toolbar.
Template
The column graph is created from the COLUMN.OTP template located in the Origin folder.
Notes
The Y value of each data point in the data plot is represented as the height of a column. Each column has a
fixed width, and each "X group" of columns is centered at the associated X value.
To establish Y=1 as the "floor", or Y value which alters the direction of column graphs displayed on a
logarithmic scale, select the Log Scale use 1 as Floor check box on the Graph tab in the Options dialog box
(Tools:Options).
To display a line when Y=0, select the Bar Graph Show Zero Values check box on the Graph tab of the
Options dialog box (Tools:Options).
2D Bar and Column Graphs • 195
Chapter 8: Plotting: Origin’s Built-in Graph Types
Floating Bar Graph
10
9
8
7
6
5
4
3
2
1
0
2
4
6
8
10
Data Requirements
Requires a selection of at least two Y columns of values (or a range from at least two columns). If an X
column is present to the left of the Y columns in the worksheet, the X column supplies the X values.
Otherwise, the worksheet’s default X values are used.
Creating the Graph
Select Plot:Special Bar/Column:Floating Bar or click the Floating Bar button
Extended toolbar.
on the 2D Graphs
Template
The floating bar graph is created from the FLOATBAR.OTP template located in the Origin folder.
Notes
The floating bar graph displays Y values as beginning, intermediate, and ending bar levels for each X
value. The X values plot along the vertical axis.
The first Y data set provides the starting Y position for each bar graph. The second Y data set provides an
intermediate level and defines a bar between the starting position and the current position. The third
(fourth, etc.) Y data set provides an additional intermediate value and defines a bar between the previous
intermediate value and the current value. The final Y data set provides an ending value and defines a bar
between the previous intermediate value and the current value.
2D Bar and Column Graphs • 196
Chapter 8: Plotting: Origin’s Built-in Graph Types
Floating Column Graph
10
8
6
4
2
0
1
2
3
4
5
6
7
8
9
10
Data Requirements
Requires a selection of at least two Y columns of values (or a range from at least two columns). If an X
column is present to the left of the Y columns in the worksheet, the X column supplies the X values.
Otherwise, the worksheet’s default X values are used.
Creating the Graph
Select Plot:Special Bar/Column:Floating Column or click the Floating Column button
Graphs Extended toolbar.
on the 2D
Template
The floating column graph is created from the FLOATBAR.OTP template located in the Origin folder.
Notes
The floating column graph displays Y values as beginning, intermediate, and ending column levels for
each X value.
The first Y data set provides the starting Y position for each column graph. The second Y data set
provides an intermediate level and defines a column between the starting position and the current position.
The third (fourth, etc.) Y data set provides an additional intermediate value and defines a column between
the previous intermediate value and the current value. The final Y data set provides an ending value and
defines a column between the previous intermediate value and the current value.
2D Bar and Column Graphs • 197
Chapter 8: Plotting: Origin’s Built-in Graph Types
Stack Bar Graph
10
9
8
7
6
5
4
3
2
1
0
2
4
6
8
10
Data Requirements
Requires a selection of at least one Y column of values (or a range from at least one column). If the Y
column(s) has an associated X column, then the X column supplies the X values. Otherwise, the
worksheet’s default X values are used.
Creating the Graph
Select Plot:Special Bar/Column:Stack Bar or click the Stack Bar button
Extended toolbar.
on the 2D Graphs
Template
The stack bar graph is created from the BAR.OTP template located in the Origin folder.
Notes
For each X value, the associated Y values are represented as the length of a bar. Each bar has a fixed
width. The bars, however, are stacked on each other so that the second bar segment begins at the end of
the first bar, etc. The stack of bars is centered at the associated X value. The X values plot along the
vertical axis. To unstack the bars, select Graph:Stack Grouped Data in Layer (to de-select the menu
command).
To display a line when Y=0, select the Bar Graph Show Zero Values check box on the Graph tab of the
Options dialog box (Tools:Options).
2D Bar and Column Graphs • 198
Chapter 8: Plotting: Origin’s Built-in Graph Types
Stack Column Graph
10
8
6
4
2
0
1
2
3
4
5
6
7
8
9
10
Data Requirements
Requires a selection of at least one Y column of values (or a range from at least one column). If the Y
column(s) has an associated X column, then the X column supplies the X values. Otherwise, the
worksheet’s default X values are used.
Creating the Graph
Select Plot:Special Bar/Column:Stack Column or click the Stack Column button
Extended toolbar.
on the 2D Graphs
Template
The stack column graph is created from the COLUMN.OTP template located in the Origin folder.
Notes
For each X value, the associated Y values are represented as the height of a column. Each column has a
fixed width. The columns, however, are stacked on each other so that the second column begins at the end
of the first column, etc. The stack of columns is centered at the associated X value. To unstack the
columns, select Graph:Stack Grouped Data in Layer (to de-select the menu command).
To display a line when Y=0, select the Bar Graph Show Zero Values check box on the Graph tab of the
Options dialog box (Tools:Options).
2D Bar and Column Graphs • 199
Chapter 8: Plotting: Origin’s Built-in Graph Types
Area, Polar, and 2D Waterfall Graphs
Area Graph
4.0
3.5
3.0
2.5
2.0
1.5
1.0
0.5
0.0
1
2
3
4
5
6
7
8
9
10
Data Requirements
Requires a selection of at least one Y column of values (or a range from at least one column). If the Y
column(s) has an associated X column, then the X column supplies the X values. Otherwise, the
worksheet’s default X values are used.
Creating the Graph
Select Plot:Area or click the Area button
on the 2D Graphs toolbar.
Template
The area graph is created from the AREA.OTP template located in the Origin folder.
Notes
When one Y column of values (or a range from one column) is selected, the area between the data plot and
the "From" Y axis value is filled by default. When more than one Y column of values (or a range from
more than one column) is selected, each successive column of values displays as an area graph that is
stacked on the previous area graph. Thus, the upper bounds of the previous area graph becomes the
baseline of the next area graph. To plot each of the data plots so that the area between the data plot and the
"From" Y axis value is filled, select Graph:Stack Grouped Data in Layer (to de-select this command).
Area, Polar, and 2D Waterfall Graphs • 200
Chapter 8: Plotting: Origin’s Built-in Graph Types
Fill Area Graph
22
20
18
16
14
12
10
8
6
4
2
0
0
2
4
6
8
10
Data Requirements
Requires a selection of two Y columns of values (or a range from two columns). If an X column is present
to the left of the Y columns in the worksheet, the X column supplies the X values. Otherwise, the
worksheet’s default X values are used.
Creating the Graph
Select Plot:Fill Area or click the Fill Area button
on the 2D Graphs toolbar.
Template
The fill area graph is created from the FILLAREA.OTP template located in the Origin folder.
Notes
The area between the data plots determined by both Y columns is filled.
Area, Polar, and 2D Waterfall Graphs • 201
Chapter 8: Plotting: Origin’s Built-in Graph Types
Polar Graph
12
10
8
6
4
2
0
0
2
4
6
8
10
12
Data Requirements
Requires a selection of at least one Y column of values (or a range from at least one column). If the Y
column(s) has an associated X column, then the X column supplies the X values. Otherwise, the
worksheet’s default X values are used.
Note: To learn more polar graphs, review the POLAR.OPJ project located in your Origin
\SAMPLES\GRAPHING\2D PLOTS folder.
Creating the Graph
Select Plot:Polar or click the Polar button
on the 2D Graphs toolbar.
Template
The polar graph is created from the POLAR.OTP template located in the Origin folder.
Notes
The polar graph displays data in terms of the radial position versus the angular value in units of degrees.
The Y value determines the radial position of the data point. The X value determines the angular value of
the data point.
Three buttons are provided in the graph window. Click Set Angular Range to modify the starting and
ending angular values, as well as the increment. Click "90 ← 0" button to set the first angular value at
"3:00" and increment counterclockwise. Click "0 → 90" button to set the first angular value at "12:00" and
increment clockwise.
Select the Fixed from 0 radio button to display the polar graph with the center of the graph representing a
Y value of 0. Select the Use Y-Axis Range radio button to display the polar graph with the center of the
graph representing the Y axis scale “From” text box value (on the Scale tab of the Axis dialog box).
Area, Polar, and 2D Waterfall Graphs • 202
Chapter 8: Plotting: Origin’s Built-in Graph Types
To Modify the Angular Range
Click Set Angular Range to open the Angular Range dialog box. Specify the starting and ending angular
values, as well as the angular increment.
To Modify the Circular Grids
Select Format:Axes:Y Axis to open the Y Axis dialog box. Select the Grid Lines tab. Horizontal is the
active selection in the Selection list box. Horizontal grids are equivalent to circular grids in a polar graph.
To customize the circular grids, make modifications to this tab when Horizontal is selected from the
Selection list box.
To Modify the Radial Grids
Select Format:Axes:X Axis to open the X Axis dialog box. Select the Grid Lines tab. Vertical is the
active selection in the Selection list box. Vertical grids are equivalent to radial grids in a polar graph. To
customize the radial grids, make modifications to this tab when Vertical is selected from the Selection list
box.
Area, Polar, and 2D Waterfall Graphs • 203
Chapter 8: Plotting: Origin’s Built-in Graph Types
2D Waterfall Graph
11
10
9
8
7
6
5
4
3
2
1
0
0
2
4
6
8
10
Data Requirements
Requires a selection of at least one Y column (or a range from at least one Y column). Ideally, select at
least two Y columns of values (or a range of at least two Y columns). If the Y column(s) has an associated
X column, then the X column supplies the X values. Otherwise, the worksheet’s default X values are used.
Creating the Graph
Select Plot:Special Line/Symbol:Waterfall or click the Waterfall button
toolbar.
on the 2D Graphs Extended
Template
The waterfall graph is created from the WATERFAL.OTP template located in the Origin folder.
Notes
The waterfall graph is ideal for comparing variations between multiple data sets created under similar
conditions. The graph has a pseudo-3D effect, enabling you to see variations in the Z direction.
Each data set is displayed as a line data plot which is offset by a specified amount in both the X and Y
direction. To adjust the data plot offset, click the Offset Amount button in the graph window. This action
opens a dialog box in which you control the offset. Select or clear the offset from the XY Offset dropdown list. Specify the Y offset in the Total Y Offset (%) text box. Specify the X offset in the Total X
Offset (%) text box.
Click the Reverse Order button in the graph window to switch the order in which the data sets are plotted.
Thus, the first data set is plotted last, the last data set is plotted first, etc., providing a different perspective
on data set relations.
To fill the area below each line data plot, click the Fill Area button in the graph window. This action opens
a dialog box in which you control the fill display. Select the Enable Fill check box to fill the area beneath
the data plot with the color specified from the Fill with Color drop-down list. Select the Side Lines check
box to display vertical drop lines at the first and last data points in each of the data plots (using the
specified fill color).
Area, Polar, and 2D Waterfall Graphs • 204
Chapter 8: Plotting: Origin’s Built-in Graph Types
Note: You can also control the fill from the Plot Details dialog box.
Area, Polar, and 2D Waterfall Graphs • 205
Chapter 8: Plotting: Origin’s Built-in Graph Types
Pie Charts
20%
15%
10%
20%
5%
5%
15%
10%
Data Requirements
Requires a selection of exactly one Y column of values (or a range from one column).
Note: To learn more about pie charts, review the 3D PIE CHART.OPJ project located in your Origin
\SAMPLES\GRAPHING\3D PLOTS folder.
Creating the Graph
Select Plot:Pie or click the Pie Chart button
on the 2D Graphs toolbar.
Template
The pie chart is created from the PIE.OTP template located in the Origin folder.
Notes
The selected values are summed, and the percentage of the total is determined for each selected value. The
pie chart displays the percentage of the total for each selected value as a pie section.
Pie Charts • 206
Chapter 8: Plotting: Origin’s Built-in Graph Types
Smith Charts
Data Requirements
Requires a selection of at least one Y column of values (or a range from at least one column). If the Y
column(s) has an associated X column, then the X column supplies the X values. Otherwise, the
worksheet’s default X values are used.
Creating the Graph
Select Plot:Smith Chart or click the Smith Chart button
on the 2D Graphs toolbar.
Template
The Smith Chart graph is created from the SMITHCHT.OTP template located in the Origin folder.
Notes
To customize the Smith Chart, edit the Plot Details and Axes dialog boxes. Additionally, click the
button to open the Smith Chart tool.
The Normalization Group
Re-normalize the current Smith Chart by entering or selecting a factor from the Factor combo box. Click
Normalize to perform the normalization.
Smith Charts • 207
Chapter 8: Plotting: Origin’s Built-in Graph Types
The Current Active Data Set Group
If you have plotted multiple data sets into the Smith Chart, the "Convert Data to Mag / Angle" and the
"Reinterpret Data as Mag / Angle" buttons act on the active data plot. You can change the active data plot
in the Smith Chart from the Data menu or by selecting the data plot icon in the legend. To update the
Smith Chart tool with this change, click the Update button on the tool. (Note: R = real part, X = imaginary
part)
The "Convert Data to Mag / Angle" Button
Click this button to convert the active data plot into the Mag / Angle format and put the data in the source
worksheet.
The "Reinterpret Data as Mag / Angle" Button
Click this button to treat the active data plot as the Mag / Angle format, and convert the data into R / X
format. The data is then re-plotted.
The "Reverse R Axis" Button
Click this button to reverse the real part axis of the Smith Chart.
The Constant SWR Circle Group
Given the point position specified, select the circle point density and the line color. Click the Add button
to add a constant SWR circle through the given point.
Smith Charts • 208
Chapter 8: Plotting: Origin’s Built-in Graph Types
Vector Graphs
X, Y, Angle, Magnitude Vector Graph
4
3
2
1
0
0
2
4
6
8
10
Data Requirements
Requires a selection of three Y columns (or a range from three Y columns). If an X column is present to
the left of the Y columns in the worksheet, the X column supplies the X values. Otherwise, the
worksheet’s default X values are used.
Creating the Graph
Select Plot:Vector XYAM or click the Vector XYAM button
on the 2D Graphs toolbar.
Template
The XYAM vector graph is created from the VECTOR.OTP template located in the Origin folder.
Notes
The leftmost Y column controls the Y coordinate of the vector tail (by default). The second Y column
determines the angle of the vector. The angle is measured counterclockwise from a line parallel to the X
axis, bisecting the vector. The third Y column controls the vector length in units of points. The Plot
Details dialog box provides a control to scale the length of the vector.
Vector Graphs • 209
Chapter 8: Plotting: Origin’s Built-in Graph Types
X, Y, X, Y Vector Graph
5
4
3
2
1
0
0
2
4
6
8
10
Data Requirements
Requires a selection of two X columns and two Y columns (or a range from these columns).
Creating the Graph
Select Plot:Vector XYXY or click the Vector XYXY button
on the 2D Graphs toolbar.
Template
The XYXY vector graph is created from the VECTXYXY.OTP template located in the Origin folder.
Notes
The leftmost X and Y columns determine the XY coordinate of the tail of the vector. The second set of X
and Y columns determine XY coordinate of the head of the vector.
Vector Graphs • 210
Chapter 8: Plotting: Origin’s Built-in Graph Types
High-Low-Close Charts
35
30
25
20
15
10
5
0
0
2
4
6
8
10
Data Requirements
Requires a selection of exactly three Y column of values (or a range from three columns). The leftmost Y
column contains the high values, the next Y column displays the low values, and the last Y column
displays the closing values. If an X column is present to the left of the Y columns in the worksheet, the X
column supplies the X values. Otherwise, the worksheet’s default X values are used.
Creating the Graph
Select Plot:High-Low-Close or click the High-Low-Close button
on the 2D Graphs toolbar.
Template
The High-Low-Close chart is created from the HLCLOSE.OTP template located in the Origin folder.
Notes
The chart displays the high and low Y values for a given X value. These values are connected by a vertical
line (the data points aren’t displayed). The close Y value for a given X value displays as a tick on the
vertical line.
High-Low-Close Charts • 211
Chapter 8: Plotting: Origin’s Built-in Graph Types
Ternary Graphs
0.00
0.25
1.00
0.75
0.50
0.50
0.75
0.25
1.00
0.00
0.00
0.25
0.50
0.75
1.00
Data Requirements
Requires a selection of one Z column of values (or a range from one Z column). The worksheet must also
contain Y column values (and typically X column values). If an X column is present to the left of the Y
column in the worksheet, the X column supplies the X values. Otherwise, the worksheet’s default X values
are used.
Note: To learn more about the ternary diagram, review the TERNARY.OPJ project located in your Origin
\SAMPLES\GRAPHING\2D PLOTS folder.
Creating the Graph
Select Plot:Ternary or click the Ternary button
on the 2D Graphs toolbar.
Template
The ternary diagram is created from the TERNARY.OTP template located in the Origin folder.
Notes
Ternary diagrams are used to represent the relative percentage of three components (X, Y, and Z). Each
worksheet row of X, Y, and Z values determines a data point in the ternary diagram.
When plotting XYZ data as a ternary diagram, Origin assumes that each row of X, Y, and Z values are
normalized (so that X+Y+Z = 1). If there is at least one data point that is currently not normalized, Origin
gives you the option to normalize your worksheet data when plotting a ternary diagram. When you
normalize your worksheet data for the ternary diagram, the Data Reader tool reads the actual X, Y, and Z
worksheet values in the diagram.
Ternary Graphs • 212
Chapter 8: Plotting: Origin’s Built-in Graph Types
In the ternary diagram, percentage values for the Y component are read from 0% at the lower-right corner
of the triangle, to 100% at the peak of the triangle. Percentage values for the Z component are read from
100% at the lower-left corner of the triangle, to 0% at the peak of the triangle. Percentage values for the X
component are read from 0% at the lower-left corner of the triangle to 100% at the lower-right corner of
the triangle.
Ternary Graphs • 213
Chapter 8: Plotting: Origin’s Built-in Graph Types
Multiple Layer Graphs
4 Panel Graph
6
10
8
4
6
4
2
2
0
0
0
2
4
6
8
10
0
2
4
6
8
10
0
2
4
6
8
10
6
10
8
4
6
4
2
2
0
0
0
2
4
6
8
10
Data Requirements
Requires a selection of at least one Y column of values (or a range from at least one column). Ideally,
select four Y columns of values. If the Y column(s) has an associated X column, then the X column
supplies the X values. Otherwise, the worksheet’s default X values are used.
Creating the Graph
Select Plot:Panel:4 Panel or click the 4 Panel button
on the 2D Graphs Extended toolbar.
Template
The 4 panel graph is created from the PAN4.OTP template located in the Origin folder.
Notes
Each column of Y values plots into a separate layer. The layers are arranged in two columns and two rows.
Multiple Layer Graphs • 214
Chapter 8: Plotting: Origin’s Built-in Graph Types
9 Panel Graph
6
10
10
8
8
4
6
6
4
2
4
2
0
2
0
2
4
6
8
10
0
0
2
4
6
8
10
0
2
4
6
8
10
0
2
4
6
8
10
0
2
4
6
8
10
6
1.0
10
0.8
8
4
0.6
6
0.4
4
2
0.2
2
0.0
0
0
0
2
4
6
8
10
0
2
4
6
8
10
0.35
10
1.00
0.30
0.95
8
0.25
0.90
0.20
6
0.15
0.85
4
0.10
0.80
0.05
2
0.75
0.00
0
0
2
4
6
8
10
0
2
4
6
8
10
Data Requirements
Requires a selection of at least one Y column of values (or a range from at least one column). Ideally,
select nine Y columns of values. If the Y column(s) has an associated X column, then the X column
supplies the X values. Otherwise, the worksheet’s default X values are used.
Creating the Graph
Select Plot:Panel:9 Panel or click the 9 Panel button
on the 2D Graphs Extended toolbar.
Template
The 9 panel graph is created from the PAN9.OTP template located in the Origin folder.
Notes
Each column of Y values plots into a separate layer. The layers are arranged in three columns and three
rows.
Multiple Layer Graphs • 215
Chapter 8: Plotting: Origin’s Built-in Graph Types
Double Y Axis Graph
10
1.0
8
0.8
6
0.6
4
0.4
2
0.2
0.0
0
0
2
4
6
8
10
Data Requirements
Requires a selection of at least two Y columns of values (or a range from at least two columns). If an X
column is present to the left of the Y columns in the worksheet, the X column supplies the X values.
Otherwise, the worksheet’s default X values are used.
Creating the Graph
Select Plot:Special Line/Symbol:Double Y or click the Double Y Axis button
Extended toolbar.
on the 2D Graphs
Template
The double Y axis graph is created from the DOUBLEY.OTP template located in the Origin folder.
Notes
The double Y axis graph contains two layers. Layer 2 is linked to layer 1. The X axis in layer 2 has a
straight one-to-one link with the X axis in layer 1.
If two columns of values are selected (or a range of two columns), then one data plot displays in each layer.
Each data point in the data plot is connected by a line. The default line connection between points is a
straight line. The data points are displayed as symbols.
Multiple Layer Graphs • 216
Chapter 8: Plotting: Origin’s Built-in Graph Types
Horizontal 2 Panel Graph
6
10
8
4
6
4
2
2
0
0
0
2
4
6
8
10
0
2
4
6
8
10
Data Requirements
Requires a selection of at least one Y column of values (or a range from at least one column). Ideally,
select two Y columns of values. If the Y column(s) has an associated X column, then the X column
supplies the X values. Otherwise, the worksheet’s default X values are used.
Creating the Graph
Select Plot:Panel:Horizontal 2 Panel or click the Horizontal 2 Panel button
Extended toolbar.
on the 2D Graphs
Template
The horizontal 2 panel graph is created from the PAN2HORZ.OTP template located in the Origin folder.
Notes
Each column of Y values plots into a separate layer. The two layers are arranged in two columns and one
row.
Multiple Layer Graphs • 217
Chapter 8: Plotting: Origin’s Built-in Graph Types
Stack Graph
6
4
2
0
10
8
6
4
2
0
6
4
2
0
0
2
4
6
8
10
Data Requirements
Requires a selection of at least one Y column (or a range from at least one Y column). Ideally, select at
least two Y columns of values (or a range of at least two Y columns). If the Y column(s) has an associated
X column, then the X column supplies the X values. Otherwise, the worksheet’s default X values are used.
Creating the Graph
Select Plot:Panel:Stack or click the Stack button
on the 2D Graphs Extended toolbar.
Template
The stack graph is created from the STACK.OTP template located in the Origin folder.
Notes
Each data plot displays in its own layer in a graph window. The layers are stacked in one column. The
leftmost selected data set in the worksheet displays in the lower graph layer (layer 1). The data set to the
right of the leftmost data set in the worksheet displays in layer 2, etc. Each child layer is linked to layer 1.
Additionally, the X axis in each child layer has a straight one-to-one link with the X axis in layer 1.
The Y axis titles display the associated worksheet column names. No tick labels or X axis titles display.
Each data point in the data plot is connected by a line.
Multiple Layer Graphs • 218
Chapter 8: Plotting: Origin’s Built-in Graph Types
Vertical 2 Panel Graph
10
8
6
4
2
0
0
2
4
6
8
10
0
2
4
6
8
10
6
4
2
0
Data Requirements
Requires a selection of at least one Y column of values (or a range from at least one column). Ideally,
select two Y columns of values. If the Y column(s) has an associated X column, then the X column
supplies the X values. Otherwise, the worksheet’s default X values are used.
Creating the Graph
Select Plot:Panel:Vertical 2 Panel or click the Vertical 2 Panel button
toolbar.
on the 2D Graphs Extended
Template
The vertical 2 panel graph is created from the PAN2VERT.OTP template located in the Origin folder.
Notes
Each column of Y values plots into a separate layer. The two layers are arranged in one column and two
rows.
Multiple Layer Graphs • 219
Chapter 8: Plotting: Origin’s Built-in Graph Types
Indexed Size (Bubble) and Color Mapped Graphs
Color Mapped Graph
5
4
3
2
1
0
2
4
6
8
10
Data Requirements
Requires a selection of two Y columns of values (or a range from two Y columns). If an X column is
present to the left of the Y columns in the worksheet, the X column supplies the X values. Otherwise, the
worksheet’s default X values are used.
Creating the Graph
Select Plot:Bubble/Color Mapped:Color Mapped or click the Color Map button
Extended toolbar.
on the 2D Graphs
Template
The color map graph is created from the SCATTER.OTP template located in the Origin folder.
Notes
For each row, the two Y column values determine the display of the data point. The leftmost Y column
provides the Y data point values. The second Y column controls the data point symbol color. Origin finds
the minimum and maximum values in the second Y column, creates eight evenly sized ranges of values
between the minimum and maximum values, and then associates a color with each range of values. Each
data point color is determined by finding the color associated with the second Y column value in the color
map.
Indexed Size (Bubble) and Color Mapped Graphs • 220
Chapter 8: Plotting: Origin’s Built-in Graph Types
Indexed Size (Bubble) and Color Map Graph
5
4
3
2
1
0
2
4
6
8
10
Data Requirements
Requires a selection of three Y columns of values (or a range from three Y columns). If an X column is
present to the left of the Y columns in the worksheet, the X column supplies the X values. Otherwise, the
worksheet’s default X values are used.
Creating the Graph
Select Plot:Bubble/Color Mapped:Bubble + Color Mapped or click the Bubble + Color Mapped button
on the 2D Graphs Extended toolbar.
Template
The indexed size (bubble) and color mapped graph is created from the SCATTER.OTP template located in
the Origin folder.
Notes
For each row, the three Y column values determine the display of the data point. The leftmost Y column
provides the Y data point values. The second Y column controls the data point symbol size in units of
points. The third Y column controls the symbol color. Origin finds the minimum and maximum values in
the third Y column, creates eight evenly sized ranges of values between the minimum and maximum
values, and then associates a color with each range of values. Each data point color is determined by
finding the color associated with the third Y column value in the color map.
Indexed Size (Bubble) and Color Mapped Graphs • 221
Chapter 8: Plotting: Origin’s Built-in Graph Types
Indexed Size (Bubble) Graph
5
4
3
2
1
0
2
4
6
8
10
Data Requirements
Requires a selection of two Y columns of values (or a range from two Y columns). If an X column is
present to the left of the Y columns in the worksheet, the X column supplies the X values. Otherwise, the
worksheet’s default X values are used.
Creating the Graph
Select Plot:Bubble/Color Mapped:Bubble or click the Bubble button
toolbar.
on the 2D Graphs Extended
Template
The indexed size (bubble) graph is created from the SCATTER.OTP template located in the Origin folder.
Notes
For each row, the two Y column values determine the display of the data point. The leftmost Y column
provides the Y data point values. The second Y column controls the data point symbol size in units of
points.
Indexed Size (Bubble) and Color Mapped Graphs • 222
Chapter 8: Plotting: Origin’s Built-in Graph Types
3D XYY Graphs
3D Bar Graph
1.0
0.9
10 9
0.8
0.7
0.6
0.5
0.4
0.3
0.2
0.1
0.0
8
N
7
6
5
4
M
3
2
1
L
Data Requirements
Requires a selection of at least one Y column (or a range from at least one Y column). Ideally, select at
least two Y columns of values (or a range of at least two Y columns). If the Y column(s) has an associated
X column, then the X column supplies the X values. Otherwise, the worksheet’s default X values are used.
Creating the Graph
Select Plot:3D XYY:3D Bars or click the XYY 3D Bars button
on the 3D Graphs toolbar.
Template
The XYY 3D bars graph is created from the BAR3D.OTP template located in the Origin folder.
Notes
The Y value of each data point is represented as the height of a column. Each column has a fixed width
and is labeled with its worksheet column name on the Z axis.
3D XYY Graphs • 223
Chapter 8: Plotting: Origin’s Built-in Graph Types
Ribbon Graph
1.0
0.9
10 9
0.8
0.7
0.6
0.5
0.4
0.3
0.2
0.1
0.0
8
N
7
6
5
4
M
3
2
1
L
Data Requirements
Requires a selection of at least one Y column (or a range from at least one Y column). Ideally, select at
least two Y columns of values (or a range of at least two Y columns). If the Y column(s) has an associated
X column, then the X column supplies the X values. Otherwise, the worksheet’s default X values are used.
Creating the Graph
Select Plot:3D XYY:3D Ribbons or click the 3D Ribbons button
on the 3D Graphs toolbar.
Template
The 3D ribbons graph is created from the RIBBON.OTP template located in the Origin folder.
Notes
The Y value of each data point is represented as the height of a ribbon. Each ribbon has a fixed width, and
is labeled with its worksheet column name on the Z axis.
3D XYY Graphs • 224
Chapter 8: Plotting: Origin’s Built-in Graph Types
Wall Graph
1.0
0.9
10 9
0.8
0.7
0.6
0.5
0.4
0.3
0.2
0.1
0.0
8
N
7
6
5
4
M
3
2
1
L
Data Requirements
Requires a selection of at least one Y column (or a range from at least one Y column). Ideally, select at
least two Y columns of values (or a range of at least two Y columns). If the Y column(s) has an associated
X column, then the X column supplies the X values. Otherwise, the worksheet’s default X values are used.
Creating the Graph
Select Plot:3D XYY:3D Walls or click the 3D Walls button
on the 3D Graphs toolbar.
Template
The 3D walls graph is created from the WALLS.OTP template located in the Origin folder.
Notes
The Y value of each data point is represented as the height of a wall. Each wall has a fixed width, and is
labeled with its worksheet column name on the Z axis.
3D XYY Graphs • 225
Chapter 8: Plotting: Origin’s Built-in Graph Types
3D Waterfall Graph
3.
3.
2.
2.
1.
1.
0.
0.
I
J
L
1
2
3
4
5
6
7
8
9
10
Data Requirements
Requires a selection of at least one Y column (or a range from at least one Y column). Ideally, select at
least two Y columns of values (or a range of at least two Y columns). If the Y column(s) has an associated
X column, then the X column supplies the X values. Otherwise, the worksheet’s default X values are used.
Creating the Graph
Select Plot:3D XYY:3D Waterfall or click the 3D Waterfall button
on the 3D Graphs toolbar.
Template
The 3D waterfall graph is created from the WATER3D.OTP template located in the Origin folder.
Notes
The Y values in each column define an XY face with white fill color.
3D XYY Graphs • 226
Chapter 8: Plotting: Origin’s Built-in Graph Types
3D XYZ Graphs
3D Scatter Graph
Data Requirements
Requires a selection of one Z column (or a range from one Z column). If the Z column has an associated X
column, then the X column supplies the X values. Otherwise, the worksheet’s default X values are used.
Note: To learn more about 3D scatter graphs, review the 3D SCATTER.OPJ project located in your Origin
\SAMPLES\GRAPHING\3D PLOTS folder.
Creating the Graph
Select Plot:3D XYZ:3D Scatter or click the 3D Scatter Plot button
on the 3D Graphs toolbar.
Template
The 3D scatter graph is created from the 3D.OTP template located in the Origin folder.
3D XYZ Graphs • 227
Chapter 8: Plotting: Origin’s Built-in Graph Types
Trajectory Graph
Data Requirements
Requires a selection of one Z column (or a range from one Z column). If the Z column has an associated X
column, then the X column supplies the X values. Otherwise, the worksheet’s default X values are used.
Creating the Graph
Select Plot:3D XYZ:3D Trajectory or click the 3D Trajectory button
on the 3D Graphs toolbar.
Template
The 3D trajectory graph is created from the TRAJECT.OTP template located in the Origin folder.
3D XYZ Graphs • 228
Chapter 8: Plotting: Origin’s Built-in Graph Types
3D Surfaces
Bars
Data Requirements
Requires that a matrix of Z values is active.
Creating the Graph
Select Plot:3D Bars or click the Matrix 3D Bars button
on the 3D Graphs toolbar.
Template
The (matrix) 3D bars graph is created from the 3DBARS.OTP template located in the Origin folder.
Notes
The Z values represent the height of the columns (bars). The associated X and Y values mapped in the
matrix determine the XY locations of each column.
3D Surfaces • 229
Chapter 8: Plotting: Origin’s Built-in Graph Types
Color Fill Surface
Data Requirements
Requires that a matrix of Z values is active.
Creating the Graph
Select Plot:3D Color Fill Surface or click the 3D Color Fill Surface button
toolbar.
on the 3D Graphs
Template
The 3D color fill surface graph is created from the MESH.OTP template located in the Origin folder.
Notes
The Z values determine a surface of X and Y grid lines with fill colors on the front and the back of the
surface.
3D Surfaces • 230
Chapter 8: Plotting: Origin’s Built-in Graph Types
Color Map Surface
Data Requirements
Requires that a matrix of Z values is active.
Note: To learn more about 3D color map surface graphs, review the 3D SURFACE & CONTOUR.OPJ
project located in your Origin \SAMPLES\GRAPHING\3D PLOTS folder.
Creating the Graph
Select Plot:3D Color Map Surface or click the 3D Color Map button
on the 3D Graphs toolbar.
Template
The 3D color map surface graph is created from the CMAP.OTP template located in the Origin folder.
Notes
The Z values determine a surface of X and Y grid lines with fill colors on the front and the back of the
surface. The front of the surface is filled using a color map with associated Z levels.
3D Surfaces • 231
Chapter 8: Plotting: Origin’s Built-in Graph Types
Wire Frame Surface
Data Requirements
Requires that a matrix of Z values is active.
Creating the Graph
Select Plot:3D Wire Frame or click the 3D Wire Frame button
on the 3D Graphs toolbar.
Template
The 3D wire frame graph is created from the WIREFRM.OTP template located in the Origin folder.
Notes
The Z values determine a surface of X and Y grid lines.
3D Surfaces • 232
Chapter 8: Plotting: Origin’s Built-in Graph Types
Wire Surface
Data Requirements
Requires that a matrix of Z values is active.
Creating the Graph
Select Plot:3D Wire Surface or click the 3D Wire Surface button
on the 3D Graphs toolbar.
Template
The 3D wire surface graph is created from the WIREFACE.OTP template located in the Origin folder.
Notes
The Z values determine a surface of X and Y grid lines with secondary lines between the grids.
3D Surfaces • 233
Chapter 8: Plotting: Origin’s Built-in Graph Types
X Constant with Base Surface
Data Requirements
Requires that a matrix of Z values is active.
Creating the Graph
Select Plot:3D X Constant with Base or click the 3D X Constant with Base button
toolbar.
on the 3D Graphs
Template
The 3D X constant with base graph is created from the XCONST.OTP template located in the Origin
folder.
Notes
The Z values determine a surface of grid lines parallel to the Y axis. The front surface displays a fill color.
X and Y side walls are also enabled.
3D Surfaces • 234
Chapter 8: Plotting: Origin’s Built-in Graph Types
Y Constant with Base Surface
Data Requirements
Requires that a matrix of Z values is active.
Creating the Graph
Select Plot:3D Y Constant with Base or click the 3D Y Constant with Base button
toolbar.
on the 3D Graphs
Template
The 3D Y constant with base graph is created from the YCONST.OTP template located in the Origin
folder.
Notes
The Z values determine a surface of grid lines parallel to the X axis. The front surface displays a fill color.
X and Y side walls are also enabled.
3D Surfaces • 235
Chapter 8: Plotting: Origin’s Built-in Graph Types
Contour Graphs
Black and White Lines with Labels Contour
Data Requirements
Requires that a matrix of Z values is active.
Creating the Graph
Select Plot:Contour - B/W Lines+Labels or click the Contour B/W Lines button
toolbar.
on the 3D Graphs
Template
The contour graph with black and white labels is created from the CONTLINE.OTP template located in the
Origin folder.
Notes
Ranges of Z values are denoted on an XY grid using contour lines and associated labels.
Contour Graphs • 236
Chapter 8: Plotting: Origin’s Built-in Graph Types
Color Fill Contour
Data Requirements
Requires that a matrix of Z values is active.
Note: To learn more about color map contour graphs, review the CONTOUR.OPJ project located in your
Origin \SAMPLES\GRAPHING\3D PLOTS folder.
Creating the Graph
Select Plot:Contour - Color Fill or click the Contour - Color Fill button
on the 3D Graphs toolbar.
Template
The contour color fill graph is created from the CONTOUR.OTP template located in the Origin folder.
Notes
Ranges of Z values are denoted on an XY grid using contour lines and fill colors from a color map.
Contour Graphs • 237
Chapter 8: Plotting: Origin’s Built-in Graph Types
Gray Scale Map Contour
Data Requirements
Requires that a matrix of Z values is active.
Creating the Graph
Select Plot:Gray Scale Map or click the Gray Scale Map button
on the 3D Graphs toolbar.
Template
The gray scale map graph is created from the CONTGRAY.OTP template located in the Origin folder.
Notes
Ranges of Z values are denoted on an XY grid using a gray scale map.
Contour Graphs • 238