1
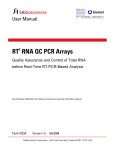
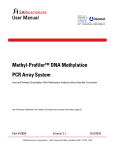
BIOMOL GmbH Waidmannstr. 35 22769 Hamburg [email protected] www.biomol.de Phone:+49-40-8532600 or 0800-2466651 (D) Fax: +49-40-85326022 or 0800-2466652 (D) User Manual 2 RT miRNA qPCR Assays Real-Time PCR-Based miRNA Expression Profiling See Purchaser Notification for limited use license and warranty information (page 3). Part #1032A Version 1.4 03/02/2009 2 RT miRNA qPCR Assays Real-Time PCR-Based miRNA Expression Profiling User Manual (For Catalog Number Prefix: MPH, MPM) Ordering and Technical Service Contact Information: BIOMOL GmbH Waidmannstr. 35 22769 Hamburg [email protected] www.biomol.de Phone:+49-40-8532600 or 0800-2466651 (D) Fax: +49-40-85326022 or 0800-2466652 (D) Tel: 1-888-503-3187 (US) 301-682-9200 (outside US) Fax: 1-888-465-9859 (US) 301-682-7300 (outside US) On-line Order: www.sabiosciences.com E-MAIL: [email protected] (to place an order) [email protected] (for technical support) You may place orders by fax, e-mail or from our website. Each order should include the following information: Your contact information (name, phone, email address) Product name, catalog number and quantity Purchase order number or credit card information (Visa or MasterCard) Shipping address Billing address For more information, visit us at www.sabiosciences.com SABioscience Corporation 7320 Executive Way, Suite 101 Frederick, MD 21704 USA CONTENTS I. Background and Introduction 4 II. Materials Provided 6 III. Additional Materials Required 6 IV. Protocol 7 A. RNA Preparation and Quality Control 9 B. RT2 miRNA First Strand Kit 11 C. Performing Real-Time PCR 12 D. Data Analysis: Ct Method 15 E. Data Analysis: Optional Standard Curve Method 17 VI. Troubleshooting and Frequently Asked Questions 18 LIMITED PRODUCT WARRANTY This product is intended for research purposes only and is not intended for drug or diagnostic purposes or for human use. This warranty limits our liability to replace this product in the event the product fails to perform due to any manufacturing defect. SABioscience Corporation makes no other warranties of any kind, expressed or implied, including without limitation, warranties of merchantability or fitness for a particular purpose. SABioscience Corporation shall not be liable for any direct, indirect, consequential or incidental damages arising out of the use, the results of use or the inability to use this product. NOTICE TO PURCHASER II 2 The purchase of RT miRNA qPCR Assay includes a limited, nonexclusive license to use the kit components for research use only. This license does not grant rights to use the kit components for reproduction of any primer pair mix, to modify kit components for resale or to 2 use RT miRNA qPCR Assay to manufacture commercial products without written approval of SABioscience Corporation. No other 2 license, expressed, implied or by estoppels, is granted. U.S. patents may cover certain isolated DNA sequences included in the RT miRNA qPCR Assay. Presently, it is not clear under U.S. laws whether commercial users must obtain licenses from the owners of the 2 rights to these U.S. patents before using RT miRNA qPCR Assay. 3 I. Background and Introduction MicroRNA (miRNA), first discovered in C. elegans in early 1990s, are a class of naturally occurring small RNA molecules, generally 17 to 30 nucleotides long, processed from much larger stem-loop structures (pri-miRNA and pre-miRNA). Mature miRNA is recognized by and guides the RNA-Induced Silencing Complex (RISC) to specific messenger RNA transcript sequences, causing either translation repression or mRNA degradation. The expression and function of miRNA brings another layer of gene expression regulation to an already complex network. Each miRNA can regulate multiple mRNA targets, and a single target mRNA may be regulated by multiple miRNA sequences. Researchers are currently correlating miRNA expression profiles to biological phenotypes in attempts to better understand miRNA-based gene regulation. Real-time, reverse transcription PCR, or qRTPCR, is the most sensitive and reliable method for nucleic acid expression analysis. However, the small size and high degree of similarity among miRNA sequences makes quantitative analyses of their abundance very challenging. The RT2 miRNA qPCR Assays take advantage of SABiosciences’s patent-pending primer design and assay formulation technologies to analyze the expression of any mature miRNA sequence in the human or mouse genome by SYBR Green based real-time RTPCR. The assays rely on combining poly(A) tailing and a universal reverse transcription in one first strand cDNA synthesis reaction. Our proprietary primer design algorithm also distinguishes miRNA family members with single nucleotide mismatches. Each assay is experimentally validated with an in vitro assay to insure the amplification of a single product with at least consistently high efficiency under standardized cycling conditions. The high performance of every RT² miRNA qPCR Assay is certified and 100% guaranteed when performed using the complete miRNA PCR Assay System that includes the RT² miRNA First Strand Kit and RT² SYBR Green qPCR Master mix. To complete the miRNA PCR Assay procedure, reverse transcribe your experimental small RNA samples into first strand cDNA, the template for the PCR, using our RT2 miRNA First Strand Kit. (See Figure 1 for an overview of the miRNA PCR Assay procedure.) Then, mix the template with one of our instrument-specific and ready-to-use RT2 SYBR Green qPCR Master Mixes. Set up your assays, perform PCR, and finally determine relative expression with your real-time instrument and the Ct method. The simplicity of the miRNA qPCR Assays makes them accessible for routine use in every research laboratory. 2 Benefits of the RT miRNA qPCR Assays: High Peformance: Each assay is experimentally validated to amplify a single amplicon with uniform PCR efficiency. Complete Genome Coverage: Assays are available for over 400 majority miRNA sequences. The uniform PCR efficiency and conditions allow easy, scalable transitions from analyzing single to multiple miRNA sequences. Simple & Convenient: Universal reverse transcription converts all miRNA into cDNA in a one-step reaction. Assays deliver guaranteed performance when used with SABiosciences’s optimized instrument-specific qPCR master mixes for ABI, Bio-Rad, Stratagene and other real-time PCR instruments. Version 1.4 Figure 1: Overview of the miRNA qPCR Assay procedure. Technical Support: 888.503.3187 (US) 5 301.682.9200 miRNA qPCR Assays II. Materials Provided: RT2 miRNA qPCR Assay, one tube, 200-reaction scale Primer pair includes one miRNA-specific primer and one universal primer. One Product Specification Sheet Storage Conditions: Primer Sets are shipped at ambient temperature but must be stored at –20 C where they are guaranteed as is for 6 months from the date received. III. Additional Materials Required: A. RT2 qPCR-Grade miRNA Isolation Kit (Cat. No. MA-01) B. RT2 miRNA First Strand Kit (Cat. No. MA-03) MANDATORY for a Complete and Successful Experiment The universal primer in each assay is only compatible with the sequence added to the cDNA template by the primer in this kit. C. SABiosciences RT2 SYBR Green qPCR Master Mix MANDATORY for a Complete and Successful Experiment Be sure to pick the correct one for the instrumentation in your laboratory. RT2 Real-Time™ SYBR Green / ROX: Specifically designed for: All ABI and Stratagene Instrumentation and Eppendorf Mastercycler® ep realplex Instruments with ROX filter set Catalog Number Size PA-012 For 200 25-L reactions ( 2.5 mL) PA-112 For 2000 25-L reactions ( 25.0 mL) 2 RT Real-Time™ SYBR Green / Fluorescein: Specifically designed for BioRad iCylcer®, MyiQ®, and iQ5 Instrumentation Catalog Number Size PA-011 For 200 25-L reactions ( 2.5 mL) PA-111 For 2000 25-L reactions ( 25.0 mL) RT2 Real-Time™ SYBR Green: Specifically designed for instrumentation that does not require a reference dye: BioRad (MJ Research) Opticon, Opticon 2, and Chromo 4 Roche LightCycler® 480 System Eppendorf Mastercycler® ep realplex Instruments without ROX filter set Catalog Number PA-011 PA-111 Size For 200 25-L reactions ( 2.5 mL) For 2000 25-L reactions ( 25.0 mL) D. Equipment: 1. For recommendations on specific real-time instrumentation (thermal cyclers with fluorescent detection), see the list of master mixes and plate formats above. 2. Calibrated Pipettors 3. RNase / DNase-free pipette tips and tubes 6 Version 1.4 IV. Protocol: Please read through this entire protocol before beginning your experiment. RNA samples are very sensitive to RNase digestion; therefore, wear gloves and maintain an RNase-free work area while performing this protocol. NOTE: Master Mix and Reverse Transcription Kit Considerations The performance of our miRNA qPCR Assays is only guaranteed with our RT² SYBR Green qPCR Master Mixes and the RT2 miRNA First Strand Kit. Therefore, the use of the complete miRNA qPCR Assay System is absolutely essential for obtaining any real-time PCR profiling results. The chemically-modified and tightly controlled HotStart enzyme and other proprietary chemical components in our RT2 SYBR Green qPCR Master Mixes provide more accurate SYBR Green results by preventing the amplification of primer dimers and other nonspecific products. They also help insure high amplification efficiencies. When we test other sources of enzymes with our miRNA qPCR Assays, we frequently see primer dimers and other non-specific products that confound SYBR-Green based real-time PCR detection. Because each instrument uses a different reference dye to normalize their optics, be sure that you use the correct master mix for the instrumentation in your laboratory. The universal primer in every assay of the miRNA qPCR Assays is specific only for the unique and proprietary sequence incorporated into the cDNA by the universal RT primer in SABiosciences’s RT2 miRNA First Strand Kit. The miRNA qPCR Assays cannot detect cDNA generated from miRNA using other sources of miRNA first strand synthesis or miRNA reverse transcription kits. Similarly, cDNA generated from SABiosciences’s RT2 miRNA First Strand Kit cannot be used with other sources of real-time qPCR assays for miRNA. The RT2 miRNA First Strand Kit also includes a proprietary buffer to preferentially reverse transcribe miRNA into cDNA. The buffer components and the magnesium concentration in our RT2 miRNA First Strand Kit are also more compatible with our PCR master mixes than other enzymes or kits providing the miRNA qPCR Assays with maximum levels of sensitivity with ng amounts of small RNA. Technical Support: 888.503.3187 (US) 7 301.682.9200 miRNA qPCR Assays NOTE: Preparing a Workspace Free of DNA Contamination For accurate and reproducible PCR Assay results, it is very important to avoid contamination of the assay with foreign DNA. Any DNA contamination will artificially inflate the SYBR Green signal yielding skewed expression profiles and false positive signals. The most common sources of DNA contamination are the products of previous experiments spread into the air of your working environment. Please follow the recommendations below on how to set up and maintain a working environment free of DNA contamination. 1. Wear gloves throughout the procedure. Use only fresh PCR-grade reagents (H20) and lab ware (tips and tubes). 2. Physically separate the workspaces used for PCR setup and post-PCR processing or non-PCR operations. Decontaminate your PCR workspace and lab ware (pipettor barrels, tube racks, etc.) before each new use with UV light to render any contaminating DNA ineffective in PCR through the formation of thymidine dimers or with 10% bleach to chemically inactivate and degrade any DNA. 3. Close all tubes containing PCR products once you are finished adding or removing volumes. Before discarding any lab ware (tips or tubes) containing PCR products or other DNA, treat with 10% bleach. 4. Do not open any previously run and stored PCR plate. Removing the thin-wall 8-cap strips or the adhesive film from PCR plates releases PCR product DNA into the air where it will contaminate and confound the results of future real-time PCR experiments. 8 Version 1.4 A. RNA Preparation and Quality Control: High quality RNA is ESSENTIAL for obtaining good real-time PCR results. The most important prerequisite for any miRNA expression analysis experiment is consistent, high-quality small RNA from every experimental sample. Therefore, the sample handling and RNA isolation procedures are critical to the success of the experiment. Residual traces of proteins, salts or other contaminants will either degrade the RNA or decrease the efficiency of (if not block completely) the enzyme activities necessary for optimal reverse transcription and real-time PCR performance. Although other real-time PCR-based miRNA detection methods call for the use of total RNA that contains miRNA as the starting input material, we highly recommend starting with small RNA (< 200 nucleotides) to reduce background noise for optimal sensitivity. 1. Recommended RNA Preparation Methods: High quality small RNA for your real-time PCR experiment must be prepared using one of the following methods, each specific for your biological sample: Cultured Cells OR Tissue Samples: Use a two-step protocol. a. Extract RNA from the tissue using the TRIzol® protocol (Invitrogen, Catalog # 15596-026). Be sure to use a sufficient amount of TRIzol® reagent. During homogenization, add a volume of reagent at least ten times greater than the tissue volume. b. Then, further clean up and enrich the small RNA using the RT2 qPCR-Grade™ miRNA Isolation Kit (SABiosciences, MA-01). Whole Blood Samples: Remove red blood cells (RBC) from whole blood samples using a density gradient centrifugation medium (for example, Lymphoprep, Greiner Bio-One, Catalog # 1031966). Isolate small RNA from the white blood cell fraction as described for cultured cells above. Previously Isolated Total RNA: If you have already prepared total RNA from any biological source material, be sure that it used a phenol-based method (such as TRIzol®, RNAzol, etc.). Then, enrich for small RNA using the RT2 qPCR-Grade™ miRNA Isolation Kit (SABiosciences, MA-01). For Other Biological Samples: Refer to the existing literature to find isolation protocols for high-quality RNA from other biological samples or contact one of our Technical Support representatives. For best results from the PCR Assays, all RNA samples should be suspended in the RNase-free water provided with the RNA Isolation kit, or alternatively in RNase-free 10 mM Tris buffer pH 8.0. DO NOT use DEPC-treated water! Technical Support: 888.503.3187 (US) 9 301.682.9200 miRNA qPCR Assays 2. RNA Quality Control: For best results from the PCR Assays, all RNA samples should also demonstrate consistent quality according to the following criteria: a. RNA Concentration and Purity by UV Spectrophotometry NOTE: Prepare dilutions and measure absorbance in 10 mM Tris, pH 8.0 buffer. The spectral properties of nucleic acids are highly dependent on pH. i) A260:A230 ratio should be greater than 1.7. ii) A260:A280 ratio should be greater than 2.0. iii) Concentration by A260 should be greater than 1 g / ml small RNA b. RNA Quality & Integrity Characterize ~ 10 ng of the small RNA on an Agilent Bioanalyzer using an RNA 6000 Nano LabChip®. The RNA should contain a single sharp peak at a low molecular weight with no smearing and no additional peaks at higher molecular weights. Figure 3: Good Small RNA Band Integrity Is Important for Best Results from the miRNA qPCR Array. Displayed is an Agilent BioAnalyzer electropherogram of a high-quality small RNA preparation showing a sharp low molecular weight peak without a shoulder. 3. Amount Considerations: The miRNA qPCR Assay System yields relative miRNA expression profiles with as little as 1 ng or as much as 200 ng of small RNA. However, the optimal amount of starting material depends upon the relative abundance of the sequences of interest. Lower abundance sequences require more RNA; higher abundance sequences require less RNA. Greater amounts of input RNA yield a greater number of positive calls; that is, sequences expressed in the linear dynamic range of the method. Lower amounts of input RNA yield a smaller number of positive calls and increase false negative calls. The use of the RT2 miRNA First Strand Kit maximizes the number of positive calls at low amounts of RNA over other sources of miRNA reverse transcriptase and first strand synthesis kits. For successful results and maximum positive call rates, we recommend that first time users try starting with 100 ng of small RNA. It is also important to use a consistent amount of RNA for each sample to be characterized and compared. 10 Version 1.4 2 B. RT miRNA First Strand Kit NOTE: RNA samples must meet the standards of integrity and purity from protein and organics contamination described on the previous two pages. NOTE: The buffer components of the reverse transcription reaction using this kit are more compatible with our PCR master mixes than other sources of kits for first strand cDNA synthesis kits or reverse transcriptases. NOTE: Thaw component M2 on ice, briefly vortex the tube to mix the contents well, and centrifuge to the bottom of the tube before each use. For each RNA sample, combine the following in a sterile PCR tube: 50 ng to 200 ng (or 0.5 – 2 g total RNA) 1.0 L 2.0 L 1.0 L 1.0 L 10.0 L Small RNA miRNA RT Primer & ERC Mix (M1) 5X miRNA RT Buffer (M2) miRNA RT Enzyme Mix (M3) 100 mM DTT RNase-free H2O to a final volume of NOTE: Use the same amount of RNA in this reaction for every sample. First time users are recommended to start with 100 ng of small RNA. Do not use more than 400 ng of small RNA per reaction. b. Mix the contents gently with a pipettor followed by brief centrifugation. c. Incubate at 37°C for 2 hours [corrected, OT, Biomol]. d. Heat at 95 °C for 5 minutes to degrade the RNA and to inactivate the reverse transcriptase. e. Chill on ice for at least one minute and add 90 l of RNase-free H2O to each 10-l of cDNA synthesis reaction. Mix well. f. Hold the finished First Strand cDNA Synthesis Reaction on ice until the next step or store overnight at -20 °C. Technical Support: 888.503.3187 (US) 11 301.682.9200 miRNA qPCR Assays C. Performing Real-Time PCR: NOTE: The use of SABiosciences’s RT2 SYBR Green qPCR Master Mixes is critical for obtaining the most accurate results from the miRNA PCR Assays. Be sure to use the correct master mix for your instrument before continuing with this protocol (See Pages 8 and 10). NOTE: The accuracy and precision of your pipetting determines the consistency of your results. Be sure that all of your micro-pipettors are calibrated before beginning this procedure. Also, make sure to not introduce any bubbles into the PCR wells. NOTE: If unsure of your RNA quality or isolation technique, examine the quality of your RNA before this step. 1. Setup: a. Experimental Samples To insure the consistency of your results and that each experimental sample yields a reliably detectable Ct value, we recommend using undiluted template and a 1:10 dilution of your template in separate PCR assays. Also, prepare triplicate reactions for each template at each concentration. For every experimental sample, prepare one set of reactions for every miRNA sequence of interest and for a single housekeeping sequence or a set of housekeeping sequences to normalize your raw data. Choose housekeeping sequence(s), such as small nuclear RNA species, known not to change their expression under your experimental conditions. b. Positive and Negative Controls Prepare a positive control reaction for each miRNA qPCR Assay using cDNA template generated by reverse transcribing 2 L of a 1 – 10 nM solution of synthetic RNA oligo with the same sequence(s) as the miRNA of interest. To control for DNA contamination introduced during reaction setup, prepare a negative control reaction replacing template with water, the so-called No Template Control (NTC). To monitor non-specific background amplification, perform one assay for each miRNA and each housekeeping sequence of interest using an equivalent volume of product from a reaction replacing the miRNA RT Enzyme Mix (M3) with RNase-free H2O for each miRNA sample, the so-called No Reverse Transcription (NRT) control. c. Optional Standard Curve Method Generate one standard curve for each miRNA of interest. Also generate a standard curve for each housekeeping small nuclear RNA sequence to be used for data normalization. To generate a standard curve, prepare a five-point series of five- or ten-fold dilutions in duplicate using cDNA template generated by reverse transcribing synthetic miRNA with the sequence(s) of interest. 12 Version 1.4 2. Polymerase Chain Reactions For each 25-l PCR, mix the following components in a PCR tube: 12.5 l RT2 Real-Time™ PCR master mix, matched with your instrument* 10.5 l ddH2O 1.0 l of either undiluted or diluted template 1.0 l RT2 miRNA qPCR Assay primer set 25.0 l final volume 3. Performing Real-Time PCR Detection: NOTE: Be sure to follow the manufacturer’s instructions for the proper operation and maintenance of your real-time instrument. a. CAREFULLY but tightly seal the PCR plate either with optical thin-wall 8-cap strips or optical adhesive film, according the instrument manufacturer’s instructions. NOTE: Be sure that no bubbles appear in any of the wells of the PCR plate. To remove bubbles, tap the plate gently on the bench top or centrifuge the plate briefly. b. Place the plate on ice while setting up the PCR cycling program below. c. Place the plate in your real-time thermal cycler. If recommended by your instrument’s user manual, use a compression pad on plates sealed with optical film. d. Enter and run the appropriate program for your real-time instrument (below). If prompted by your instrument software, select “Absolute Quantitation” to begin. NOTE: For additional help with instrument setup, see our Instrument-Specific Setup Instructions and Protocol Files at: www.sabiosciences.com/pcrarrayprotocolfiles.php Cycles Duration Temperature 1 10 minutes1 95 °C 15 seconds 95 °C 30 to 40 seconds2,3 60 °C 30 seconds 72 °C 40 1 2 3 The 10-minute step at 95 °C is required to activate the HotStart DNA polymerase. Detect and record SYBR® Green fluorescence from every well during the annealing step of each cycle. Different instruments need different lengths of time to detect the fluorescent signal. Choose the appropriate time for the annealing step (60 °C) for your instrument. Technical Support: 888.503.3187 (US) 13 301.682.9200 miRNA qPCR Assays e. Calculate the threshold cycle (Ct) for each well using the instrument’s software. i. We highly recommend letting your instrument automatically define the Baseline values but manually setting the Threshold values. ii. To define the Baseline, use the Linear View of the amplification plots and set the instrument to use the readings from cycle number two (2) through two (2) cycle values before the earliest visible amplification, usually around cycle number ten (10) but no more than 15. iii. To define the Threshold Value, use the Log View of the amplification plots and place it above the background signal but within the lower half to one-third of the linear phase of the amplification plot. iv. IMPORTANT: Ensure that the Thresholds are the same across all PCR runs in the same analysis. v. Export the resulting threshold cycle values for all wells to a blank Excel spreadsheet for use with our Data Analysis Template Excel file. 4. Recommended Quality Control: a. Dissociation (Melting) Curve: Run a melting curve program immediately after the above cycling program, and generate a first derivative dissociation curve for each well in the entire plate using your instrument’s software. No more than one peak should appear in each reaction at temperatures greater than 70 °C. If your instrument does not have a default melting curve program, run the following program instead: 95 °C, 1 min; 65 °C, 2 min (OPTICS OFF); 65 °C to 95 °C at 2 °C / min (OPTICS ON). If you decide not to obtain the dissociation curve immediately, save the plates wrapped in aluminum foil at – 20 °C as is, in case you need to perform this operation at a later point in time for troubleshooting purposes. When ready, simply warm the plate to room temperature, place it into your real-time instrument, and run the melting program described above. NOTE: Be sure to visually inspect the plate after the run for any signs of evaporation from any of the wells. If evaporation is observed, make a note of which wells so that you may qualify your data analysis appropriately. NOTE: DO NOT open any previously run and stored PCR plate. Removing the thin-wall 8cap strips or the adhesive film from PCR plates releases PCR product DNA into the air where it will contaminate and confound the results of future real-time PCR experiments. See also the Note on “Preparing a Workspace Free of DNA Contamination”. 14 Version 1.4 D. Data Analysis: Ct Method 1. Change all Ct values reported as greater than 35 or as N/A (not detected) to 35. At this point, any Ct value equal to 35 is considered a negative call. 2. Examine the threshold cycle values of the control wells. a. Positive Control: b. No Reverse Transcription (NRT): A raw Ct value of 35 or greater indicates a lack of non-specific background. A raw Ct value less than 35 indicates the presence of secondary amplification products. See the Troubleshooting section of this User Manual. c. No Template Control (NTC) A raw Ct value of 35 or greater indicates a lack of general DNA contamination. A raw Ct value less than 35 indicates the presence of general DNA contamination in the PCR. See the Troubleshooting section of this User Manual and the Note on Preparing a Workspace Free of DNA Contamination earlier in this protocol. 3. Calculate the Ct for each miRNA in each sample and each dilution. Ct = CtMOI –CtAVG HKG 4. When biological and/or technical replicates are performed, calculate the average Ct value of each miRNA assay across those replicates for each treatment group. 5. Calculate the Ct for each miRNA between your two PCR samples or groups. Ct = Ct (group 2) - Ct (group 1) Where group 1 is the control and group 2 is the experimental 6. Calculate the fold-change for each miRNA from group 1 to group 2 as 2 ^ (-Ct). OPTIONAL: If the fold-change is greater than 1, then the result may be reported as a fold up-regulation. If the fold-change is less than 1, then the negative inverse of the result may be reported as a fold down-regulation. The fold-change ratios may also be reported as is. Technical Support: 888.503.3187 (US) 15 301.682.9200 miRNA qPCR Assays NOTE: Detailed Mathematical Explanation of Ct Data Analysis Method Due to the inverse proportional relationship between the threshold cycle (Ct) and the original miRNA expression level, and the doubling of the amount of product with every cycle, the original expression level (L) for each miRNA of interest is expressed as: To normalize the expression level of a miRNA of interest (GOI) to a housekeeping sequence (HKG), the expression levels of the two miRNA sequences are divided: To determine fold change in miRNA expression, the normalized expression of the GOI in the experimental sample is divided by the normalized expression of the same GOI in the control sample: The complete calculation is as follows: 16 Version 1.4 E. Data Analysis: Optional Standard Curve Method 1. Raw Data Determine the threshold cycle (Ct) value for each reaction using your instrument’s software. 2. Generate a standard curve for each MOI and each HK assay Plot Ct values of the assays using synthetic miRNA templates on the y-axis versus their dilution factors in a log-scale on the x-axis. Fit the data to a straight line. The xaxis value is directly related to the relative expression level (L) of the miRNA sequence. 3. Determine Relative Expression of Unknowns Use the standard curve or linear fit equation to convert Ct values to relative expression levels for each MOI or HK sequence in each sample. Be sure that the Ct values fall within the linear range of the appropriate standard curve. 4. Normalization Divide each MOI relative expression levels by the corresponding HK relative expression levels. Use MOI and HK data from the same dilution of the same sample. 5. Fold-Changes To determine the fold-change in expression for each miRNA sequence of interest between two different samples, calculate the ratio of its normalized expression levels (again determined from the same PCR conditions) between those samples. Technical Support: 888.503.3187 (US) 17 301.682.9200 miRNA qPCR Assays VI. Troubleshooting and FAQs A. Appearance of multiple PCR products (dissociation curve peaks): 1. Assay Primers Amplify from Non-miRNA cDNA: If total RNA, instead of small RNA, is used in the miRNA qPCR, more non-specific products and higher background are expected. In this case, using small RNA will normally resolve the problem. Be sure to use the RT2 qPCR-Grade miRNA Isolation Kit (MA-01) to enrich for small RNA from your biological samples of total RNA samples, previously purified with the TRIzol procedure. If the raw Ct value from the assay is greater than 35, consider the miRNA as “Not Detectable” and discounted. B. Real-time PCR Ct values are too high (> 35 or not detectable): 1. Experimental error: Use cDNA template generated from the synthetic miRNA sequence of interest as a positive control to troubleshoot the PCR reagents and experimental procedure. 2. Poor RNA quality: Be sure to perform all recommended quality control checks on the RNA sample. Poor quality RNA can inhibit enzyme activity during reverse transcription generating an insufficient amount of template during the reverse transcription reaction. 3. Not enough template: a. Use more input RNA for reverse transcription especially if the lower end of the recommended range had been used previously. b. Use a larger volume of template per reaction, but do not use more than 2.0 μl of template per 25-μl reaction. Remember to use the same volume of template in each reaction. C. Real-time PCR Ct values are too low (< 12): Too much template 1. Use less input RNA for reverse transcription especially if the higher end of the recommended range had been used previously. 2. Use a smaller volume of template per reaction or use diluted template, but do not use less than 1 μl of template per each 25-μl reaction. Remember to use the same volume of template in each reaction. 18 Version 1.4 D. Expression is seen when it is not expected OR The No Reverse Transcription Control (NRT) yields a Ct value < 35: If total RNA, instead of small RNA, is used in the miRNA qPCR, more non-specific products and higher background are expected. In this case, using small RNA will normally resolve the problem. Be sure to use the RT2 qPCR-Grade miRNA Isolation Kit (MA-01) to enrich for small RNA from your biological samples of total RNA samples, previously purified with the TRIzol procedure. E. The No Template Control (NTC) yields a Ct value < 35: 1. DNA contamination of other reagents, tips, and tubes: See the Note on Preparing a Workspace Free of DNA Contamination at the beginning of the protocol in this User Manual. 2 Primer Dimers: Verify presence of primer dimers (< 50 bp in size) by agarose gel. Be sure to use the appropriate RT2 qPCR Master Mix from SABiosciences to prevent the appearance of primer dimers. B. Frequently Asked Questions: 1. Will pipetting error affect the miRNA qPCR Assay results? The passive reference dyes in the PCR master mixes, such as ROX and Fluorescein, are used by the real-time PCR systems to normalize variation from well to well. Therefore, these systems tolerate volume variations caused by pipetting error and evaporation. 2. How can I prevent the evaporation of reaction volume from the wells? Be sure to carefully and completely seal the PCR plate with the optical thin-wall 8-cap strips or the optical adhesive film before placing it into your thermal cycler. Also, be sure to use a compression pad when using an optical film seal as directed by the manufacturer of your real-time PCR instrument. 3. How reliable are the results from the miRNA qPCR Assays? Assuming the use of good, consistent experimental technique, real-time PCR methods such as the miRNA qPCR Assays provide very reproducible results. To insure the reliability of your results and to reliably detect smaller fold changes in miRNA expression from the PCR Assays, the performance of replicate determinations (such as biological triplicates) is highly recommended. If you have additional questions, please check our website (www.sabiosciences.com) for a more complete listing of Frequently Asked Questions (FAQs), or call our Technical Support Representatives at 1-888-503-3187 or 301-682-9200. iCycler® and MyiQ® are registered trademarks of BioRad Laboratories, Inc. LabChip® is a registered trademark of Caliper Life Sciences. LightCycler® is a registered trademark of Roche Applied Sciences. RNeasy® is a registered trademark of Qiagen. SmartCycler® is a registered trademark of Cepheid. SYBR® is a registered trademark of Molecular Probes. TRIzol ® is a registered trademark of Invitrogen. Mastercycler® is a registered trademark of Eppendorf. Technical Support: 888.503.3187 (US) 19 301.682.9200 miRNA qPCR Assays miRNA qPCR Assay User Manual Part #1032A Version 1.4 03/02/2009 BIOMOL GmbH Waidmannstr. 35 22769 Hamburg [email protected] www.biomol.de Phone:+49-40-8532600 or 0800-2466651 (D) Fax: +49-40-85326022 or 0800-2466652 (D) 20