1
User Manual
for the OPERA™ Control Center Server Software V3.5
OPR-003-CTR-X
OPR-010-CTR-X
This information may be subject to change. All brand and product names are trademarks and/or
registered trademarks of their respective owners. All rights reserved.
Copyright © 2002 by OPTICOM GmbH · www.opticom.de
C O N T E N T S
Contents
Contents ...................................................................................................................................i
1 Preface ............................................................................................................................1
2 The Concept Behind the OPERA™ Control Center ...................................................2
3 Setting up the OPERA™ Control Center.....................................................................3
3.1
Verifying the Test Setup........................................................................................3
3.2
Defining the Resources – the Phone Book.........................................................3
3.3
Defining the Testcalls – the Commands Table....................................................5
3.4
Using Microsoft Access to edit the Database.....................................................6
4 Starting and Stopping the Measurement .......................................................................7
5 The Result View.............................................................................................................8
5.1
The Result File.......................................................................................................8
5.2
Freezing Fields.......................................................................................................8
5.3
Selecting the Columns to Display........................................................................9
5.4
Filtering the Results ..............................................................................................9
5.5
Alerts ................................................................................................................... 10
5.6
Clearing the Result File ..................................................................................... 11
5.7
The Averages Functionality................................................................................ 11
5.8
Meaning of the Results ...................................................................................... 11
5.9
Archiving of the Result Files............................................................................. 13
5.10 Viewing Statistics ............................................................................................... 14
5.11 Printing Results .................................................................................................. 15
5.12 If No Data is Shown Even if the Result File Exists... ...................................... 15
6 Summary of the Menu and Toolbar Options ............................................................. 16
7 Other Issues ................................................................................................................. 17
7.1
Modifying the Evaluation of the Results .......................................................... 17
7.2
A Note to Users of Versions older than V3.5 .................................................. 17
7.3
Full and Light Version of the OPERA™ Control Center Software .............. 17
i
P R E F A C E
1 Preface
This document is meant as a completion to the user manual of the OPERA™
measurement system. It describes the OPERA™ Control Center Server
Software (OPR-003-CTR-X, OPR-010-CTR-X). Before you start reading this
documentation, you should already be familiar with the OPERA™ system in
general.
The purpose of the OPERA™ Control Center is to schedule test calls and the
evaluation of speech quality parameters between various OPERA™ systems
and to remote control these systems through a TCP/IP connection. It allows
the user to create complex schedules consisting of up to some hundred
commands without having to think about the synchronization and allocation
of the resources. Commands may be automatically repeated and
rescheduled after a certain time, e.g. every Monday.
Although the OPERA™ Control Center was originally designed for the
automated monitoring of telecom networks with OPERA™ systems standing
at all important network nodes, it can be used on a single OPERA™ system
as well. Please note, that with the "Light" version of the OPERA™ Control
Center, the software cannot be used to manage a distributed set of OPERA™
systems. If you want to use the OPERA™ Control Center to control other
systems than the local host, you will need the full version. For more
information about this, please refer to Section 7.3 in this manual.
The use of the OPERA™ Control Center is not limited to telecom
applications, it is also applicable to wide band audio applications.
All interface options and all algorithms available for OPERA™ may be used
in conjunction with the OPERA™ Control Center. Typical applications range
from monitoring telecom networks up to automatically test broadcast
transmission links. The OPERA™ Control Center may also be used for
automating tests in an R&D environment if you do not want to write
commandline scripts, although we would generally recommend the
commandline interface for this purpose since it is significantly more flexible
and gives more detailed results. In any case, all results will be stored in a tab
separated text file which can be viewed by the OPERA™ Control Center
itself, or imported into any spread sheet data base program or network
management system for further analysis.
1
T H E
C O N C E P T
B E H I N D
T H E
O P E R A ™
C O N T R O L
C E N T E R
2 The Concept Behind the OPERA™ Control
Center
The OPERA™ Control Center consists of two modules which access the
remote controlled OPERA™ systems through remote procedure calls. The
first module is the graphical user interface (GUI), which is used to create and
edit entries in the command database. From the command database the
system creates some control files which are handed over to the dispatcher
module. The dispatcher module does the real work and takes care of the
allocation of all required resources before a test call is issued. It locks the
interfaces which are required for a test call and keeps them locked
throughout the test call. This will effectively block all other commands and
also manual access (e.g. the use of OptiCall™) to theses resources.
Commands which require such a locked resource will be delayed until the
resources are free again. Due to this locking mechanism there may be
several OPERA™ Control Centers and OptiCall™ applications active on the
network.
In order to keep the maintenance of the system easy, there are two different
tables used to form the command database. One contains the description of
the available resources on the network ("Phonebook", see Section 3.2) and
another one consists of the actual test commands ("Commands", see Section
3.3). The first table is used to assign an alias name for each combination of
an OPERA™ system, the chosen interface and the associated telephone
number. The second table then uses these alias names to define the
originator and the terminator of the test calls. This means if the name of a
system or just the telephone number changes, it is not required to adapt the
entire command schedule (the relevant interface may be used a hundred
times there), instead just the single database entry which defines the alias
name of the relevant interface has to be modified.
2
S E T T I N G
U P
T H E
O P E R A ™
C O N T R O L
C E N T E R
3 Setting up the OPERA™ Control Center
3.1
Verifying the Test Setup
Before starting to use the OPERA™ Control Center, all systems should be
booted and - if they are not members of the same Windows NT domain logged on with the same user name and password. If you did not modify any
settings on the OPERA™ systems, they will all automatically log you on after
booting them.
It is generally a good idea to verify the correct setup by issuing a few test
calls manually using OptiCall™ from the machine on which the OPERA™
Control Center is installed. If it is not possible to establish a call using
OptiCall™, it will also not be possible to do so using the OPERA™ Control
Center. If there are problems at this stage already, please verify your network
settings and the proper connection to the telephone network. If the call
succeeds if it is issued from OptiCall™ running on the OPERA™ system
where the interfaces are installed, the reason is probably due to the network
setup. Please consult your local network administrator or OPTICOM in this
case. Especially if you are using a firewall between two OPERA™ systems,
some special network settings may be required.
If everything works fine so far, you may start the OPERA™ Control Center. It
will come up either with an empty result table (if you did not yet perform
any measurements) or with the result view of the last measurements that
have been performed.
If you haven't performed any test calls with the Control Center yet, you will
create database entries for all resources you want to use, in a first step (see
Section 3.2). The second step is to create a table with the actual commands,
as described in Section 3.3.
3.2
Defining the Resources – the Phone Book
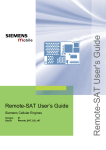
To create the resources required for the commands, simply click on the
toolbar button Phone Book. This will popup a dialog window with a table
as shown in Figure 3.1. You may edit existing entries in this table by simply
clicking on the fields you want to modify, you may add new rows or you
may delete existing rows.
The meaning of the columns of the Phone Book table are explained in Table
3.1. Imagine this resources database as a telephone book. Everybody has a
name in there (=ResourceName), an address (SystemName, LineInterface)
and a telephone number (PhoneNumber) under which you can call the
person. Each resource may appear in table several times with different
resource names, just like one person may have several telephone numbers.
You may also use the same interface with different names and telephone
numbers, if you want to perform e.g. several loop calls on the same
interfaces, taking different routes through the network which are defined by
the telephone number.
You edit existing entries in the table by simply clicking on them with the
mouse. If you want to create a new entry click on the "Add" button and then
select the field of the new line that you would like to edit. If you are done
with editing the table click on the "Close" button to close the window. The
underlying database is then updated accordingly. To delete an entry in the
3
S E T T I N G
U P
T H E
O P E R A ™
C O N T R O L
C E N T E R
table, select a line and then click on the "Delete" button. You may also
select several lines to delete.
For editing new entries you may also copy and paste a single field or a
whole line in the table. To copy a single field entry, you either select the
copy command from the pop-up menu that appears on a right click after you
selected the entry, or you use the key combination Ctrl-C to copy and then
Ctrl-V to paste.
To copy a whole line or several lines, you will first select the line (or the
lines) by clicking on the gray field on the left hand side of the
"ResourceName" column. Then copy the selection with the key combination
Ctrl-C. When you paste it using Ctrl-V, the selection will be automatically
added to the end of the table. In doing so, an additional index will be
appended to the resource names that have been pasted, automatically.
Please note, that only those resource names may be deleted or modified,
which are not currently used in the Commands table.
Figure 3.1: The Phone Book dialog window.
Column Title
Description
ResourceName
Name under which you want to address this resource in the
command table
Computer name of the OPERA™ analyzer where the interface is
located. May also be "localhost" for the local machine.
Index of the interface on the OPERA™ analyzer defined in
SystemName. This index is shown in OptiCall™ if you click on
the drop down list box for the interface selection. It is the
sequential number before the name of the interface.
This is the phone number which must be dialed in order to call
this resource.
This is an optional comment which will appear in the result table.
SystemName
LineInterface
PhoneNumber
Comment
Table 3.1: Meaning of the columns of the Phone Book table.
Note:
4
S E T T I N G
U P
T H E
O P E R A ™
C O N T R O L
C E N T E R
If you are using the light version of the OPERA™ Control
Center, "localhost" is the only valid entry for the resource name
(see Section 7.3).
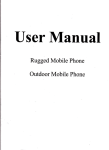
Figure 3.2: The Commands Table dialog window.
3.3
Defining the Testcalls – the Commands Table
After creating a Phone Book table with the available resources, you are
ready to create a table with the schedule of the test calls. Just click on the
toolbar button Commands. Figure 3.2 depicts the dialog window that will
be presented. Editing this Commands table works essentially in the same
way as editing the Phone Book table.
The meaning of the columns is explained in Table 3.2. The fields for the
originator and the terminator of the call ("Origin" and "Termination") are
drop down list boxes which are automatically filled with the resource names
defined in the Phonebook. The "Reschedule" field is a drop down list box as
well, here you will find entries as e.g. "Every Monday" or "Immediately".
When you click on a "Filename" field in the table, a small button will
appear on the right edge of the field. Use this button to browse for files on
your computer.
As described for the phone book table, you may copy and paste a single
field or a whole line in the table. To copy a single field entry, you either
select the copy command from the pop-up menu that appears on a right
click after you selected the entry, or you use the key combination Ctrl-C to
copy and then Ctrl-V to paste.
To copy a whole line or several lines, you will first select the line (or the
lines) by clicking on the gray field on the left hand side of the "Enable"
column. Then copy the selection with the key combination Ctrl-C. To paste
it into the table, use the combination Ctrl-V.
5
S E T T I N G
U P
T H E
O P E R A ™
C O N T R O L
C E N T E R
Column Title
Description
Enable
Check the box in order to activate the command. Inactive
commands will not be executed during the measurement.
This is an optional comment which will appear in the result table.
Select the interface on which you want to originate the call (Drop
down list box).
Select the interface on which you want to terminate the call (Drop
down list box).
Name of the wave file with the speech sample which is sent from
the terminating side to the originating side.
This is the time in UTC at which the command will be executed for
the first time. If it is a date in the past, the system will reschedule
the command as defined by the reschedule parameter.
This is the time in UTC at which the command will be terminated.
Defines how often a command will be repeated before it is
rescheduled.
This is an optional delay between two command repetitions. It is
defined in seconds.
Here you may choose when the command will be issued again
(Drop down list box).
Comment
Origin
Termination
Filename
StartTime
EndTime
Repetitions
Delay
Reschedule
Table 3.2: Meaning of the columns of the Commands table.
Note:
Please note that all times are specified in UTC (Universal Time
Coordinated) in order to use the same time coordinate on
measurement systems standing in different time zones. During
winter time (standard time) UTC is equal GMT (Greenwich
Mean Time). During summertime (daylight savings time), UTC
is GMT –1. To obtain your local time, you need to subtract
(add) a certain number of hours from (to) UTC depending on
how many time zones you are away from Greenwich (England).
For the current GMT check the following web site:
www.GreenwichMeanTime.com/
3.4
Using Microsoft Access to edit the Database
If you are planning to create a large and complicated setup, it may be a
good idea to use MS Access to edit the tables, especially the Phone Book
table. The Commands, as well as the Phone Book table are stored in the file
c:\programme\opera\databases\commandlist.mdb. You may directly open
this database using MS Access, or any other compatible database
application.
6
S T A R T I N G
A N D
S T O P P I N G
T H E
M E A S U R E M E N T
4 Starting and Stopping the Measurement
When you have successfully setup your databases, you start the
measurement by clicking on the toolbar button Start. A dialog window will
pop up asking you whether you want to append new measurements to the
existing result file or if you want to create a new result file. Then, you will be
informed in the status bar, on the bottom of the main window, about the
number of currently active and waiting commands.
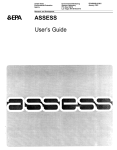
The result display is permanently refreshed. If you want to stop this
automatic refresh, click on the toolbar button Pause Refresh and to switch
it on again on Continue Refresh. If you want to refresh the display
manually click on Refresh. Figure 4.1 depicts a typical view of the Control
Center main dialog window after a measurement has run for a while.
Figure 4.1: The OPERA™ Control Center main dialog window.
In order to stop the measurement, wait until no more commands are
scheduled or press on Stop. Pressing Stop may take some time since all
scheduled commands, active as well as sleeping commands, must be
interrupted which is not possible at all times. Sometimes the OPERA™
Control Center has to wait until a command reaches an interruptible state.
When all commands are stopped, this will be indicated in the status bar of
the main window by the status message "Inactive".
During the measurement all results are written to the file which is indicated
in the title bar of the main dialog window of the OPERA™ Control Center.
Further information about the result file and the result view in the main
dialog you will find in the next section.
7
T H E
R E S U L T
V I E W
5 The Result View
The result view is the table which is drawn in the main dialog window of the
OPERA™ Control Center (see Figure 4.1). It presents the contents of the result
file which was created during the measurement. You may drag the columns
with the mouse in order to change their sequence, and you may modify the
sort order by clicking into the heading of any column.
Please note that between column 6 and 7 there is border which splits the
table into two parts. Since the first six rows are used for grouping the rows,
you are not allowed to drag a column from the left part of the table to the
right part and vice versa.
5.1
The Result File
During the measurement, the results are written in the file that is shown in
the title bar of the main dialog window. As a default, the results are stored in
c:\programme\opera\databases\results.txt. This is the file which is opened
every time when you start the OPERA™ Control Center.
If you want to open another result file, choose the menu option File|Open.
To create a new result file, select the menu option File|New. You may, as
well, save the current results in another file, therefore select the menu option
File|Save as. The chosen file will immediately be opened in the result view
of the OPERA™ Control Center.
5.2
Freezing Fields
It is also possible to freeze rows and columns by pulling the border line
between the row with the column titles and the results values down with the
mouse, or pulling the left most border line of the table to the right. Therefore
move the mouse near to the corresponding line until the mouse symbol
turns into a little lock symbol. Then you may freeze rows or columns by
holding the left mouse button down and move the mouse until all the rows
or columns that you wish to freeze are selected.
The freezed fields will be depicted olive-colored. For instance, if you have
freezed the first two columns, as shown in Figure 5.1, these columns will not
move while you scroll to the right in the result view.
If you want to "unfreeze" fields, you should move the mouse near to a line
between a freezed and a non-freezed area of the result table. The mouse
symbol will turn into the lock symbol again, and you will be able to select a
new freeze area.
8
T H E
R E S U L T
V I E W
Figure 5.1: The main dialog window with the first two columns in freezed mode.
5.3
Selecting the Columns to Display
Maybe the result view of the Control Center will provide you with more
information as you actually require. If you do not want to see all this
information, you may select which columns are shown and which ones are
hidden. Just click on the toolbar button "Select Columns" and check the
appropriate boxes in the dialog that pops up (see Figure 5.2).
Figure 5.2: The Select Columns dialog window.
5.4
Filtering the Results
If you want to filter the results which are shown in the table, there is the
option to generate some filtering rules. Two filter types are available: the
Connection Filter type and the Limit Filter type.
9
T H E
R E S U L T
V I E W
Limit Filters will filter out all results where one or several parameters are
exceeding a user definable limit. Connection filters will allow you to filter
the results depending on which resources have been involved to originate
and terminate the call. For both filter types you may combine several simple
filters using Boolean AND/OR operators in order to form complex filters.
If you want to specify a Connection Filter, use the dialog that appears after
clicking on the menu Filters|Edit Connection Filter. The Connection Filter
dialog is shown in Figure 5.3. For each Condition and Resource Name
option there are drop down fields available. When you confirm your filter
selection with the OK button, the filter condition is immediately applies on
the result view. To switch this filter on and off use the menu Filters|Apply
Connection Filter.
Figure 5.3: The Connection Filter dialog window.
In order to specify a Limit Filter use the dialog that appears after clicking on
the menu Filters|Edit Limit Filter. This dialog allows you to select the
parameters which shall be filtered by drop down list boxes and to specify
the limits by editing a regular edit field. Figure 5.4 shows an example where
a threshold for the PESQ MOS value has been defined. After confirming this
filter setting by clicking on the OK button, the result view will show only
those measurements that fulfill the chosen condition. To switch this filter on
and off use the menu Filters|Apply Limit Filter.
Figure 5.4: The Limit Filter dialog window.
5.5
Alerts
When measuring a system under test with the Control Center, you may
notify a person in case of a specific problem. Therefore you select the menu
10
T H E
R E S U L T
V I E W
option Filters|Alerts. As shown in Figure 5.5, you will in a first step define a
condition for the alert. This is done in the "Limit Definition" section. In a
second step you will define what action should be executed if the condition
defined is fulfilled during the measurement. Check the button titled "Execute
program on alert", and enter a program that is to be executed. This may be a
batch file, or , as shown in the example setup in Figure 5.5, the Windows
network command "net send" to send a message via an IP network.
Figure 5.5: The Alerts dialog window.
5.6
Clearing the Result File
5.7
The Averages Functionality
If you want to delete all the results before starting a new series of
measurements, select the menu View|Clear... and confirm the warning
which pops up with a click on yes. If you want to archive the results you
should copy the result file to a safe location before. The default location for
the result file is c:\programme\opera\databases\results.txt. As mentioned
in Section 5.1, you may choose a different location on your computer where
you want to store the result file.
As a default, the Averages functionality is switched on in the Control Center.
If this option is activated, the results are divided into groups. The groups are
defined according to the very first column in the result view. Within these
groups, all result values are averaged and the average values are shown in
yellow-colored lines above every group.
If you prefer a simpler view of the results, switch off the average of the result
values. Just use the menu "View"|"Show Averages" to toggle between the
two modes.
5.8
Meaning of the Results
Table 5.1 gives an overview of the results which are shown in the result
view of the OPERA™ Control Center. Depending on your current licenses
and system configuration not all of these parameters may be available on
your system, e.g. if you have not purchased PESQ, the PESQ result values
will not be available in the result view, as a consequence. Most measured
parameters correspond to values determined by OPERA™. Please refer to the
OPERA™ manual for a detailed description.
11
T H E
R E S U L T
Column Title
V I E W
Description
Comment
CommentO
CommentT
Origin
Termination
Index
Time
RepCount
MaxRep
CallingSys
Calling Line
CalledNumber
CalledSys
Called Line
RefFile
The comment which is related to the command.
The comment which is related to the originating resource.
The comment which is related to the terminating resource.
The resource name of the interface which originated the call.
The resource name of the interface which terminated the call.
A sequential index of the test measurements
Time in UTC at which the command was started.
Counts the repetitions of the command
Corresponds to "Repetitions" in the command definition
Name of the system that originated the call.
Index of the line interface used to originate the call
Telephone number dialed
Name of the system that terminated the call.
Index of the line interface used to terminate the call
The name of the file which was sent from the terminating side to
the originating side
FileCaller
The name of the file which was recorded at the originating side
(degraded signal)
FileCalled
The name of the file which was recorded at the terminating side
(echo signal)
Tpdd
Post dial delay in ms, including the time required to detect the
ring-back tone (app. 2..3s, country specific)
Tring
Currently not used, please ignore.
Duration
Total duration of the call (including dialing etc.)
TermCause
Termination cause. If it is "connect", the call was successful, all
other values (busy, disconnected...) identify missed call attempts.
PsqmOMOS_W2
The MOS according to PSQM / P.861 using a silence weight of
0.2.
PsqmPlusOMOS
The MOS according to PSQM+.
PsqmDelay
The delay in ms as determined by OPERA™ during calculation of
PSQM.
Attenuation
The attenuation of the line in dB.
EchoDelay
The delay of the severest echo component in ms.
ERL
The echo return loss of the severest echo component in dB,
measured with real speech.
PesqMOS
The MOS according to PESQ / P.862
PesqMOSsp
PESQ / P.862 MOS of the speech parts of the test signal
PesqMOSbg
PESQ / P.862 MOS of the background noise parts of the test
signal
DelayMin
The minimum delay in ms during the call as determined by PESQ /
P.862
DelayAvg
The average delay in ms during the call as determined by PESQ /
P.862
DelayMax
The maximum delay in ms during the call as determined by PESQ
/ P.862
LoudnessRefSone Loudness of the reference signal measured in Sone
LoudnessDegSone Loudness of the degraded signal measured in Sone
LoudnessBackSone Loudness of the background noise parts of the degraded signal
measured in Sone
LevRefTotdBov
Level in dBov averaged over the total of the reference signal
LevRefSpdBov
Level in dBov of the speech parts of the reference signal
LevRefBackdBov
Level in dBov of the background noise parts of the reference
signal
LevDegTotdBov
Level in dBov averaged over the total of the degraded signal
LevDegSpdBov
Level in dBov of the speech parts of the degraded signal
12
T H E
R E S U L T
LevDegBackdBov
PesqAttenuation
V I E W
Level in dBov of the background noise parts of the degraded
signal
Attenuation of the test signal as measured by PESQ / P.862
Table 5.1: The meaning of the columns of the Result View
Column Title
Description (Continued)
FECmin
FECavg
FECmax
HOTmin
HOTavg
HOTmax
Errors
Minimum amount of Front-end clipping (FEC)
Average of Front-end clipping (FEC)
Maximum amount of Front-end clipping (FEC)
Minimum amount of Hold-over time (HOT)
Average of Hold-over time (HOT)
Maximum amount of Hold-over time (HOT)
Errors messages in case of problems
Table 5.2: Continuation of the meaning of the columns of the Result View
5.9
Archiving of the Result Files
During the execution of test measurements with the Control Center, the
result file may increase to a size that is not manageable in a comfortable
way anymore. If you want to separate your results into a number of smaller
files, select the menu option Extra|Options... The Control Center will offer
you the option to define an archive location on your computer where the
result files will be stored during the execution of the test measurements. As
shown in Figure 5.6, you will define an archiving interval. If you want to
switch off the archiving functionality, enter the value zero into this edit box.
The archived result files are stored in the directory that is defined in the edit
field on the top of the dialog ("Move results to:"). If you want to use unique
file names for the archiving, check the switch located underneath the edit
box for the archiving interval. If you choose not to use unique file names,
the archived result file will remain the file name shown in the title bar of the
main window and will be overwritten in each archiving process.
As a default, the test WAVE files that are acquired during the execution are
stored in the directory d:\remote. When you do not wan to store these files
on your computer, check the switch titled Delete wave files after
evaluation, which will prevent that your hard disk will run out of free
memory during the execution of a large number of test measurements.
Figure 5.6: The Options dialog window for archiving result files.
13
T H E
5.10
R E S U L T
V I E W
Viewing Statistics
In order to view some statistics of certain result values shown in the result
view, first select a result value by clicking somewhere into the
corresponding column. Then, by a right mouse click, select the option Show
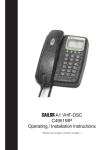
Chart, a dialog window as shown in Figure 5.7 will pop up.
Figure 5.7: The PDF chart dialog window
The diagram shown in the top of the dialog is the probability density
function (PDF) of the result parameter you have selected. The horizontal axis
represents the measurement values, the vertical axis represents the
probability. The second diagram presents the measurement result values
versus time. Here, the horizontal axis represents the index in the table of the
result file. The vertical axis represents the values of the result parameter.
If you want to change the number of bars shown in the PDF diagram to have
a different resolution, you can either select a value from the drop down list
of the edit field titled Select number of bars. or you enter a certain value
into the edit box. Please note, that your changes only take effect after you
have pushed the Refresh Chart button located on the bottom of the dialog
window.
If you want to change the value range of the horizontal axis of the PDF
diagram, modify the setting in the two edit boxes located underneath the
title Select value range. When you click the Reset Selection button, the
edit boxes will be set back to their default settings. As explained above, the
14
T H E
R E S U L T
V I E W
selected value range will only take effect after you click on the Refresh
Chart button.
5.11
Printing Results
In order to print the result view, select the menu option File|Print. Please
setup the page layout from the windows menu Start|Settings|Printers.
5.12
If No Data is Shown Even if the Result File Exists...
It is rare, but it may happen that your result file contains field names
different from those expected by the OPERA™ Control Center (e.g. if you
started it with a corrupt result file). In this case the OPERA™ Control center
will not show any useful data. However it is easy to cope with this: select
View|Reset Field Names from the menu. This will synchronize the field
names used by the Control Center with those in the result file. If this does
not help, try to clear the result file as described before and then repeat this
step and restart the measurement. After the first new results are available, the
new field names will be read from the result file.
15
S U M M A R Y
O F
T H E
M E N U
A N D
T O O L B A R
O P T I O N S
6 Summary of the Menu and Toolbar Options
An overview of all the menu option of the Control Center is listed in Table
6.1. The functionality toolbar buttons is summarized in Table 6.2. For further
details, you will find references to the sections in this documentation.
Menu Option
Description
File|New...
File|Open...
File|Save as...
File|Page Layout...
Creates and opens a new result file (see Section 5.1)
Opens an existing result file (see Section 5.1)
Save current result file to hard disk (see Section 5.1)
To setup the page layout for printing, please use the
windows option Start|Settings|Printers
Prints current result view (see Section 5.11)
Exits the OPERA™ Control Center
Applies the connection filter to the result view (see
Section 5.4)
Applies the limit filter to the result view (see Section
5.4)
Opens a dialog to edit the connection filter (see
Section 5.4)
Opens a dialog to edit the limit filter (see Section
5.4)
Opens a dialog to define a alert functionality (see
Section 5.5)
Switches on/off the toolbar
Switches on/off the statusbar
Switches on/off the averages functionality
Refreshes the result view (see Section 4)
Synchronizes the field names of the current result
file with the result view of the Control Center (see
Section 5.12)
Clears the current result view and deletes the
corresponding result file (see Section 5.6)
Opens a dialog to specify the archiving functionality
(see Section 5.9)
File|Print...
File|Exit
Filters|Apply Connection Filter
Filters|Apply Limit Filter
Filters|edit Connection Filter...
Filters|Edit Limit Filter...
Filters|Alerts...
View|Toolbar
View|Statusbar
View|Show Averages
View|Refresh
View|Reset Field Names
View|Clear...
Extra|Options...
Table 6.1: Overview of the menu option of the OPERA™ Control Center.
Toolbar Button
Description
Start
Stop
Commands
Phone Book
Continue Refresh
Pause Refresh
Refresh
Select Columns
Starts the execution of the commands (see Section 4)
Stops the execution of the commands (see Section 4)
Opens the dialog for defining the commands (see Section 3.3)
Opens a dialog to define the resources (see Section 3.2)
Continues with refreshing the result view (see Section 4)
Pauses the refreshing of the result view (see Section 4)
Refreshes the result view once (see Section 4)
Opens a dialog to specify which result parameters are shown
the result view (see Section 5.3)
Table 6.2: Overview of the toolbar buttons options of the OPERA™ Control Center.
16
O T H E R
I S S U E S
O F
T H E
C O N T R O L
C E N T E R
7 Other Issues of the Control Center
7.1
Modifying the Evaluation of the Results
7.2
A Note to Users of Versions older than V3.5
7.3
Full and Light Version of the OPERA™ Control Center Software
It is possible to widely vary the way in which the results are calculated.
Essentially all options and results that are available through the
commandline interface of OPERA™ are available in the OPERA™ Control
Center, too. Modifying the settings used by the Control Center however
requires modifications of the Windows registry. Please contact OPTICOM if
you have some specific needs.
In all databases the field names have changed and also the result table uses
different field names now. This was necessary in order to make it consistent
with OptiCall™ and to implement more features. We recommend to copy
the data from old databases to the new format using MS Access.
There are two versions of the OPERA™ Control Center Software available, a
"full" version and a "light" version. To see which version is currently at your
disposal, check the title bar of the OPERA™ Control Center main window.
The full version is indicated by the string "OPERA Control Center", the light
version is titled "OPERA Control Center Light".
The light version is included in delivery of every OPERA™ Objective
Perceptual Analyzer. The light version is restricted for the operation with the
localhost only. That is, you may not remote control other OPERA™ systems
than your local analyzer. Entries in the Phonebook dialog (see Section 3.2)
using system names other than "localhost" will result in non-functional
commands. Please note, also the explicit entry of the computer name of the
local host will be regarded as invalid in the light version.
If you want to use the OPERA™ Control Center to control distributed
OPERA™ analyzers, you will have to purchase the full version of the
Control Center software (OPR-003-CTR-X, or OPR-010-CTR-X).
17