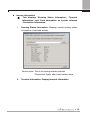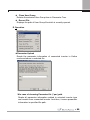
1
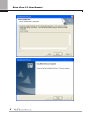
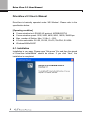
Drive View 3.3 User Manual DriveView v3.3 User’s Manual DriveView is basically operated under ‘MS Window’. Please refer to the specification below. [Operating condition] z Communication tool: RS485 (LS protocol, MODBUS-RTU) z Communication speed: 1200, 2400, 4800, 9600, 19200, 38400 bps z Max. number of Station: Max. 31 (No.1 ~ 255) z LS drive selectable: SV-iS5, SV-iV5, SV-iC5, SV-iP5A, SV-iG5A z Windows98/Me/2K/XP 6-1. Installation Installation is very easy. Please open “Setup.exe” file, and then the wizard of DriveView InstallShield” should be shown. If you click “Next”, the installation is completed. 1 2 Drive View 3.3 User Manual 3 6-2. User’s Manual Please click the “DriveView” icon of program menu or main screen. You can start “DriveView”. 6-2.1 DriveView Composition “DriveView” consists of 5 main screens. z z z z z Main Window Display of integrated management and main operation status Keypad Monitoring and handling the data of inverter Parameter Editor Supporting ON-LINE & OFF-LINE mode and managing inverter parameters Report Reporting the parameter data edited in parameter editor, and saving them in Excel and HTML file format. Graph Monitor Monitoring graph type of inverter data 4 Drive View 3.3 User Manual 6-2.2 Main Window Main Window is the superior scene which can manage sub window such as Keypad, On-line & Off-line parameter, Report and Graph monitoring. If you close the main window, every window is closed. Main window can show and set up three menus, tool bar and event log of inverter’s status connected presently. 5 ① Connection Information ③ Event Log ② Fault History ④ Status Bar I. Connection Information Shows information of inverters connected via communication network. II. Fault History Show and register the fault history which has happened after starting DriveView. It can display up to 200 fault history. III. Event Log Shows and registers the operation status of inverters connected via communication network IV. Status Bar Displays the status bar of search process, graph mode, protocol mode, communication mode, communication speed and communication status. 6 Drive View 3.3 User Manual A. Operation z Select ID This searches the inverters connected via communication network, and shows main status of inverters on ‘Select ID’. I. II. III. z 7 Select ID: Checking inverter of one ID IDs range: Checking inverters of certain range All IDs: Checking inverters of all range (1 – 255) Cancel ‘Select ID’ Makes ‘Select ID’ canceled. z Inverter Information ① This displays ‘Running Status Information’, ‘Terminal Information’, and ‘Fault Information on inverter selected ‘Connection Information’ I. Running Status Information: Displays current running status information of selected inverter Device name: This is for naming inverter selected. Please click ‘Apply’ after insert certain name II. Terminal Information: Display terminal information 8 Drive View 3.3 User Manual III. z 9 Fault Information: Display Fault History of selected inverter Update ① Re-operates ‘Connect’ for inverters related to connection information. z Keypad ① Operates Keypad window for inverters related to connection information. z Online Parameter Editor ① Operates Online parameter editor for inverters related to connection information (For only inverters connected successfully). <Inverter Successful Connection?> Inverter Successful Connection implies several conditions that can collect information (inverter model and version) which is needed and applicable LS inverters for Drive View and can read the corresponding data file successfully. [ON-LINE Parameter Editor] I. II. III. FREQ Mode RPM Mode Some parameters of data file read during successful connection can be shown with units of Frequency or RPM. If you select one out of 2 units, every parameter is defined by the unit. The factory default is Freq. TIME1 TIME1 displays the value read in TIME1 Scale during successful connection. Every parameter related to TIME1 Scale is processed by this unit. 10 Drive View 3.3 User Manual z Offline Parameter Editor Offline Parameter Editor is the tool which enable to edit and check parameters not related to connected inverters. DriveView 3.3 permits maximum 32 Offline Parameter Editor Windows. [OFF-LINE Parameter Editor] I. II. FREQ Mode RPM Mode Some parameters of data file of inverter’s series and version which you want to work on can be shown with units of Frequency or RPM. If you select one out of 2 units, every parameter is defined by the unit. The factory default is Freq.. III. TIME1 TIME1 displays the value read in TIME1 Scale during successful connection. Every parameter related to TIME1 Scale is processed by this unit.. IV. Inverter Series V. Inverter Version Select the inverter series and version which you wand to work on. VI. Setup ‘Setup’ button enables to read the data file following the selected items above. If error occurs during reading the data, error message appears at the low stage. In case the reading process is successful, parameters of inverter are initialized, the Parameter Editor window starts. 11 z z z Graph Monitor Over 1 inverter connected via communication network is necessary to start graph monitor. Graph Monitor is permitted on only one window, and it can show every items ‘Event Log’ Start Event Log registers and shows the operation status, connection status, and fault history of every inverter connected via network on ‘Event Log’ window. ‘Event Log’ Stop Makes ‘Event Log’ stop. B. Setup z Communication Port Setup Sets up communication port. 12 Drive View 3.3 User Manual I. Serial Communication Port Select serial communication port of user’s computer which takes over ‘Master’ via communication network. The defaults of data bit, parity, and stop bit are each 8 bit, none, and 1 bit. II. RS485 TX Enable Control You can use RS232-485 to connect computer using RS-232C to inverter using RS-485. Please check out the most suitable converter satisfying your needs with best specification and performance. Usual RS232-485 converters are having the function of Auto Tx Enable Control. But some users are possessing old RS232-485 not supporting Auto Tx Enable Control. So DriveView 3.3 adopts this function with RTS signal of RS-232C. [ RS232-485 converter ] ‘Auto Tx Enable’ type: CNV485A (RealSYS) ‘RTS control Tx Enable’ type : Transio A53 (MOXA) III. Operation Mode Protocol Mode Supporting LS485 & MODBUS-RTU [Notice] LS 485 protocol is more efficient and faster than MODBUSRTU in data monitoring. Because LS485 protocol supports the useful function that enables to simultaneously monitor max. 8 discrete address data with monitor registration request and operation command. But MODBUS don’t . So we recommend you use LS485 protocol for speedy and TimeOut You can set TimeOut it takes to receive the response after sending operation request like reading and writing. 13 Retry Number Usually the response can’t be delivered even though TimeOut passes by. For this state, you can set the number of requesting the same operation. We recommend you select ‘3’ making stable operation. IV. Network Installation Please connect RS-485 wire to (S+) and (S-) terminals. After checking the wiring completed, turn on the inverter. DriveView RS23 RS232-485 converter RS48 Inverter SV-iS5 #1 z z z Inverter SV-iC5 #2 Inverter SV-iV5 #3 Inverter SV-iG5A #11 Inverter SV-iP5A #12 Fault History file save Sets the file directory of saving fault history. “history.log” of Log directory is the default in DriveView 3.3. Event Log file save Sets the file directory of saving Event Log file. “event. txt” of Log directory is the default in DriveView 3.3. Fault History delete Delete all fault history saved meantime. 14 Drive View 3.3 User Manual C. Connection Information window After clicking ‘Connection’, this window shows every inverter connected in communication network and displays operation status of them. In order to operate ‘Keypad’, ‘Online Parameter Editor’ and ‘Connection Information’, you should select one ID and click one of them. If you select one ID and click the right button of mouse, you can see the same window above. D. Fault History After starting DriveView 3.3, this window can display max. 200 fault history of inverters connected in communication network. 15 E. Event Log After starting DriveView 3.3, this window can display max. 200 of operation status, connection status, and fault history of inverters connected in communication network. After starting DriveView 3.3 each time, the previous Event Log is deleted automatically, and gets started newly. F. Status bar z z z z z z Status bar of ‘Connect’ After clicking ‘Connect’, it displays the status of operation. Graph mode Shows the operation status of Graph mode from ‘Graph Monitor’ window. Protocol mode Shows communication Protocol used currently. Communication port Shows communication port used currently. Communication speed Shows communication speed on current communication network. Communication transmission/reception status Shows current communication transmission and reception status. 16 Drive View 3.3 User Manual 6-2.3 Keypad Keypad window is used for monitoring of common area of inverter except for Input/Output terminal and fault information. It has a function of Write parameter editing. Select the inverter at Connection Information list of Main window and select ‘Keypad’. Inverter informatio 7-segment Display Monitoring parameter Run status Run A. Operation z Forward Run It is same with ‘FWD’ button in upper figure. (Inverter operates Forward Run) 17 z Reverse Run It is same with ‘REV’ button in upper figure. (Inverter operates Reverse Run) z Stop/Reset It is same with ‘STOP/RESET button in upper figure. (Inverter is stop or reset) B. Inverter Information Displays communication station number model and device names of inverter. C. 7-segment Display Displays parameter data which is selected in Monitoring Parameter. D. Monitoring Parameter Select the parameter to monitor. E. Run Status LED Displays present status of inverter operation. F. Run Button Sets inverter operation. G. Status Bar Displays Graph mode operation in Graph Monitor Window. 18 Drive View 3.3 User Manual 6-2.4 Parameter Editor Parameter editor has a parameter Write/Edit function in inverter group and User Group. DriveView 3.3 supports ON-LINE mode and OFFLINE mode. Select inverter on Connection Information list and then click Online Parameter Editor on the menu or toolbar. Parameter Tree Parameter list A. Parameter Tree Displays Parameter Group of data file and User Group which are selected inverter’s model and version. z Click the left mouse button on selected group It displays the parameter in Parameter Group in parameter list. z Double click left mouse button on selected group It reads the parameter of selected group from connected inverter at Online mode. z Selected item in parameter list is Drag & Drop to User Group in Parameter Tree If new parameter will be add in User Group, Select parameter in parameter list. And then, Drag and Drop to User Group in Parameter Tree. 19 B. Parameter List Displays the parameter of selected group in Parameter Tree. z Double click in Online mode Used to edit the selected parameter. (Read/Write of corresponding parameter value from connected parameter) Input parameter Parameter selection Online parameter Read/Write button Up/Down button for Parameter Move Used to edit the upper/lower parameter of selected parameter in parameter list. z Double click in Offline mode Double click the ‘Value’ in parameter list, it is changed into Offline parameter editing mode. 20 Drive View 3.3 User Manual C. File z New User Group Make new user parameter group that corresponds to the selected inverter type and version. After making a new parameter, select the parameter in the parameter list and then drag-and-drop. z Open User Group Opens previous User Group file (*.usr) and adds file data of selected group file to User Group in Parameter Tree. z Save User Group Saves edited user Parameter Group in User Group file (*.usr). 21 z Close User Group Deletes the selected User Group item in Parameter Tree. z Recent File Displays the path of User Group file which is recently opened. D. Operation z Parameter Upload Reads the parameter information of connected inverter in Online mode and saves in selected file. In case of choosing Parameter file (*.par) path Reads all parameter information related to selected inverter type and version from connected inverter. And then, it saves parameter information in specified file path. 22 Drive View 3.3 User Manual In case of choosing User Group file (*.usr) Opens specified User Group file and saves only parameter information in User Group in connected inverter. z Parameter Download Downloads parameter value in selected file in Online mode to connected inverter. In case of choosing Parameter File (*.par) path Open the selected parameter file to check inverter type and version and then download the parameter information in inverter. In case of choosing User Group file Open the selected User Group file to check inverter type and version and then download the parameter information in inverter. < Warning > If the version is different, dialog box is appeared asking whether or not to download. Check the selected parameter which is usable with present version and then download. z Parameter Compare Compares parameter value of selected file with correspondent parameter of connected inverter in Online mode. And it displays different parameter information. 23 In case of choosing Parameter file (*.par) path Selected Parameter in Parameter is compared with connected inverter’s parameter about inverter’s type and version. And, compares parameter information in file is compared with inverter’s correspondent parameter. And different Parameter information displays as list type. In case of choosing User Group file (*.usr) path Selected User Group is compared with connected inverter’s type and version. Then, parameter information in file is compared with and correspondent parameter in inverter. The result of different parameter information displays as list type. z Read Parameter File Open Selected parameter file (*.par), it is compared with current parameter about inverter’s type and version in Parameter Editor and then it displays parameter in parameter list. z Save Parameter File Saves current parameter value of Parameter Editor in selected parameter file (*.par). 24 Drive View 3.3 User Manual z Save Text File ON-LINE mode All Parameter information of connected inverter is reflected in Parameter Editor and then saves as text file (.txt). OFF-LINE mode All parameter information setting in Parameter Editor saves as text file (.txt) z Online Parameter Edit Used to change the selected parameter value at parameter list in ON-LINE mode. z Update Parameter List Used to update parameter in parameter list from selected Parameter Group and User Group at Parameter Tree in ON-LINE mode. z Parameter Report Displays the parameter of selected Parameter Group and User Group as Report type. Select the Parameter Group in Parameter Tree and then Use ‘Report’ function. E. Setup z Parameter Editor Mode Setup Used to change the setups when Parameter Editor is executed. Please refer to page 8 for more details. 25 z Report Header Setup Used to input the user information to display at Report View’s header. F. Status bar It displays Graph mode operation status, ON/OFF-LINE status, Inverter type, Inverter version, Parameter Editor setting information (FREQ MODE and TIME1 value) and all parameter number of selected parameter group. 26 Drive View 3.3 User Manual 6-2.5 Parameter Report Report window belongs to the parameter editor, and it shows the edited parameter data into a report format and provides the function to save the data into Excel or HTML format. Select the parameter group to display on the Parameter Tree pain, and click Report on the Operation menu or click Report . A. File z File Export Allows user to export the selected parameter group data to an excel (*.xml) or HTML (*.htm) file. z Print Prints the selected parameter group data as a report type. B. Operation z Update Updates the Report window based on the recent parameter data. C. Setup z Report Header Sets the report header information. 27 6-2.6 Graph Monitor Graph Monitor window monitors inverter common area including input/output terminal and fault information, and these are displayed as a graph type and saved into a file. Monitoring can be paused, and the current screen can be saved while user customized trigger event is occurred. The monitoring of the main and other sub windows can be paused or activated through Graph Watch Mode, and it enables a user to monitor data more accurately. ① Graph Window ② Monitoring Status Display and Time Settings ③ Monitoring Variables and Graph Settings 28 Drive View 3.3 User Manual Graph Monitor Key Functions ① Graph Window Shows the collected parameter data of the selected monitoring channel. A different action is performed when mouse is clicked followed the screen mode selected on the Graph Screen Mode of the Setup menu. For more information, refer to the below description Menu and Toolbar. ② Monitoring Status Display and Time Setting A. Recording / Triggering Displays whether data is recorded and set trigger event is occurred. B. Elapse Time Displays elapsed time after monitoring. (Hour/Minute/Second) C. Record Counter Displays the total number of the recorded channel parameter data. D. X-Axis Time Set time for the X-axis that can be displayed on graph. E. Monitor Time Set time intervals to insert the displaying data into a graph. Do not get confused with the actual data collecting time via communication. F. Record Time Set the save interval. ③ Monitoring Variables and Graph Setting A. Channel Setup (supports a total of 4 channels) 29 ON/OFF Button Check this button to turn on or off the corresponding channel monitoring. Inverter stations and parameter variable setting items are enabled or disabled following this selection. If the switch is turned off during monitoring, corresponding graph line will be disappeared from the graph window. Inverter Station Setup Select the inverter station to monitor. Parameter Variables Setup Select inverter parameter variables to monitor in a graph mode. Data Displays recently collected data value during monitoring, and the yellow cursor bar indicates the data value when the graph screen mode is activated as a cursor mode. Offset Means a certain value that is added to or subtracted from the collected channel parameter data. When several parameters are monitored, this is used to get a whole view of the graph by differing the Y-axis origin using the offset value. Val/Div Means a certain value that is multiplied to the collected channel parameter data. When several parameters are monitored, this is used to prevent the state that the graph line is displayed as a straight line for reason of one parameter value’s unit is too big and the other is too small. B. Graph Screen Setup Line Color Specifies the color of each channel’s graph line. 30 Drive View 3.3 User Manual Line Width Specifies the width of each channel’s graph line. Y-Axis Auto Scale Select this option to automatically display the calculated maximum value of the Y-axis when a new value is added during monitoring. If this is not selected, data is displayed in the maximum and minimum range of the Y-axis. Y-Axis Min./Max. Specifies the maximum and minimum of the Y-axis when Y-Axis Auto Scale is not used. Show Grid Select this option to display or hide vertical and horizontal gridlines. Show Label Select this option to display or hide the line color and parameter variable name. Cursor The cursor pointing channel when Cursor is selected in Graph Screen Mode. C. Trigger _Record Setup Trigger Channel Specifies channel to set Trigger Event. Trigger Value Specifies the parameter variable of the channel to trigger Event. Edge Trigger Specifies Edge Trigger mode, rising or falling mode can be set. If Rising is selected, Trigger Event occurs when the collected data exceeds the specified trigger level, and if Falling is selected it occurs when the collected data is less than the specified trigger level. 31 Save Image Select this option to save the screen image when Trigger Event occurs. Record File Path Specifies file directory to record the collected data. Trigger Graph Image File Path Specifies file directory to save the graph image when Trigger Event occurs in case Save Image is selected. Menu and Toolbar A. File Open Scope File Opens the scope file and displays the graph environment and data. Save Scope File Saves the currently set graph environment and collected graph data into a file. Save As Saves the currently set graph environment and collected graph data as a different file. Graph Image Save Saves the active graph image into a specified file format. Copy To Clipboard Copies the active graph image into a window clipboard. The image can be displayed by selecting Paste in a program like MS-Word and Paint. Print Graph Image Prints the active graph image. 32 Drive View 3.3 User Manual B. Operation < Graph Watch Mode? > Previous DriveView programs reflect data irregularly because they collect data with other windows like Main Window Inverter Register, Keypad, Parameter Editor, Text Monitor, etc., during monitoring. DriveView 3.3 provides “Graph Watch Mode” so to the user can get more accurate data. While this function is activated, other window’s monitoring function is stopped except graph monitoring. (But Fault History is activated.) Click Graph Watch Mode, and then click Start Monitor. Start Monitor Starts data monitoring. Stop Monitor Stops data monitoring. Start Record Records data on the specified file. Stop Record Stops data recording. Start Trigger Starts Trigger Event monitoring. Stop Trigger Stops Trigger Event monitoring. Graph Watch Mode Determines whether to use Graph Watch Mode. 33 C. Setup Cursor Channel Point to Graph Screen Mode on the Setup menu, and then click Cursor. Graph Screen Mode A. Normal Graph is normally displayed in this mode and when data is collected, the mode changes into Normal mode automatically. The screen turns to the initial graph screen if the mode changes from Cursor/Zoom/Scroll to Normal. B. Cursor Stop monitoring to activate this mode, and place the mouse cursor where to look, and then click or drag the cursor bar to display the data value. C. Zoom Stop monitoring to activate this mode, and select area by dragand-drop to get a magnified view. D. Scroll Stop monitoring to activate this mode, and drag the mouse to scroll to the selected direction. Y-Axis Auto Scale Select this option to automatically display the calculated maximum value of the Y-axis when a new value is added during monitoring. If this is not selected, data is displayed in the maximum and minimum range of the Y-axis. Grid Select this option to display or hide vertical and horizontal gridlines. Label Select this option to display or hide the line color and parameter variable name. 34