1
GeoTest
User Manual
Geophysics - Dr. Rauen
GeoTest user manual ● page 1 of 41
Contents
Contents.......................................................................................................................................................................... 2
0
Getting started......................................................................................................................................................... 3
1
Introduction - What is GeoTest?............................................................................................................................. 5
2
Supported hard- and software................................................................................................................................. 6
2.1
Computer............................................................................................................................................................. 6
2.1.1 How to locate the installed COM port(s)?....................................................................................................6
2.2
Geoelectric equipment........................................................................................................................................ 6
2.2.1 LGM 4-Point-Light hp + ActEle....................................................................................................................6
2.2.2 GeoSys........................................................................................................................................................ 8
2.3
GPS Device......................................................................................................................................................... 8
3
Installation of GeoTest............................................................................................................................................ 9
3.1
Installation........................................................................................................................................................... 9
3.2
Registration......................................................................................................................................................... 9
3.3
Hardware key (USB dongle)................................................................................................................................9
4
Using of GeoTest.................................................................................................................................................. 10
4.1
The main form................................................................................................................................................... 10
4.1.1 The main menu......................................................................................................................................... 11
4.1.1.1 File..................................................................................................................................................... 11
4.1.1.2 Set..................................................................................................................................................... 12
4.1.1.2.1
Setup cables and electrode chains...........................................................................................12
4.1.1.2.2
Setup electrodes and data header............................................................................................13
4.1.1.2.2.1
Data header....................................................................................................................... 13
4.1.1.2.2.2
Profiling.............................................................................................................................. 13
4.1.1.2.2.3
Mapping............................................................................................................................. 17
4.1.1.2.2.4
Moving electrodes / GPS...................................................................................................19
4.1.1.2.2.5
Electrodes positions..........................................................................................................20
4.1.1.2.2.6
Remote electrode positions...............................................................................................22
4.1.1.2.2.7
Custom made electrode configurations.............................................................................23
4.1.1.2.2.8
Setting electrodes and data header...................................................................................23
4.1.1.2.3
Setup measurement parameters..............................................................................................24
4.1.1.2.4
Setup program options..............................................................................................................26
4.1.1.3 Measure............................................................................................................................................ 28
4.1.1.3.1
Measure contact resistances....................................................................................................28
4.1.1.3.2
Measure start / stop..................................................................................................................30
4.1.1.4 Data................................................................................................................................................... 31
4.1.1.5 Device............................................................................................................................................... 31
4.1.1.6 Extra.................................................................................................................................................. 32
4.1.1.6.1
Monitoring................................................................................................................................. 32
4.1.1.6.1.1
Monitoring - "Start / stop"..................................................................................................32
4.1.1.6.1.2
Monitoring - "Save"............................................................................................................32
4.1.1.6.1.3
Monitoring - "Status"..........................................................................................................33
4.1.1.6.1.4
Monitoring - "List"...............................................................................................................33
4.1.1.6.2
Simulation mode.......................................................................................................................34
4.1.1.6.3
Registration...............................................................................................................................34
4.1.1.6.4
Language.................................................................................................................................. 34
4.1.1.7 Help................................................................................................................................................... 34
4.1.2 Pseudo sections........................................................................................................................................ 35
4.1.2.1 Profiling mode: pseudo-depth sections.............................................................................................35
4.1.2.2 Mapping mode: horizontal slices.......................................................................................................36
4.1.3 Data list..................................................................................................................................................... 37
4.1.4 Electrode switch box................................................................................................................................. 39
4.1.5 Frequency settings.................................................................................................................................... 39
4.1.6 Transmitter................................................................................................................................................ 39
4.1.7 Receiver.................................................................................................................................................... 39
4.1.8 Measurement status.................................................................................................................................. 39
4.1.9 Battery power............................................................................................................................................ 39
4.2
Examples: performing measurements...............................................................................................................40
4.3
The GeoTest command line parameters...........................................................................................................40
5
About GeoTest...................................................................................................................................................... 41
5.1
Software agreements........................................................................................................................................ 41
5.2
Program and manual version............................................................................................................................41
5.3
Program author................................................................................................................................................. 41
6
References............................................................................................................................................................ 41
GeoTest user manual ● page 2 of 41
0
Getting started
GeoTest is a powerful software tool for data acquisition and controlling of geoelectric equipment using
many electrodes, so called multi-electrode-geoelectrics. Profiling and mapping measurements are
possible, as well as custom made measurements. Moving arrays with GPS position measurements and
completely automatic monitoring measurements are supported also.
Additional inversion software (not part of GeoTest) is used for Geoelectric Tomography.
See chapter 1 for an introduction.
Safety requirements
Be careful in using geoelectric equipment. Geoelectric devices can produce high
electrical voltages of 200 Volts or more.
Be always sure to switch the power off, when you are touching electrodes or
power outlets to avoid injuries.
Read carefully the instruction manuals of the producer of your geoelectric
hardware.
GeoTest user manual ● page 3 of 41
First steps to prepare GeoTest
Step 1 ● Installation
You have to install the software on your computer. See chapter 2.1 for computer
requirements. See chapter 3.1 for more details about installing the software.
Step 2 ● Run GeoTest
When GeoTest is run the first time, a form named "Getting started" will appear and will lead the user
through the following main settings and adjustments, see chapter 4.1.1.2.4.
Step 3 ● Registrate and un-lock program
After the installation of GeoTest, the program runs in a limited ("locked") mode. In this mode, the
maximum number of electrodes is limited. The user has to registrate the program to
get a legal licence and to have access to all features. The producer of GeoTest will
dispose a registration key. The chapter 3.2. describes the registration procedure.
Optionally, the program GeoTest may be un-locked by the use of a hardware key
(USB dongle).
Step 4 ● Set measurement device
Now the user has to configure the connected devices. He has to configure the computer interface(s) also
to allow communication between the software and the hardware. See chapter 2.2.1. (geoelectric
equipment) and chapter 2.3 (GPS device). All configurations up to this step are done only once after
installation of GeoTest on a new computer.
Step 5 ● Set cable configuration
The last important step is to configure the cables (electrode chains). The user has to set the number of
electrode chains he wants to use. Up to 10 cables are possible. The user has also to set the electrodes
addresses available with each cable. These settings will be displayed in the "setup cables and electrode
chains" window (see chapter 4.1.1.2.1).
Step 6 ● Set Standard profile parameters
The user may set standard values for the data header and the profile parameters. See chapter 4.1.1.2.2.
Step 7 ● Set Standard measurement parameters
The user may set standard values for the measurement parameters. See chapter 4.1.1.2.3.
GeoTest user manual ● page 4 of 41
1
Introduction - What is GeoTest?
GeoTest is a software for controlling geoelectric equipment in combination with many electrodes. This
type of geoelectric measurement is called "Multielectrode Geoelectrics". Using two-dimensional or
three-dimensional inversion techniques additionally for evaluation, this method is known for "Geoelectric
Tomography".
Geoelectric tomography is a modern type of 4-point geoelectrics. "4 point" means, for one measurement
always four electrodes are used. Two electrodes serve as current emitting electrodes. These are usually
named A and B. Two other electrodes measure the potential difference (= voltage). These are the M and
N electrodes.
The measurements can be done in two principal different orientations. GeoTest supports both:
Profiling: this means measurements, where the electrodes are set along a linear profile on the
earth surface. The measurement profile is 1-dimensional (e.g. in x direction) and the result will be
a 2-dimensional depth section, which is a plane in e.g. x- and z-direction.
Mapping: the electrodes are set along a 2-dimensional grid on the earth surface. The
measurements are done in a 2-dimensional plane (e.g. in x- and y-directions). The result will be a
3 dimensional block containing x-, y- and z- coordinates.
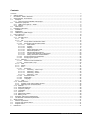
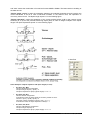
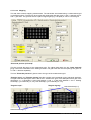
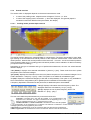
The following pictures show some explanation of the technique to measure one geoelectric profile
("profiling").
This is a sketch of the multielectrode measurement principle.
The displayed example explaines
the so called Wenner configuration.
The electrode distances are integer
multiples of the minimum electrode
separation. Expanding the spread
(= distance of current emitting
electrodes A and B) results in an
increasing investigation depth.
The graphical display of the
measured resistiviteis is called
"Pseudo Section". "Pseudo" expresses, that this is not yet a real
depth section. The pseudo section
will be shown during the measurement on the computer display.
To progress from the "pseudo"
section to the real depth section,
some 2-dimensional evaluation is
necessary. The evaluation includes
topography corrections and calibrations. The shown depth section is
the result of the inversion program
Res2DInv.
For a further explanation of Geoelectric Tomography see Berktold et al. (1997) or Friedel (1997). The
investigation depth definition used in GeoTest is described in Roy and Apparao (1971) and Barker (1989).
Edwards (1977) introduced another definition of the investigation depth. See references.
GeoTest user manual ● page 5 of 41
2
Supported hard- and software
2.1
Computer
GeoTest runs on desktop or notebook PCs with Windows 95 (TM) or later operating systems. GeoTest
runs on 64 bit systems like Win Vista 64 bit or Win7 64 bit as well. Communication with the
measurement device is done by a serial (RS232) interface. This RS232 interface may be an original
COM1 port or a driver emulated COM port using an USB-to-serial adapter. In this case, please be sure to
install the device driver software before using the adapter. The computer hardware specifications are not
critical. We recommend:
Windows XP (TM) 32 bit version or later
at least 512 MB RAM
1 RS232 serial port or 1 USB port with an adapter USB-to-serial
in case of GPS measurements: another RS232 serial port or USB-to-serial adapter.
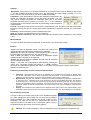
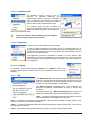
2.1.1
How to locate the installed COM port(s)?
The following explanation refers to the German Windows XP operating system.
►
►
►
►
►
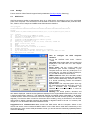
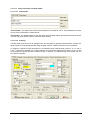
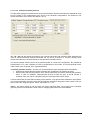
This example shows 3 installed COM ports: COM1 and COM2 are the standard COM ports of the desktop
computer. COM3 is an additionally installed USB-to-serial converter.
2.2
Geoelectric equipment
2.2.1
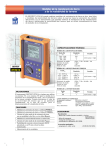
LGM 4-Point-Light hp + ActEle
Erich Lippmann is the manufacturer of this geoelectric equipment consisting of
"4-Point-Light hp" or "4-Point-Light 10W", a high power, low cost induced polarization (IP) earth
resistivity meter: for Schlumberger soundings to L/2 = 1 km, for mapping, monitoring, geoelectric
tomography, lab work, induced polarization measurements, archeology.
"ActEle", active electrodes for electrical resistivity tomography with direct interface for 4point light.
Can be used to upgrade existing earth resistivity meters to state-of-the-art tomography systems.
Up to 255 electrodes are possible.
LGM
Erich Lippmann
Kornacker 4
94571 Schaufling
Germany
Tel: +49 (0) 9904 84076
Fax: +49 (0) 9904 8119802
email: [email protected]
http://www.l-gm.de/
GeoTest user manual ● page 6 of 41
Ground electrode GND
This device uses a ground electrode to reference the potential measurements. This ground electrode is
important and absolutely necessary. The ground electrode is not part of the measurement profile or grid.
It has to be placed somewhere nearby the instrument but not near besides one of the profile electrodes.
Be sure to realize low contact resistance of the ground electrode. Connect the ground electrode to the
"GND" input terminal of the instrument.
Computer interface
This equipment needs one serial interface to the computer (RS232). This can be the standard COM1 port
(if the computer has one) or some driver emulated COM port, e.g. by using an USB-to-serial converter.
Due to our experience, the using of the standard COM1 port is without any problems. Not every USB-toserial converter works properly. If you get some communication problem, it is most likely a result of not
proper functioning of the USB-to-serial converter. You could fix this problem by either (1) updating the
USB-to-serial converter driver software or by (2) using another converter.
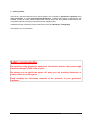
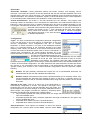
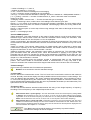
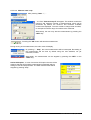
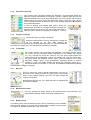
How to configure the computer interface and the hardware setup
Go to the GeoTest main menu → Set → Options → Getting started → Set measurement device.
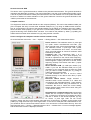
Device version: The hardware version "4 point light
hp" (older version manufactured until 2007, grey
case, left side) uses a fixed serial baudrate of 1200.
The hardware version "4 point light 10W" (newer
version manufactured since 2007, red and black
case, right side) allows to choose a maximum serial
baudrate up to 38400.
Frequency set: The instruments uses 1 of 2
possible frequency sets. The used frequency set
should be optimized to the actual mains frequency,
because of the maximum suppression of undesirable
electromagnetic coupling. Be sure to set the "mains
frequency" directly in the device menu also. ("4 point
light 10W" only)
Serial interface COM: (1) COM port number (e.g.
COM1 if you use the standard COM port of your
computer). If your computer does not have any COM
port, you have to install a COM port, e.g. using an
USB-to-serial-converter before.
(2) COM baudrate. Be sure to set the correct
baudrate directly in the device menu also ("4 point
light 10W" only).
Electrode switch boxes: "single channel" =
standard switch boxes mounted on a cable and
connected to the electrodes directly. "multi channel"
= combined switch boxes using 16 channels for 16
electrodes. Be sure to make the correct setting.
Single channel swich boxes will not work using the
"multi channel" setting.
Suggestion for a communication test: Connect the
device with the computer. Prepare the Device like
this: (1) Switch on the device by pressing the "RET"
and the "7" button on the device keyboard. (2) only
for device "4 point light 10W: set the correct
frequency setting and the correct baudrate using the menu of the device. (3) Switch to the remote mode
("RMT") by using the arrow keys. Press again "RET". If the correct COM port and COM baudrate is set,
you should be able to communicate with the device. You can test the communication this way: Go to the
GeoTest main menu → Device → Measuring device. Click → Initialize form. If no error message appears,
and the firmeware version is displayed, all is OK.
GeoTest user manual ● page 7 of 41
2.2.2
GeoSys
Future versions of GeoTest will support GeoSys hardware (GeoSys Leipzig, Germany).
2.3
GPS Device
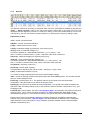
GeoTest supports position measurements done by a GPS device connected to one of the serial data
ports of the computer. The GPS device must be able to send one of the "NMEA-0183" protocols GGA,
GLL, RMC or LLQ. Example of a NMEA-0183 GGA sentence data line:
char position:
1
2
3
4
5
6
7
8
1234567890123456789012345678901234567890123456789012345678901234567890123456789012
string:
$GPGGA,121357.00,5226.316328,N,01300.878187,E,2,07,1.1,35.59,M,45.19,M,5.2,0100*75
pos.
8
18
30
32
45
47
49
52
56
62
64
70
72
76
contents
UTC of position fix in HHMMSS.SS format
Latitude in DD MM,MMMM format(0-7decimal places)
Direction of latitude N or S
Longitude in DDD MM,MMMM format(0-7decimal places)
Direction of longitude E or W
GPS Quality indicator; O= fix not valid; 1=GPS fix; 2=DGPS fix
Number of SVs in use, 00-12
HDOP
Antenna hight, MSL reference
M indicates that the altitude is in meters
Geoidal separation
M indicates that the geoidal separation is in meters
Age of differential GPS data record, Type 1. Null when DGPS not used
Base station ID, 0000-1023
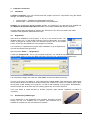
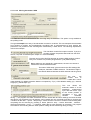
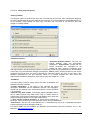
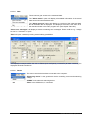
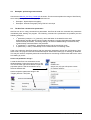
How to configure the GPS computer
interface:
Go to the GeoTest main menu →Device
→GPS.
Use GPS: GPS position data are recorded and
displayed in the main form too. See chapter
4.1.1.2.2.4.
Serial setup: Set the correct COM port
parameters (port number, baudrate). If your
computer does not have any COM port or no
free COM port, you have to install a COM port,
e.g. an USB-to-serial-converter before.
NMEA sentence: GGA, GLL and RMC contain
position data in terms of latitude and longitude.
GGA contains additionally elevation data. LLQ
is a format containing position and elevation
data in meters.
System time: The computer system time may
be synchronized with the GPS time, which is
UTC = Universal Time Coordinated. The
Windows time zone information is used for
synchronization.
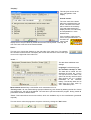
Reading: the actual position, elevation and
time data is displayed. Latitude and longitude are displayed in the original NMEA data format, which is not
a decimal data format: "ddmm.m". The displayed example for latitude means: 4840.8625 = 48 degrees
40.8625 minutes. GeoTest converts this format into degrees with decimal fractions (example = 48.68104
degrees). The timeout value is used for the timeout error handling. Using a GPS device, the GeoTest
data format is slightly changed (longitude and latitude in degrees instead of X and Y in meters). See
chapter 4.1.3 for information about the used data format.
Suggestion for a communication test: Connect the GPS device with the computer. Switch on the
device and set the correct COM and NMEA values. Let the GPS device send data continuously to the
serial data port. If the correct COM parameters are set, you should see the continously updated positions
in the box "Reading".
GeoTest user manual ● page 8 of 41
3
Installation of GeoTest
3.1
Installation
Complete installation: The user should install the program and all its components using the default
settings. The default settings are:
program folder = <Windows ProgramFilesDir>\GeoTest
manual folder = <Windows ProgramFilesDir>\GeoTest\Manual
Updating: For updating the already installed program, it is sufficient to copy the files to be updated into
the <Windows ProgramFilesDir>\GeoTest folder. The already installed files will be overwritten.
The last settings will automatically be saved in the "GeoTest.ini" file, which is located in the folder:
<Windows user application data folder\GeoTest>.
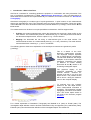
3.2
Registration
After the first installation of the program, it will run in the limited modus. The
limitation refers to e.g. to the limited maximum amount of electrodes. This limited
modus is thought as a demo modus for interested people. Due to this limited
modus, a free copy and distribution of the program is prevented.
It is necessary to registrate the program after installation to get a legal licence.
The user should follow this procedure:
Open the menu "Extra" → "Registration"
Locate the "Computer ID". This is your computer fingerprint. You should tell me this number. You could
use the "eMail" button to open your eMail client and to send me your computer ID by eMail directly.
I will calculate the "Key" and create the "User name" and will sent these to the user.
The user must type in the "Key" (or copy-paste) and the "User name". After pressing the "OK" button
the key will be saved in the INI file (if the key matches the computer ID). There is no need to type in again
the key after a later starting of the program, nor after a later updating of the program. Nevertheless, I
recommend the user to save this key in a hardcopy paper form for an own reference.
If the user wants to install GeoTest on another computer, again another registration procedure is
necessary.
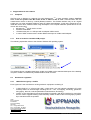
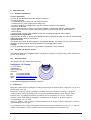
3.3
Hardware key (USB dongle)
As an alternative to the registration and unlocking procedure (chapter
before), the use of a hardware key is optional. The hardware key is
available on request from the manufacturer of GeoTest.
GeoTest user manual ● page 9 of 41
4
Using of GeoTest
The program GeoTest can be used in a normal way by double-left-clicking on the GeoTest
icon on the computer desktop. The main form, described in the following chapter 4.1, will
appear. Alternatively, the user may start GeoTest using the command line options
described in chapter 4.3.
4.1
The main form
Main menu
Pseudo
sections
Electrode
switch box
Frequency
settings
Transmitter
Receiver
Measurement
status
Battery
power
Data
Display of battery status
list
By clicking on the
"mV" label,
user
(depending
on the type
of hardware
used):
can switch between
displaying
of
geoelectrical
single voltage or-voltage
list. device
- external 12 V battery
- notebook
GeoTest user manual ● page 10 of 41
4.1.1
4.1.1.1
The main menu
File
"New": a new data file will be designed. All currently measured data will be
deleted and electrode and profile settings, if set already, have to be set again.
"Read": a previously measured data file will be read and displayed.
"Save": the current data file will be saved using the GeoTest data format
(ascii file with the extension *.tx0). All electrode and cable parameters,
settings, measured contact resistances, error messages and measured data
are saved. The saved data format is explained in the "Data list" chapter.
"Read backup file": This feature restores formerly saved backup data. The
backup data will be saved automatically in certain time intervals (e.g. 1 min)
and additionally after completing the measurement. The backup saving
properties are set in the "Set - options" menue (see chapter 4.1.1.2.4 Setup
program options - more). Restoring backup data may be very useful to save
measured data after a e.g. computer shut down due to low battery. This
option is disabled, when automatic backup in the "Set - options" menue is
disabled.
"Read multiple data files and combine": This option allows to read multiple
data files. These files will be combined to one single data file. This option is
especially useful in:
(a) combining data files of a "roll-on" measurement project
or (b) combining data files, which were measured on the same profile using
different electrode configurations (e.g. Wenner plus Dipole-Dipole).
"Save in 'Res1D' format": data is saved using the data format of the 'Res1D'
geoelectric inversion program (by 'GeoTomo software', M. H. Loke, Malaysia,
www.geoelectrical.com). This is a 1 D inversion software for evaluation of
Schlumberger or Wenner soundings.
"Save in 'Res2DInv' format": data is saved using the data format of the
'Res2DInv' geoelectric inversion program (by 'GeoTomo software', M. H.
Loke, Malaysia, www.geoelectrical.com). This is a 2 D inversion software for
evaluation of profile measurements of resistivities (done along 1 profile
direction).
"Save in 'Res3DInv format": data is saved using the data format of 'Res3DInv' geoelectric inversion program. (by
'GeoTomo software', M. H. Loke, Malaysia, www.geoelectrical.com). This is a 3 D inversion software for geoelectrioc
measurements done using 2 directional x-y-grids.
"Save in 'SensInv2D' format": This format is used by the 'SensInv2D' program of Geotomography, Dr. Th. Fechner,
Germany (www.geotomographie.de). This is a 2 D inversion software for evaluation of profile measurements of
resistivities (done along 1 profile direction).
"Save in 'ResistivityImager2D' format": This format is used by the 'ResistivityImager2D' program of Geotomography, Dr. Th. Fechner, Germany (www.geotomographie.de). This is also a 2 D inversion software for evaluation of
profile measurements of resistivities (done along 1 profile direction) and is the successor of 'SensInv2D'.
"Save in 'DC2dInvRes' format": This format is used by the 2 D inversion software 'DC2dInvRes' of Thomas Günther
(www.resistivity.net).
"Save in 'DC2dTree' format": This format is used by the 2 D inversion software 'DC2dTree' of Thomas Günther and
Carsten Rücker (www.resistivity.net). This software enables the reconstruction of resistivity on cylinder geometry
(trees, borehole cores, subsoil probes) from impedance measurements.
"Save in 'DC3dInvRes' format": This format is used by the 3 D inversion software 'DC2dInvRes' of Thomas Günther
(www.resistivity.net).
"Save in 'EarthImager' format: This format is used by the EarthImager 2D and 3D inversion software of Advanced
Geosciences Inc., USA (www.agiusa.com). Two files will be saved: a *.URF file contains the measured data and a
*.TRN file ("terrain file") contains the topography information.
"Save in 'CSV TXT format': This is a simple CSV = "comma separated values" ascii text file. This file could be used
for user made correlations e.g. by Excel.
"Read measured data from device": data measured in the autonomous mode (MON, TOM) of the geoelectrical
device (without controlling by a computer) will be read from the device, transfered into the GeoTest data format and
displayed.
"Save parameter set to device": A list of currently set parameters (electrode configurations and measurement
settings) will be transferred into the geoelectrical device. Afterwards, the device can measure tomography data in an
autonomous mode, using this parameter set , without any computer for controlling the measurement.
These 2 device options are enabled only when using the "4 Point Light 10W" geoelectrical device.
respective hardware manual for more details.
See the
"Exit program": the program GeoTest will be closed. If there is unsaved data, the user will be asked to save before
closing the program.
GeoTest user manual ● page 11 of 41
4.1.1.2
4.1.1.2.1
Set
Setup cables and electrode chains
Electrode chains (electrode address #) means chains (or sequences) of active, addressed electrodes
controlled by a bus system (e.g. of the manufacturer LGM, Germany). Each electrode address is unique
and fixed physically to one switch box and one electrode. The addresses may be in increasing or in
decreasing order as well. The user can choose electrode chains by checking the respective check boxes.
The actual electrode numbers of each used cable are shown and can be edited.
Up to 10 cables are possible. The number of cables displayed here depends on the cable setup
settings. If the user wants to use another amount of cables, he has to do the cable setup again. He can
do this by pressing the "Set new user defaults" button. See chapter "0. Gettings started" and "Step 2.3 set cable configuration".
Electrodes used (transformed #): After clicking "Set", GeoTest will calculate a
series of electrode numbers from the active addresses. The amount of active
electrodes is displayed in "Electrodes". The electrode numbers will start with the number given in "1st"
(editable) and will end with the number written in "last".
Profiling
Electrodes constants: The editable yellow boxes characterize the very 1 st electrode in the profile. It is
the number of the start electrode, the position of the start electrode corresponding to the profile and the
electrode separation between two adjacent electrodes (all electrodes are equidistant). These values
remain constant even during a "Roll-on" measurement. Start and Stop
display the profile position of the 1 st active electrode and the last active
electrode. By clicking the Roll on button, the cable sequence will be
changed in that way, that the first cable will be placed after the last cable. GeoTest will re-calculate the
profile electrode numbers. See the document Manual_GeoTest_Tutorial.pdf for an explanation of the rollon procedure. If the actual measurement mode is "Mapping", the box "Profiling" will be disabled.
Defaults
The defaults values are: the electrode chains (active or not, adresses) and the electrode constants
(yellow fields). The button "set new user defaults" will aks for new settings as the new default values.
"Reset" will use the default values as the new actual settings.
Example: In the above example, 3 chains are used (chain 1,3 and 5) with the corresponding addresses: 1..20 +
41..60 + 81..100. These are 60 adresses. GeoTest will use 60 profile electrodes. The number of the 1 st electrode is
given to 100, therefore the profile electrodes will cover the range from 100 to 159. The 1 st profile electrode 100
corresponds to electrode address 1. The last profile electrode 159 corresponds to electrode address 100. The
electrode separation is set to 5 m. The start electrode is the number 1 at profile position 1 * 5 m = 5 m. The 1 st profile
electrode is located at 100 * 5 m = 500 m. The last profile electrode is located at 159 * 5 m = 795 m.
GeoTest user manual ● page 12 of 41
4.1.1.2.2
4.1.1.2.2.1
Setup electrodes and data header
Data header
"Data header": The data name will be used as default for the data file name. Some additional comment
can be given to describe the measurement.
"Data folder": The default values for the disk drive and path (data folder), where data files will be stored.
The user may give another folder or file name during saving.
4.1.1.2.2.2
Profiling
This tab sheet gives access to all settings which are necessary for profiling measurements. A profile is a
linear sequence of electrodes situated along the Earth surface. All electrodes have to be equidistant.
An example: a sequence of 50 electrodes in 5 m separation gives a profile length of 250 m - 5 m = 245 m.
If the 1st electrode is situated at 5 m profile distance, the total profile distances will range from 5 m to 250
m. By default, the profile direction is defined as the X- direction. Y is perpendicular to the profile and Z is
the vertical coordinate.
GeoTest user manual ● page 13 of 41
"Electrodes"
"Electrodes constants": These parameters allways will remain constant, even applying "roll-on"
technique. The number and position of the start electrode and also the electrode separation will not be
changed during using the roll-on technique. The electrode separation gives the distance between two
adjacent electrodes. The Checkbox "equidistant" explains, if all the electrodes have the same separation
or not. Standard profile measurements are equidistant, custom made lists may not.
"Actual measurement": The actual 1st and last electrodes are set. Attention: The program uses
ascenting numbers of electrodes, even if the sequence of electrodes in the used electrode chains is not.
Example: 2 chains are used. Chain 1 contains electrodes 26 to 50. Chain 2 contains electrodes 1 to 25.
The program calculates 50 electrodes from 1 to 50. Electrode number 1 will be the original address 26.
Electrode number 50 will be the original address 25. If "Use roll on technique" is
checked, the number of the 1st "new" electrode will be read. See chapters
"Setup cables and electrode chains" and "Example 2: Wenner tomography
using Roll-on technique" in the extra document Manual_GeoTest_Tutorial.pdf
for detailed explanations.
"Configuration"
"Type": The type of measurement configuration (electrode configuration)
is set. See the sketch on the next side for an explanation of the most
common configurations. Some configurations use "far" or "remote"
electrodes. A remote electrode is not part of the addressed electrode
chain. It is connected directly to the respective terminal of the earth
resistivity meter. Ideally, the distance of the remote electrodes should be
10 times the maximum electrode spread used. In case of "Pole-Dipole" or
"Wenner half" configurations, the current emitting electrode "B" is the
remote electrode. In case of "pole-pole" configuration, the current electrode
"B" and also the potential electrode "N" must
be remote. In case of "SP" (self potential measurements) only the voltage
electrodes M and N are used, where the electrode N may be remote,
depending on the settings. The "Gradient" array also used 2 voltage field
electrodes (M and N) and supplies current using 2 remote electrodes A and B. The edit fields below show
a sketch of the electrode configuration. The white field shows the used electrodes, the blue field shows
the "remote" or "far" electrode(s). See the Pole-Dipole (= half Schlumberger) example left. The option
"[custom made]" gives access to user created electrode configurations. See the respective chapter
following.
Remark: SP (self potential) measurements require the use of unpolarizable electrodes. SP
measurements will not work with standard steel electrodes.
Remark: Gradient measurements with remote A and B electrodes give no resistivity values, if the
remote electrodes are assumed to be infinitely far away. In this case, no geometry factor K is
possible. GeoTest is able to calculate resistivities when using the exact positions of the remote
electrodes.
"Spreads to be used": This box is active only if the Dipole-Dipole or
Schlumberger configuration is chosen. The spread is the length of the
electrode array from the first to the last electrode along the profile. The
spread depends on the actual settings of the dipole separations and the
dipole lengths. The program increases the spread by increasing dipole
separation and dipole length simultanously in different ways:
only increasing spreads are used (=spreads which are longer than the previous used spreads).
This is the standard option.
all possible spreads are used (= all dipole separation und length combinations). This option may
result in doubled data point.
all spreads which differ by at least 1 electrode distance.
all spreads which differ by at least 2 electrode distances.
"Spread direction": Three options are available. In case of the Wenner
configuration, the "normal" option means AMNB, "reverse" means BNMA
GeoTest user manual ● page 14 of 41
and "both" means the combination of normal and inverse AMNB + BNMA. The latter results in doubling of
the data amount.
"Dipole length, Levels" means the separation between the potential electrodes M and N and/or the
current electrodes A and B in units of electrode numbers. In the Wenner case, this separation is
commonly named "level". The dipole length equals "a" in the following figure.
"Dipole separation" means the separation of the current emitting dipole (A-B) or the nearest current
electrode (A or B) and the potential measuring dipole (M-N) in units of integer multiples of the dipole
length. The dipole separation equals "n" in the following figure.
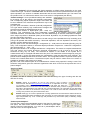
in GeoTest:
Some Examples of dipole separation and dipole length (or level):
A=1, B=3, N=7, M=9.
This is a Dipole-Dipole configuration.
The dipole length is (B-A) = (M-N) = 2.
The dipole separation is (N-B) / (dipole length) = 4 / 2 = 2.
A=1, M=3, N=5, B=7.
This is a Wenner configuration.
In the Wenner case, the dipole length is commonly named as "level".
The level = (M-A) = (N-M) = (B-N) = 2.
The value of dipole separation is (M-A) / level = 2 / 2 = 1.
In the Wenner case, the dipole separation is always = 1.
A=1, M=7, N=9, N=15.
This is a Schlumberger configuration.
The dipole length is (N-M) = 2.
The dipole separation is (M-A) / (dipole length) = 6 / 2 = 3.
GeoTest user manual ● page 15 of 41
The button "Defaults" will reset levels and dipole separation to default values, depending on the used
measurement type. The button "Calculate max" will calculate the maximum possible level from the given
dipole separation, the number of available electrodes and the used measurement type. The button with
the question mark "?" will show the sketch of the most common configurations (see above).
"Default settings": Some pre-defined settings are available.
By choosing one of the options, the electrode configuration
and corresponding dipole separation lengths and levels will
be set to defaults. The measurement parameters may be set
1
to defaults too.
2
(1) This option will define a Wenner (A.M.N.B) configuration.
3
4
This type allows relatively high measurement voltages and
5
will give good results in disturbed areas as well.
6
(2) This option defines a dipole-dipole (A.B......N.M) configuration. This configuration has some advantages compared to the Wenner configuration: better
horizontal resolution, increased data amount. The main disadvantage is reduced measurement voltages,
which maybe a problem in disturbed (urban) environments. By default, only increasing spreads are used
(see box "Spreads to be used").
(3) This option means the same as the above, but with using of more spreads than only increasing ones
(using of all spreads which differ at least by 1 electrode separation, see box "Spreads to be used"). This
results in a higher data amount as above.
(4) This option is the "half Schlumberger" configuration (A.....M.N) with one electrode (B) being very far
away. This configuration allows an increased depth penetration compared to 4 electrode configurations
(like Schlumberger A......M.N......B).
(5) This option results in an "averaged half Wenner" configuration. This means 2 complete measurement
runs with normal and inverse directions: electrode configurations A...M...N and N...M...A with the
electrode B being very far away. The electrode M remains in the middle of the spread and 2
measurements will be averaged and attached to this point. The resistivities will be averaged by using the
geometric mean [√ (a*b)], the phase angles are calculated by using the arithmetic mean [(a+b)/2]. The
pseudo sections displayed will show the mean values. This configuration delivers a pseudo section quite
similar to the inverted data section. Therefore this option may be useful in cases where no inversion is
available or wishable. See Hennig et al. (2005).
(6) This is the most suitable option for IP measurements. Wenner using special IP sorting is used. This
electrode configuration gives the maximum signal/noise ratio which is best for the expected low out-ofphase voltages.
"Sorting of data"
By default, the data is sorted by data number. The user can change the type of sorting and also the
direction of sorting.
Remark: Sorting by increasing "A" can be very useful in case of Roll-On
measurements. See the Manual_GeoTest_Tutorial.pdf for an explanation of the rollon procedure. Using this type of sorting, a message will apear just below the
electrode switch box as soon as the first used cable (or electrode chain) could be un-plugged. The user is
then able to dis-assemble the first cable with the connected electrodes. He could plant the new electrodes
using the free cable as the extension of the profile. This could be done while the measurement is still
running. This procedure may save measurement time.
Remark: Sorting by "IP" means a special kind of sorting optimized for IP measurements. Electrodes are not
used as potential electrodes immediately after using them as current electrodes. During applying of current,
high self potentials may occur. These high self potentials may reduce data quality of following voltage
measurements.
"Reduce pseudodepths"
The user may confine the pseudodepth values of the data. By checking of
this option, the data will be reduced inside or outside the given depth
interval. Example: Data between 10 m and 20 m pseudodepths will be
reduced to 40 % of the original amount.
GeoTest user manual ● page 16 of 41
4.1.1.2.2.3
Mapping
This tab sheet controls mapping measurements. The electrodes are situated along a 2-dimensional grid
on the Earth surface. The grid can be a regular and rectangular grid with given X- and Y- spacings and Xand Y- grid sizes. The grid can also be a part of a regular grid (e.g. U-shaped) or can be a circular grid.
"Electrode position (X-Y-Grid)"
This box controls the setup of the measurement grid. The yellow fields within the box " Start electrode
[1,1]" control the coordinates of the starting electrode. The grid sizes and also the spacings are given for
X- and Y- direction separately.
The box "Electrode positions" gives access to the type of the measurement grid.
"Regular loops" and "Regular zig-zag" describe a regular and rectangular grid of electrode positions.
The grid sizes and spacings for the X- and for the Y- direction are given. The examples show a grid of the
dimensions 7 x 7 electrodes, X grid index between 1 and 7, Y grid index between 1 and 7. Starting
electrode[1,1] is located at [1m, 1m]. Last electrode[7,7] is located at [7m, 7 m].
"Regular loops"
"Regular zig-zag"
Last electrode at [7,7]
Start electrode at [1,1]
GeoTest user manual ● page 17 of 41
"Rectangle"
"U-shaped"
"L-shaped"
"Circle"
"From electrodes table": This option reads the electrodes positions from the list in the "electrodes
position" tab.This option may be useful for the setup of a custom made or not regular electrode grid.
Remark: The 3D inversion program Res3DInv does not support all electrode configurations,
which are possible in GeoTest.
Configuration
"Type" selects the electrode configuration type. Pole-Pole uses 2 field electrodes (A and
M) and additionally 2 "remote" electrodes (N and B). The actual positions of the "remote"
electrodes can be given in the tab sheet "Remote electrode positions". If the coordinates are
known, the exact geometric factors can be calculated (see "Program options"). Wenner
(alpha) and Wenner (beta) are linear configurations which are used in profiling
measurements also. Square uses 4 field electrodes in square configuration. Gradient uses
2 field potential electrodes (M and N) and 2 remote current electrodes (A and B). This
setting allows the computation of resistivities only for the case that the exact geometric Kfactors can be calculated from the known positions of the remote A and B electrodes. SP
Self Potential uses only 1 field electrode (M) for measuring the intrinsic voltage, without
applying any current to the ground. [Custom made] gives access to self made electrode
lists (see the respective chapter following).
"Spreads to be used": The direction of the field electrode array is given. The array
can spread in X-, Y- or diagonal direction as well. The
option "all" calculates all available spreads.
"Dipole lengths, Levels": This controls the distances
within the electrode array.
"Reset": This buttons resets all changes to factory default
settings. After pressing the "Set" button, two actions will take
place in sequence: (a) the grid will be calculated and (b) all
electrode configurations will be computed and the pseudo section will be set to blank values.
GeoTest user manual ● page 18 of 41
4.1.1.2.2.4
Moving electrodes / GPS
This tabsheet controls measurements with a moving array of electrodes. This option is only available in
the profiling mode.
The typical example is an array of 20 electrodes mounted on a vehicle. This car transports the electrodes
from position to position and Schlumberger soundings with 9 measurements at each position are
performed. The positions of the soundings are measured by a GPS device. The following explanations
refer to this example.
This checkbox controls if this option is active. If yes, the
program will save the position data read from the GPS
device, not profile coordinates (see chapter 4.1.3 fo more details).
The user can force the GeoTest program to measure GPS positions continuously or to measure one position per geoelectric cycle (default option).
Before starting a new geoelectric measurement, the user can choose to
measure the contact resistances also.
The button "GPS setup" gives access to the GPS settings like
COM port, baudrate or NMEA sentence. The antenna height is
the vertical distance between the GPS antenna and the ground.
The user
can
choose
how
to
handle the z coordinates (altitude). By default, elavation data are computed by: Z (m) = GPS altitude reading (m) - antenna
height (m) - pseudo deph (m).
This
box
allows
the
automatic restart of a new
geoelectric
measurement
cycle after the former cycle
at the former position is
completed. If the user
chooses
"automatic
saving...", the program will create a filename from the actual data and time readings and save the data
into this file. All soundings from all positions can be saved into one combined single file by choosing the
"combine all data files .." option. "Stop and go" means that the user has to restart a new sounding after
completing the old sounding by pressing a button (ideal for stop - connect electrodes - measure disconnect electrodes - move - ..). "Continue" means that no user interaction is necessary. The program
will measure one sounding after the other (ideal for rolling devices measuring during moving).
GeoTest user manual ● page 19 of 41
4.1.1.2.2.5
Electrodes positions
This tab sheet displays the 3-dimensional coordinates of all used field electrodes. In case of profiling
measurements, these are the equidistant profile electrodes, in case of mapping measurements, these are
the electrodes situated in the grid nodes. The remote electrodes, if there are any, are displayed in the
next tab sheet named "Remote electrode positions".
The coordinate system is the same for profile electrodes, grid electrodes and remote electrodes.
The units are meters (can be e.g. Gauss-Krüger coordinates). By default, the X-direction is the
direction of the profile. The Y-direction will run perpendicular to the "left" of the profile and the zdirection is positive upwards. That means depths below the earth surface will get negative values.
The electrode coordinates table
The table gives the electrode number and the respective X, Y and Z coordinates. The above shown
example displays the electrode positions of a profile line. The line expands in positive x direction and
reaches from 1 m (1st electrode) to 49 m (last electrode). The y coordinates are perpendicular to the
profile direction and are all zero. The z coordinates display the elevation of each electrode and are all
zero too.
The column "type" gives access to more
information about the type of electrodes. Locked
electrodes are indicated by "X" and borehole
electrodes are indicated by "Bx" with x= number of
borehole.
Locked electrodes
A "x" or "X" written in the "type" column will force
the program not to use the respective electrode
(locked electrode). This option may be useful to
exclude electrodes with poor ground contact.
The user may choose to lock all electrodes with odd
or even numbers to reduce the amount of data to
be masured. See the example.
GeoTest user manual ● page 20 of 41
.
Borehole electrodes
The "type" column serves also as an indicator for
borehole electrodes. Electrodes of the 1 st borehole are
indicated by "B1", for the 2nd borehole by "B2" and so
on. See the example displaying electrodes # 12 to # 20
as borehole electrodes. These electrodes have the
same x coordinate but different z coordinates.
This button will open an additional form displaying all electrode coordinates.
This form can be used for "drag and drop" information from e.g. an Excel
spreadsheet.
This button saves the electrode coordinates displayed in the data list. The user
may edit the electrode position table by himself (e.g. in case of custom made
electrode grids or by giving elevations to each electrode position). After doing this,
the user has to press this button to make the changes active.
The "Start electrode" box
These yellow boxes display the start electrode coordinates. During profiling, the start electrode is the 1 st
electrode in the profile, during mapping, this is the electrode situated at the 1 st grid node [1,1].
The "Profiling" box
This box is enabled in the profiling mode only. The box "End electrode" displays the coordinates of the
last electrode used in this electrode setup.
By checking this option, the program will automatically compute the
electrode positions from an equidistant grid beginning at the start
electrode. The user can choose the direction of the profile within the x-y-z coordinate system.
The options "+x", "-x", "+y" and "-y" will calculate all electrode positions (including the last
electrode position) from the 1st electrode position, profile direction and electrode separation.
The option "-> last" will calculate the electrode positions as well as the electrode separation from
the 1st and last electrode positions.
The electrode positions table will automatically be updated after clicking the "Set" button after choosing
profiling or mapping parameters.
GeoTest user manual ● page 21 of 41
4.1.1.2.2.6
Remote electrode positions
This tab sheet displays information about the remote electrodes. Remote electrodes are situated far away
from the profile or the measurement grid. Some of the electrode configurations, like Pole-Pole, use
remote electrodes, some others, like Wenner, do not.
"A", "B", "M" and "N" display the positions of the remote electrodes and indicate if these electrodes are
used as remote electrodes. Remote electrodes are not part of a profile or a 2-D-grid. Usually, these
remote electrodes are connected directly to the geoelectric hardware device.
The above example shows B and N as remote electrodes of a Pole-Pole configuration. B is situated at
profile position 10 m, with a distance of 1000 m perpendicular to the profile. The far electrode N is also
1000 m away from the profile, but in opposite direction.
"Calculate geometric factors": The user can choose between exact and approximate calculations.
Approximate means that the remote electrodes are considered to be infinitely far away.
Exact means, that the real positions of the remote electrodes are used to calculate the geometric
factor. In case of "Gradient" measurements (M and N within the grid, A and B remote), a
resistivity value can only be calculated using the "exact geometric factor" option.
If remote electrodes are used without setting of the positions, only approximate calculations are possible.
If no remote electrodes are used, exact and approximate calculations will give the same results. This can
also be set in the "Program options" menu, see chapter 4.1.1.2.4.
"Save": This button allows to edit and save the remote electrode data. The program will re-calculate
geometry factors und resistivities. Other profile or mapping parameters will not be updated.
GeoTest user manual ● page 22 of 41
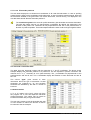
4.1.1.2.2.7
Custom made electrode configurations
The user is able to customize the electrode configurations by himself.
The access to custom made electrode configurations is possible from the
"profiling" or the "mapping" mode as well.
After choosing "[ Custom made ]" and
pressing "Set" a new window appears. This
window allows the setting of A, B, M and N
electrode numbers by the user. This example
shows some Schlumberger sounding with
potential electrodes M=10 and N=11. The
user has extended the sounding
configurations by adding values for M=8 and
N=13.
Pressing "Set" will take the configurations for
the current measurement file. The respective
electrode positions (X, Y and Z coordinates)
remain unchanged. The user may change
these positions refering to the "4.1.1.2.2.5
Electrodes positions" chapter.
By pressing "Read" a measurement file (option: program data)
will be read and the electrode numbers will be extracted.
Alternatively a file containing only a list of A B M N values
(option: A B M N list) can be read also.
"Save" will save the electrode configurations into a measurement file (option: program data) or into a
data list (option: A B M N list).
4.1.1.2.2.8
Setting electrodes and data header
"Reset": This buttons resets all changes to factory default settings.
"Read settings from file" allows to read settings from a previously
stored data file. This data file serves as a template for the desired
settings.
"Set" will accept all changes. Please be sure to press this button to accept all
changes made.
GeoTest user manual ● page 23 of 41
4.1.1.2.3
Setup measurement parameters
"How to control current":
Option 1 = The measered voltage will be forced to be between the min and max values given by "Voltage
U limits (mV)". This is done by adjusting the current.
Option 2 = The maximum possible current is used. The maximum current depends on the setting for
"Current (mA) - max" and the measured contact resistances.
"Sequence":
Option 1 = do 1 measurement, check the measured voltage, control the current (if necessary) until the
voltage is OK. Then complete the next measurements for one averaging.
Option 2 = do all measurements for one averaging, check the average voltage to be within the min and
max limits and control the current. The option 2 is recommended in disturbed areas with very noisy data.
"Voltage used for controlling":
U = the in-phase (ohmic) part of the complex voltage is used. This is the default option.
U90 = the out-of-phase part of the complex voltage is used. This option may be useful for measuring high
qualitative IP data.
"Voltage U/U90 limits (mV)":
The min and max values of measured voltages. Depending on the user settings in "Voltage used for
controlling", either the in-phase (ohmic) or the out-of-phase part of voltage is used for controlling. This box
is only enabled, if the "How to control current" option 1 is active.
"Measurements/mean":
This box gives access to all parameters concerning averaging. The measurements are repeated until the
deviations of the readings reach the defined "Limit (%)" or the maximum number of measurements is
reached. Averaging is only done if "n min" > 1. If "n min" = 1, the measurement will be finished just after
the first reading.The averaging will be done until at least one of the two conditions is fulfilled:
GeoTest user manual ● page 24 of 41
- number of readings >= "n max" or
- deviation of readings <= "Limit (%)".
"n min" = minimum number of readings for one averaging.
"n max" = maximum number of readings for one averaging.
"Limit (%)" = maximum allowed deviation of readings. This error is defined as = ABS(standard deviation /
(√n * U_mean)) * 100 with n = number of measurements, U_mean = arithmetic mean of measured
voltage (U or U90).
"Averaging method - measure until ...": This box chooses the type of averaging.
Option 1 = measuring is done, until the error of all readings is less than the given limit.
Option 2 = n min values of the voltage are read and the average is calculated. The next voltage will be
read and the mean of the last n min values is calculated. This averaging is done in a moving manner with
a step of 1 measurement.
Option 3 = same as option 2, but the step of the moving average is the same as the length of the moving
average = n min.
Option 4 = no averaging is done.
"At each ABMN position":
"Reset electrodes": This option depends on the usage of single channel or multi channel switch boxes.
Standard single channel switch boxes will reset the electrodes before setting the electrodes, multi
channel switch boxes will not. See chapter 2.2.1 for an explanation.
"Switch on transmitter": the transmitter will be switched on before each measurement. This option is not
recommended for standard measurements, because the transmitter will be switched on only one time at
starting.
"Switch on booster": The external votlage supply (so called booster) will be switched on before each
measurement. Dpending on the kind of electrodes hardware, the booster could be necessary for cable
length more than 300 m or 500 m. Recommended = checked.
"Measure transmitter voltage": the transmitter output voltage is measured too. The transmitter voltage
gives information about the electrical power, which the transmitter is applying to the ground. This
parameter may be useful for checking the actual contact resistances. Depending on the option set, the
transmitter current step or transmitter voltage is displayed in the "Transmitter" box of the main form. See
chapter 4.1.6. Recommended = checked.
The "n AB max" number gives the maximum number of measurement trials on one measurement
position. This number avoids an uncontroled duration of measurements in a very noisy area. If this
number is exceeded, the measurement will be stopped and stored, even if the error limit is not reached.
"Default settings":
gives access to pre-defined sets of measurement parameters.
Remark: we recommend to use the "standard" settings.
"Current (mA)":
this box controls the measurement current. The "min" and "max" boxes limit the minimum and maximum
currents. Normally, these boxes display the really available minimum and maximum current settings. The
"now" box displays the start setting. "No current: measure self potential (SP)": If this checkbox is active,
no current will be applied during the measurement. Only the self potential is measured. Please note:
proper self potential measurements require the use of unpolarizable electrodes (no steel electrodes). This
option does not work with all hardware versions.
"Frequency (Hz)":
This box can choose between standard measurements with using of one single frequency or frequency
soundings. The one frequency or the multiple frequencies are set.
Measurement device "4 point light hp". The user should take care of the correct frequency setting. Users
in Europe: We recommend to use 1.04 Hz, 2.08 Hz, 4.16 Hz or 8.33 Hz (these settings give maximum
suppression of the 50 Hz mains frequency as well as the 16.7 Hz railway frequency). Users in the United
States: We recommend to use 1.25 Hz, 2.5 Hz, 5.0 Hz or 10.0 Hz (due to 60 Hz mains frequency).
Measurement device "4 point light 10W". This device is pre-set to one of two frequency sets. One set is
suitable for measurements in Europe, the other set is suitable for measurements in USA. Please notice: The
device frequency presetting (within the device menu) must be the same as the frequencies displayed in the
GeoTest software. See chapter 2.2.1. for details.
The "Set" button will accept all settings. It is necessary to press this button,
otherwise the settings will not be accepted.
GeoTest user manual ● page 25 of 41
4.1.1.2.4
Setup program options
"Getting started"
This program option is useful for the user who runs GeoTest the first time. After choosing the language
the user is guided through the main settings of the program. It is recommended to set all defaults from (1)
to (5). Normally, these settings are done only once when the user starts to use GeoTest. See also
chapter "0. Getting started".
"Geometric factors"
"Calculate geometric factors": The user can
choose between exact and approximate
calculations. "Approximate" means that the
remote electrodes are considered to be
infinitely far away. Using the "Gradient" array
and "approximate" remote electrode positions, no geometry factors and no resistivities can be calculated.
In this case, only the measured voltages are displayed. "Exact" means, that the positions of the remote
electrodes are known and are used to calculate the geometric factors. By using of this option, also
Gradient measurements can give resistivity values. If no remote elctrodes are used, exact and
approximate calculations will give the same results. See also chapter 4.1.1.2.2.5.
"ResXDInv"
This menu gives access to saving options for users of Res2DInv and
Res3DInv inversion software.
"Include topography": if this option is set, GeoTest will export
topography information into the ResXDinv data file. The topography
results from the settings in the "Electrode positions" section (elevation
= Z coordinate).
"General array data format": This setting exports ResXDinv data in
the so called "general array" data format. This is a useful option for
mixed arrays, that means measurements with different array types like
Wenner and Dipole-Dipole in one single measurement.
If "Save remote electrode positions" is clicked, these positions are
saved too. This is useful only if exact geometric factors are used additionally.
"Data format": The user can choose between rho = resistivities only or rho+phi = resistivities and phase
angles to be saved into the ResXDinv data file.
For further details see the Res2DInv and Res3DInv documentation ('GeoTomo software', M. H. Loke,
Malaysia, www.geoelectrical.com).
GeoTest user manual ● page 26 of 41
"Display"
This tab gives access to the
user changeables of the
display.
Pseudo section
The color scale of the boxes
within the pseudosections can
be set. The same color scale
will be used for the resistivity
(rho) and phase angle (phi)
display as well. The colors may
be interpolated for a more
detailed view.
If the checkbox "while mouse
moves over pseudosection.." is
checked, the
program will
display the rho and phi values by a label hint near the mouse pointer. This way, the
user can have a first look at the measured data.
Show ...
The user may choose the displays on the right side of the main form. For example,
the checkbox "Date and time" will display the current date and time at the lower right
corner on the right side of the main form.
"more ..."
This tab allows additional user
settings.
Language: Prefered language.
Do automatic backup of data:
The data will be saved into the
displayed file within the <Windows
user application\GeoTest> folder. This
option can be very useful to avoid
data missing due to a sudden
breakdown of the notebook
battery. The backup data can be
read using the main menu by
"File - read backup file".
Measurement sound: Play a sound after each measurement or not.
"Factory reset": All user made settings (except software key) are cleared by deleting the INI file. If there
is a software key, this will not be deleted. The user has to quit and restart the program. During restart all
parameters are set to default values.
"Test": This button allows some test routines, which are available only for the manufacturer (password
required).
The user has to make the programm accept his choices by clicking the "Set" button.
GeoTest user manual ● page 27 of 41
4.1.1.3
4.1.1.3.1
Measure
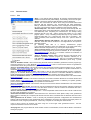
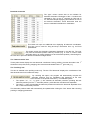
Measure contact resistances
This form controls the measurement of contact resistances. The contact resistance is the resistance (=
impedance, measured in Ohm = Ω) between one electrode and ground. Although the measurements are
done by pairs of electrodes, the contact resistance of each measured electrode is calculated and shown
against the respective electrode number. For comparison, the respective electrode address is shown too.
The lower the contact resistance, the more current can be applied to the ground. High quality geoelectric
measurements need low contact resistances. Optimal contact resistances are < 600 Ω. Nevertheless,
even much higher contact resistances (> 50'000 Ω = 50 kΩ) may give useable geoelectric measurements.
The measured contact resistances are shown as a data list and in a graphics display. The graphics show
also the maximum allowed contact resistance as a horizontal red line (in the example 1 kΩ).
GeoTest user manual ● page 28 of 41
Settings
Electrodes: The numbers of 1st and last electrodes to be measured can be set. By default, these are the
1st and last available electrodes, formerly set in the "Electrodes and data header" (chapter 4.1.1.2.2.1)
menu. The user may choose only a part of the available electrodes.
Calibration: Three electrodes are used for the calibration measurement. By
default, the calibration electrodes are the first three electrodes. The user
may choose onother electrodes for calibration when one of the three
electrodes has bad ground contact or is locked. The 1 st of the calibration
electrode (Ref) is the reference electrode for all following contact resistance
measurements.
Current: The program uses the test current for the measurement cycle. The test current will automatically
be reduced during poor ground contact (high contact resistances) to avoid an overload of the transmitter
output.
Frequency: The test frequency for the mesasurement cycle.
Num: The number of measurements per one averaging.
Maximum contact resistance: The user gives the maximum allowed contact resistance (in the example
1 kΩ).
Measurements
The active A and B electrodes are displayed, as well as the active transmitter voltage
Buttons
"Clear" will clear all displayed values. The table and graphics are
cleared and all measured contact resistances are resetted.
"Show all" will show all measured contact resistance data. This may
be useful after the measurement of only few electrodes.
"min + max" will display a short statistics of measured contact
resistances like to be seen at the right side.
"Reset" will reset all settings to defaults and will reset all measured
contact resistances as well.
"Start ..." will start the measurements (alternativeley pressing the
<RET> key). The button caption will change to "... Stop". Pressing
the button now (alternatively pressing the <RET> or the <ESC> key) will stop the actual measurement.
"Close" will close the form..
Performing of automatic contact resistance measurements
Calibration: Three electrodes are used for a calibration of the measurement procedure. By default, these
are the first 3 electrodes. One of these 3 electrodes will serve further on as the reference electrode. The
calibration procedure results in the known contact resistance of this reference electrode.
Measurement: After the auto calibration, resistances are measured between the reference electrode and a
2nd electrode. The 2nd electrode moves fro the beginning to the end of all available electrodes. The reference
electrode and the 2nd electrode are choosen as current emitting electrodes A and B. The test current is
applied. The transmitter voltage is measured. The contact resistance of the 2 nd electrode computes from the
transmitter voltage devided by the transmitter current minus the known contact resistance of the reference
electrode.
Display: The measured contact resistances are displayed in the data list and in the graphics display. If the
measured contact resistance is less then the maximum allowed value, "OK" will be displayed in the data list.
Re- measuring electrodes
The user is able to re-measure only a part of the available elctrodes
(e.g. after changing the test current) The user may also re-measure
single electrodes (e.g. after improving the ground coupling of this
electrode). The user can do this by a right-mouse-click into the
respective position in the data list or by moving the yellow cursor in
the graphics and a right-mouse-click into the graphics.
Remark: This "contact resistance" option is supported by the LGM geoelectric equipment only.
GeoTest user manual ● page 29 of 41
4.1.1.3.2
Measure start / stop
After pressing "Start ...", ...
... the form "Start and stop #" will appear. This window controls the
minimum and maximum number of measurements, which will be
performed. By default, the minimum and maximum available
numbers are displayed. The user is able to change these numbers,
for example to limit the range of numbers to be measured.
Alternatively, the user may start the measurement by pressing the
<RET> key.
Pressing the "OK" button will start the measurement.
During running of the measurement, the main menu will display:
By pressing "... Stop", the actual measurement will be interrupted. Re-starting of
the measurement will be done by default using the next available, not yet
measured, number.
Alternatively, the measurement can be stopped by pressing the <RET> or the
<ESC> key.
Active GPS option: In case of an active GPS option the user will be
asked to start the GPS position measurement immediately without
asking for start and stop numbers. The GPS measurements will be
stopped by pressing "Stop".
GeoTest user manual ● page 30 of 41
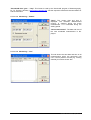
4.1.1.4
Data
These menues give access to the measured data.
The "Show details" option will display all available information of the actual
data set and all measurerd data sets.
The "Show overview" option will display an overview of the measured data.
Not all available data is displayed. The displayed overview is the same as in
the data list window in the main program form (see chapter "Data list").
"Show error messages" will display a window containing error messages. Errors could be e.g. "voltage
too low" or "overload" or "open".
"Edit" will open a window providing several editing possibilities.
The displayed example allows the user to delete (and susequently re-measure) all data containing the
displayed electrode number 85.
4.1.1.5
Device
This menu controls the hardware connected to the computer.
"Measuring device" is the geoelectric device controlling current and measuring
voltage.
"ABMN" is the electrode switching device.
"GPS" is the GPS device, if connected.
GeoTest user manual ● page 31 of 41
4.1.1.6
Extra
4.1.1.6.1
Monitoring
This option allows time dependent measurements along the same profile line. All
current settings (cable, profile and measurement parameters) will be used. The
measurements will be triggered automatically, depending on the system time, and
saving will be done automatically as well. The following forms give access to all
settings.
4.1.1.6.1.1
Monitoring - "Start / stop"
"Start monitoring": Date and time of the 1st
measurement. If "now" is checked, the first
measurement will be done immediately after
pressing the "Start" button.
"Step": The time interval between 2
measurements. The displayed example
shows 1 hour.
"Stop monitoring": Date and time of the last
measurement. If "never" is checked, the
measurements will be continued until the
user presses the "Stop" button.
"measure contact resistances": checking
this option will result in measuring the
electrode contact resistances before starting
each new geoelectric measurement.
"Start" will start the monitoring.
"Stop" will stop the monitoring.
"Defaults" will overwrite the current settings and will reset them to defaults.
"Close" closes this form.
4.1.1.6.1.2
Monitoring - "Save"
The user checks the files he wants to be
saved.
"Program data *.tx0": original data file
including all settings and data.
"Res2DInv data *.dat": Data is saved using
the data format of the 'Res2DInv' geoelectric
inversion program (by 'GeoTomo software',
M.H.Loke, Malaysia, www.geoelectrical. com)
See the respective Res2DInv manual for
further information.
"Res3DInv data *.dat": Data is saved using
the data format of the 'Res3DInv' geoelectric
inversion program (www.geoelectrical.com).
This option is available only for mapping
data. See the respective Res3DInv manual
for further information.
"Measurements per data file": If a value > 1 is set, all the measurements will be saved into one single
data file. See the chapter 'Appendix R : Time-lapse resistivity inversion' in the Res2DInv manual. If
"Delete single *.dat" is checked, all files containing each one measurement will be deleted after
completing. In this case, only the *.dat file(s) containing the multiple measurements will exist. Please
notice: Due to Res2DInv limitations, only resistivities and no phase or IP information are saved.
GeoTest user manual ● page 32 of 41
"SensInv2D data *.gem .. *.imp": This format is used by the 'SensInv2D' program of Geotomography,
Dr. Th. Fechner, Germany (www.geotomographie.de). See the respective SensInv2D documentation for
further information.
4.1.1.6.1.3
Monitoring - "Status"
"Now": The current date and time is
displayed. The checkbox "Measurement
running" is checked during the active
measurement. It is unchecked during the
waiting period.
"Next measurement": The date and time of
the next scheduled measurement is displayed.
4.1.1.6.1.4
Monitoring - "List"
This tab shows the start date and time of all
measurements which are performed until
now. If some problem occured (e.g. missing
data file), this will be shown also.
GeoTest user manual ● page 33 of 41
4.1.1.6.2
Simulation mode
The simulation mode is used to test the
sequence of electrode switchings and
measurements. During running the simulation
mode, all readings and settings are simulated
and not really per formed. This may be a useful
option to test complex measurement arrays.
The simulation mode will open a window to
control the simulated voltages by the user. This
window will always stay on top of the desktop in
order not to forget this modus.
Please pay attention: This simulation mode is not able to
perform real geoelectric measurements.
4.1.1.6.3
Registration
This form controls the registration of the program.
In case of missing registration, the program will run in a limited modus only. in
this limited modus, the maximum amount of electrodes used is limited to 20. The
limited modus is realized to give some interested user the possibility to test the
program in some demo modus.
The registration procedure is described in chapter 3.2. of this manual. After
registration (or usage of a hardware key), the program runs in the free modus
with no limitations. The registration data will be stored on the users computer in
the INI data file.
4.1.1.6.4
Language
The program supports the languages "Deutsch" and "English". Most of the
program captions (boxes, buttons, windows) will immediately switch to the new
language.
4.1.1.7
Help
The "Manual GeoTest" willl display the GeoTest manual as a PDF
document. This document is the same as this document, which you
read now. Depending on the actual language settings, the english
manual or the german Handbuch will be opened.
The "Manual GeoTest - Tutorial" gives some introduction into
performing tomography measurements by using of step-by-step
examples.
The further options (e.g. "Manual 4PointLight hp") will open the
hardware documentation of the connected geoelectric equipment.
"iNet: ..." will launch the default internet browser software and load
the internet website of the programmer of GeoTest.
"FAQ: ..." will launch the internet browser software, load the internet website and jump directly to the
FAQ site concerning the registration procedure.
"eMail: ..." will launch the default eMail client and will automatically create an email which can be sent to
the programmer of GeoTest.
"About .." will display the information about the program, the actual versions and the author.
GeoTest user manual ● page 34 of 41
4.1.2
Pseudo sections
The section which is displayed depends on the actual measurement mode.
4.1.2.1
In case of the profiling mode, a depth section will appear. This is a x- z- slice.
In case of the mapping mode, horizontal x- y- slices are displayed. The (pseudo) depth is
encoded in boxes with different sizes (the smaller, the deeper).
Profiling mode: pseudo-depth sections
The pseudo section displays the measured data as colored boxes. The boxes are situated in some table
type refering to the horizontal and vertical positions of the respective measurement. These sections are
called "pseudo", because the vertical positions of the boxes are - of course - not the real vertical positions
of the respective data point. For getting quasi real vertical positions, some evaluation of data is necessary
(computer inversion modelling).
Depending on the type of hardware and type of performed measurement, the user can switch between
different displays.
"rho (Ohmm)" displays the measured resistivities in [Ohm*m] = [m]. These result from the in-phase
component of the measured voltages.
"phi (mrad)" displays the information from the out-of-phase component of the measured voltages. Phi in
mrad is defined as = U90 [mV} / U [mV] * 1000. This option is not availble for all hardware types.
"U (mV)" displays the measured voltages (U and U90 or self potentials). This option is only available for
some measurement configurations (SP or gradient) and not available for all hardware types.
If frequency dependent measurements are performed, 2 additional options are available:
"rho (f)" displays information about the frequency effect. The
displayed values are calculated by = rho(f 1) / rho(f2).
"phi (f)" displays the out-of-phase frequency effect. The
definition is = phi(f1) - phi(f2).
The user can handle the pseudosections by mouse actions like this:
<left-click>: The data line in the data list (chapter 4.1.3) corresponding to the
respective box is selected. The data is searched from the beginning (num = 1). If
there are overlapping boxes, the 1st (lowermost) box is used.
<double-left-click> or <shift>+<left-click>: The data line in the data list (chapter
4.1.3) corresponding to the respective box is selected. The data list is searched in reverse direction. If there are
overlapping boxes, the last (uppermost) box is used.
<right-click>: the measurement can be re-measured. Search of data list from the beginning.
<shift>+<right-click>: the measurement can be re-measured. Search of data list from the end.
GeoTest user manual ● page 35 of 41
4.1.2.2
Mapping mode: horizontal slices
The section displays the measured data as colored boxes. The boxes are situated in some table type
refering to the horizontal positions (X and Y coordinates) of the respective measurement. The size of the
boxes depends on the respective pseudo depth. "Pseudo", because the pseudo depths are not the real
depths.
This example displays the blank section of a grid of Pole-Pole- measurements. Blank means, there is not
yet data which fills the boxes.
The selector on the top of the section allows to select the
displayed depth slices. The user can choose to display
all slices or slices of a certain depth.
As in the pseudo section display of the profiling measurements, the user can choose between drawing of
resistivities [rho (Ohmm)] or phase angles [phi (mrad)]. In case of frequency dependent measurements,
also the frequency functions rho(f) and phi(f) are available (see former chapter).
Single measurements can be re-measured by clicking into the pseudosection
using the right mouse button.
GeoTest user manual ● page 36 of 41
4.1.3
Data list
The data list contains the summary of measured data. This is the same data as available by pressing the
"Data" → Show overview" option of the main menu and the same data to be stored into a file. The
displayed data list displays the results of 1 frequency setting. If there exist measurements of more than
one frequency, the user can switch to another frequency by cklicking the "Frequency settings" option.
Explanation of data:
num = number of measurement.
A,B,M,N = number of elctrodes A,B,M,N.
I [mA] = measurement current in [mA].
U [mV] = measured voltage (in-phase part, ohmic part) in [mV].
dU [%] = error of measured voltages in %.
This error is defined as = ABS (standard deviation / (√n * U_mean) ) * 100
with n = number of measurements, U_mean = arithmetic mean of all measured U.
U90 [mV] = measured voltage (out-of-phase part) in [mV].
dU90 [%] = error of measured U90 voltages in %.
This error is defined as = ABS (standard deviation / (√n * U90_mean) ) * 100
with n = number of measurements, U90_mean = arithmetic mean of all U90.
rho [Ohmm] = resistivity in [Ohm*m].
phi [mrad] = Phase angle in [mrad].
This parameter is defined by the U90-to-U-ratio = U90 [mV] / U [mV] * 1000.
f [Hz] = measurement frequency in [Hz].
n = number of single measurements used for the actual voltage average.
nAB = number of average measurements performed at the actual ABMN position. This number includes
trials for current settings as well.
Profile [m] = profile position in m. This position refers to the mid point of the actual electrode
configuration. This parameter is only valid in the profiling mode.
Spread [m] = the spread of the actual electrode configuration. The spread is the distance between the
first and the last electrode (profiling mode) or the maximum distance between 2 electrodes of a x-y- grid
(mapping mode).
PseudoZ [m] = Pseudo depth. This is the "investigation depth" as proposed in the paper from Roy and
Apparao (1971). This is not the real depth, therefore it is called pseudo-depth. Real depths will be
calculated later using 2-D or 3-D inversion techniques (not part of GeoTest, see also Barker (1989)).
Please note: there are some different definitions of depths obtained in tomography measurements.
Edwards (1977) introduced the "effective depth" This depth definition is different to the "investigation
depth" definition of Roy and Apparao (1971). ResXDinv inversion software uses the "effective depth"
definition of Edwards (1977).
GeoTest user manual ● page 37 of 41
Positions = X [m], Y [m], Z [m] or Lo [deg], La [deg], Z [m]. The type of position coordinates may be
either X, Y and Z (each in metric units) or longitude, latitude (both in degrees) and Z (metric unit). The
latter is used in case of active GPS readings.
X [m], Y [m] and Z [m]: This coordinate type is the default type. X,Y and Z are the 3 spatial
coordinates of the measurement point. The coordinate system is a rectangular (cartesian) righthand system with metric units (e.g. Gauß-Krüger). In case of profiling measurements, the default
settings are a system with:
X = profile distance [m]. Positive in profile direction.
Y= distance [m] in the direction perpendicular to the profile. Positive to the left.
Z = height [m] = elevation calculated from the elevation of the active electrodes minus pseudo
depth. Positive upwards.
Lo [deg], La [deg] and Z [m]: These are the 3 spatial coordinates of the measurement point in
case of active GPS measurements. The coordinate data is read from the GPS device using the
NMEA-0183 standard. The original NMEA data format of geographical longitude (Lo) and latitude
(La) is a little "distorted": Lo (dddmm.m) and La (ddmm.m) with d=degrees and m=minutes and
fractions of a minute. GeoTest converts this format into degrees with decimal fractions. Southern
latitudes or western longitudes are saved as negative values. The 3 rd dimension = Z is saved in
meters.
Lo = longitude [deg]. Eastern longitudes are positive, western longitudes are negative.
La = latitude [deg]. Northern latitudes are positive, southern latitudes are negative.
Z = height [m] = GPS reading Z [m] minus antenna height [m] (optionally minus pseudo depth
[m]), see 4.1.1.2.2.4. The height is positive in upward direction.
Time [hh:mm:ss.ss] = This colums contains the time stamp. The time is read from the computer system
time.
U (Tx) [V] = This is the measured transmitter output voltage.
Like in the pseudo sections, one single measurement can be remeasured by clicking into the respective field using the right mouse
button.
Clicking the left mouse button, the respective data box in the
pseudosection will blink. This makes it easier to find the corresponding
box in the pseudosection.
Remark: the "Edit data" menu gives access to the data (see chapter 4.1.1.4). Within this menu,
the user can see some statistics for each parameter and the user is able to edit each parameter.
GeoTest user manual ● page 38 of 41
4.1.4
Electrode switch box
The currently active electrode numbers are displayed. The white fields display the
electrode numbers calculated by the program. The blue "Address" fields give the real
electrode addresses (in case of active electrodes). The actual number and the actual
address need not to be the same. The slider at the bottom of this box gives a sketch
of the electrode postions. A and B are the current emitting electrodes. M and N are
the potential electrodes.
In case of profiling and suitable data sorting: during the
measurement procedure a message will apear just below the
electrode switch box as soon as the first or last used cable (or
electrode chain) could be un-plugged (see chapter 4.1.1.2.2.2.).
4.1.5
Frequency settings
The actual frequency setting is displayed.
While the measurement is running, the frequency setting can
not be changed by the user. After stopping the
measurement, this frequency box will be enabled. The user can now switch between
the measurerd frequencies. The Data list will be updated immediately.
4.1.6
Transmitter
The current settings of the transmitter are displayed. The needle indicator shows
the current step (or transmitter voltage, depending on the settings, see chapter
4.1.1.2.3), the text box shows the current in mA. The green symbol shows the
proper function of the transmitter. If there is a problem (e.g. open A-B connection),
the green symbol will disappear and an "open" symbol will appear. If the "show
transmitter voltage" option in the measurement parameter section is checked
(chapter 4.1.1.2.3), the needle indicator will display the transmitter voltage (in V),
not the transmitter current step. In this case, one additional measurement (namely
the transmitter voltage) is necessary.
4.1.7
Receiver
This box shows the current voltage measurement. Only the inphase part of the voltage is shown. The green symbol in the middle
shows correct voltage readings. Too low or too high voltages will
result in red symbols.
Double-left-clicking into the "mV" label will show an expanded list
of measured voltages.
4.1.8
Measurement status
This box displays the current status of the measurements to be performed. The
extrapolated remaining measurement time is displayed too.
4.1.9
Battery power
The battery power of the geoelectric device is shown. Depending on the hardware
used, also the external 12 V power and notebook battery capacity may be shown.
This display is updated automatically every 30 seconds.
GeoTest user manual ● page 39 of 41
4.2
Examples: performing measurements
See the extra Manual_GeoTest_Tutorial.pdf document. This ducument explains the usage of GeoTest by
some examples of geoelectric tomography measurements:
4.3
Example 1: Dipole-dipole tomography
Example 2: Wenner-tomography using "Roll-on" technique
The GeoTest command line parameters
GeoTest can be run using command line parameters. GeoTest will read the command line parameters
immediately after starting the program. The following command line parameters are possible (see the
following example):
1st parameter (example = "d:\_\test.tx0"): name and folder of the data file to be read.
Automatically read the data file which includes all settings, including electrodes and data header,
measurements parameters, monitoring settings, all series of ABMN settings. The data file may
contain already measured data or may be blank.
2nd parameter (= "monitoring"): automatically switch into the monitoring mode
3rd parameter (= "start"): automatically run the measurement in monitoring mode.
If the user copies the GeoTest shortcut with the respective parameter strings into the Windows "AutoStart" folder, the program GeoTest will automatically be started after starting (or re-starting) of Windows.
This may be used for completely automatic and autonomous monitoring measurements without the need
for handling by a user.
How to set parameter strings?
Locate the GeoTest icon somewhere on the
Windows destop. Place the mouse cursor on the
icon and click the right mouse button to open the
properties options. See the screenshot of my
German Windows XP:
Set the respective parameter strings in the
"Target" (German: "Ziel") line.
GeoTest user manual ● page 40 of 41
5
5.1
About GeoTest
Software agreements
Licence agreement
The user of the software accepts the following conditions.
The user is allowed:
- to install and use the software on one single computer.
- to make one copy of the program as a safety copy.
- to give the software to a third person only after a written consent of the producer.
The user is not allowed:
- to give under-licences or to sale or to lend the software or parts of the software to third persons.
- to try to get access to the source code of the program by reverse engineering, decompiling or
other methods.
- to use a former version of the software, in the case of getting an upgrade of the software.
Extended licence agreement
The user has the duty to comply with additional licence agreements, which are valid for the delivered
additional software products, if there are...
Guarantee terms
The Author guarantees, that the software is developped carefully. The software is very complex, therefore
the author cannot guarantee the absolute absence of software bugs or errors.
Liability
There is no liability of the author for any possible consequences of this software.
5.2
Program and manual version
This manual refers to the software program "GeoTest" in version 2.44 (october 2014). This manual is the
version of 09.10.2014.
5.3
Program author
This program and the manual were written by:
Geophysik - Dr. Rauen
Dr. Armin Rauen
Ödgarten 12
94574 Wallerfing
Germany
Tel:
+49 (0) 9936 902026
Fax:
+49 (0) 9936 902027
eMail: [email protected]
iNet: www.geophysik-dr-rauen.de
Comments and suggestions are always welcome.
6
References
Barker R.D. (1989): Depth of investigation of collinear symmetrical four-electrode arrays. Geophysics, vol. 54, No. 8
(august 1989), 1031-1037.
Berktold & 21 Coautoren (1997): Geoelektrik. In Knödel K., Krummel H. & Lange G. (Herausg.): Geophysik.
Handbuch zur Erkundung des Untergrundes von Deponien und Altlasten, Band 3, 65-367, Springer-Verlag.
Edwards (1977): A modified pseudosection for resistivity and IP. Geophysics, Vol. 42, No 5, 1020-1036.
Friedel S. (1997): Hochauflösende Geoelektrik - Geoelektrische Tomographie. In: M. Beblo (Herausg.):
Umweltgeophysik, 131-151, Berlin.
Hennig Th., Weller A., Canh T. (2005): The effect of dike geometry on different resistivity configurations. Journal of
Applied Geophysics 57, 278-292.
Roy and Apparao (1971): Depth of investigation in direct current methods. Geophysics, Vol. 36, No. 5, P. 943-959
Trimble (1999): AgGPS(TM) 124/132 operation manual. Trimble Navigations Ltd. www.trimble.com.
GeoTest user manual ● page 41 of 41