1
End User Documentation
Document Version: 1.0 – 2013-11-19
InfiniteInsight® 6.5 sp4
Toolkit User Guide
CUSTOMER
Table of Contents
Table of Contents
About this Document
3
Common Steps
4
Selecting a Data Set ................................................................................................................................ 4
Special Case: Data Stored in Databases - the Explain Mode ....................................................... 4
Sub-sampling a Data Set .............................................................................................................. 6
Describing the Data Set .......................................................................................................................... 8
Descriptive Statistics
10
From the Start Panel ............................................................................................................................. 10
Selecting the Variables .............................................................................................................. 11
Checking the Parameters............................................................................................................ 13
Generating the Statistics ............................................................................................................ 18
Statistics Debriefing ................................................................................................................... 18
From the Panel "View Data" ................................................................................................................ 19
Computing the Statistics ............................................................................................................ 20
Viewing the Statistics ................................................................................................................ 22
Data Transfer
23
Transferring a Data Manipulation ........................................................................................................ 24
Mapping Fields .......................................................................................................................... 25
Selecting Variables................................................................................................................................ 25
Saving the New Data Set ....................................................................................................................... 25
Defining Text File Settings ........................................................................................................ 26
List Distinct Values
28
Selecting the Variable to Extract .......................................................................................................... 28
Saving the Categories ........................................................................................................................... 29
Data Viewer
31
Visualizing a Data Set ........................................................................................................................... 32
Deleting a Data Set ............................................................................................................................... 33
- Toolkit User Guide
II
About this Document
Selecting a Data Set
About this Document
This document presents the InfiniteInsight™ Toolkit provided in InfiniteInsight™.
The features offered in this toolkit allow you to:
explore and delete data sets (Open the Data Viewer).
transfer a data source to another location or format (Perform a Data Transfer).
export the list of distinct values of a variable from your data set. Among other things, this feature
allows you to generate a list of unique index values from an existing data set and to use it as a
reference table when performing an event log aggregation or a sequence analysis in
InfiniteInsight™ Explorer (List Distinct Values in a Data Set).
generate variables statistics for a data set, such as the cross-statistics or the profit curves when a
variable in the data set is used to estimate the target variable (Get Descriptive Statistics for a
Data Set).
Before reading this document you should be familiar with the section Essential Concepts of the
InfiniteInsight™ - User Guide.
- Toolkit User Guide
3
Common Steps
Selecting a Data Set
Common Steps
This section of the document describes:
the data source selection,
the data description
which are steps common to several of the Toolkit features.
IN
THIS
C H A PT E R
Selecting a Data Set ............................................................................................................................................... 4
Describing the Data Set.......................................................................................................................................... 8
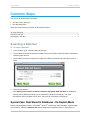
Selecting a Data Set
To Select a Data Set
1
In the list Data Type, select the data set file type.
2
Use the Browse button located on the right of the Folder field to select the folder or database
containing the data set.
3
Use the Browse button located on the right of the Data Set field to select the data set file or
table.
4
Click the Next button.
If the data source is stored in a Oracle, Teradata or SQL Server 2005 data base, an additional
warning may be displayed, asking you to validate the execution of the query. For more
information, refer to chapter Special Case: Data Stored in Databases (on page 4).
Special Case: Data Stored in Databases - the Explain Mode
Before requesting data stored in a Teradata(1), Oracle(2) or SQLServer 2005 database, InfiniteInsight™
uses a feature, called the Explain mode, which categorizes the performances of SQL queries in
- Toolkit User Guide
4
Common Steps
Selecting a Data Set
several classes defined by the user. In order to be as fast and as light as possible, this categorization
is done without actually executing the full SQL query.
(1) For all versions of Teradata.
(2) For all versions above and including Oracle 10.
The objective is to allow estimating the workload of the SQL query before executing it and then
deciding --possibly thanks to an IT Corporate Policy-- if the SQL query can actually be used.
For example, an IT Corporate Policy may favor interactivity and then define 3 classes of SQL queries,
each with its maximum time:
Immediate: duration < 1 s. The query is accepted and executed immediately.
Batched: 1s <= duration < 2 s. The query is accepted but will be executed on next idle time.
Rejected: 2s <= duration. The query will never be executed.
The number, names and limits of classes are defined by the user in order for these values to match
the current DBMS configuration and DBMS usage policy.
The Explain Mode has been Configured
If the Explain mode has been configured by your DBMS administrator, there are two possible
outcomes to a query:
the query is accepted and executed: this is completely transparent. InfiniteInsight™ accesses the
data without further input from the user.
the query needs to be validated before being executed: a pop-up window opens displaying a
message configured by the DBMS administrator. A query that needs validation can be categorized
in two ways:
medium-sized
You will probably have to check with your administrator to know which action to take:
If the administrator authorizes the query, click the Continue button. The pop-up window
closes and the requested action is carried out.
If the administrator does not authorize the query, click the button Stop Query, the
pop-up window closes, but no action is executed.
huge
It means that the query will take too much time and resources. In that case, the behavior of
the Continue button depends on the configuration set by the DBMS Administrator (for
example, it can automatically refuse queries that are considered too heavy). In any case, you
should check with them to know the line of action to follow.
- Toolkit User Guide
5
Common Steps
Selecting a Data Set
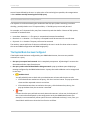
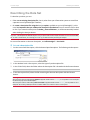
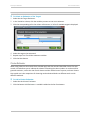
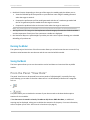
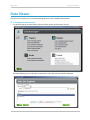
The Explain Mode has not been Configured
If your DBMS Administrator has not configured the Explain mode, the following pop-up opens when
you try to access the data:
You will need to contact your Administrator who will tell you which action to take and configure the
Explain mode.
If the Administrator validates the execution of the query, you may want all queries with the same
duration to be executed without validation. In that case, check the box Do not request validation
anymore for similar requests. The validation message will then only appear for larger queries. This
configuration will only be used for the current session, when closing InfiniteInsight™, it will be lost.
For a permanent configuration, see your DBMS Administrator, who will find the necessary
information in the support document Explain Mode available in section Support and Integration
Documentation of InfiniteInsight™ documentation.
Sub-sampling a Data Set
Sub-sampling can be achieved by:
- Toolkit User Guide
6
Common Steps
Selecting a Data Set
selecting a specific first line and last line from the original data,
randomly selecting a proportion of the original data. A random seed can be used to select the
same records from the original data when sub-sampling,
mixing the selection by line and the random selection.
To Define the Sub-sampling Settings
Click the button
(Advanced Settings) located on the right of the field Data Set. A pop-up
window opens, allowing you to set the sub-sampling parameters.
To Set a Line Selection
1
Check the option Line Selection in the section Define Sub-sampling.
2
In the field First Line, enter the number of the line you want your sub-sampled data set to begin
with.
3
In the field Last Line, enter the number of the line you want your sub-sampled data set to end
with.
To Set a Random Sub-sampling
1
Check the option Random Selection in the section Define Sub-sampling.
2
In the section Random Selection, use the Proportion slide to select the percentage of the
original data set you want to keep.
3
In the field Random Seed, enter a seed value for the sub-sampling. This step is optional.
4
Use the Proportion slide to select the percentage of the original data set you want to keep.
- Toolkit User Guide
7
Common Steps
Describing the Data Set
Describing the Data Set
To describe your data, you can:
Either use an existing description file, that is, taken from your information system or saved from
a previous use of InfiniteInsight™ features,
Or create a description file using the Analyze option, available to you in InfiniteInsight™. In this
case, it is important that you validate the description file obtained. You can save this file for later
re-use. If you name the description file KxDoc_<SourceFileName>, it will be automatically loaded
when clicking the Analyze button.
Important - The description file obtained using the Analyze option results from the analysis of the first 100 lines of the initial data
file. In order to avoid all bias, we encourage you to mix up your data set before performing this analysis.
For more information on data set description, see InfiniteInsight™ - User Guide.
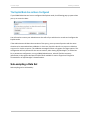
To Load a Description File
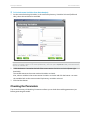
1
On the screen Data Description, click the button Open Description. The following window opens:
2
In the window Load a Description, select the type of your description file.
3
In the Folder field, select the folder where the description file is located with the Browse button.
Note - The folder selected by default is the same as the one you selected on the screen Data to be Modeled.
4
In the Description field, select the file containing the data set description with the Browse
button.
Warning!
When the space used for model training contains a physical variable named KxIndex, it is not possible to use a description
file without any key for the described space.
When the space used for model training does not contain a physical variable named KxIndex, it is not possible to use a
description file including a description about a KxIndex variable since it does not exist in current space.
- Toolkit User Guide
8
Common Steps
Describing the Data Set
5
Click the OK button. The window Load a Description closes and the description is displayed on
the screen Data Description.
6
Click the Next button.
- Toolkit User Guide
9
Descriptive Statistics
From the Start Panel
Descriptive Statistics
This component allows you to generate variables statistics for a data set, such as the cross-statistics
or the profit curves when a variable in the data set is used to estimate the target variable. It can be
accessed either through the option Descriptive Statistics of the Start panel or by using the option
View Data provided when selecting a data source in any KXEN component.
IN
THIS
C H A PT E R
From the Start Panel ............................................................................................................................................ 10
From the Panel "View Data" ................................................................................................................................. 19
From the Start Panel
To Access the Descriptive Statistics from the Start Panel
1
On the Start panel, click the option Get Descriptive Statistics for a Data Set in the Toolkit
section.
The panel allowing you to select the data set you want to analyze is displayed.
2
For a description of how to select and describe a data set, refer to the section Common Steps (on
page 4), then go on with reading the sections below.
- Toolkit User Guide
10
Descriptive Statistics
From the Start Panel
Selecting the Variables
Once the training data set and its description have been entered, you can select different variables :
one or more Targets Variables,
possibly a Weight Variable,
and the Explanatory Variables.
To Select Targets Variables
1
On the screen Selecting Variables, in the section Explanatory variables selected (left hand
side), select the variables you want to use as Target Variables.
Note - On the screen Selecting Variables, variables are presented in the same order as that in which they
appear in the table of data. To sort them alphabetically, select the option Alphabetic sort, presented beneath
each of the variables list.
2
Click the button > located on the left of the screen section Target(s) Variable(s) (upper right
hand side).
The variable moves to the screen section Target(s) Variable(s).
Also, select a variable in the screen section Target(s) Variable(s) and click the button < to move
the variables back to the screen section Explanatory variables selected.
- Toolkit User Guide
11
Descriptive Statistics
From the Start Panel
To Select a Weight Variable
1
On the screen Selecting Variables, in the section Explanatory variables selected (left hand
side), select the variables you want to use as a Weight Variable.
Note - On the screen Selecting Variables, variables are presented in the same order as that in which they
appear in the table of data. To sort them alphabetically, select the option Alphabetic sort, presented beneath
each of the variables list.
2
Click the button > located on the left of the screen section Weight Variable (middle right hand
side).
The variable moves to the screen section Weight Variable.
Also, select a variable in the screen section Weight Variable and click the button < to move the
variables back to the screen section Explanatory variables selected.
- Toolkit User Guide
12
Descriptive Statistics
From the Start Panel
To Exclude some Variables from Data Analysis
1
On the screen Selecting Variables, in the section Explanatory Variables Selected (left hand
side), select the variable to be excluded.
Note - On the screen Selecting Variables, variables are presented in the same order as that in which they
appear in the table of data. To sort them alphabetically, select the option Alphabetic sort, presented beneath
each of the variables list.
2
Click the button > located on the left of the screen section Variables excluded (lower right
hand side).
The variable moves to the screen section Variables excluded.
Also, select a variable in the screen section Variables excluded and click the button < to move
the variables back to the screen section Explanatory variables selected.
3
Click the Next button.
Checking the Parameters
The screen Summary of Modeling Parameters allows you to check the modeling parameters just
before generating the model.
- Toolkit User Guide
13
Descriptive Statistics
From the Start Panel
Options
Description
Model Name
The name of model is filled automatically. It corresponds to the name of the target variable, followed by
the underscore sign ("_") and the name of the data source, minus its file extension.
Description
Once the model is saved, the description will allow you to recognize your model when you want to reopen
it with InfiniteInsight™.
Autosave...
This button opens the panel Model Autosave allowing you to indicate that the model must be
automatically saved at the end of the learning process and ot set all the required parameters. When the
autosave option is activated, a green check mark is displayed on the Autosave button. At then end of the
learning process, a warning message will be displayed confirming that the model has been saved
Export KxShell
Script...
This button opens the panel allowing you to generate a KxShell script reproducing the current model.
Advanced...
This button allows you to set estimator variables for the target(s) and/or the clusters. For more details, see
section Advanced Parameters (on page 14).
Advanced Parameters
Target Estimator Variables
If you have selected at least one target variable, the tab Define Estimator will be activated, allowing
you to select variables as estimator of the target variables. An estimator is a variable that can be
used to predict the target variable behavior. Using an estimator is equivalent to creating a model.
If there is no variable that can be used as estimator of the target in your data set, do not fill anything
in this panel.
- Toolkit User Guide
14
Descriptive Statistics
From the Start Panel
Note - Only continuous variables can be used as estimators.
To Select an Estimator of the Target
1
Select the tab Target Estimator.
2
In the Variables column, click the variable you want to use as an estimator.
3
Click the corresponding cell in the column is Estimator of. A list of available targets is displayed.
4
Select the target to be estimated.
5
Repeat steps 2 to 4 for all the estimator variables.
6
Click the Next button.
Cluster Estimator
When using a data set that results from a model apply and that contains identified clusters for each
record, this tab allows you to indicate the columns containing the cluster indexes. It can be useful to
generate statistics, such as the size of each cluster and the residual sum of squares, on these clusters.
One typical use is the comparison of clustering results obtained thanks to different tools or with
different methods.
To Add a Cluster Estimator
1
Select the tab Cluster Estimator.
2
Click the button Add Estimator. A variable is added to the list of estimators.
- Toolkit User Guide
15
Descriptive Statistics
From the Start Panel
3
Click the variable name to display the list of all variables.
4
Select the variable containing the cluster index in the list.
5
If the clustering used to generated the cluster index was supervised, select the Cluster Target.
6
Repeat steps 2 to 5, if there are more than one cluster index. For example, if the data set
contains the results from two different clustering tools, so that you can compare the statistics
directly on the same data set.
- Toolkit User Guide
16
Descriptive Statistics
7
From the Start Panel
In the Distance list located below the estimators list, select the distance that was used to
evaluate the proximity of two given individuals in the original clustering model.
The available distances are defined as follows:
8
9
Chessboard: maximum of absolute differences between coordinates (LInf).
Euclidean: square root of sum of square differences between coordinates (L2).
City Block: sum of absolute differences between coordinates (L1).
In the Encoding list located below the estimators list, select the encoding that was used in the
original clustering model. The encoding used by default when generating a clustering model with
InfiniteInsight™ is:
Target Mean, if the model is supervised,
Unsupervised, otherwise.
Once all cluster estimators have been indicated, click the Validate button.
To Remove a Cluster Estimator
1
Select the estimator variable to remove.
2
Click the button Remove Estimator.
- Toolkit User Guide
17
Descriptive Statistics
From the Start Panel
Generating the Statistics
To Generate the Statistics
1
On the screen Summary of Modeling Parameters, click the Generate button.
The screen Training the Model will appear. The model that will compute the statistics is being
generated. A progress bar will allow you to follow the process.
2
Once the model has been generated, click the Next button.
Statistics Debriefing
The screen Statistics Debriefing allows you to display the statistics generated for the data set, to
test a new data set for deviation and to save the statistics.
Displaying the Statistics
The Display section provides you with the following tools to debrief the statistics:
the model Summary: displays information on the model generated such as the number of
variables, the performance indicators, the target information, and so on.
Note - If you have not used an estimator of the target, the performance indicators are not filled.
- Toolkit User Guide
18
Descriptive Statistics
From the Panel "View Data"
the Model Graphs: depending on the type of the target, the model graph plot allows you to:
View the realizable profit that pertains to your business issue using the model generated
when the target is nominal.
Compare the performance of the model generated with that of a random type model and
that of a hypothetical perfect model when the target is nominal.
Compare the predicted value to the actual value when the target is continuous.
Note - The model graphs are not available if you have not selected an estimator of the target beforehand.
the Significance of Categories: the importance of each category of nominal or ordinal variables
and the importance of each bin of the continuous variables are displayed.
the Statistical Reports: InfiniteInsight™ provides you with a set of reports allowing you a detailed
debriefing of your data set.
Running the Model
The option Analyze Deviations of the Run section allows you to load a new data set to control if any
deviations exist between the new data set and the one used to build the model.
Saving the Model
The Save option allows you to save the statistics and to load them at a later time like any KXEN
models.
From the Panel "View Data"
The panel View Data can be opened from various panels of InfiniteInsight™, especially from any
panel allowing you to select or describe a data source. It is identified by a button with a magnifier
such as:
or
This panel allows you to visualize the content of your data set and to calculate the descriptive
statistics for the variables.
If the data source is stored in a Oracle, Teradata or SQL Server 2005 data base, an additional
warning may be displayed, asking you to validate the execution of the query. For more information,
refer to chapter Special Case: Data Stored in Databases (on page 4).
- Toolkit User Guide
19
Descriptive Statistics
From the Panel "View Data"
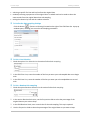
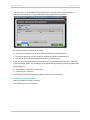
Computing the Statistics
To Compute the Statistics
1
Click the View Data button. The panel KXEN Sample Data View opens.
2
Select the Statistics tab.
3
Select on which part of the data set you want to compute the statistics. You can calculate the
statistics for:
the whole data set (option Compute statistics over the whole data set),
the first n lines of the data set (option Compute statistics over the n first lines),
- Toolkit User Guide
20
Descriptive Statistics
From the Panel "View Data"
a sub-sample of the data set (Advanced option).
The time needed to compute the statistics depends on the quantity of data to analyze, so the
larger the number of lines, the longer the analysis.
When you click on the selected option, the statistics generation starts. A progress bar is displayed
allowing you to follow the process.
When the analysis is over, the statistics are displayed.
- Toolkit User Guide
21
Descriptive Statistics
From the Panel "View Data"
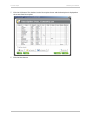
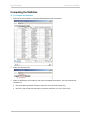
Viewing the Statistics
Once the statistics have been computed, the following tabs are displayed:
Variables, which displays a list of the variables found in the data set with their value, their
storage value, the number of missing value for each variable and their role during the modeling.
Category Frequencies, which displays for each variable the complete set of its categories, their
frequency and the number of occurrences of each category (Weighted Count).
Continuous Variables, which displays for each continuous variable the minimum, the maximum,
the mean and the standard deviation.
- Toolkit User Guide
22
Data Transfer
From the Panel "View Data"
Data Transfer
The component Data Transfer allows you to transfer a data source to another location or format.
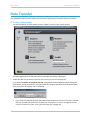
To Start a Data Transfer
1
On the Start panel, click the option Perform a Data Transfer in the Toolkit section.
The panel allowing you to select the data set you want to transfer is displayed.
2
Select the data set you want to transfer (see Selecting a Data Set (on page 4)).
If you want to transfer an analytical data set, a message box will be displayed after clicking the
Next button, asking you whether you want to transfer the data contained in the analytical data
set or if you want to transfer only its definition.
If you choose to transfer the data, the data transfer component will act as if it was a classical
data set, and ask you to describe the data (see "Descriptive Statistics" on page 10) and to
save the new data set (see "Saving the New Data Set" on page 25).
- Toolkit User Guide
23
Data Transfer
Transferring a Data Manipulation
If you choose to transfer only the analytical data set definition, the panel Data Manipulation
Transfer will be displayed (see Transferring an Analytical Data Set (on page 24)).
IN
THIS
C H A PT E R
Transferring an Analytical Data Set....................................................................................................................... 24
Selecting Variables ............................................................................................................................................... 25
Saving the New Data Set ...................................................................................................................................... 25
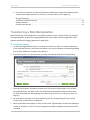
Transferring a Data Manipulation
When transferring a data manipulation, the panel Data Manipulation Transfer allows you to select
the target database, to define the mapping between the source tables and the target tables and, if
needed, to define the mapping between the table fields.
To Define a Transfer
1
To select the target database (that is, the database in which you want to transfer the definition
of the analytical data set), click the Browse button, then select a database in the displayed dialog
box. Click the OK button to validate your selection.
2
In the field Transfer as, enter the name you want the analytical data set to be identified by.
3
Click the Guess button, located on the lower part of the panel. InfiniteInsight™ tries to find in
the target data base, the tables used in the analytical data set definition based on their name.
For more information on field mapping, see section Mapping Fields. (see "Mapping Fields" on
page 25)
4
For each table not found or incorrectly identified, click the corresponding cell in the column
Target Table. A table selector is displayed.
5
When all the tables are mapped, click the Check button. InfiniteInsight™ checks if the mapping is
correct for all tables. If an error is found, a diagnostic message is displayed, else the Next button
is enabled.
- Toolkit User Guide
24
Data Transfer
6
Selecting Variables
Click the Next button to start the transfer.
Mapping Fields
When the fields from the target table do not have the same names as the fields from the source
table, you need to map the source fields to the target fields.
The column Edit Field Mapping indicates the state of the field mapping.
: the transfer definition has not yet been validated or the default mapping is correct.
: the mapping has been edited and is correct.
: the mapping is incorrect (whether it has been edited or not).
To Define the Field Mapping
1
In the column Edit Field Mapping, click the icon
field mapping.
. A window opens allowing you to edit the
2
Click the Guess button. InfiniteInsight™ tries to map the fields based on a name similarity and on
the fields storage format.
Note - Two fields can be mapped together only if they have the same storage format.
3
To modify a mapping that seems incorrect or that has not been found:
1. On the line corresponding to the mapping to modify, click the Target Field column.
2. In the drop-down list, select the target field you want to map with the source field.
4
When all the fields are mapped, click the Check button. If all the fields are correctly mapped, the
OK button is enabled, else a diagnostic message is displayed.
5
Click the OK button to validate the mapping.
Selecting Variables
The panel Variable Selection allows you to choose which variables you want to exclude from the data
set.
To Exclude a Variable
1
Select the variable to exclude in the Variables Selected for Transfer list.
2
Click on the > button located on the left of the Excluded Variables screen section.
Note -
All the lists can be sorted by the order in the file or alphabetically.
Saving the New Data Set
This panel allows you to duplicate a data set into a file or a data base table.
- Toolkit User Guide
25
Data Transfer
Saving the New Data Set
To Save the Data Set
1
Use the Browse button located on the right of the Folder field to select the folder or data base
where the file will be saved.
2
Enter the name of the file to create or use the Browse button located on the right of the field
Output Dataset to select an existing file.
3
Click the Next button.
A message box appears displaying a progress bar. When the file has been created, the main menu
is displayed.
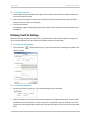
Defining Text File Settings
When transferring the data set to a text file, you will be able to define various specific settings such
as the column separator, the date format, the number format or the encoding.
To Define the File Settings
1
Click the button
text file settings.
(Advanced Settings). A pop-up window opens allowing you to define the
To Define the Separator
1
Check the box Define Separator. The corresponding section is activated.
2
Select the character to be used as the column separator in the generated text file. There are four
predefined choices (Tabulation, Comma, Semicolon, and Space), but you can define your own
separator by selecting the Other option and entering the character of your choice in the provided
field.
- Toolkit User Guide
26
Data Transfer
Saving the New Data Set
To Specify the Date Format
1
Check the box Specify Date Format. The corresponding section is activated.
2
In the list Date Order, select in which order you want the day, month and year to be displayed.
3
In the field Date Separator, enter the character(s) that will appear between the different date
parts. An example is displayed below the field Date Separator.
To Force the Encoding
1
Check the box Force Encoding. The corresponding section is activated.
2
Select the encoding you want to use for the generated text file. Four types of encodings are
available:
UTF8
UTF16
Native
Latin1
To Define the Number Format
1
Check the box Number Format. The corresponding section is activated.
2
In the field Number of Digits, enter the number of digits to display after the decimal.
- Toolkit User Guide
27
List Distinct Values
Selecting the Variable to Extract
List Distinct Values
The feature List Distinct Values in a Data Set allows you to export the list of distinct values of a
variable from your data set. Among other things, it allows you to generate a list of unique index
values from an existing data set and to use it as a reference table in InfiniteInsight™ Explorer - Event
Logging or InfiniteInsight™ Explorer - Sequence Coding.
To Use the Feature List Distinct Values
1
On the Start panel, click the option List Distinct Valuesin a Data Set in the section Toolkit.
The panel allowing you to select the data set from which the values will be extracted is displayed.
2
For a description of how to select and describe the data set, refer to the section Common Steps
(on page 4), then go on with reading the sections below.
IN
THIS
C H A PT E R
Selecting the Variable to Extract .......................................................................................................................... 28
Saving the Categories .......................................................................................................................................... 29
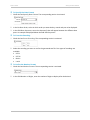
Selecting the Variable to Extract
The Settings panel allows you to select the variable for which you want to extract the categories.
- Toolkit User Guide
28
List Distinct Values
Saving the Categories
To Select a Variable
1
Check the variable in the list Select Columns to Extract.
2
Click the Next button.
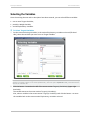
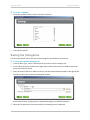
Saving the Categories
The next panel allows you to save the variable categories extracted from the data set.
To Save the Variable Category List
1
In the list Data Type, select in which format you want to save the category list.
2
Use the Browse button located on the right of the Folder field to select the folder or data base
where the file will be saved.
3
Enter the name of the file or table to create or use the Browse button located on the right of the
field Output Data Set to select an existing file or table.
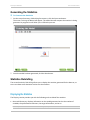
Click the Next button. A progress bar is displayed allowing you to follow the process.
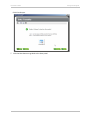
4
When the file has been created successfully, the following panel is displayed.
- Toolkit User Guide
29
List Distinct Values
Saving the Categories
Click View Output.
5
Click the Next button to go back to the Start panel.
- Toolkit User Guide
30
Data Viewer
Saving the Categories
Data Viewer
The Data Viewer allows you to visualize existing data sets and if needed to delete them.
To Display the Data Sets List
1
On the Start panel, click the feature Open the Data Viewer in the section Toolkit.
The panel allowing you to select the location where your data sets are stored is displayed.
- Toolkit User Guide
31
Data Viewer
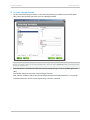
Visualizing a Data Set
2
In the list Data Type, select the type of storage the data sets you want to browse are located in
(Text File, Database, ...).
3
Use the Browse button located on the left of the Folder field to select the folder (or database)
containing the data sets. If you want to explore data sets stored in a password protected
database, do not forget to provide the user name and password granting you access to the
database.
The data sets list is displayed in the field Data Sets.
IN
THIS
C H A PT E R
Visualizing a Data Set ........................................................................................................................................... 32
Deleting a Data Set ............................................................................................................................................... 33
Visualizing a Data Set
To Visualize a Data Set
1
Click the data set you want to visualize. The button View Data at the bottom of the panel
becomes active.
2
Click the button View Data. The first hundred lines in the data set are displayed in a new
window.
- Toolkit User Guide
32
Data Viewer
Deleting a Data Set
To Select the Number of Lines to Display
1
In the field First Row Index, enter the index of the line before the first one you want to display
(for example, to start on line 1, enter 0).
2
In the field Last Row Index, enter the index of the line before the last one you want to display
(for example, to end on line 100, enter 99).
3
Click the Refresh button to display the selected lines.
To Search for a Variable
1
Click the Search button (Magnifier icon). The window Search Variable by opens.
2
Select the type of search you want to perform (by index or by name). A variable index is its
column number in the data set.
3
In the displayed drop-down list, select the variable index or name.
4
Click the OK button. The searched variable column appears highlighted in the window KXEN
Sample Data View.
To Display the Variables Statistics for the First Data Set Lines
1
In the field Number of Lines, select the number of lines for which you want to see the statistics.
To display the statistics for the whole data set, enter a number below 1.
2
Click the Statistics button (graph icon). The window Statistics for "<DataSetName>" on the
first <n> Lines opens. For more details on statistics, refer to section Descriptive Statisctics >
From the Panel View Data (see "From the Panel "View Data"" on page 19).
Deleting a Data Set
To Delete a Data Set
1
Select the data set you want to delete. The button Delete Selected becomes active.
2
Click the button Delete Selected. A dialog box is displayed asking you to confirm the deletion.
3
Click the Yes button. The data set is deleted.
- Toolkit User Guide
33
4
www.sap.com/contactsap
© 2013 SAP AG or an SAP affiliate company. All rights reserved.
No part of this publication may be reproduced or transmitted in any
form or for any purpose without the express permission of SAP AG.
The information contained herein may be changed without prior
notice.
Some software products marketed by SAP AG and its distributors
contain proprietary software components of other software
vendors.
National product specifications may vary.
These materials are provided by SAP AG and its affiliated
companies (“SAP Group”) for informational purposes only, without
representation or warranty of any kind, and SAP Group shall not be
liable for errors or omissions with respect to the materials. The only
warranties for SAP Group products and services are those that are
set forth in the express warranty statements accompanying such
products and services, if any. Nothing herein should be construed as
constituting an additional warranty.
SAP and other SAP products and services mentioned herein as well
as their respective logos are trademarks or registered trademarks of
SAP AG in Germany and other countries. Please see
www.sap.com/corporate-en/legal/copyright/index.epx#trademark
for additional trademark information and notices.