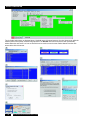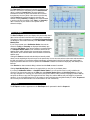
1
Central Software User’s Guide
Toro Sentinel Central Software User’s Guide
Table of Contents
Quick Reference. . . . . . . . . . . . . . . . . . . . . . . . . . . . . . . . . . . . . . . . . . . . . . . . . . . . . . . . . . . . . . . . . . . . . .
ii
Chapter 1: General Overview . . . . . . . . . . . . . . . . . . . . . . . . . . . . . . . . . . . . . . . . . . . . . . . . . . . . . . . . . . .
1
Chapter 2: Software Installation . . . . . . . . . . . . . . . . . . . . . . . . . . . . . . . . . . . . . . . . . . . . . . . . . . . . . . . . .
2
Chapter 3: Getting Started . . . . . . . . . . . . . . . . . . . . . . . . . . . . . . . . . . . . . . . . . . . . . . . . . . . . . . . . . . . . .
3
Chapter 4: Programming Field Units - Part 1: Configuring Field Units . . . . . . . . . . . . . . . . . . . . . . . . .
5
Chapter 5: Programming Field Units - Part 2: Auto Programming . . . . . . . . . . . . . . . . . . . . . . . . . . . . .
9
Chapter 6: Programming Field Units - Part 3: Zone Data . . . . . . . . . . . . . . . . . . . . . . . . . . . . . . . . . . . . 14
Chapter 7: Programming Field Units - Part 4: Data Retrieval . . . . . . . . . . . . . . . . . . . . . . . . . . . . . . . . . 16
Chapter 8: Field Unit Status . . . . . . . . . . . . . . . . . . . . . . . . . . . . . . . . . . . . . . . . . . . . . . . . . . . . . . . . . . . . 17
Chapter 9: Field Unit Reports . . . . . . . . . . . . . . . . . . . . . . . . . . . . . . . . . . . . . . . . . . . . . . . . . . . . . . . . . . . 19
Chapter 10: ET Based Watering . . . . . . . . . . . . . . . . . . . . . . . . . . . . . . . . . . . . . . . . . . . . . . . . . . . . . . . . . 22
Chapter 11: Automatic Communications . . . . . . . . . . . . . . . . . . . . . . . . . . . . . . . . . . . . . . . . . . . . . . . . . . 26
Chapter 12: Polling Alarms . . . . . . . . . . . . . . . . . . . . . . . . . . . . . . . . . . . . . . . . . . . . . . . . . . . . . . . . . . . . . 28
Chapter 13: Rain Shutdown . . . . . . . . . . . . . . . . . . . . . . . . . . . . . . . . . . . . . . . . . . . . . . . . . . . . . . . . . . . . 30
Chapter 14: System Flow Graph. . . . . . . . . . . . . . . . . . . . . . . . . . . . . . . . . . . . . . . . . . . . . . . . . . . . . . . . . 30
Chapter 15: System Flow Optimizer. . . . . . . . . . . . . . . . . . . . . . . . . . . . . . . . . . . . . . . . . . . . . . . . . . . . . . 32
Chapter 16: Utilities and Troubleshooting. . . . . . . . . . . . . . . . . . . . . . . . . . . . . . . . . . . . . . . . . . . . . . . . . 34
Appendix A: Hand-Held Radio Operation and Commands . . . . . . . . . . . . . . . . . . . . . . . . . . . . . . . . . . . 36
Appendix B: Log Files . . . . . . . . . . . . . . . . . . . . . . . . . . . . . . . . . . . . . . . . . . . . . . . . . . . . . . . . . . . . . . . . . 39
Index . . . . . . . . . . . . . . . . . . . . . . . . . . . . . . . . . . . . . . . . . . . . . . . . . . . . . . . . . . . . . . . . . . . . . . . . . . . . . . . 41
Toro Sentinel Central Software User’s Guide
i
Quick Reference
The six Sentinel main menus are displayed above. Listed with most of the menu items are a hot key (shortcuts) by which the
Sentinel feature can be quickly accessed using keystrokes. The Window menu lists the shortcut to each opened utility
window. Below the main menu is an icon tool bar which can be used to access the same Sentinel features from the main
menus with a click of the mouse.
ii
Toro Sentinel Central Software User’s Guide
Chapter 1 : General Overview
User FCC-Licensing Responsibilities
The radios in this product communicate on frequencies under the control of the Federal Communications Commission (FCC).
The user must apply for and be granted a frequency license which is site specific. All costs associated with obtaining and
maintaining the license are the responsibility of the user and not The Toro Company.
System Hardware and Components
1 Personal Computer (see requirements below)
2 CPU Serial Cable Assembly
3 Phone Modem (56K or faster)
(U.S. Robotics preferred)
1
4 Modem Power Supply
5 Modem Serial Cable
6 Modem Phone Line Cable
7 Sentinel Central Interface Module
8 Interface Module Power Supply
4
9 Mast Antenna
(450–470 MHz, 5 db Gain)
10 Antenna Surge Arrestor
3
11 50 Foot Antenna Cable
9
7
6
5
8
2
11
10
System PC Requirements
Ensure that the PC on which you intend to install the Sentinel software meets the requirements outlined below. Install the
Sentinel software to your central computer according to the instructions in Chapter 2. After successfully installing the Sentinel
software, you must configure the software and create a system of field units corresponding to your actual Sentinel field
controllers. See Chapter 3 for guidance. Once a system is created, you may then program each field unit as described in
Chapters 4–7.
The following hardware and software are required to run Toro’s Sentinel central software:
• Microsoft Windows 95, ME, XP or 2000
• Pentium–Pentium IV or 100% Compatible Processor, 1Ghz or Faster
• 2X or faster CD-ROM
• At least one RS232 serial communications port dedicated to the system.
• SVGA 600 x 800 or higher resolution video adapter and compatible monitor.
• Minimum of 32 MB RAM.
• Minimum of 540 MB HD (min 30 MB free space).
Toro Sentinel Central Software User’s Guide
1-1
Chapter 2 : Software Installation
Note: Throughout this manual, the terms folder and directory are interchangeable.
Insert the Sentinel CD in your CD-ROM drive. If Windows is configured to detect new CDs, the
Sentinel setup program will start automatically. Otherwise, open the Windows Start
menu
(located at the lower left corner of the screen) and select Run. In the Run dialog box, type
X:\Setup.exe, where X is the letter of the CD-ROM drive, usually D: or E:. Press ENTER or click OK
to start the Sentinel setup program. The setup program will allow you to specify the directory and
program group in which to install Sentinel. Click Change Directory with the mouse to specify a
different directory. The default directory (folder) is C:\Program Files\Sentinel and the default
program group is Sentinel 2X. If upgrading from a previous software version, modify the
folder and group name (example: Sentinel 520) to preserve the old installation and avoid
confusion. After installation is complete, simply close the setup program by clicking the X in
the upper right corner of the window with your mouse.
2-2
Toro Sentinel Central Software User’s Guide
Chapter 3 : Getting Started
Software Configuration
Windows: Adjust Windows Display Properties to ensure complete
visibility of the Sentinel screen. Close all programs, and with your
pointer aimed in the middle of the screen (not over any icon), click the
right mouse button. A menu window will launch. Click Properties from
the menu. The Display Properties utility window will open. Select the
Settings tab and set the Screen area to 800 by 600 or greater.
A lower setting will prevent viewing each Sentinel window in full view.
A color setting of more than 256 colors, such as 16-bit or 24-bit is also
recommended. This is not required for normal operation of Sentinel
but for satisfactory viewing of pictures you may insert for each field
unit’s screen display. Lower settings (16 or 256 colors) may improve
the speed performance for slower computers.
Sentinel: To configure Sentinel, start the software by double clicking
on the folder icon from the desktop. Double click on the Sentinel icon
inside the folder. Do not click any other Sentinel icons before Sentinel
is completely configured. The other Sentinel modules (AutoComm,
Flow Graph and Flow Optimizer) will not function properly if
launched before the Sentinel software is configured.
Sentinel can also be started by clicking the Start
button, then
Programs, then Sentinel folder, and finally Sentinel. This is just
another option of launching the Sentinel central program.
During the window launch, an opening window will briefly display the
logo and software version number. In this window, you will also see
one of these four letter acronyms that designates the software
editions:
• BSCM - Basic Software Control Module
• ETCM - ET Control Module - Central Software plus ET
Support
• OFCM - Optimal Flow Control Module - Central Software
plus Flow Optimization
• AFCM - All Feature Control Module - Complete Software
Package with ET Support and Flow Optimization.
After starting Sentinel for the first time, the Software Configuration
will open. This utility window will automatically open the very first time
Sentinel is launched or when a new database is created. Sentinel uses
the default file name Sentinel.mdb to create a main database. To
access this window, select Software Configuration from the Setup /
Utility menu. See Chapter 16 for additional information.
You can enter the name of your organization in the white box at the
top of this window.
NOTE: Throughout this manual, the Sentinel Field Satellite controller
is referred to as Unit or Field Unit.
If you intend to irrigate based on ET (Evapotranspiration), you must
select the source for ET and rain information before proceeding with
the setup. If you select the first ET/Rain Source option, the daily ET
value will be read from the Sentinel database for the specified unit. If
you are not using ET based irrigation, the unit code entered here will
not matter. Sentinel will never use the information. See Chapter 10 for
more details on ET function.
The Schedule Reference Day defaults to the date when the Sentinel
software is first installed. Sentinel will use this date to mark the first
week of the six-week schedule cycle. The software will calculate the
schedules of all field units, even if they are programmed on different
days, in relation to this date. You should never have to change this
information.
Toro Sentinel Central Software User’s Guide
3-3
Serial Port Scan
With the Serial Port Scan window selected in the Utility /
Diagnostics menu, you can view what devices are
connected to the central computer RS-232 serial
communications ports (COM 1 through COM 4). Scan All
Ports will automatically check each serial port one at a time.
You can also scan each port individually. A GroWeather
station will register as an Unknown.
Communication Test and Field Unit Diagnostics are
covered in Chapter 16.
System / Group Maintenance
After configuring Sentinel, select System/Group
Maintenance from the Setup/Utility menu.
Creating a system with a Weather station
Only do this step if you have a Weather station. If you are
not using a weather station, skip to the Creating A System
of Field Units section of this chapter. If you will be using a
weather station, click Add Weather Station. Please note
that this button will only appear if the GroWeather station
was selected as the ET/Rain Source in the Software
Configuration window.
Select the directory containing your GroWeatherLink
software from the top file list. This directory contains a
subdirectory for each GroWeather station displayed in the
lower list. Select the station from the lower list, then click OK.
This will create a system where you can choose which Sentinel field units to include. When automatic ET transmission is
finished, all of the field units that are added to the system will receive the ET and rain values recorded by the Weather
station. If you have more than one Weather station, you must create a separate system for each one, then add all field units
that will use its ET values.
Creating a System of Field Units
Before you can program the Sentinel field units, you must create and name
a system that will contain them. Type the name of your choice at the top
empty System Name box in the System Maintenance window.
Click the blank space below the name you just created. This will prompt the
system to generate a No in the Current? column. To select a system to be
the current system, click on the No in the Current? column to toggle No to
Yes. With Yes selected on the newly created system, programming of field
units is enabled for this system. You may wish to create additional systems
of units. This is useful, for example, if you plan to use the Sentinel Flow
Optimizer. The Flow Optimizer function will optimize all programs in the
current system. You can then make another system current and optimize it
independently. If you don’t have a specific need for multiple systems, create
only one system to keep it simple. See Chapter 15 for more in depth details
regarding the Flow Optimizer.
In order to create, add, or remove existing field units to a system, the
system must be selected. Click the square box to the left of the System Name to select it. The triangular arrow point
indicates which system is selected.
Once you have the system named and selected, the next step is to specify the field units within the system. Click the Create
button located in the middle of the System Maintenance window. This will display a window to enter a field unit code. Enter
the 3-digit unit code programmed in the actual field unit that you want to add to the system. Repeat this process for each
unit you want to include in the system. Sentinel will create a record in the system database for each field unit listed.
3-4
Toro Sentinel Central Software User’s Guide
System Defaults
Once all the field units are listed in the system, you can set
certain parameters that will apply to all of them. Click the Set
System Defaults button within the System Maintenance
window. The Default Parameters section will activate. Within
its corresponding text fields, you can enter the Maximum
Flow for the entire system. The same can be done for Water
Window Start and Water Window End time, as well as Day
Change hour. The Day Change hour must be outside the
water window, unless the water window’s start and end are
identical, then the day change hour must be the same time as
well. You must enter values here and click the Apply button if
you intend to use the Sentinel Flow Optimizer to optimize
the system. If you don’t plan to use the Flow Optimizer, you
can set a different Water Window and Day Change hours for
each individual unit as described in Programming Field
Units.
Proceed to Chapter 4: Programming Field Units to configure and program them individually.
Chapter 4 : Programming Field Units - Configuring Field Units
Receiving Special Data from Field Units
The Special Data should be received first from each unit before
any other communication to the field unit takes place. Sentinel
provides a utility window to select a field unit or a group of field
units to upload the Special Data from. The Receive Special Data
selection is located under the Group Operations menu listing. The
example window shown at the right lists all units in the current
system and indicates the Comm Port that each unit is assigned to.
By default, all units are selected when Receive Special Data
window opens. You can deselect any unit by toggling the Yes to
No under the Select? column. The Clear All button can be used
to deselect all or Select All to choose all field units. If group(s) of
field units have been set under System / Group Maintenance, the
group name(s) will be available for selection from the list labeled
Group(s) at the right side of the window. When the selection process is complete,
click Receive and Sentinel will read the Special Data from all selected field units
one at a time.
Configuring Individual Field Units
Once you have listed the field units in the current system, you can program them
individually. To select a field unit to program, click the Unit icon in the upper left
corner of the main screen or select Field Unit Ops from the File drop-down menu
or hold down the CTRL key and press U. (Many menu items can be selected with
hot keys. See the illustration in the Quick Reference section.) This will open the
Unit Selection window which displays the list of all units in the current system.
A Print button is provided if you wish to print this list. It will use the Windows
default printer. Select the first unit you want to program or type the 3-digit code in
the text box above the list. Unit 001 is used as an example in the picture.
NOTE: The unit description initially states the time & date the unit was created in
System Maintenance. Changing the description is covered in the next section.
When a specific unit is clicked, the Master Control Panel will open.
Toro Sentinel Central Software User’s Guide
4-5
Master Control Panel
The Master Control Panel groups together all of the tools necessary to configure and program a specific field unit, check the
status and view the reports. All windows shown in the following sections of this chapter are accessed here.
Displaying a Picture in the Master Control Panel
You can display an image of the actual field unit or associated landscape unique to the selected unit. Sentinel can display two
different picture formats, BMP and JPEG. For Sentinel to recognize the picture, the file must be in the appropriate format and
have the proper extension, “.bmp” or “.jpg.” You can have more than one picture for a single field unit. The picture files must
reside in the Sentinel folder in order to appear in the list box at the top of the Master Control Panel. To display the image
file, scroll through the image list by clicking the small arrows at the right of the text box. When you see the desired file name,
double-click it with the mouse and the image will replace the background.
Special Data
The first step in programming a field unit is receiving and setting the Special Data.
Receive Special Data must be performed first in order for Sentinel to record the
field unit firmware version before proceeding to any other utility window. Sentinel
will automatically configure other windows according to the received field unit
software version for compatibility.
See Receive Special Data section in this chapter. If a Sentinel Radio module is
installed, the group operation utility can be used to receive the field unit special
data from several field units at once.
Click the Special Data button from the Master Control Panel. This will open the
Special Data window which contains the settings for a number of stations,
firmware version, Data Retrieval option, Central Comm Port, Field Access Phone
number, Pager Number for Alarms, maximum number of station that are active simultaneously, Day Change Hour (if different
from the system default set in System Maintenance), and Pump Setup.
NOTE: The unit code in the upper left corner has a green background. This is typical of all unit-specific windows in the
Sentinel software which will either be located in the upper left or upper right corner of the window. This little box will turn red if
an alarm condition is detected from the field unit during a communication. It will turn yellow if the unit is currently shut down
for a Rain Day.
The Unit Description can be modified in the Special Data window. You can enter any text you desire in the description text
box at the top, up to 50 characters in length. This unit description will appear, along with the unit code, in the other Sentinel
screens, including the Unit Selection window shown at the start of this chapter.
NOTE: Do not change the Day Change Hour here (Special Data window) if you intend to use the flow optimizer, which
requires the same setting for all units in the current system. You can change the default settings in System/Group
Maintenance.
4-6
Toro Sentinel Central Software User’s Guide
The most important item of Special Data is the Comm Port. If you are not sure which port Sentinel uses to communicate
with a field unit, you can run the Serial Port Scan from the Utility/Diagnostics menu. This function can detect a Sentinel
field unit, Sentinel modem, or phone modem on any of the central computer serial ports. See Chapter 16 for more details.
After selecting the correct Comm Port, you can click the Receive button to verify the field unit version and number of
stations from the unit itself. During communication with the field unit, a status window labeled Communication in Progress
will briefly appear. This window, referred to as the Comm Progress window, indicates progress
as communication is established and while data is being transmitted or received. This window
will appear every time the Send or Receive button is clicked from any Sentinel screen. It can
also be used to monitor if a break or an error in communication occurs. The top blue box will
indicate the type of communication in progress, in this case Special Data Receive. It will turn
green when the operation is successfully completed or it will turn red if an error occurred during
transmission. The blue boxes below the window displays the data being sent or received. The
check boxes at the bottom half of the window are successively checked to indicate completion
of each step during the communication process.
After the data transfer is completed, Sentinel will display the received field unit version, unit code, number of stations, pager
number, day change hour and pump setup.
If you are using a phone modem to communicate with the field units at a remote site, enter the field unit phone number under
Field Access Phone. If you are using the internet to communicate with the field unit, enter the URL or IP address under
URL or IP Address used if no Phone#. If you will use the paging feature, enter the pager number in the box labeled
Pager Number for Alarms. With a pager number entered, Sentinel is able to send a page notification whenever an alarm
is activated.
Pump Setup
In the Special Data window, you can assign any station to a pump. Type the
station number in the box labeled Pump Output. Each unit has four clusters of
four programs for a total of 16 programs which are discussed in detail in
Chapter 5. Check all programs that need the pump activated. If you do not wish
a program to start the pump, leave the box unchecked.
Synchronizing Time and Data in Field Units
After Special Data is received from each unit, the time and date can be
synchronized in one group operation. From the Group Operations
menu, select Time/Day. The new window will list all units in the current
system that can be synchronized.
By default, all units are selected but you can deselect each unit by
clicking on the box under the Select? column which toggles the
selection from Yes to No. If groups of units have been set in System /
Group Maintenance, the group names will be available for selection
under the Group(s) column at the right side of the window. Select All
and Clear All buttons are also provided at the bottom of the window.
The first five text boxes along the bottom of the window displays the
Time, Day of the Week, Month, Day of Month and Year. These are
the values that will be sent to the selected field units. These values are
based on the time and date information set in the PC. If the values are
not accurate, you can adjust the settings by clicking the Set PC Time
button. This will launch the PC Date and Time Properties window.
Toro Sentinel Central Software User’s Guide
4-7
If the PC has an internet connection, the current time and date information can be checked
by clicking the Get Time button. A browser window will launch which will display the current
time and date (in several time zones) retrieved from the US Naval Observatory website. To
update the displayed information on the browser, click the Refresh button. The PC must be
connected to the internet for this function to work. Use the given information to update the
time and date of the PC and the field units.
The Day Change Hour is optional because you may wish to have different Day Change
Hours for each individual unit. It will not be sent to the selected units unless the check box
under Day Change is activated. Activating the check box will instruct Sentinel to send the
Day Change Hour information. You can change the Day Change hour by scrolling through
the desired Hour using the Up and Down arrows next to the text box.
After completing the information update, click the Send button. Sentinel will then transmit the displayed information to each of
the selected field units.
NOTE: Closing the Synchronize Units Time & Date window without clicking Send will not update the field unit information.
Time / Date - Master Control Panel
After configuring Special Data, you should click Time/Date button in the Master Control
panel to open the Time / Date screen. The time and date set in your PC will automatically
display under Central Computer. The displayed time is synchronized with the computer’s
clock. Clicking the Set PC Time button will enable you to set the computer’s time.
Click the Receive button to read the time and date from the field unit to check its accuracy.
To send the correct time and date to the field unit, click the Send button. Send is only
enabled after Receive is processed. The data in the left column is sent to the field unit,
then received back from the field unit and displayed at the right column for verification. The
Communication Progress window will appear during the data transfer, as for all
communications between the Central and a field unit.
The Schedule Reference Day is simply the date the software was first configured on your
central computer. The date can be updated at the Software Configuration screen. By
using this date as its reference, Sentinel ensures all schedules are on the same schedule week.
Schedule Programming
You can define 16 different schedules for a field unit. All 16 schedules are available
to any of the field units 16 programs. You can type a description for each schedule
in the bottom text field. To switch the view to a different schedule, click the desired
tab (1, 2, 3, etc.) at the top. Each schedule is six weeks long. Sentinel uses the
Reference Date to automatically determine the current week of each schedule.
To select a day for irrigation, click the box corresponding to the day and week. Days
selected for irrigation (Run Days) are blue with a check mark. To deactivate a day,
so no program will run that day, click it to change it back from blue to the
background color. Buttons on the left of the calendar will fill simple patterns; Daily,
Odd days, Even days, every 3rd Day or No Days. You can also click on the day
letter above the column to select the entire column or click the week number at the left to select an entire week. Double
clicking on the same letter or number will deselect that column or row. The Send button will transmit the schedules to the field
unit, which stores all Run Days for each schedule. The Receive button will retrieve all 16 schedules (four for older field units)
from the field unit. Sentinel will not save the received schedule to the database until the Save button is clicked.
NOTE: For older field units with an earlier software version which only support four schedules, the Scheduling Program
window will only display four available schedules. This is determined by the field unit firmware version received in
Special Data.
The Print button will print an image of the selected schedule on your default printer.
4-8
Toro Sentinel Central Software User’s Guide
The Calendar button displays a schedule outlook for the current month with the
selected schedule plotted. You may notice on your screen that the first schedule week
is not necessarily the first week of the month on the calendar. This is because the
schedules are six weeks long, so the first week may occur at different positions on the
calendar, depending on the month. This relationship is determined by the
Reference Day.
From the Calendar screen, you can view the irrigation schedule of any month with
any or all of the 16 schedule patterns. Run Days (days selected for irrigation) are
indicated with a blue box under the calendar day. Days without any blue box
designated to them are disabled for irrigation.
You can also add your own labels to the days. To do so, click the Edit Notes button.
This will allow you to enter a 30-character description, such as a holiday name, in the
yellow space at the bottom of each day. (Only about 11 characters will show.) You can
pick the Lock Notes button to freeze these labels temporarily, but SAVE must be
clicked to assign them to the date. When saved, the labels will always appear on the
assigned calendar date on all schedules of all field units. Once saved, the notes will
appear against a green background.
Except for the notes below each day, nothing else you do on this screen can be saved
or affect the schedules of the programs. This screen is for viewing the schedules in
relation to the calendar format.
You will see how these schedules are assigned to the programs in Chapter 5.
NOTE: Receive Special Data must be performed first before setting Schedules. If it is
not, field units with 16-schedule capability are assumed to have only four-schedule
capability by default.
Chapter 5 : Programming Field Units - Auto Programming
Auto Programming
The Auto Programming window (under Master Control
Panel / Programs) is the hub of the entire Sentinel system.
This is where you can control the automation of starting,
running, stopping and repeating all stations of each field unit.
Each field unit can have 16 programs. Each program can use
any of the 16 custom schedules defined in Schedule
Programming. The 16 programs are divided into four clusters,
A through D and each cluster having programs 1 through 4.
Every parameter on the current selected program must be
configured and saved before proceeding to the next program.
You can pick a different cluster and program by clicking the
desired letter and number in the upper left corner of the
window. A cluster of four programs can be transmitted to the
field unit at one time or after all programs are saved, you can
send all 16 programs to the field unit at once with the Automatic Communications function described in Chapter 11.
NOTE: If planning to use the Flow Optimization feature (Floptize), only six programs can be used due to the field unit’s
maximum simultaneous operation of six stations. Refer to the section Start TImes and the Flow Optimizing Parameters for
more information.
The schedule will determine the days the program will run. The field unit will not run a program on a day that
is not selected in the assigned schedule. To assign a schedule to the program currently selected, toggle the
up/down arrow at the left side of the schedule number. The schedule description is displayed at the right side
of the number. You can show and hide the entire schedule for reference by clicking the Show Schedule
button. The button changes to Hide Schedule when the schedule window is activated.
You can assign the Primary and Secondary descriptions for each program at the top center of the Auto
Programming window (beneath the Unit description). Use a description that pertains to the program selected. Once a
description is typed and saved, that description is available as a selection for other programs to use. When you select a
different program and click the down-arrow at the right side of one of the description boxes, a list of all descriptions that have
been saved will be displayed for selection.
Toro Sentinel Central Software User’s Guide
5-9
Try to choose phrases for the Primary descriptions that describes large
categories of programs, such as types of landscapes or locations. Use the
Secondary Descriptions for a different kind of breakdown such as methods.
In the picture above, the primary description groups programs by landscape,
while the secondary describes methods. Thus all programs for Normal
irrigation of Fairways are quickly selected by these descriptions.
Unfortunately, once a description is entered and saved, you can not delete it
from the list due to the relational nature of the Sentinel database. However,
you can always add new descriptions if you need more selection.
To the right of the descriptions, you will see two indicators, Data Source and Changes made, yet to send. When you open
the Auto Programming window, programs are read from the Sentinel database from the PC hard drive, thus the Data
Source reads Disk. After you receive data from the field unit, the Data Source will change from Disk to Field. This indicator
enables you to determine where the displayed program data originated.
When any parameter on the Auto Programming screen is altered, a checkmark will appear in the check box next to
Changes made, yet to send. It will remain checked until you send the updated program to the field unit (either from this
window or with Automatic Communications described in Chapter 11) or manually clear it by clicking the checkmark with
the mouse. This is a reminder that changes have been made but have not been sent to the field units.
Program Slots
Referring to the STATION ORDER AND RUN TIMES section
of the Auto Programming window (accessed by clicking
Programs in the Master Control Panel), note that there are
48 slots represented by boxes with numbers inside and next
to them. These slots represents the run time slices that form
a program. The number inside each box is its own station
run time in minutes. It is important to understand that the
number next to each box is not the slot number but the
station number or valve number that is assigned to that slot.
The station number or valve number refers to the field
terminals that the field unit controls. Initially there is a one-toone correspondence, station 1 is assigned to slot one,
station 2 is assigned to slot two and so forth. You can
change this and assign any station to any slot and even
assign the same station to a number of different slots. When you first start using Sentinel, all of the run times in the boxes are
zero and all the stations are listed in order alongside the slots. The slots determines the succession of stations that will run in
the given program.
To change a run time and/or assign a station, click on the box. The Edit Slot
window will open. You can change the Station Number and enter the Run Time
in minutes at the corresponding box. The other activated text boxes in the Edit
Slot window will depend on the station information entered in the Zone Data
screen. This is explained in Chapter 6 in greater detail.
For now, we will only deal with the Run Time entered in minutes. As an example,
suppose we change the station number 6 to 1, and enter a run time of 1 minute.
Save this change by clicking OK, then Close. The result is shown below. Now
there are two slots with station 1.
Now we’ll see how a number of slots can be edited in rapid succession. Click slot box 7 with the mouse and an Edit Slot
window will open. After proper changes are made in the Edit Slot window, click OK to save it. Instead of clicking Close, click
Previous or Next to edit the slot to the left or right of the currently selected slot. As an example, we can start with slot 7. We
assigned station 2 to slot 7 with 5 minutes run time, clicked OK and Next to move up to slot 8, changed it to 3, and so on.
We could proceed indefinitely and click Close after editing the last slot desired. There is an even faster way to edit a number
of slots. You can change the run times of any number of slots simultaneously. To select a group of slots for editing, place the
mouse cursor directly over the station number of the first desired slot. When clicked with the mouse, the station number will
change to white to indicate that it is selected. You can repeat this for any slots. To select several at once, after clicking the
first station number, hold down the shift key and move the mouse to the station number of the last desired slot. All of the
slots in between both numbers will be selected and the corresponding station numbers will change to white.
5 - 10
Toro Sentinel Central Software User’s Guide
Now click the Modify Run Times button under Station Operations at the right side of the
screen. The Modify Run Times window will open in front of the Auto Programming screen. It
has several options, but for now, note that you can simply enter a time in minutes and hit the
Replace button. All selected slots will have their run time changed simultaneously. The new run
time will replace the old run time for all selected slots. You can also pick the Percent Scale
button to reduce or increase run times of the selected stations by the same percentage. The ET
option will be discussed in Chapter 10.
For example: Select slots 1 through 8 by holding the shift key while clicking 1 and 8. If 3 is
entered in the modifier text box, clicking the Replace button and OK will replace all the run times
of slots 1 through 8 with 3 minutes.
The Renumber Highlighted Stations command allows you to replace the selected station
numbers with 0 or any station number sequence desired. Simply enter the first number in the
sequence and the remaining stations will be numbered sequentially.
NOTE: It is not necessary to reset the station number to 0 to prevent the station from running if
the station runtime is already set to 0, which causes Sentinel to ignore the slot.
For example: Select stations 6 through 10 by holding the shift key while clicking on 6 and 10.
Click Renumber Highlighted Stations and enter 1. Stations 6 through 10 will automatically be
renumbered with 1 through 5.
Modify the run times of the newly
renumbered stations to 5 minutes.
The Search and Highlight command is discussed at the end of Chapter 6: Zone Data, which explains the process of
selecting stations by descriptions entered in the Zone Data screen.
Click Clear Highlights to deselect the five slots and change the station number color back from white to black. If this were
transmitted to the field unit along with a Start Time, station 1 would run for 3 minutes, followed immediately by stations 2
through 5 for 3 minutes each, in order. It will be immediately followed by station 1 again for 5 minutes this time and then
stations 2 through 5 for 5 minutes each. Though more stations are assigned to other slots, they are ignored since they have
zero run times.
Start Times
You can assign up to eight start times to each program. The program will start at the
earliest start time within the Water Window, and re-start at each additional start time. If
the time between two different starts is less than the total duration of the program, the
boxes will turn red to warn you that a conflict exists and the start time will be ignored.
IMPORTANT: Do not assign the starts such that more than the maximum number of
programs will be scheduled to run simultaneously, as the controller firmware will only
allow up to the maximum station number of outputs that are on at one time. Assigning the
same start time to more than six programs will be displayed properly when you run a flow
graph, but only the first six programs will run. Any remaining programs having the same
start time will not run at all. (This is a hardware limitation.)
The order number of the Start Times is not important. In the first picture above (Water Window set at 8:00 AM to 8:00 AM),
the first program will start at 11:00 PM because it is the earliest start time according to the Water Window. The program will
start again at 1:00 AM and again at 3:00 AM. The Priority order number next to the text boxes do not apply here. These are
used by the Flow Optimizer which is discussed in Chapter 15. If utilizing the Flow Optimizer, ONE AND ONLY ONE start
time must be entered, but the value is not important because the Flow Optimizer will re-assign all start times. In this case, the
Priority number is important. The order of the text field that the start time is entered determines its priority within the entire
system for optimization.
Toro Sentinel Central Software User’s Guide
5 - 11
Percent Scale
The Percent Scale next to the Start Times can adjust the
percent scaling of the program Run Times. You can enter
any value from 0 to 250 or adjust the value by clicking on the
up/down arrows. 100 is normal, meaning 100 percent of the
actual run time. A smaller value will reduce the run time of
each slot to that percentage and a larger value will increase it.
For example, 200 would double the run times. This factor
applies to all slots for the selected program, and therefore to
the total duration (Start Duration) of the program. The run
times in the slots will remain unchanged on the screen
because the percentage is applied in the field unit after it
receives the program. However, the Start Duration is
updated to reflect the percent scaling for an instant reference.
For example: With a percent scale of 200%, stations 1 through 5 assigned in slots 1 through 5 will run for 6 minutes each
(200% of the 3 minutes entered in slots 1 through 5), then another 10 minutes each for stations 1 through 5 assigned in slots
6 through 10 (200% of the 5 minutes entered in slots 6 through 10), for a total of 80 minutes, or 1 hour and 20 minutes. This
scaled-up total applies to all three start times.
Water Window
The Water Window is the period of time during each day when irrigation is allowed. The field unit will disable irrigation
outside the water window time. In the picture above, the start and end of the Water Window are exactly the same, from 8:00
AM to 8:00 AM, so irrigation is allowed for 24 hours each scheduled day. If the end of the Water Window was changed to
11:30 PM, the program will never finish. irrigation will cease at 11:30 PM, half an hour after the 11:00 PM Start Time and the
program is still 50 minutes short of being completed.
If you are required to complete all irrigation within a certain daily period, you can set the water window to that length. If
necessary, you can use Percent Scaling to adjust the duration of the program until it fits within the watering window.
Continuous Run
Continuous Run is a special case of the Water Window, in which all non-zero slots will continue to run from the beginning
to the end of the Water Window. To work this way, the Water Window must end at least 1 minute short of a full day. The
program will start at the beginning of the Water Window and repeat continuously until the end of the Water Window. The
Sentinel Flow Optimizer cannot optimize programs using the continuous run option because it optimizes the system through
re-assignment of start times. Therefore, Continuous Run programs are automatically excluded from optimization.
Repeats
The Repeat option will automatically repeat the program for
the specified number of times. You can enter any value from 0
to 250. Zero will let the program run once and never repeat, 1
will repeat it once, and so on. If repeating the program causes
the total Start Duration to exceed the time between two Start
Times, the Start Times will turn red to warn you. In the
picture, percent scaling was already set at 200%, doubling the
original Start Duration of 40 minutes to 80 minutes. The
repeat again doubled the total to 2 hours and 40 minutes,
exceeding the time between starts.
Delay
You can enter a Delay between repeats, in minutes, of any value from 0 to 255 (4 hours, 15 minutes). After the first time the
program runs, the program will wait for the specified amount of delay time before repeating. The program will then run again
and delay the same amount of time and so on.
5 - 12
Toro Sentinel Central Software User’s Guide
Program Transmission
In the example picture, we have adjusted the Percent Scale
factor back to 100, added a 20-minute delay, and changed
two of the Start Times, just enough to allow the program to
complete its cycle between starts. Now we have a workable
program but it will not run yet because the field unit is not
aware of the program changes. Clicking the Send Cluster
button will open the Communication In Progress window
and transmit all programming data seen on the Auto
Programming screen to the field unit, where it is stored in
tables.
This includes everything you see on the Auto Programming
screen with the exceptions of the unit and program
descriptions. It includes the Start Times, Schedule
assignment (the actual schedule must be sent from the
Schedule window), Percent Scale, Repeats, Delay, Water Window start and end, Continuous Run option, Station Order
(station/valve number assigned to each slot) and Run Times of all slots. Furthermore, note that the command is Send
Cluster, which means the entire cluster of all four programs is sent at the same time. Not just the data you see on the current
screen is sent, but all the data for the other three programs in the cluster are sent as well. In this case, all programs of cluster
A from A 1 (shown), A 2, A 3, and A 4 are transmitted at the same time. This enables you to define four different programs,
then send them all at the same time in one operation.
Once the data is saved in the field unit, it can operate on its own. In the example above, the program will begin at the next
start time to occur after the unit receives the program (if it is a scheduled run day). Slot 1 will run station 1 for 3 minutes, slot
2 will run station 2 for 3 minutes, and so on, until slot 10 runs station 5 for 5 minutes. Slots 11 through 48 will be ignored
because there are no run times. The program then executes the 20-minute delay, running no programs. After the delay, the
first repeat begins the whole cycle again, followed by another delay and the second repeat. Then the unit will wait for the next
Start Time, unless one of the other 15 programs takes over. Remember: Any program of any cluster can control any
combination of all the field unit stations.
The Receive Cluster command is available for two reasons. You may wish to receive programs to verify that programs sent
to the field unit were transmitted accurately. Also, if you have upgraded the Sentinel software, this is a handy way to retrieve
the programs from field controllers and save them into the new database in the Central computer. Like the Send Cluster
command, Receive Cluster will open the Comm Progress window, but instead of transmitting, it will receive all four
programs of the selected cluster from the field unit, and replace what you see on the screen with the program received. The
received data will replace the cluster (four programs) in the Central computer when you click the Save command.
Copy Programs to Field Units
Depending on the situation, similar programs might be needed in
multiple field units. In this event, Sentinel provides a utility to copy all of
the programs from the currently accessed field unit to all units selected
in the database.
To copy the programs, click the Copy to Unit button from the Auto
Programming window. A new utility window will open with a list of all
field units in the current irrigation system. By default, no field unit is
selected. Select one unit at a time by toggling No to Yes under the
Select? column. Select All and Clear All buttons are also provided at
the bottom of the window. If groups of field units are already setup in
System / Group Maintenance, all units in a group may be selected by
clicking the group name from the list under the Group(s) column at the right side of the window. After the selection process is
complete, click Copy and Sentinel will copy all of the program data (run times, start times, etc.) from the currently accessed
field unit to any units selected in the database. Be aware that the new data will overwrite all data previously stored in the
database for all the selected field units. Once the program data is successfully copied into the selected field units,
modifications can be made by opening the Auto Programming window for each unit individually. After programs are copied,
they can be sent to the field units with the Send Program Changes command or with AutoComm, both described in
Chapter 11.
NOTE: Copying programs to field units will copy the selected schedule number, start times, run time, percent scale, water
window, repeats, delay, state of continuos run, ET check boxes and station order. It will NOT copy the Primary and the
Secondary descriptions of the programs and it will NOT copy the schedules and any other data found in other utility widows
of the Master Control Panel such as Zone Data.
Toro Sentinel Central Software User’s Guide
5 - 13
Program Information
Clicking the Information button in the Auto Programming window will display a table that lists the start time for each slot
within the selected program. The Water Usage column at the right side of the table gives the total gallons used by each
station on a single run, not multiplied by the number of starts nor repeats. Thus, the totals at the bottom are for one cycle,
one pass through the 48 slots. Water Usage is based on the run time for each slot and the expected flow entered for the
corresponding station in the Zone Data screen.
The Cycle Graph displays a graph of one program cycle, as shown below.
Chapter 6 : Programming Field Units - Zone Data
Zone Data
The Zone Data screen allows you to set certain parameters to each individual station of the field unit. As with Schedule
Programming and Auto Programming, the Zone Data screen is accessed from the Master Control Panel for any specific
field unit selected from the Unit Selection screen.
Shown in the figure is a blank Zone Data screen
before any data is entered. It provides, for each
station in the unit, rows where you can enter the
Station Description, Type Description, Expected
Flow in gallons per minute, Maximum Flow to limit
water consumption in gallons per minute, Plant
Factor, Application Rate in inches per hour and
station mapping information if a Map To Universal
control unit is used (Mapped Unit and Mapped
Station).
You can also map one or more stations to stations in one or more universal units, specifying which unit and station within that
unit to assign to each station. In the last column, you can flag a station for your own purposes and the station will appear
highlighted in the corresponding slot in the Auto Programming window.
To enter a Station Description or Type Description, click the corresponding text box underneath the title and within the
correct station number row. This will open a data entry box where you can type any description up to 20 characters. Click OK
to save the description and close the text box.
Similarly, to enter numerical data, click on the desired
square and a data entry box will open. After typing a value,
click OK. The range of values allowed for each of the
parameters is shown in the table:
Expected Flow
Maximum Flow
Plant Factor
Minimum
0
0
0%
Application Rate
0
Maximum
32,000
32,000
250%
100
NOTE: If the satellite station will be operating in conjunction with a Map To Universal control station, the total expected flow
for both stations must be entered.
The Expected Flow and Maximum Flow are also limited by the system Maximum Flow that is set in the System / Group
Maintenance, System Defaults. The maximum value allowed is the lesser of the value between this chart and the System
Maximum value.
If the satellite station is used in conjunction with a Map To Universal control unit, enter the 3-digit unit code of the mapped
unit in the Mapped Unit column. In the Mapped Station column, enter the corresponding station number being mapped to in
the Map To Universal control unit.
NOTE: If you wish to operate only a Map To Universal station, simply assign that station to any satellite station which is not
currently being used to operate an irrigation control valve. Enter the program assignment and run time information as you
would for any other satellite station.
6 - 14
Toro Sentinel Central Software User’s Guide
Sending, Receiving and Storing Zone Data
There is a notable difference between the description column and the other columns. The descriptions are only used in the
Central software and are stored in the Central software database of your PC. They are not transmitted to or stored in the field
unit. The Expected and Maximum Flow, Plant Factor, Application Rate, Mapped Unit and Mapped Station are all used
by the field satellite unit as well as the central software, and are stored in both places. If the Send command is clicked, these
values are transmitted to the field unit, where they will overwrite any previous Zone data. Likewise, if the Receive command
is clicked, the Zone Data from the field unit is transmitted to the Central computer, where it overwrites the six columns in the
Central software database (not affecting the descriptions).
NOTE: The last column in which you can flag a station for your own purposes is treated like the descriptions. They will not be
transmitted nor stored in the field unit.
After entering the Zone Data, clicking the Save command will store it in the Central computer’s database but not in the field
unit. Only when you click Send will the new data be saved in the field unit.
ET Based Watering
The field unit will calculate run times for each station based on the Application Rates and ET (evapotranspiration) value that
reside in the unit. In order for this function to work properly, the ET Based Watering check box must be selected in the Auto
Programming / Program window. Only stations with non-zero application rates will have their run time adjusted based on
ET. The Zero App Rates command is provided so you can quickly reset all Application Rates to 0 before transmitting the
Zone Data to the field unit. ET based watering is explained in Chapter 10.
The pictures below illustrates how you can enter a value once and have it applied to several different stations. This will work
for any column - descriptions as well as numerical data.
Zone Data - Selecting Multiple Rows (Stations) to Enter a Common Value
Click a row under Select. Click additional desired rows. Click the column to change under any selected row. Enter the new
value. The value is automatically entered in each selected row. Click Clear Selects before selecting different stations for
another value.
Once you have entered all the data and descriptions for all stations, it makes selection in the Auto Programming screen easier.
While in the Auto Programming screen for the same unit, clicking the Search & Highlight button under Station Options
opens a data entry box with a list of available descriptions. Picking a description from the box will highlight all station numbers
assigned to slots that contain that description. In the picture below, the Turf/2001 type description was picked. As you can
see in the Zone Data screen above, this matches stations 4–8 and 11–13. Stations 6, 7 and 8 are not seen in the Auto
Programming screen because they are not assigned to any slots in the selected program. Stations 4, 5, 11, 12 and 13 will be
highlighted, so clicking the Modify Run Times command provides simultaneous editing of all highlighted stations.
Toro Sentinel Central Software User’s Guide
6 - 15
In the series of example pictures to the right,
Application Rates were entered in the Zone
Data screen for some stations. This
demonstrates the full potential of the Edit Slot
window introduced in Chapter 5.
Now you can see the description and zone data
for the selected station as you enter the run time.
Moreover, you can enter any one of the top six
variables, and Sentinel will automatically
calculate the other five.
In the Inches / Program text field, 1 (inch) was entered and the software
automatically calculated the Run Time and total Gallons of water. The three
boxes in the top right corner account for additional starts and repeats of the
same program, so they register the total values for a day. The three boxes to
the left only apply to one start with no repeats. A total run time for the day
could be entered in the top right box and it would be divided by the total start
times and repeats to obtain the Run Time for the slot in the box to the left.
The other variables are similarly related.
Chapter 7 : Programming Field Units - Data Retrieval
Data Retrieval
The Data Ret. (Retrieval) screen, accessed from the Master Control Panel, is
only used for units with a flow meter or alarm attached to the field unit. The
screen is not available if Data Retrieval Installed? is not checked in the Special
Data screen.
On this screen, you can enter and transmit the conversion constants for a flow
meter to the field unit. K is the multiplier to convert clicks per second in a flow
meter to gallons per minute. The Offset is added for adjustment.
If you have a phone modem connected to the field unit’s serial port, you can use
the Sentinel pager option. Turn on Flow Watch and specify the paging for any of
the four alarms on the screen. Station Overflow occurs when the flow in a
station exceeds the maximum specified in Zone Data. Master Shutdown occurs
after three Station Overflow events. Unexpected Flow occurs when a station is
off but the flow meter detects a flow. Minimum Shutdown occurs when the flow
in any running station is less than the value specified in the Minimum Flow box.
The Alarm Input is for your own custom alarm. Select Open if your dry contact switch is normally closed and vice versa. You
can choose Shutdown and specify one or more Clusters of Programs to shut down if an alarm occur. You can also choose
Start and specify one or more Clusters of Programs to start if alarm occurs. Moreover, you can check the Send Page
option if you have a phone modem connected to the field unit’s serial port. With this option enabled, Sentinel will send an
alarm page to the specified pager in Special Data whenever an alarm is activated.
7 - 16
Toro Sentinel Central Software User’s Guide
Chapter 8 : Field Unit Status
Four status screens can be opened from the Master Control Panel for any field unit. These are the Alarm Status, Output
Status, Program Status, and Station Days Off.
NOTE: The Output Status window will launch when Send is clicked on the Master Control Panel.
Alarm Status
Similar to the unit code label in each window of the Master Control
Panel, the Alarms button will be color-coded with green, yellow or red,
depending on the alarm status received. If an alarm was received during
any communication from any of these screens, it will turn red. Yellow
indicates shutdown for a Rain day. Green is the normal state.
If the Receive button is clicked, Sentinel will read the states of the Flow,
Current, Power Failure, Missed Start and Mapped Unit Comm Alarms
for every station of the unit including the master valve. Any alarm will
result in an X in the corresponding box on the screen. The Power Failure
Alarm is received every time the field unit loses power, which may include
the initial set up of the entire system. In the event of a power failure, the
field unit records the time the power failed and the time it was restored.
Clearing Alarms
To clear the alarms in the field unit, click each checked box to remove the X, then click the Send button. The red labels will
not revert to green until the Master Control Panel is re-opened.
Output Status
The status of each field unit output station is represented graphically on the Master Control Panel. Each station is
represented by a small numbered, blue text box. It is initially located in the upper left corner. These symbols or icons can be
arranged automatically by clicking Unlock and Arrange. If you have displayed a picture or map on the Master Control Panel
as described in Chapter 4, you can arrange the icons within the image to represent their actual locations in the field. Select
Lock to save the positions of the icons.
NOTE: You might only see one icon during the initial view before arranging the icons. This is because the icons are stacked
on top of each other as a default arrangement. Clicking Un-Lock and Arrange will organize all the icons in rows and columns
for full view.
To relocate the icon, you must first select Un-Lock. Click on the icon and then click at the desired spot where the icon should
be positioned. Dragging the icon will not work. Proceed to locate all of the icons as necessary. When finished, select Lock to
save the icon positions.
Double clicking a station number will select it for manual activation, and it will blink yellow to confirm selection. Double
clicking the station again will deselect it. Program activated stations will blink green and cannot be deactivated from this
window.
Toro Sentinel Central Software User’s Guide
8 - 17
The Output Status screen (accessed when the Send button from the
Master Control Panel is clicked) is used both to view the status of
each output, which stations are on and which are off, and to manually
turn stations on or off. A station that a program started is under
automatic control and cannot be turned-off here. The sum of the
Actual Flow and Theoretical Flow (Expected Flow from Zone Data)
for the selected stations are shown at the bottom. The Station
Description and Type Description (also from Zone Data) are shown,
at the top of the window, for the last station selected. In the example
picture, the Actual Flow is absent because this field unit does not have
a flow meter to measure it. The picture illustrates three different
possible indications of a station’s status. Station 26 was started by an
automatic program. This is indicated by the black colored number.
Stations 1 and 24 were started manually from this screen. This is
indicated by the white colored numbers. To turn-on a station this way,
enter the run time in the column at the right side of the screen next to
the station number, then click the Send command to start it. Station
48, indicated by the blue colored number, controls a pump under automatic program.
Receiving Output Status
Click Receive on the Master Control Panel to quickly receive the status of each station from the field unit. Icons of stations
running under manual control will blink yellow. Those started by an automatic program will blink green. The yellow-blinking
icons will stop blinking when the remaining runtime has expired. However, the green-blinking icons will continue to blink until
data is received from the field controller again to verify a changed state of the stations under automatic control.
Sending Manual Output State
There are two ways to manually turn on or off stations from the central computer. From the Master Control Panel, you can
double click any of the icons to activate or deactivate the stations. Clicking the Send button will open the Output Status
window which verifies the selected states and allows you to set the time remaining (in minutes) for each station before
sending the data. Stations will not turn on manually in the field unit until you click Send in the Output Status window.
Another procedure is to check the box next to the station numbers in the Output Status window to set on or off state.
Runtime can be set at the right side of the utility window. Send must be clicked before the states will change in the field unit.
Program Status
After the Program Status is received from a field unit, the screen
can indicate which programs are running, which slot is currently
executing within each running program, which stations are
assigned to the executing slots, the remaining run time for these
slots, repeats and starts remaining for the running programs, rain
days remaining if a program is shut down, and whether the
program is running within it’s assigned watering window.
In the example, the unit code background turned yellow after the
Receive command was executed, indicating that one or more
programs was shut down for one or more rain days (just as it
would turn red to indicate an alarm). The yellow box under the
Rain Days column indicates that Cluster D, Program 1 (D 1) is
the only program shut down for 1 day. It also indicates that
Cluster B, Program 1 (B 1) is running slot 3, which is assigned station 3 and has 1 minute of run time remaining and 1
repeat remaining. Also, Cluster C, Program 1 (C 1) has 11 minutes of run time remaining on slot 17, which is running station
17. Both programs are running within their assigned Water Window.
8 - 18
Toro Sentinel Central Software User’s Guide
Semi-Auto Start
You can also start any programs as shown in the picture. When
you click on the Start option next to a program, (A 2 in the
example picture) the Semi Auto Start data entry box opens
where you can specify which slot to begin the cycle and whether
the Water Window is In or Out. This is known as a Semi Auto
Start. You can select any number of programs to start, then click
Send to transmit to the field unit. To stop a running program,
select the Stop option next to the Program, then click Send. Click
the Print Image button to print the program status window and
the Print Data button to print the information in tabular format.
The All Off command will simultaneously select Stop for every
program. You can then click Send to immediately shut off all
programs at once.
Station Days Off
From the Master Control Panel, you can specify stations
within a field unit to shut off for a specified number of days.
Click the Stn Days Off button to display the Station Days
Off Status window. Simply enter the desired number of days
off in the text box next to the station number. Click the Send
command button to transmit the information to the field unit.
Click the Receive command button to verify which stations
are already off in the field unit.
Chapter 9 : Field Unit Reports
Station On Times Report
Click on the Stn On Times command to display the Station
On Time Report. From this screen, click the Receive
command to read the current data from the field unit. The total
time in Hours and Minutes that each station operated since
the last Day Change time will be displayed.
These figures are not stored in the central database. That is
the reason why no Save command is provided in the window.
The data represents the actual values accumulated in the field unit which can change while a program is running.
Program Run Times Report
The Program Run Times Report displays the total expected
run time for each of the field unit’s 16 programs during each
day of any chosen week of the current 6-week schedule
period. The actual run time can be received from the field unit
for comparison.
NOTE: Before using this report, you should Receive each
cluster of programs from the field unit in the Auto
Programming window, Schedule Programming window and
Special Data window. It is also advisable to Receive and
Send the Time / Date to synchronize the field unit with the
central computer. These steps will ensure agreement between
the field unit and the central computer database in case a
change in either component was forgotten.
Upon opening the Program Run Times Report window, you
should select the current Schedule Week and Day of the
schedules.
Toro Sentinel Central Software User’s Guide
9 - 19
Next, click the Show Expected button to display the total of the run
times programmed for each day of the current week. As shown in the
picture, the total times for completed programs before the day change
time are shown with a peach background. If a program runs past the day
change time, that portion listed on the following day will have a light
magenta background indicating the overlap. If a program is set on
continuous run with a Water Window starting before and ending after the
day change time, it is displayed as overlapping every day. If overlap from
a previous day is added to run time scheduled for a given day, the
background will be light blue.
To display a report of run times that actually occurred from the field unit,
click the Receive command. Since all the data received is actual, it will
appear with a white background.
On the right side of the screen, the Base Run is the total length of one
cycle of the program, accounting for repeats. The Total Run is multiplied
by the number of starts. Next Day lists that portion of run time remaining after the day change time, which continues to run
into the next day.
After both expected run times and the report received from the field unit have been displayed, you can click the Compare vs.
Expected button to compare them. Now you can quickly see if programs actually ran longer than expected, less than
expected, or not at all. A green background indicates no difference in the programmed time and actual time of a program for a
day. Yellow means a program ran for less time than expected. If it did not run at all, it is labeled OFF for that day. This could
be due to rain shutdown or a manual stop at the field unit or from the Program Status screen. If the actual run was longer
than the time programmed, the background is red. Such cases may occur if a program was manually started at the field unit,
or if a program was shortened in the central computer without transmitting the change to the field unit which continues to run
the previously stored longer time program. For this reason, receiving the programs is recommended before viewing the
report.
As with any window with a Print button, clicking this button sends an image of the window to your default printer.
Water Consumption Report
NOTE: In order to utilize the Water Consumption Report feature, a
functional flow meter must be connected to the field unit. In addition, the
Data Retrieval Installed? option box must be checked in the Special
Data window.
Clicking the Water Consumption button displays the Water
Consumption Report which shows the total number of gallons
consumed each day of the current week, as well as the total gallons
consumed by the field unit each month of the previous year and each
month of the current year. All of the data is stored in the field unit, so no
save command is needed, but you must click the Receive command to
retrieve it.
Clicking any month at the left of the screen immediately calculates the
statistics shown under Quick Stats. These includes Year to Date totals in gallons consumed thus far from the beginning of
the year to the month selected. Last Year to Date gives the total for the same month of the previous year for comparison.
Percent of last year is a direct comparison of these two values. Month to date gives the total consumption for the month
selected or consumption so far if the current month is selected. This month, last year is the corresponding value for the
previous year for the selected month. Percent of this month, last year compares last year’s data to the present year’s data.
Click Graph Monthly Consumption to display a bar graph. The graph has blue bars for each month of the previous year,
and green bars for each month so far this year. The height of the bars represents the total water consumption in gallons for
each month. You can print the graph with your default printer.
9 - 20
Toro Sentinel Central Software User’s Guide
Flow Graph
The Flow Graph Report requires a flow meter connected to the
field unit. The screen is unavailable unless the Data Retrieval
option is selected in Special Data. This report graphs the
instantaneous number of gallons the field unit has consumed
throughout any four hour period of the current or previous day.
Clicking Receive will read the flow data for the entire day
selected. Clicking Yesterday or Today will also instruct Sentinel
to receive a full day’s flow graph. Once Today’s or Yesterday’s
data is received, any one of the four hour periods can be
selected to display.
Rain Fall Report
The Rain Fall Report receives and displays daily and monthly rainfall
data in inches recorded in the field unit if a rain gauge is connected.
This report is similar in appearance to the Water Consumption Report
and ET Report, with similar functionality of the Quick Stats and Graph
Monthly Rain.
If your current system uses a GroWeather Station, the total rain
amount for Today and Yesterday are displayed immediately upon
opening the Rain Report. If the central computer is connected directly
to a Campbell Weather Station, it will read these values from the
weather station, which will take a few moments before opening the
utility window, and a command button will be available to access the
weather report.
Clicking the Receive command reads the daily and monthly rainfall
values from the beginning of the previous year to the present day. You can also enter values on the screen and send data to
the field unit. However, as a precaution against inadvertently overwriting data in the field unit, editing and sending data is
temporarily disabled when this screen is opened until the Receive command is executed to display any data already in the
field unit.
Once Receive has been executed, editing is allowed and the Send command is enabled.
Clicking Graph Monthly Rain produces a bar graph which you can print on your default printer.
If you have a GroWeather Station or a Campbell Weather Station, you can send the value for today’s rainfall to the
controller. Enter the number seen from the Today box under Weather Station Rain to the Unit Rain Today box. You can
also copy and paste it in. Just drag your mouse across the number (with the button pressed) to highlight it, hold the Ctrl key
and press the C key to copy; then click inside the Unit Rain Today box, hold the Ctrl key and press the V key to paste the
number in. If you are irrigating based on ET, this number is used in the field units along with the daily ET values. Chapters 10
and 11 show you how these numbers can be transmitted to all units automatically.
ET Report
The ET Report is similar in appearance to the Rain Report and is presented in detail in Chapter 10.
Toro Sentinel Central Software User’s Guide
9 - 21
Chapter 10 : ET Based Watering
Evapotranspiration (ET) is the total discharge of water by direct
evaporation from soil and rock surfaces, and transpiration from
growing plants. Sentinel has extensive provisions for irrigation
based on ET.
ET information can be obtained from one of four sources. The
source must be specified in the Software Configuration screen
as shown at the right. (Refer to Chapter 3 for additional
information.) ET data can be manually entered in a field unit or in
the central database. An ET gauge and a rain gauge can be
connected to a field unit, or periodic ET values in inches can be
recorded by a GroWeather station or a Campbell Weather
Station.
Manual Entry
If ET values are to be entered manually, the first option, Copy default ET from
Unit # should be selected. Daily ET values must be entered in the field unit
specified here, or entered in the ET Report screen for that unit and sent to that unit.
Once the daily value is stored in the default unit, it is available for Sentinel to read
from the database at the end of the day and transmit to all other units.
ET Gauge
If an ET Gauge is connected to a field unit, the second option should be selected.
The unit code for that unit is entered here. That field unit will be polled to transmit
ET to other units. If a rain gauge is also connected, daily rainfall measurements can
be used in conjunction with ET.
GroWeather Station
If you have a GroWeather Station, select the third option under the ET / Rain
Source. A GroWeather Station must be selected for the current system in the
System / Group Maintenance screen, as shown in Chapter 3. The
GroWeatherLink software must poll the weather station from your central computer,
the same computer where Sentinel is installed. Sentinel will read and sum the ET
values for the last available day from the GroWeatherLink database and transmit the
last daily total to all field controllers in the current system.
10 - 22
Toro Sentinel Central Software User’s Guide
Campbell Weather Station
If you have a Campbell Weather Station, select the 4th option under the ET / Rain
Source. A settings window will open. Set the correct Comm port at which the
Campbell Weather Station is connected. Do not change any other settings without
instructions from Toro’s technical support staff.
NOTE: During Sentinel 2X installation, the file named PBD.INI is also written within
the sentinel files. This file contains the information for this settings window and if
deleted, the window will not launch.
If selected, Campbell Weather Station will become the ET source for all field units.
Sentinel will read the ET values for the last complete day directly from the Campbell
Weather Station before sending it to the units.
Both GroWeather and Campbell Weather stations have
updated weather reports which can be opened from the
Sentinel menu.
The diagrams on page 24–25 shows how ET watering is
automatically accomplished when using Sentinel
AutoComm (described in Chapter 11) in conjunction with
one of the ET sources above. In this case ET and rain data
are recorded in one field unit with a rain gauge and ET
gauge throughout the day. The total ET and rain values for
the day are retrieved automatically from the field unit by the
central computer at the time set in Sentinel AutoComm.
Immediately after this, the same values are transmitted
from the central computer to every unit in the current
system. The time required to finish these transmissions
depends on the number of units in the system, and may exceed an hour for very large systems. At the day change in each
field unit, the run time for each ET slot (for which the assigned station has an application rate set in Zone Data) is adjusted to
compensate for the new ET and rain values. Toro recommends setting the ET Send Time about an hour before the day
change. In the event of a communication failure, each unit’s default ET and rain values are used.
Toro Sentinel Central Software User’s Guide
10 - 23
ET Based Watering w/ ET & Rain Gauge
(Example with ET send time at 10:00 PM and Day Change at 11:00 PM.)
1
All day - ET and Rain Accumulated in One Unit
Unit w/ ET Tracker and Rain Gauge
Prog A1
0
Rain
Bucket
All day
Default ET
(0)
ET - Rain
compensation for
each program to
date*
Rain Today
(.01)
ET Today
(.12)
All day ET Gauge
Prog D4
2
10:00 PM - Transmissions at ET Send Time
Unit w/ ET Tracker and Rain Gauge
Prog A1
0
Rain Today
(.01)
ET - Rain
compensation for
each program to
date*
Default ET
(0)
ET Today
(.12)
10 PM
10 PM
Prog D4
Rain Today
(.01)
ET Today
(.12)
Central Computer
Notes:
* This is the value used to water the next day.
** In the Unit with the tracker, the default is used to
reset daily ET to 0. In all other units, you may
choose any value.
10 - 24
Toro Sentinel Central Software User’s Guide
3
10:00 PM - 11:00 PM - Transmission between ET Send Time and Day Change
Rain Today
(.01)
ET Today
(.12)
Central Computer
All Other Units
Prog A1
0
Default ET**
(.08)
ET - Rain
compensation for
each program to
date*
Rain Today
(.01)
4
ET Today
(.12)
Prog D4
11:00 PM - Events in all Field Units at Day Change
Unit w/ ET Tracker and Rain Bucket
0
Rain Today
–ea prg
(.01, .0)
Prog A1
Default ET
(0)
.11
ET - Rain
compensation for
each program to
date*
ET Today
+ea prg
.11
(.12, .0)
Prog D4
All Other Units
0
Rain Today –ea prg
(.01, .0)
Prog A1
Default ET
(.08)
.11
ET - Rain
compensation for
each program to
date*
+ea prg ET Today
.11
(.12, .08)
Prog D4
Toro Sentinel Central Software User’s Guide
10 - 25
If manual data entry is used (with the first ET source option
selected in Software Configuration) instead of a gauge,
everything works the same way except you must manually enter
values for the day’s ET and rain. Do this on the ET Report and
Rain Report windows for unit specified in Software Configuration.
The ET Report screen is accessed from the Master Control
Panel for each individual unit. It is similar in appearance to the
Rain Report window. You must execute the Receive command
to read existing data in the field unit before the Send command is
enabled. Enter the total ET for the day in the Default ET box and
click the Send command or Close to ensure the value is saved before the Transmit ET time set in AutoComm. AutoComm
will then read the default ET value for this unit from the database and send it, as the ET Today value, to all other units just as
in part 3 of the diagram. In this case, zero (0) Rain Today is sent to each unit. A value for the day’s total rain can be sent from
the Rain Report screen.
If you are using a GroWeather or Campbell Weather station, Sentinel reads the ET values retrieved by the
GroWeatherLink software directly from the GroWeatherLink data file in the central computer or directly from the Campbell
Weather Station. It will also read the last complete day ET totals. This
daily value is then sent to all units in the current system as the ET
Today value in the diagram. The ET Report screen shown is the same
screen as the example but appears slightly different because a
weather station is used. When the ET report is opened, ET values for
Today and Yesterday are immediately read from the
GroWeatherLink database, or directly from the Campbell Weather
Station, for this unit. When the Receive command is clicked, monthly
and daily ET values, and the ET Today are read from the field units.
Separate values are received for each program. After clicking the
Receive command to retrieve current data from the field unit, you can
easily copy the value for Today’s or Yesterday’s ET from the weather
station to the Unit ET Today box and send it to the field unit. Highlight
the number by dragging the mouse across it with the right button
depressed, then press and hold the Ctrl key and press the C key (ctrl
- c) to copy the value. Then click the Unit ET Today box with the
mouse, press and hold the Ctrl key and press V (ctrl - v) to paste the value. Send the new value to the field unit by clicking
the Send button.
Chapter 11 will show you how to set AutoComm to automatically retrieve and send ET data.
Chapter 11 : Automatic Communications
Sentinel AutoComm
Sentinel has several automatic communication features to transfer data
between the central and all field units without redundant operations by the
user. The most powerful is the AutoComm which can be set to perform three
different operations at pre-designated times. They are: polling alarms,
transmitting ET data and transmitting changed programs. AutoComm is a
stand-alone module that can run independently from Sentinel. You can start it
from the Sentinel menu, with the Ctrl-T key combination, the Auto icon, or
from the Windows start menu. It is recommended that you close Sentinel to run
AutoComm to avoid conflicts between your manual operations in Sentinel and
the AutoComm transmissions and database access. At the specified time you
set Autocomm to launch, Sentinel and other Sentinel modules, such as the
Flow Optimizer, will close automatically.
The AutoComm main screen has three large buttons to select the events you
wish to set.
11 - 26
Toro Sentinel Central Software User’s Guide
Transmit Programs
Clicking this button in the AutoComm window will cause AutoComm to
check for any programs in the Sentinel database that have been changed
but have not been sent to the field controllers. AutoComm will then transmit them to their designated field controllers at the
specified time. Referring to Chapter 5, you will note that any changes to a program will cause a checkmark to flag the
program until it is sent to the field unit. It is this checkmark that flags the program in the database so AutoComm will select
the program and automatically transmit it to the field units. You can set the time by typing it at the Send at box or by clicking
the scroll bar below it. You must leave AutoComm running in order for it to perform the automatic transmissions at the
desired time. Clicking the OK button at the top will merely minimize the AutoComm window but will leave it running. (To exit
AutoComm, click CANCEL or the X box at the top right corner of the window.) If you pick the Every Day option next to the
time, the operation will repeat everyday at the same time for as long as AutoComm is left running.
Transmit ET
This option will retrieve the ET Today and Rain Today values from the
ET source specified in the Software Configuration screen. It will transmit
these values to all units in the current system. Thus, if the source is an ET gauge (and Rain gauge) AutoComm will first
receive the values from the unit specified in Software Configuration. If the source is a default ET value, AutoComm will first
retrieve the default ET value for the unit specified in Software Configuration from the database. If the source is a
GroWeather station, AutoComm will read and sum the values for the last complete day in the GroWeatherLink database
located in the central computer. If the ET source is the Campbell Weather Station, the ET values of the last complete day
will be directly read from the weather station. You can specify any time and select Every Day to repeat the operation daily, as
long as AutoComm remains running.
Poll Alarms
This option will command AutoComm to read the alarm states from all
field units in the current system at the specified time. Each unit is polled
individually and the results are displayed on the screen and saved in a
log file, calarms.log. Example results are shown in Chapter 12. As with
the other two AutoComm options, a time can be typed into the box or set
by the scroll bar. Additionally, alarms can be polled more than once per day at the period selected by clicking one of the
option buttons or dragging the slider at the bottom to specify the time interval between polls.
Once any or all of the three events are selected, AutoComm constantly checks the time until the first event is scheduled to
occur. If an event is not selected (the large button is not green and the time appears very dim), the time set for it will be
ignored and AutoComm will wait for the next scheduled event that is selected. The time required to complete a transmission
depends on the number of field units in the system. AutoComm will not allow you to set times for different events closer than
three minutes apart. Allow at least an additional minute per three field units and an additional two minutes for processing. For
example, for a system of 30 field controllers, allow 12 minutes after polling alarms before sending the ET data, 10 minutes
allotted for the 30 field units plus the 2-minute processing time. If the communication retry count in the Sentinel Software
Configuration screen is greater than one, allow an additional 15 seconds for each try for each unit.
Since AutoComm must be left running and may be left unattended, password protection is provided to prevent inadvertent
interference. Clicking the padlock icon opens a password input box. After you enter and confirm a password (up to 10
characters), AutoComm is locked and cannot be changed. It will run with the current settings, triggering events at the
specified time, until the password is entered to unlock it (by clicking the padlock icon again and typing the password in the
box), or until the computer is re-booted.
NOTE: It is recommended that you record your password for future reference. The system will not allow you to make
changes without the correct password.
One minute before the first selected scheduled event, AutoComm displays the Starting
Auto countdown and warning window in case Sentinel is being used. At the end of the
60-second countdown, a program called AutoSentinel takes over in the background,
completing the scheduled event by transmitting data from the Sentinel database to the
field units or polling the units and recording data to the database or log file. Meanwhile,
AutoComm waits until it is time to trigger the next scheduled event. While AutoComm
communication is active, it is recommended that Sentinel and the other modules (Flow
Optimizer and Composite Flow Graph) remain closed, because manual communications
or database operations may conflict with AutoComm and result in errors.
Toro Sentinel Central Software User’s Guide
11 - 27
Send ET
Sentinel also provides a method of completing the ET transmissions to the field units without waiting for the preset time. From
the Special Operations menu, select Send today’s ET & Rain to all units. ET values and Rain values from the source
specified in Software Configuration will be read and immediately sent to all units in the current system. This is exactly the
same as scheduling ET transmissions in AutoComm, except the transmission begins immediately instead of being scheduled
for later a time.
Clicking the Send ET button on the tool bar is a shortcut to the same immediate process.
Send Program Changes
This command allows automatic transmission of all program changes to any number of field units. Anytime a field unit
program is altered in the Auto Programming screen (Chapter 5), a box is checked on that screen and a flag is set in the
database. When Send Program Changes is
selected from the menu, or Send is clicked on the
tool bar, a list of all clusters of programs that have
been changed (but not sent) are displayed as shown. If
you wish to send programs that were not flagged, click
the Yes or No next to the unit to toggle or change the
current status. You can toggle individual clusters of
programs or all clusters for a unit. Programs in clusters
marked Yes will be transmitted to the field unit when the
Send button is clicked. To display all units, click the “/”
next to Unit Code. All 16 schedules re also automatically
sent to each selected unit.
Chapter 12 : Polling Alarms
While you can set AutoComm to poll alarms periodically even
when the system is unattended, you also have the ability to check
the alarms immediately with the click of the mouse. Selecting
Alarms Now from the Sentinel Group Operations menu or clicking on
the Alarms icon in the tool bar will trigger the same actions as scheduling
a Poll Alarms event in AutoComm. After choosing the command, AutoComm will start the
process immediately. Alarms states are checked in each field unit in the current system. As each
unit is polled, the Communication In Progress window is displayed and the results are listed
as shown below. Results are entered in the log file (calarms.log) as the next unit is polled.
Upon completion, the results are displayed in the Alarms window which contains a color-coded
box for each field unit polled. If the communication process failed, this box is white. If any alarm
was received from the unit, the box is red. If the unit is shutdown for a rain day, the box is
yellow. If the communication succeeded and verified that no alarms were set, the box is green.
This same window is displayed when alarms are polled automatically with AutoComm.
You can open the alarm log, calarms.log, by clicking the View Alarm Log command from the
Sentinel File menu. This will launch the Windows Notepad program. If editing a log file, make
sure to save it in the original text format. If the file is converted to a Word format, Sentinel will
not be able to recognize the file.
Sample data from an Alarm Log file is shown below:
8/20/99 4:21:13 PM ==> Polling Alarms from 3 units.
8/20/99 4:21:25 PM ==> ! Alarm # 197 power failure in unit # 148
8/20/99 4:21:25 PM ==> Unit 148 Successful
8/20/99 4:21:37 PM ==> ! Alarm # 197 power failure in unit # 555
8/20/99 4:21:37 PM ==> Unit 555 Successful
8/20/99 4:21:49 PM ==> Unit 145 Successful
8/20/99 4:21:49 PM ==> - Alarms checked in 3 units, of 3 attempted
No alarms were detected in the third unit, 145.
12 - 28
Toro Sentinel Central Software User’s Guide
Run Times Report
If you select Include Run Time Report in the AutoComm window before polling alarms, you can also open the Run Time
and Deviation Report by clicking the corresponding command buttons in the Alarms result window. The run time report
includes a listing of data similar to that displayed in the Run Time Report accessed from the Master Control Panel in
Sentinel. The Deviations Only report is a condensed version of the same data listing, excluding the programs that ran
normally as programmed and expected, so that results with deviations can be printed efficiently. See Appendix B for
specification and examples of these files.
You can launch Sentinel from the Alarms Results window in two ways. The square Sentinel button at the lower right corner
is a quick shortcut. Additionally, clicking one of the color-coded field unit boxes will open Sentinel in a special mode. This will
cause Sentinel to automatically open the Alarm Status window for that unit and retrieve the current alarm states of that unit.
Page Notification on Alarm Activation
You can set AutoComm to page you when it receives an alarm if you have a
pager. After selecting Poll Alarms in AutoComm, click Page to open the
utility window. You can enter a pager number and select the Comm Port and
other settings for the PC modem you will use to call the pager. You can also
adjust the delay after dialing and between pages, and specify the information
included with the page. Click the check box next to the alarm type to include
it in paging (if no boxes are checked, no paging will occur). You can enter
any string (text message that the pager will accept) in the text box, next to
the alarm, that you would like to include in the page message for that alarm.
You can select Include Unit Code to include the 3-digit unit code with each
page and you can also choose to include the station number for the
Overflow and Current alarms.
Toro Sentinel Central Software User’s Guide
12 - 29
Chapter 13 : Rain Shutdown
The Rain Shutdown module can be quickly accessed in three
ways: by clicking on the Rain button in the tool bar, selecting
Rain Shutdown from the Group Operations menu or by pressing
the CTRL + R shortcut key combination. The Selection Choice
window will appear first. This is where you can select field units
for immediate shutdown or groups of field units from the group list
on the right. Clicking a box under Rain Days will open the
Rain Days Entry window. This is where you type the number of
days the field units will be inactive, then click OK. You can also
just pick the number of days from the selection. As an example,
if Pool Clubhouse is selected with 2 Rain Days, Pool Clubhouse
field unit will be off for two days after the data is sent. Multiple
units can be selected by clicking the edit box next to each desired
unit. Changes made will apply to all selected units.
If a group of units is selected from the listing on the right (greens
is selected in the example), all units associated with the group
greens will be affected with the selected Rain Days setting.
If greens is selected with two rain days, all units in the group
greens will be off for two days after Send is executed.
Clicking Select Program Description allows you to narrow the
selection by specifying the Primary Description as well as the
Secondary Description. All programs within the selected units
that fit both the primary and secondary descriptions are affected.
Example: Group greens is selected with Primary Description of
Turf with two rain days. Two Secondary Descriptions were
picked, North Slope and South Slope. Field units in the greens
group with programs fitting the descriptions, Turf and North
Slope, as well as programs with both Turf and South Slope
descriptions will be shut down for two days.
After finalizing the unit selection for Rain Days, click OK on the
Selection Choice window. The Rain Shutdown window will
launch. It is initially blank. Click Send to save the Rain Days
settings to the field units.
In the Rain Shutdown window, specific programs can be shutdown with the check boxes to the left of this window. Selecting
programs here supercedes the selections from the Selection
Choice: Rain Shutdown window and will apply it to all selected
units. A default number of rain days can be entered which is used
for any unit that was selected on the previous screen but for which
no value was entered. The default number entered here
supersedes any values entered by description. When you click
Send, the program descriptions are filled in as each of the units
you selected is successively transmitted. Each attempted
transmission to a field unit as well as results are registered on the
Multi-Unit Comm Status window.
13 - 30
Toro Sentinel Central Software User’s Guide
Chapter 14 : System Flow Graph
The System Flow Graph is an independent module that displays a graph of the total theoretical flow (in gallons per minute)
of all programs for all field units in the current system(s) for one day. It can be opened from Sentinel from the Flow menu by
selecting the Composite Flow Graph item or simply clicking the Graph button on the tool bar. Since the System Flow
Graph module runs independently, it can also be started from the Windows Start menu. System Flow Graph can be
launched even when Sentinel is not running. The System Flow Graph is sometimes referred to as the Composite Flow
Graph because it integrates all the graphs of all programs in all units in the current system(s), representing the total flow of
the entire system with a red line at the top of the graph. (If you prefer, a different color scheme can be selected in Options.) If
more than one system has been selected as the Current system in the System Maintenance screen (discussed in Chapter
3), all programs from all units of all current systems are graphed and totaled.
When the System Flow Graph is opened from within the running Sentinel program, the user is prompted to select which day
to graph, as all programs in the current system(s) may not be scheduled to run on any given day. Three choices are
presented, as shown at right, graph today, graph tomorrow, or all programs, regardless of schedules. If the third option is
selected, the resulting total graph is only valid for days on which all programs in the entire system are scheduled to run. If it is
opened from Windows, the graph will default to the third choice and displays all programs.
After choosing which day to graph, units to graph can be selected
by choosing either Select Units To Include or Graph all units in
current system. If the first option is checked, a new window will
open when OK is clicked, where any unit, units or groups of units
can be selected. After making a selection of units, clicking OK on
that window launches the System Flow Graph module, graphing
all programs of the selected units.
When the graph is opened, it initially displays a full day. You can
zoom in to display half a day by clicking the mouse in the left or
right half of the graph. Then clicking the mouse within a one-hour
segment of the graph will zoom in further to display that single hour.
Clicking the mouse on the graph again will cause zooming of the
vertical scale (gallons per minute) only. Click the right mouse button
on the graph to zoom out again. You can also select the time scale
with the options at the bottom of the screen, which has the same
effect as zooming in or out with the mouse. When the time scale is
one hour, you can shift the graph by one hour left or right with the
scroll bar at the bottom of the graph. When the vertical scale is
zoomed in, you can shift the graph up or down with the scroll bar at
the right.
The graph for each program is derived from Run Times, Start
Times, and Repeats entered in the Auto Programming screen
(Chapter 5) and Expected Flow for each station entered in Zone
Data (Chapter 6). Each blue line in the picture to the right
represents the graph of one program, and consists of at least three
line segments. The first segment is a vertical line rising at the start
of the program to the height representing the expected flow for the
station in the first slot. The second segment is a horizontal line from
the top of the first segment to the right for the duration of the first slot run time plus run times
of any contiguous slots with stations of the same expected flow. The last segment is a vertical
line marking the end of the program. Stations with different expected flows will result in more
line segments. Up to twenty program graphs are labeled with the unit code, cluster letter, and
program number, as you can see in the picture. Each program graph is stacked on top of the
one below, so that it’s height represents a running total of the flow of all programs beneath it.
The flow contribution of a single program is only the distance to the next program beneath it.
The red line at the top represents the top program as well as the total of all flows of all
programs in the current system(s). The box in the lower right corner of the window displays
the total usage in gallons for the period displayed. It will automatically recalculate if a different
time scale is selected.
The options menu allows you to print the graph as it is displayed, and to cycle through different color schemes and adjust the
thickness of the lines (focus offset - thicker lines are easier to see but less accurate at lower resolution).
The List by Minute command displays a list of all the data used to generate the flow graph. This includes the total flow in
each station that is running at each minute of the day, the unit, cluster, program running each station, and the total flow of all
stations running at that minute. An example is shown. This list can be printed, but it may require an unwieldy number of
pages if the system is large - hundreds if dozens of controllers run concurrently all day.
Toro Sentinel Central Software User’s Guide
14 - 31
Chapter 15 : System Flow Optimizer
The System Flow Optimizer like the System Flow Graph, runs as an
independent program from Sentinel. It can be opened from the Sentinel menu
or tool bar (Floptize), or started independently from the Windows start menu.
The flow optimizer begins by creating a flow graph of the current system
identical to, and by the same method as, the System Flow Graph. The flow
optimizer rearranges the Start Times of each program by a proprietary method
called Floptize (short for flow optimize) to achieve a new operating order in
which the maximum flow of the system is maintained for the shortest possible time. As seen in the picture below, the original
flow graph appears first. Then a graph of the optimized system appears on top of it. Finally, a control panel window is
displayed which enables you to adjust various parameters (see picture on page 33). When the optimizer is started, it initially
graphs and optimizes only programs scheduled to run today. This can be adjusted as seen on the next page.
Flow Optimizing Parameters
With the Flow Optimizing Parameters control panel, you can pick
tomorrow or any day of the 42-day (six-week) schedule period to
optimize. You can also adjust the maximum flow of the system and
the start and end of the Water Window (both originally set for the
entire system in the System Maintenance screen).
IMPORTANT: Due to hardware limitations, only six programs or
stations per unit can run concurrently. When using the System
Flow Optimizer, do not use more than six programs in each unit.
The flow graph will display all 16 programs, but will not indicate that
all programs beyond the first six will not run.
The Step Interval is a time in minutes between the starts of the first
tier of programs in the optimized system. With zero Step Interval,
the first several programs (up to the maximum flow) would start at
the same instant. The Step Interval allows adjustment of the start
spacings up to five minutes apart. It only applies to the first
several programs, those that would otherwise start at exactly the
start of the Water Window.
Once you have made the desired adjustments on the control
panel, click the Floptize command to re-optimize the system with
the new settings. No matter how many times you adjust the
parameters and Floptize the system, the optimized Start Times
will not take effect (will not be saved in the Sentinel database)
until you click the APPLY button. Only when the APPLY button is
clicked does Sentinel save the new start times in the Sentinel
database.
Priorities
The Floptize process will try to assign earlier Start Times to higher priority programs. There are eight priorities, 1 being the
highest and 8 the lowest. As stated in Chapter 5, to use the System Flow Optimizer, you must only assign one Start Time
to any one program. This is because the Start Time number determines the priority of the program.
Referring to the picture on page 9 in Chapter 5, note that each Start Time box is numbered with a priority number. If a Start
Time is entered in the box labeled 1, the program has the highest priority. Floptize will try to assign an earlier Start Time to
that program than to a program with a time entered in the box labeled 2 or any higher number (lower priority). Floptize will
also try to assign an earlier Start Time to a priority 2 program than to a priority 3 program, and so on. The crucial point is to
only enter one Start Time for each program and that the actual time you enter is not as important as the sequence of the box
in which you enter it.
If you find that your programs are too long to all run within the water window, you can pick Scale Run Times rather than
adjusting the water window. This will open a window with eight different sliders to adjust run times of eight different groups of
programs (grouped by priority). If you adjust the first slider down to 95%, the run time of each slot in every program with a
priority of 1 will be scaled down to 95% of its original value. For example, if you adjust the lowest priority slider (priority 8)
down to 60%, and a program had a start time entered in box 8 with a run time of 10 minutes, that run time would be
decreased to 6 minutes.
15 - 32
Toro Sentinel Central Software User’s Guide
Three additional sliders are provided to quickly adjust all
programs. The slider labeled ALL will move the 8 main sliders
equally. If you move it to 50%, all eight sliders will automatically
move to 50%. If the second slider, labeled LINEAR, is adjusted,
then the eight main sliders are automatically adjusted an amount
proportional to their priority. The second priority will be reduced a
little bit more than the first priority, and so on. This is a quick way
to reduce the overall run time of the entire system without
sacrificing the run times of the high priority programs as much as
those of low priority programs. The last slider, labeled EXP
(exponential), is similar but will adjust according to an
exponential curve, sacrificing low priority programs much more
than the linear slider. You can adjust these sliders all you want to
see how they work. The scaled run times will not overwrite the
original run times in the Sentinel database until the APPLY
button is clicked.
Be aware of the following seven crucial points when using the System Flow Optimizer:
• Assign only one Start Time per program.
• While each field unit can run only six programs concurrently, the number of programs included in the flow
optimizer from different units is unlimited.
• Enter a Start Time in a higher numbered box to assign a lower priority to a program, and vice versa.
• Optimization will not take affect in Sentinel before the APPLY command is executed.
• Clicking the APPLY command will cause new Start Times to overwrite the old Start Times in the Sentinel database.
• If the water window or maximum flow are adjusted, clicking the APPLY command will change these values in the
Sentinel database.
• If Run Times are scaled, clicking APPLY will also overwrite the existing Run Times in the Sentinel database.
In the Sentinel Auto Programming window, it is possible to assign programs that overlap so that more stations will irrigate
simultaneously than the maximum number that is set in the Special Data for the same field unit. In such a case, the Flow
Optimizer will include all programs, although the field unit will not run them all. Floptize will warn you if this condition exist
for any unit. You should go back to the Auto Programming window for that field unit and make sure that no more programs
overlap than the maximum allowed, otherwise, increase the Maximum Stations On in Special Data for that unit.
Toro Sentinel Central Software User’s Guide
15 - 33
Chapter 16 : Utilities and Troubleshooting
Sentinel has several utilities to help in the initial installation, configuring and trouble-shooting the system. These include
Serial Port Scan, Communication Test, and Sentinel Diagnostics.
Serial Port Scan
If you are not sure which serial port to select for field unit
communication in Special Data or you are having trouble with
communication, you can use this screen to automatically
detect which hardware is connected to each of the PC’s serial
communication ports (Comm Port). You can scan any one or
all of the serial ports, up to four. If no device is connected to a
port or if Sentinel attempts to scan a port that does not exist,
Unknown will be checked for that port. If you are using a
Central Interface Modem, Sentinel Modem will be checked
for the port it is connected to. If you have a field unit directly
connected to your computer, Sentinel Satellite will be
checked for that port. If you have a phone modem, Phone will
be checked for that serial port.
Communication Test
The Communication Test can be set to test communication with any one or all field units. Select
Communication Test item from the Utility/Diagnostics menu. The Comm Test window will be displayed.
You can then check (1) Test all units to test every unit in the system or Enter Unit Code of the unit being
tested. To test each unit several times, enter the number of tests desired in Cycle Count (2).
Click on Start (3) to begin the test. The Communications In Progress window will launch after activation.
Field Unit Diagnostics
The Field Unit Diagnostics will test a number of features in a field
unit. The correct Comm Port and Station Count must be selected.
The items tested are listed on the screen and they will be checked
off automatically as each test is completed. The unit being tested
should be connected to your central computer. You should have a
second field unit available as a test drone to test communication
between units. You will need to use the field controller’s keypad and
display to complete the output test and keypad test.
16 - 34
Toro Sentinel Central Software User’s Guide
Database Selection
All Sentinel data in the central computer is stored in a single large database file. The default
file name is Sentinel.mdb. The user may wish to save backup copies of the entire database
under different names. Also, a sample database is provided called sample.mdb in the
Sentinel directory folder. A utility is provided in the Select Database menu under the Sentinel
Setup option. The Data Files window allows switching between the original file,
Sentinel.mdb, and the sample or another valid Sentinel database file. A valid file is one
which is created by the Sentinel program or a copy of one that was originally created in
Sentinel.
The currently selected database is displayed in the box at the bottom of the Data Files
screen. To select a different database, click Browse. A new window will
open that allows you to select a Sentinel database file from any folder on
any drive to which your computer has access. Remember that it must be a
Sentinel database file to be valid. Other files may appear in the list if they
have a similar extension (*.mdb), but Sentinel cannot read any files it did
not create. Selection of an invalid file will generate an error message.
When a valid file is chosen, the name will appear in the text box. Clicking
Open then OK will automatically open the Software Configuration
screen.
Creating a New Sentinel Database
Launch the Data Files window from the Setup/Select Database menu to create a new
Sentinel database. From the Data Files window, click the CREATE button which launches
another utility window. In this window, select the proper drive and folder on the computer or
network where you want the new file to reside. Type the file name of your choice at the
bottom text box. Do not type the file extension. The file extension .MDB will be automatically
added. Click Save, then OK.
Toro Sentinel Central Software User’s Guide
16 - 35
APPENDIX A: Hand-Held Radio Operation and Commands
The Sentinel Hand-held Radio Interface (HHRI) can be used to access the Sentinel satellite field unit. With the Sentinel
HHRI, you are able to turn on and off individual stations or clusters of programs. During HHRI operation, the satellite is
placed in one of two modes: Normal mode and Secure mode. All field units under Normal mode will react to the transmitted
commands sent by the HHRI, regardless of the field unit number. Under Secure mode, the HHRI transmits the command to a
specific field unit number. Only that specific unit will react to the commands.
Normal Mode - To set a field satellite unit for Normal mode operation, send ##CCC# command where CCC is the unit code.
Press the hand-held radio PTT button (Push To Talk) to transmit the command. Send ## to exit Normal mode operation. The
field unit displays A while in Normal mode. Transmitted Normal mode commands will be received by all field units placed in
the Normal mode.
Action
Command
Operation
Turn on a station for
30 minutes.
nn
Station nn (where nn is the specified station) will irrigate for 30 minutes.
After 30 minutes, the station will stop irrigating and the satellite awaits
for the next command.
Turn on a station for a
specified amount of time.
nn h tt
Station nn will irrigate until the specified hour (h) and minutes (tt)
expire. As an example, entering 12 1 30 will energize station 12 for 1
hour and
30 minutes.
Turn on multiple stations.
nn nn nn
Use this command to turn-on multiple units for 30 minutes.
The desired Satellite stations are listed in series (nn nn nn).
As an example, entering 12 13 14 will energize station 12—14
simultaneously.
Increment operation to the
next station.
3
Sending the 3 command will step-up, increment, the currently operating
station. As an example, if station 16 is currently in operation and the 3
command is transmitted, station 16 will stop and station 17 will initiate
operation.
Decrement operation to the
next station.
1
Sending the 1 command will step-down, decrement, the currently
operating station. As an example, if station 16 is currently in operation
and the 1 command is transmitted, station 16 will stop and station 15
will initiate operation.
Turn off the last station
energized.
*
Send the * command to turn-off the last station that was turned on.
If station 16 was the last station energized and * command was
transmitted, station 16 will stop operation.
Turn off a specific station.
nn*
Send a nn* command to turn-off individual stations. As an example,
to turn-off station 16 from a series of irrigating stations, send
a 16* command.
Turn off all stations in
operation within the same
satellite unit.
**
To turn-off multiple stations that are in operation within the same unit,
send a ** command. As an example, the satellite unit has
stations 12–14 in operation. To turn-off all stations with one command,
send a ** command.
Place a station in Rain OFF.
nn dd*
Use this command to place a station in Rain OFF for a specified
number of days. Entering 16 05* command will disable
station 16 (nn) of from all Sentinel Satellite unit for 5 (dd) days.
Sequence Related Commands Under Normal Mode
Action
Command
Operation
Set sequence time.
00 h tt
If running a sequence of stations, use this command to set the
run time duration. As an example, sending 00 1 30 command instructs
the satellite unit to run a sequence for 1 hour and
30 minutes.
Start sequence operation.
nn#
Send this command to start irrigation for all station in sequence,
where nn is the first station to irrigate.
Increment sequence.
3#
Sending this command will step from the currently operating station to
the next higher station number. As an example, if station 16 is currently
in operation and the 3# command is transmitted,
station 16 will stop and station 17 will initiate operation.
A - 36
Toro Sentinel Central Software User’s Guide
Set sequence time.
1#
Sending this command will step from the currently operating station to
the next lower station number. As an example, if station 16 is currently
in operation and the 1# command is transmitted, station 16 will stop
and station 15 will initiate operation.
Start sequence operation.
00#
Sending this command will stop the satellite unit’s sequence operation.
Semi Auto Program Commands Under Normal Mode
Action
Command
Operation
Start cluster program.
#Cp#
This command instructs the satellite to start a specified cluster
program. The C designates the cluster number, 1 for cluster A,
2 for cluster B, etc. The p designates the program number within
the specified cluster. As an example, if command # 24 # is transmitted,
cluster B program 4 will start.
Stop cluster program.
#C3*
This command instructs the satellite to stop the specified cluster in
operation. The C designates the cluster number (1 for cluster A,
2 for cluster B, etc.) to stop operation.
Secure Mode
To set a field satellite unit for Secure mode operation, send ##CCC## command where CCC is the unit code. Press the
hand-held radio’s PTT button (Push To Talk) to transmit the command. Only the specified unit will respond to transmitted
commands. Send CCC ## to exit Secure mode operation. The field unit will displays S while in Secure mode.
Action
Command
Operation
Turn on station for 30 minutes.
CCC nn
Station nn (where nn is the specified station) of unit CCC (where CCC
is the unit code)will irrigate for 30 minutes. After 30 minutes, the station
will stop irrigating and the satellite awaits for the next command.
Turn on a station for a
specified amount of time.
CCC nn h tt
Station nn of unit CCC will irrigate until the specified hour (h) and
minutes (tt) expire. As an example, entering 555 12 1 30 will energize
station 12 of unit 555 for 1 hour and 30 minutes.
Turn on multiple stations.
CCC nn nn nn
Use this command to turn-on multiple units for 30 minutes. The desired
satellite stations are listed in series after the unit number. As an
example, entering 555 12 13 14 will energize station 12–14 of unit 555.
Increment operation to the
next station.
CCC 3
Sending this command will step from the currently operating station to
the next higher station number. As an example, if station 16 of unit 555
is currently in operation and the 555 3 command is transmitted, station
16 will stop and station 17 will initiate operation.
Decrement operation to the
next station.
CCC 1
Sending this command will step from the currently operating station to
the next lower station number. As an example, if station 16 of unit 555
is currently in operation and the 555 1 command is transmitted, station
16 will stop and station 15 will initiate operation.
Turn off last station energized.
CCC *
Send a CCC * command to turn-off the last station that was turned-on.
If station 16 was the last station energized on unit 555 and a 555 *
command was transmitted, station 16 will stop operation.
Turn off a specific station.
CCC nn *
Sending this command allows you to turn-off individual stations. As an
example, to turn-off station 16 of unit 555, send a 555 16 *.
Turn off all stations in
operation within a satellite unit.
CCC **
To turn-off multiple stations that are in operation within a specified unit,
send a CCC **, where CCC specifies the satellite unit.
Place a station in Rain OFF.
CCC nn dd *
Use this command to place a station in Rain OFF for a specified
number of days. Entering 555 16 05 * command will disable station 16
(nn) of Satellite unit 555 (CCC) for 5 (dd) days.
Toro Sentinel Central Software User’s Guide
A - 37
Sequence Related Commands Under Secure Mode
Action
Command
Operation
Set sequence time.
CCC 00 h tt
If running a sequence of stations, use this command to set the
run time duration. As an example, sending 555 00 1 30 command
instructs satellite unit 555 to run a sequence for 1 hour and 30 minutes.
Start sequence operation.
CCC nn #
Send this command to start irrigation for all station in sequence,
where CCC is the satellite unit and nn is the first station to irrigate
in sequence.
Increment sequence.
CCC 3 #
Sending this command will step from the currently operating station to
the next higher station number. As an example, if station 16 of unit 555
is currently in operation and the 555 3 # command is transmitted,
station 16 will stop and station 17 will initiate operation.
Decrement Sequence
CCC 1 #
Sending this command will step from the currently operating station to
the next lower station number.As an example, if station 16 of unit 555 is
currently in operation and the 555 1 # command is transmitted,
station 16 will stop and station 15 will initiate operation.
Stop sequence operation.
CCC 00 #
Sending 555 00 # will stop satellite unit 555’s sequence operation.
Semi Auto Program Commands Under Secure Mode
Action
Command
Operation
Start cluster program.
CCC #Cp#
This command instructs the satellite unit CCC to start the specified
cluster program. The C designates the cluster number, 1 for cluster A, 2
for cluster B, etc. The p designates the program number within the
specified cluster. As an example, if command 555 #24# is transmitted,
cluster B program 4 of unit 555 will start.
Stop cluster program.
CCC #C3*
This command instructs the satellite unit CCC to stop the specified
cluster in operation. The C designates the cluster number (1 for cluster
A, 2 for cluster B, etc.) to stop operation.
A - 38
Toro Sentinel Central Software User’s Guide
Appendix B: Log Files
Sentinel uses four different types of log files to save information about communications, alarms, etc. that can be viewed. All of
the log files can be accessed from the folder where Sentinel is installed and can be viewed with Word or Notepad.
Activity Log
The general information about communications between the Sentinel Central Computer and the field units is logged in the
Activity Log, which is saved as Sentinel.log. It can be accessed from the Sentinel File menu. This file will include the type
of each communication activity (i.e. transmission of time/date, zone data, ET values, etc.) and the time that it occurred. It will
also list communication errors and an indication of whether communication succeeded or failed with each unit.
All communications that Sentinel logs are recorded in this file with the exceptions of Alarms and Run Time Reports, which
have their separate log files.
Alarm Log
Sentinel logs the time and alarms received when polling the alarms from the field units, whether polled from the Sentinel
Group Operations menu, Alarms shortcut or from schedule polling in AutoComm. The alarm log is stored in the
calarms.log file located in the folder where Sentinel is installed.
Notice in the sample that when Sentinel polled field unit 105, it found a power failure alarm and displayed the time when it
occurred and when power was restored. Unit 103 also had a power failure but the time was not displayed. Unit 103 is an
older field unit with an earlier firmware version that does not support power failure time log. This is also apparent from the
Sentinel.log listing in which receipt of Special Data from the similar field units revealed that unit 103 has firmware version
1.19 while unit 105 has firmware version 1.31. This emphasizes the importance of receiving Special Data from all units, to
update information regarding field unit firmware version and settings, before setting up the field units.
Toro Sentinel Central Software User’s Guide
B - 39
Run Time Report
Sentinel will generate a file with the runtime report if the Run Time Report option is selected in AutoComm when polling the
alarms. The runtime data received from each unit that is included in the alarm poll is included in this file. The file name of this
log will be RRMMDDYY.LOG, where RR represents Runtime Report and MM DD YY represents the month, day and year of
the report respectively. For example, RR071604.LOG is the runtime report generated by Sentinel on July 16, 2004. You can
access the Run Time Report from the displayed Alarm Poll results or by opening the file found in the Sentinel folder with
Word or Notepad.
Run Time Deviations
Sentinel also creates a condensed version of the Run Time Report. This file lists only the programs that have a discrepancy
between the programmed and the actual run time from the same data set during the Alarm Poll. For convenience, programs
that ran normally are eliminated so that problems can be quickly evaluated. The file name of the Runtime Deviation report
will be RDMMDDYY.LOG where RD represents Runtime Deviation and MM DD YY represents the month, day and year of
the report respectively. For example, RD071604.LOG is the runtime deviation generated by Sentinel on July 16, 2004. You
can access the runtime deviation report by clicking the Deviations Only button from the Alarms window or by opening the file
found in the Sentinel folder with Word or Notepad.
B - 40
Toro Sentinel Central Software User’s Guide
Notes
Toro Sentinel Central Software User’s Guide
41
Notes
1 - 42
Toro Sentinel Central Software User’s Guide
Notes
Toro Sentinel Central Software User’s Guide
1 - 43
Client’s Regulatory Responsibilities
REGARDING ANY AND ALL RADIO COMMUNICATIONS SYSTEM(S) AND RELATED COMPONENTS THAT ARE
PURCHASED FROM TORO, IT IS THE CLIENT, AND NOT TORO, THAT IS RESPONSIBLE FOR OBTAINING,
COMPLYING WITH, AND MAINTAINING, AT CLIENT’S EXPENSE, ANY AND ALL LICENSES, PERMITS, CODES AND
OTHER SUCH REGULATORY REQUIREMENTS RELATED TO CONSTRUCTION, ZONING, CLEARANCE AND OTHER
SUCH REGULATION AS ISSUED AND ENFORCED BY ALL APPLICABLE INTERNATIONAL, FEDERAL, STATE, COUNTY,
MUNICIPAL, LOCAL AND OTHER GOVERNING BODIES INCLUDING BUT NOT LIMITED TO, THE FEDERAL
COMMUNICATIONS COMMISSION (FCC), THE FEDERAL AVIATION ADMINISTRATION (FAA), THE ENVIRONMENTAL
PROTECTION AGENCY (EPA), OR ANY STATE LEGISLATURE, COUNTY COMMISSION, COUNTY ZONING BOARD,
CITY COUNCIL, CITY/MUNICIPAL ZONING BOARD, COUNTY BUILDING INSPECTION DEPARTMENT, CITY/MUNICIPAL
INSPECTION DEPARTMENT, ETC.
The Toro Company
5825 Jasmine Street, P.O. Box 489
Riverside, Ca 92502-0489
(951) 688-9221
1-800-664-4740
© 2005 The Toro Company, Irrigation Division • An ISO 9001-Certified Facility
Form Number 373-0172 Rev. D