1
INSTRUCTION MANUAL
MODEL GFC7000E
CARBON DIOXIDE ANALYZER
© TELEDYNE ANALYTICAL INSTRUMENTS
16830 Chestnut St.
City of Industry, Ca. 91748
USA
Phone:
Phone:
Fax:
Fax:
Copyright 2003 Teledyne Instruments Incorporated
626-961-9221
626-934-1500
626-961-2538
626-934-1651
04584
REV. A1
02-August-2004
Model GFC7000E Instruction Manual
GFC7000E Documentation
SAFETY MESSAGES
Your safety and the safety of others is very important. We have provided many important safety
messages in this manual. Please read these messages carefully.
A safety message alerts you to potential hazards that could hurt you or others. Each safety
message is associated with a safety alert symbol. These symbols are found in the manual and
inside the instrument. The definition of these symbols is described below:
GENERAL SAFETY HAZARD: Refer to the instructions for
details on the specific hazard.
CAUTION: Hot Surface Warning
CAUTION: Electrical Shock Hazard
TECHNICIAN SYMBOL: All operations marked with this
symbol are to be performed by qualified maintenance
personnel only.
CAUTION
The analyzer should only be used for the purpose and in the manner described in this
manual. If you use the analyzer in a manner other than that for which it was intended,
unpredictable behavior could ensue with possible hazardous consequences.
04584 Rev A1
i
Model GFC7000E Instruction Manual
GFC7000E Documentation
TABLE OF CONTENTS
SAFETY MESSAGES I
TABLE OF CONTENTS ...................................................................................................................... II
LIST OF APPENDICES.................................................................................................................... VII
LIST OF FIGURES
VII
LIST OF TABLES
VIII
1. MGFC7000E DOCUMENTATION..................................................................................................... 1
1.1. Using This Manual ...................................................................................................................1
2. SPECIFICATIONS, APPROVALS AND WARRANTY.......................................................................... 5
2.1. Specifications..........................................................................................................................5
2.2. CE Mark Compliance ................................................................................................................6
2.3. Warranty................................................................................................................................6
3. GETTING STARTED ....................................................................................................................... 9
3.1. Unpacking and Initial Set Up .....................................................................................................9
3.1.1. Electrical Connections ...................................................................................................... 11
3.1.2. Pneumatic Connections:................................................................................................... 15
3.1.2.1. Basic Pneumatic Connections...................................................................................... 15
3.1.2.2. Connections with Internal Valve Options Installed.......................................................... 19
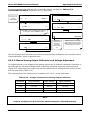
3.2. Initial Operation .................................................................................................................... 21
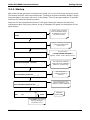
3.2.1. Startup.......................................................................................................................... 22
3.2.2. Warm Up ....................................................................................................................... 23
3.2.3. Warning Messages .......................................................................................................... 24
3.2.4. Functional Check............................................................................................................. 25
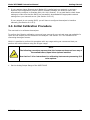
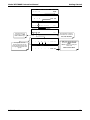
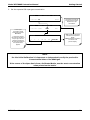
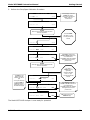
3.3. Initial Calibration Procedure .................................................................................................... 26
4. FREQUENTLY ASKED QUESTIONS............................................................................................... 33
4.1. FAQ’s................................................................................................................................... 33
4.2. Glossary............................................................................................................................... 34
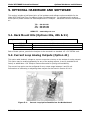
5. OPTIONAL HARDWARE AND SOFTWARE .................................................................................... 37
5.1. Rack Mount Kits (Options 20a, 20b & 21).................................................................................. 37
5.2. Current Loop Analog Outputs (Option 41) ................................................................................. 37
5.3. Expendable Kits (Options 42C, 42D and 43) .............................................................................. 38
5.4. Calibration Valves Options ...................................................................................................... 38
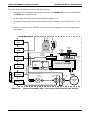
5.4.1. Zero/Span/Shutoff Valve (Option 50) ................................................................................. 38
5.4.2. Zero/Span/Shutoff with External CO2 Scrubber (Option 51) .................................................. 40
5.4.3. Zero/Span Valve (Option 52) ............................................................................................ 40
5.4.4. Zero/Span Valve with External CO2 Scrubber (Option 53)...................................................... 41
5.5. Communication Options.......................................................................................................... 41
5.5.1. RS232 Modem Cable (Option 60)....................................................................................... 41
5.5.2. RS-232 Multidrop (Option 62) ........................................................................................... 42
5.5.3. Ethernet (Option 63) ....................................................................................................... 42
5.6. Additional Manuals................................................................................................................. 42
5.6.1. Printed Manuals (Option 70) .............................................................................................42
5.6.2. Manual on CD (Part number 045840200) ............................................................................ 43
5.7. Extended Warranty (Options 92 & 93) ...................................................................................... 43
5.8. Dilution Ratio Option (Option ??) ............................................................................................. 43
5.9. Maintenance Mode Switch (Option ??) ...................................................................................... 43
5.10. Second Language Switch (Option ??) ...................................................................................... 44
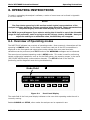
6. OPERATING INSTRUCTIONS ...................................................................................................... 45
6.1. Overview of Operating modes ................................................................................................. 45
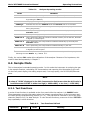
6.2. Sample Mode ........................................................................................................................ 46
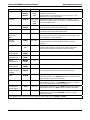
6.2.1. Test Functions ................................................................................................................ 46
6.2.2. Warning Messages .......................................................................................................... 48
6.3. Calibration Mode ................................................................................................................... 50
6.3.1. SETUP – PASS: Calibration Password Security ..................................................................... 50
6.4. SETUP Mode ......................................................................................................................... 52
6.4.1. SETUP Mode Password Security......................................................................................... 53
6.5. SETUP – CFG: Viewing the Analyzer’s Configuration Information .................................................. 53
6.6. SETUP – CLK: Setting the Internal Time-of-Day Clock ................................................................. 54
04584 Rev A1
ii
Model GFC7000E Instruction Manual
GFC7000E Documentation
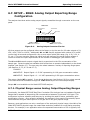
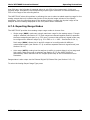
6.7. SETUP – RNGE: Analog Output Reporting Range Configuration ..................................................... 56
6.7.1. Physical Range versus Analog Output Reporting Ranges........................................................ 56
6.7.2. Reporting Range Modes ...................................................................................................57
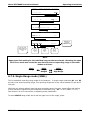
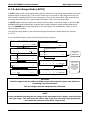
6.7.3. Single Range mode (SNGL) .............................................................................................. 58
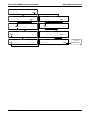
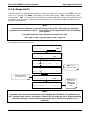
6.7.4. Dual Range Mode (DUAL) ................................................................................................. 60
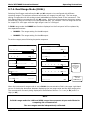
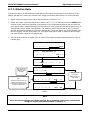
6.7.5. Auto Range Mode (AUTO)................................................................................................. 61
6.7.6. Range Units ................................................................................................................... 62
6.7.7. Dilution Ratio ................................................................................................................. 63
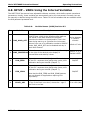
6.8. SETUP – VARS: Using the Internal Variables.............................................................................. 64
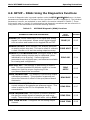
6.9. SETUP – DIAG: Using the Diagnostics Functions......................................................................... 66
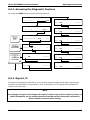
6.9.1. Accessing the Diagnostic Features ..................................................................................... 67
6.9.2. Signal I/O ...................................................................................................................... 67
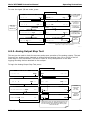
6.9.3. Analog Output Step Test .................................................................................................. 68
6.9.4. Analog I/O Configuration.................................................................................................. 69
6.9.4.1. Analog Output Signal Type and Range Span Selection .................................................... 71
6.9.4.2. Analog Output Calibration Mode .................................................................................. 71
6.9.4.3. Manual Analog Output Calibration and Voltage Adjustment ............................................. 73
6.9.4.4. Current Loop Output Adjustment................................................................................. 75
6.9.4.5. AIN Calibration ......................................................................................................... 77
6.9.5. Electric Test ................................................................................................................... 77
6.9.6. Dark Calibration Test ....................................................................................................... 78
6.9.7. Pressure Calibration ........................................................................................................ 78
6.9.8. Flow Calibration .............................................................................................................. 80
6.9.9. Test Channel Output........................................................................................................ 81
6.10. SETUP – COMM: Using the Analyser’s Communication Ports ....................................................... 82
6.10.1. Analyzer ID Code .......................................................................................................... 82
6.10.2. COMM Port Default Settings ............................................................................................ 83
6.10.3. COMM Port Cable Connections ......................................................................................... 84
6.10.4. RS-485 Configuration of COM2 ........................................................................................ 84
6.10.5. DTE and DCE Communication.......................................................................................... 85
6.10.6. COMM Port Communication Modes ................................................................................... 85
6.10.7. COM Port Baud Rate ...................................................................................................... 88
6.10.8. COM Port Testing .......................................................................................................... 89
6.10.9. Ethernet Card Configuration............................................................................................89
6.10.9.1. Ethernet Card COM2 Communication Modes and Baud Rate........................................... 90
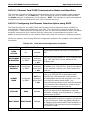
6.10.9.2. Configuring the Ethernet Interface Option using DHCP.................................................. 90
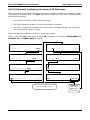
6.10.9.3. Manually Configuring the Network IP Addresses........................................................... 92
6.10.9.4. Changing the Analyzer’s HOSTNAME .......................................................................... 94
6.11. SETUP – ALRM: Using the Gas Concentration Alarms................................................................. 95
6.12. SETUP – DAS: Using the Data Acquisition System (iDAS)........................................................... 96
6.12.1. iDAS Structure .............................................................................................................. 96
6.12.1.1. iDAS Channels........................................................................................................97
6.12.1.2. iDAS Parameters..................................................................................................... 98
6.12.1.3. iDAS Triggering Events ............................................................................................ 98
6.12.2. Default iDAS Channels ................................................................................................... 99
6.12.2.1. Viewing iDAS Data and Settings .............................................................................. 103
6.12.2.2. Editing iDAS Data Channels .................................................................................... 104
6.12.2.3. Trigger Events ...................................................................................................... 105
6.12.2.4. Editing iDAS Parameters ........................................................................................ 106
6.12.2.5. Sample Period and Report Period............................................................................. 107
6.12.2.6. Number of Records ............................................................................................... 109
6.12.2.7. RS-232 Report Function ......................................................................................... 110
6.12.2.8. Compact Report.................................................................................................... 111
6.12.2.9. Starting Date ....................................................................................................... 111
6.12.2.10. Disabling/Enabling Data Channels.......................................................................... 111
6.12.2.11. HOLDOFF Feature................................................................................................ 112
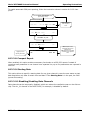
6.12.3. Remote iDAS Configuration........................................................................................... 113
6.13. Remote Operation of the Analyzer ........................................................................................ 115
6.13.1. Remote Operation Using the External Digital I/O .............................................................. 115
6.13.1.1. Status Outputs ..................................................................................................... 115
04584 Rev A1
iii
Model GFC7000E Instruction Manual
GFC7000E Documentation
6.13.1.2. Control Inputs ...................................................................................................... 116
6.13.2. Remote Operation Using the External Serial I/O ............................................................... 117
6.13.2.1. Terminal Operating Modes...................................................................................... 117
6.13.2.2. Help Commands in Terminal Mode ........................................................................... 118
6.13.2.3. Command Syntax ................................................................................................. 118
6.13.2.4. Data Types .......................................................................................................... 119
6.13.2.5. Status Reporting ................................................................................................... 120
6.13.2.6. Remote Access by Modem ...................................................................................... 120
6.13.2.7. COM Port Password Security ................................................................................... 122
6.13.2.8. APICOM Remote Control Program ............................................................................ 122
6.13.3. Additional Communications Documentation ..................................................................... 123
6.13.4. Using the MGFC7000E with a Hessen Protocol Network ..................................................... 123
6.13.4.1. General Overview of Hessen Protocol ....................................................................... 123
6.13.4.2. Hessen COMM Port Configuration ............................................................................ 124
6.13.4.3. Activating Hessen Protocol ..................................................................................... 124
6.13.4.4. Selecting a Hessen Protocol Type ............................................................................ 125
6.13.4.5. Setting The Hessen Protocol Response Mode ............................................................. 126
6.13.4.6. Hessen Protocol Gas ID.......................................................................................... 126
6.13.4.7. Setting Hessen Protocol Status Flags ....................................................................... 127
6.13.4.8. Instrument ID Code .............................................................................................. 128
7. CALIBRATION PROCEDURES .................................................................................................... 129
7.1. Before Calibration................................................................................................................ 129
7.1.1. Zero Air and Span Gas ................................................................................................... 129
7.1.2. Calibration Gas Traceability ............................................................................................ 130
7.1.3. Data Recording Devices ................................................................................................. 130
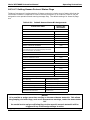
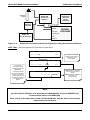
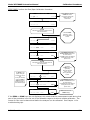
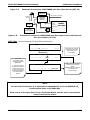
7.2. Manual Calibration without Zero/Span Valves .......................................................................... 130
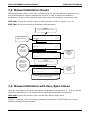
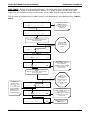
7.3. Manual Calibration Checks .................................................................................................... 133
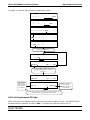
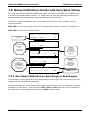
7.4. Manual Calibration with Zero/Span Valves............................................................................... 133
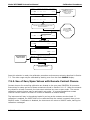
7.5. Manual Calibration Checks with Zero/Span Valves .................................................................... 137
7.5.1. Zero/Span Calibration on Auto Range or Dual Ranges......................................................... 137
7.5.2. Use of Zero/Span Valves with Remote Contact Closure ....................................................... 138
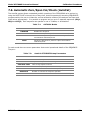
7.6. Automatic Zero/Span Cal/Check (AutoCal) .............................................................................. 139
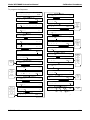
7.6.1. AutoCal with Auto or Dual Reporting Ranges Modes Selected ............................................... 142
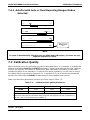
7.7. Calibration Quality ............................................................................................................... 142
8. EPA PROTOCOL CALIBRATION ................................................................................................. 143
9. MAINTENANCE SCHEDULE & PROCEDURES .............................................................................. 145
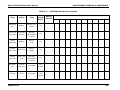
9.1. Maintenance Schedule.......................................................................................................... 145
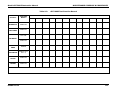
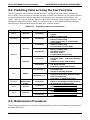
9.2. Predicting Failures Using the Test Functions ............................................................................ 148
9.3. Maintenance Procedures ....................................................................................................... 148
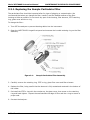
9.3.1. Replacing the Sample Particulate Filter ............................................................................. 149
9.3.2. Rebuilding the Sample Pump .......................................................................................... 150
9.3.3. Performing Leak Checks ................................................................................................. 150
9.3.3.1. Vacuum Leak Check and Pump Check ........................................................................ 150
9.3.3.2. Pressure Leak Check ............................................................................................... 150
9.3.4. Performing a Sample Flow Check..................................................................................... 151
9.3.5. Cleaning the Optical Bench ............................................................................................. 151
9.3.6. Cleaning Exterior Surfaces of the MGFC7000E ................................................................... 151
10. THEORY OF OPERATION......................................................................................................... 153
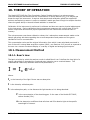
10.1. Measurement Method ......................................................................................................... 153
10.1.1. Beer’s Law ................................................................................................................. 153
10.1.2. Measurement Fundamentals ......................................................................................... 154
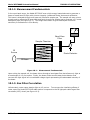
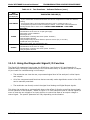
10.1.3. Gas Filter Correlation ................................................................................................... 154
10.1.4. Ambient CO2 Interference Rejection ............................................................................... 158
10.2. Pneumatic Operation .......................................................................................................... 158
10.2.1. Sample Gas Flow......................................................................................................... 159
10.2.1.1. Critical Flow Orifice ............................................................................................... 159
10.2.1.2. Sample Pressure Sensor ........................................................................................ 160
10.2.1.3. Sample Flow Sensor .............................................................................................. 160
10.2.1.4. Valve Options ....................................................................................................... 161
10.2.2. Purge Gas Pressure and Flow Control ............................................................................. 161
04584 Rev A1
iv
Model GFC7000E Instruction Manual
GFC7000E Documentation
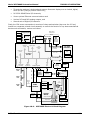
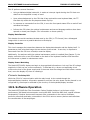
10.3. Electronic Operation ........................................................................................................... 161
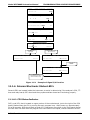
10.3.1. Overview ................................................................................................................... 161
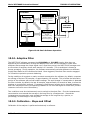
10.3.2. CPU........................................................................................................................... 163
10.3.3. Optical Bench & GFC Wheel........................................................................................... 163
10.3.3.1. Sample Gas and GFC Temperature Control ............................................................... 163
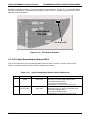
10.3.3.2. IR Source ............................................................................................................ 164
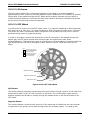
10.3.3.3. GFC Wheel ........................................................................................................... 164
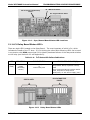
10.3.3.4. IR Photo-Detector ................................................................................................. 165
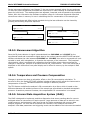
10.3.4. Synchronous Demodulator (Sync/Demod) Assembly......................................................... 165
10.3.4.1. Overview ............................................................................................................. 165
10.3.4.2. Signal Synchronization and Demodulation ................................................................ 166
10.3.4.3. Phase Lock Warning .............................................................................................. 167
10.3.4.4. Sync/Demod Status LED’s ...................................................................................... 167
10.3.4.5. Photo-Detector Temperature Control........................................................................ 168
10.3.4.6. Dark Calibration Switch.......................................................................................... 168
10.3.4.7. Electric Test Switch ............................................................................................... 168
10.3.5. Relay Board................................................................................................................ 168
10.3.5.1. Status LED’s......................................................................................................... 169
2
10.3.5.2. I C Watch Dog Circuitry ........................................................................................ 170
10.3.6. Mother Board.............................................................................................................. 170
10.3.6.1. A to D Conversion ................................................................................................. 170
10.3.6.2. Sensor Inputs....................................................................................................... 171
10.3.6.3. Thermistor Interface.............................................................................................. 171
10.3.6.4. Analog Outputs..................................................................................................... 172
10.3.6.5. Internal Digital I/O................................................................................................ 172
10.3.6.6. External Digital I/O ............................................................................................... 173
10.3.7. I2C Data Bus............................................................................................................... 173
10.3.8. Power Supply/ Circuit Breaker ....................................................................................... 173
10.4. Interface .......................................................................................................................... 174
10.4.1. Front Panel Interface ................................................................................................... 175
10.4.1.1. Analyzer Status LED’s ............................................................................................ 175
10.4.1.2. Keyboard ............................................................................................................. 176
10.4.1.3. Display ................................................................................................................ 176
10.4.1.4. Keyboard/Display Interface Electronics..................................................................... 177
10.5. Software Operation ............................................................................................................ 178
10.5.1. Adaptive Filter ............................................................................................................ 179
10.5.2. Calibration - Slope and Offset........................................................................................ 179
10.5.3. Measurement Algorithm ............................................................................................... 180
10.5.4. Temperature and Pressure Compensation ....................................................................... 180
10.5.5. Internal Data Acquisition System (iDAS) ......................................................................... 180
11. TROUBLESHOOTING & REPAIR PROCEDURES ........................................................................ 183
11.1. General Troubleshooting Hints ............................................................................................. 183
11.1.1. Interpreting WARNING Messages ................................................................................... 184
11.1.2. Fault Diagnosis with TEST Functions............................................................................... 186
11.1.3. Using the Diagnostic Signal I/O Function......................................................................... 188
11.1.4. Internal Electronic Status LED’s ..................................................................................... 189
11.1.4.1. CPU Status Indicator ............................................................................................. 189
11.1.4.2. Sync Demodulator Status LED’s .............................................................................. 190
11.1.4.3. Relay Board Status LED’s ....................................................................................... 191
11.1.5. Gas Flow Problems ...................................................................................................... 192
11.1.6. Typical Sample Gas Flow Problems................................................................................. 193
11.1.6.1. Flow is Zero ......................................................................................................... 193
11.1.6.2. Low Flow ............................................................................................................. 193
11.1.6.3. High Flow ............................................................................................................ 194
11.1.6.4. Displayed Flow = “XXXX” ....................................................................................... 194
11.1.6.5. Actual Flow Does Not Match Displayed Flow .............................................................. 194
11.1.6.6. Sample Pump ....................................................................................................... 194
11.1.7. Poor or Stopped Flow of Purge Gas ................................................................................ 194
11.2. Calibration Problems .......................................................................................................... 195
11.2.1. Miss-Calibrated ........................................................................................................... 195
04584 Rev A1
v
Model GFC7000E Instruction Manual
GFC7000E Documentation
11.2.2. Non-Repeatable Zero and Span ..................................................................................... 195
11.2.3. Inability to Span – No SPAN Key.................................................................................... 196
11.2.4. Inability to Zero – No ZERO Key .................................................................................... 196
11.3. Other Performance Problems ............................................................................................... 196
11.3.1. Temperature Problems ................................................................................................. 197
11.3.1.1. Box or Sample Temperature ................................................................................... 197
11.3.1.2. Bench Temperature ............................................................................................... 197
11.3.1.3. GFC Wheel Temperature ........................................................................................ 198
11.3.1.4. IR Photo-Detector TEC Temperature ........................................................................ 198
11.3.2. Excessive Noise........................................................................................................... 198
11.4. Subsystem Checkout.......................................................................................................... 199
11.4.1. AC Mains Configuration ................................................................................................ 199
11.4.2. DC Power Supply......................................................................................................... 200
11.4.3. I2C Bus ...................................................................................................................... 200
11.4.4. Keyboard/Display Interface........................................................................................... 201
11.4.5. Relay Board................................................................................................................ 201
11.4.6. Sensor Assembly......................................................................................................... 202
11.4.6.1. Sync/Demodulator Assembly .................................................................................. 202
11.4.6.2. Opto Pickup Assembly ........................................................................................... 202
11.4.6.3. GFC Wheel Drive................................................................................................... 203
11.4.6.4. IR Source ............................................................................................................ 203
11.4.6.5. Pressure/Flow Sensor Assembly .............................................................................. 203
11.4.7. Motherboard ............................................................................................................... 204
11.4.7.1. A/D Functions....................................................................................................... 204
11.4.7.2. Analog Outputs: Voltage ........................................................................................ 204
11.4.7.3. Analog Outputs: Current Loop................................................................................. 204
11.4.7.4. Status Outputs ..................................................................................................... 205
11.4.7.5. Control Inputs – Remote Zero, Span ........................................................................ 205
11.4.8. CPU........................................................................................................................... 206
11.4.9. RS-232 Communications .............................................................................................. 206
11.4.9.1. General RS-232 Troubleshooting ............................................................................. 206
11.4.9.2. Troubleshooting Analyzer/Modem or Terminal Operation............................................. 207
11.5. Repair Procedures.............................................................................................................. 207
11.5.1. Repairing Sample Flow Control Assembly ........................................................................ 207
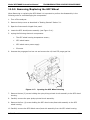
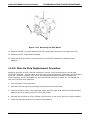
11.5.2. Removing/Replacing the GFC Wheel ............................................................................... 209
11.5.3. Disk-On-Chip Replacement Procedure............................................................................. 210
12. A PRIMER ON ELECTRO-STATIC DISCHARGE.......................................................................... 213
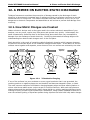
12.1. How Static Charges are Created........................................................................................... 213
12.2. How Electro-Static Charges Cause Damage ........................................................................... 214
12.3. Common Myths About ESD Damage ..................................................................................... 215
12.4. Basic Principles of Static Control .......................................................................................... 216
12.4.1. General Rules ............................................................................................................. 216
12.4.2. Basic anti-ESD Procedures for Analyzer Repair and Maintenance ........................................ 218
12.4.2.1. Working at the Instrument Rack.............................................................................. 218
12.4.2.2. Working at a Anti-ESD Work Bench.......................................................................... 218
12.4.2.3. Transferring Components from Rack To Bench and Back ............................................. 219
12.4.2.4. Opening Shipments from and Packing Components for Return to Teledyne Instruments
Customer Service. .............................................................................................................. 219
04584 Rev A1
vi
Model GFC7000E Instruction Manual
GFC7000E Documentation
LIST OF APPENDICES
APPENDIX A - VERSION SPECIFIC SOFTWARE DOCUMENTATION
APPENDIX A-1: MGFC7000E Software Menu Trees, Revision E.0
APPENDIX A-2: Setup Variables For Serial I/O, Revision E.0
APPENDIX A-3: Warnings and Test Functions, Revision E.0
APPENDIX A-4: MGFC7000E Signal I/O Definitions, Revision E.0
APPENDIX A-5: MGFC7000E iDAS Functions, Revision E.0
APPENDIX A-6: Terminal Command Designators, Revision E.0
APPENDIX B - GFC7000E SPARE PARTS LIST
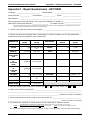
APPENDIX C - REPAIR QUESTIONNAIRE - MGFC7000E
APPENDIX D - ELECTRONIC SCHEMATICS
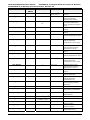
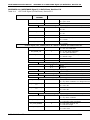
LIST OF FIGURES
Figure
Figure
Figure
Figure
Figure
Figure
3-1:
3-2:
3-3:
3-4:
3-5:
3-6
Figure 3-7:
Figure 3-8:
Figure
Figure
Figure
Figure
Figure
Figure
Figure
Figure
Figure
Figure
Figure
Figure
Figure
Figure
Figure
Figure
Figure
Figure
Figure
Figure
Figure
Figure
Figure
Figure
Figure
3-9:
3-10:
3-11:
3-12:
3-13:
5-1:
5-2:
5-3:
5-4:
6-1:
6-2
6-3
6-4:
6-5:
6-6:
6-7:
6-8:
6-9:
6-10:
6-11:
6-12:
7-1:
7-2:
7-3:
7-4
Figure 7-5:
Removal of Shipping Screws.......................................................................... 10
Rear Panel Layout ........................................................................................ 12
Pneumatic Connections–Basic Configuration–Using Bottled Span Gas .................. 16
Pneumatic Connections–Basic Configuration–Using Gas Dilution Calibrator ........... 17
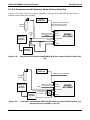
Pneumatic Connections–MGFC7000E with Zero/Span/Shutoff Valves (OPT 50)...... 19
Pneumatic Connections–MGFC7000E with Zero/Span/Shutoff Valves and External
Zero Air Scrubber (OPT 51).......................................................................... 19
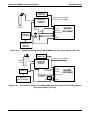
Pneumatic Connections–MGFC7000E with Zero/Span Valves (OPT 52) ................. 20
Pneumatic Connections–MGFC7000E with Zero/Span Valves with External Zero air
Scrubber (OPT 53)...................................................................................... 20
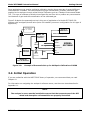
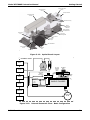
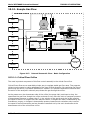
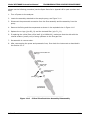
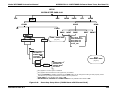
Example of Pneumatic Set up for Multipoint Calibration of M360 ......................... 21
Front Panel Layout ....................................................................................... 23
Assembly Layout.......................................................................................... 30
Optical Bench Layout .................................................................................... 31
Internal Pneumatic Flow – Basic Configuration ................................................. 31
Current Loop Option Installed on the Motherboard ............................................ 37
Internal Pneumatic Flow – Zero/Span/Shutoff Valves OPT 50 & 51 ...................... 39
Internal Pneumatic Flow – Zero/Span OPT 52 & 53 ........................................... 41
GFC7000E Ethernet Card and rear panel With Ethernet Installed......................... 42
Front Panel Display ...................................................................................... 45
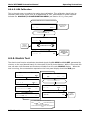
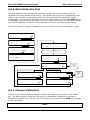
Viewing MGFC7000E TEST Functions ............................................................... 48
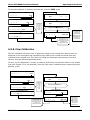
Viewing and Clearing MGFC7000E WARNING Messages...................................... 50
Analog Output Connector Pin Out ................................................................... 56
Setup for Calibrating Analog Voltage Outputs ................................................... 74
Setup for Calibrating Current Outputs ............................................................. 75
Default iDAS Channels Setup ....................................................................... 101
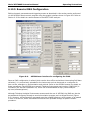
APICOM user interface for configuring the iDAS. ............................................. 113
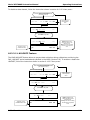
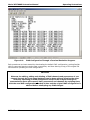
iDAS Configuration Through a Terminal Emulation Program.............................. 114
Status Output Connector............................................................................. 115
Control Inputs ........................................................................................... 117
APICOM Remote Control Program Interface.................................................... 123
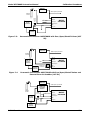
Pneumatic Connections–Basic Configuration–Using Bottled Span Gas ................ 130
Pneumatic Connections–Basic Configuration–Using Gas Dilution Calibrator ......... 131
Pneumatic Connections–MGFC7000E with Zero/Span/Shutoff Valves (OPT 50).... 134
Pneumatic Connections–MGFC7000E with Zero/Span/Shutoff Valves and External
Zero Air Scrubber (OPT 51)........................................................................ 134
Pneumatic Connections–MGFC7000E with Zero/Span Valves (OPT 52) ............... 135
04584 Rev A1
vii
Model GFC7000E Instruction Manual
GFC7000E Documentation
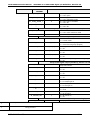
Figure 7-6:
Figure
Figure
Figure
Figure
Figure
Figure
Figure
Figure
Figure
Figure
Figure
Figure
Figure
Figure
Figure
Figure
Figure
Figure
Figure
Figure
Figure
Figure
Figure
Figure
Figure
Figure
Figure
Figure
Figure
Figure
Figure
Figure
Figure
Figure
Figure
Figure
Figure
Figure
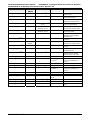
Pneumatic Connections–MGFC7000E with Zero/Span Valves with External Zero air
Scrubber (OPT 53).................................................................................... 135
9-1:
Sample Particulate Filter Assembly ............................................................... 149
10-1: Measurement Fundamentals ........................................................................ 154
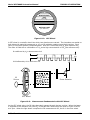
10-2: GFC Wheel ................................................................................................ 155
10-3: Measurement Fundamentals with GFC Wheel ................................................. 155
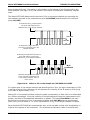
10-4: Affect of CO2 in the Sample on CO2 MEAS & CO2 REF...................................... 156
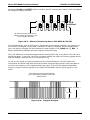
10-5: Effects of Interfering Gas on CO2 MEAS & CO2 REF......................................... 157
10-6: Chopped IR Signal...................................................................................... 157
10-7: Internal Pneumatic Flow – Basic Configuration ............................................... 159
10-8: Flow Control Assembly & Critical Flow Orifice ................................................. 160
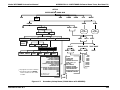
10-9: GFC7000E Electronic Block Diagram ............................................................. 162
10-10: GFC Light Mask .......................................................................................... 164
10-11: Segment Sensor and M/R Sensor Output ....................................................... 165
10-12: GFC7000E Sync / Demod Block Diagram ....................................................... 166
10-13: Sample & Hold Timing................................................................................. 167
10-14: Location of relay board Status LED’s ............................................................. 170
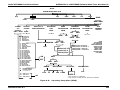
10-15: Power Distribution Block Diagram ................................................................. 174
10-16: Interface Block Diagram .............................................................................. 175
10-17: MGFC7000E Front Panel Layout .................................................................... 175
10-18: Keyboard and Display Interface Block Diagram ............................................... 177
10-19: Basic Software Operation ............................................................................ 179
11-1: Viewing and Clearing Warning Messages........................................................ 184
11-2: Example of Signal I/O Function .................................................................... 189
11-3: CPU Status Indicator .................................................................................. 190
11-4: Sync/Demod Board Status LED Locations ...................................................... 191
11-5: Relay Board Status LEDs ............................................................................. 191
11-6: Critical Flow Restrictor Assembly Disassembly ................................................ 208
11-7: Opening the GFC Wheel Housing .................................................................. 209
11-8: Removing the GFC Wheel ............................................................................. 210
12-1: Triboelectric Charging ................................................................................. 213
12-2: Basic anti-ESD Work Station ........................................................................ 216
A-1: Basic Sample Display Menu .......................................................................... 223
A-2: Sample Display Menu - Units with Z/S Valve or IZS Option installed................... 224
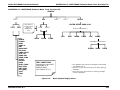
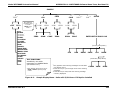
A-3: Primary Setup Menu (Except iDAS) ............................................................... 225
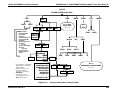
A-4: Primary Setup Menu (iDAS) ......................................................................... 226
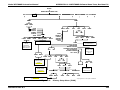
A-5: Secondary Setup Menu (COMM & VARS) ........................................................ 227
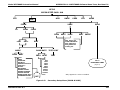
A-6: Secondary Setup Menu (COMM Menu with Ethernet Card)................................. 228
A-7: Secondary Setup Menu (COMM Menu with HESSEN) ........................................ 229
A-8: Secondary Setup Menu (DIAG) ..................................................................... 230
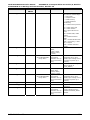
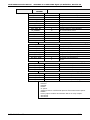
LIST OF TABLES
Table
Table
Table
Table
Table
Table
Table
Table
Table
Table
2-1:
3-1:
3-2:
3-3:
3-4:
3-5:
3-6:
5-1:
5-2:
6-1:
Model GFC7000E Basic Unit Specifications .......................................................... 5
GFC7000E Analog Output Pin Outs .................................................................. 13
GFC7000E Status Output Pin Outs ................................................................... 14
GFC7000E Control Input Pin Outs .................................................................... 15
Model GFC7000E Rear Panel Pneumatic Connections .......................................... 16
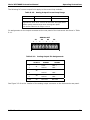
Front Panel Display During System Warm-Up .................................................... 23
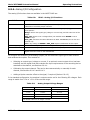
Possible Warning Messages at Start-Up ............................................................ 24
Zero/Span Valve Operating States for Options 50 & 51....................................... 38
Zero/Span Valve Operating States for Options 52 & 53....................................... 40
Analyzer Operating modes.............................................................................. 46
04584 Rev A1
viii
Model GFC7000E Instruction Manual
Table
Table
Table
Table
Table
Table
Table
Table
Table
Table
Table
Table
Table
Table
Table
Table
Table
Table
Table
Table
Table
Table
Table
Table
Table
Table
Table
Table
Table
Table
Table
Table
Table
Table
Table
Table
Table
Table
Table
Table
Table
Table
Table
Table
Table
Table
Table
Table
Table
Table
Table
Table
Table
Table
6-2:
6-3:
6-4:
6-5:
6-6:
6-7:
6-8:
6-9:
6-10:
6-11:
6-12:
6-13:
6-14:
6-15:
6-16:
6-17:
6-18:
6-19:
6-20:
6-21:
6-22:
6-23:
6-24:
6-25:
6-26:
6-27:
6-28:
6-29:
6-30:
6-31:
7-1:
7-2:
7-3:
9-1:
9-2:
9-3:
10-1:
10-2:
10-3:
11-1:
11-2:
11-3:
11-4:
11-5:
11-6:
11-7:
11-8:
11-9:
11-10:
11-11:
11-12:
12-1:
12-2:
A-1:
GFC7000E Documentation
Test Functions Defined................................................................................... 46
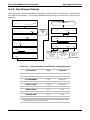
List of Warning Messages ............................................................................... 49
Primary Setup Mode Features and Functions ..................................................... 52
Secondary Setup Mode Features and Functions ................................................. 52
Variable Names (VARS) Revision B.3 ............................................................... 64
GFC7000E Diagnostic (DIAG) Functions............................................................ 66
DIAG - Analog I/O Functions........................................................................... 69
Analog Output Voltage Ranges ........................................................................ 69
Analog Output Current Loop Range .................................................................. 70
Analog Output Pin Assignments ....................................................................... 70
Voltage Tolerances for Analog Output Calibration ............................................... 73
Current Loop Output Calibration with Resistor ................................................... 76
Test Parameters Available for Analog Output A3 ................................................ 81
COM1 and COM2 DB-9 Pin Assignments............................................................ 85
COMM Port Communication modes................................................................... 86
Ethernet Status Indicators .............................................................................. 89
LAN/Internet Configuration Properties .............................................................. 90
Internet Configuration Keypad Functions .......................................................... 94
CO2 Concentration Alarm Default Settings......................................................... 95
Front Panel LED Status Indicators for iDAS ....................................................... 96
iDAS Data Channel Properties ......................................................................... 97
iDAS Data Parameter Functions ....................................................................... 98
Status Output Pin Assignments ..................................................................... 116
Control Input Pin Assignments ...................................................................... 116
Terminal Mode Software Commands .............................................................. 118
Command Types ......................................................................................... 119
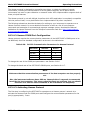
Serial Interface Documents........................................................................... 123
RS-232 Communication Parameters for Hessen Protocol ................................... 124
Teledyne Instruments Hessen Protocol Response Modes ................................... 126
Default Hessen Status Bit Assignments........................................................... 127
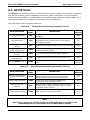
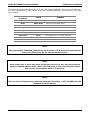
AUTOCAL Modes ......................................................................................... 139
AutoCal ATTRIBUTE Setup Parameters ........................................................... 139
Calibration Data Quality Evaluation................................................................ 142
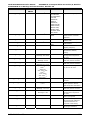
GFC7000E Maintenance Schedule .................................................................. 146
GFC7000E Test Function Record.................................................................... 147
Predictive uses for Test Functions.................................................................. 148
Sync/Demod Status LED Activity ................................................................... 168
Relay Board Status LED’s ............................................................................. 169
Front Panel Status LED’s .............................................................................. 176
Warning Messages - Indicated Failures ........................................................... 185
Test Functions - Indicated Failures................................................................. 187
Sync/Demod Board Status Failure Indications ................................................. 190
I2C Status LED Failure Indications ................................................................. 191
Relay Board Status LED Failure Indications ..................................................... 192
DC Power Test Point and Wiring Color Codes ................................................... 200
DC Power Supply Acceptable Levels ............................................................... 200
Relay Board Control Devices ......................................................................... 201
Opto Pickup Board Nominal Output Frequencies............................................... 202
Analog Output Test Function - Nominal Values Voltage Outputs.......................... 204
Analog Output Test Function - Nominal Values Current Outputs ......................... 205
Status Outputs Check .................................................................................. 205
Static Generation Voltages for Typical Activities ............................................... 214
Sensitivity of Electronic Devices to Damage by ESD ......................................... 214
GFC7000E Setup Variables, Revision E.0 ........................................................ 231
04584 Rev A1
ix
Model GFC7000E Instruction Manual
Table
Table
Table
Table
Table
Table
Table
A-2:
A-3:
A-4:
A-5:
A-6:
A-7:
D-1:
GFC7000E Documentation
GFC7000E Warning Messages, Revision E.0 ....................................................
GFC7000E Test Functions, Revision E.0 ..........................................................
GFC7000E Signal I/O Definitions, Revision E.0 ................................................
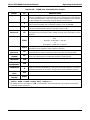
GFC7000E DAS Trigger Events, Revision E.0 ...................................................
GFC7000E iDAS Functions, Revision E.0 .........................................................
Terminal Command Designators, Revision E.0.................................................
List of Included Electronic Schematics............................................................
238
239
240
243
244
245
251
User Notes
04584 Rev A1
x
Model GFC7000E Instruction Manual
MGFC7000E Documentation
1. MGFC7000E DOCUMENTATION
Thank you for purchasing the Model GFC7000E Gas Filter Correlation Carbon Dioxide Analyzer!
The documentation for this instrument is available in several different formats:
•
Printed format, part number 045840100
•
Electronic format on a CD-ROM, part number 045840200
The electronic manual is in Adobe® Systems Inc. “Portable Document Format”. The Adobe®
Acrobat Reader® software, which is necessary to view these files, can be downloaded for free from
the internet at http://www.adobe.com/.
The electronic version of the manual has many advantages:
•
Keyword and phrase search feature
•
Figures, tables and internet addresses are linked so that clicking on the item will display
the associated feature or open the website.
•
A list of chapters and sections as well as thumbnails of each page are displayed to the left
of the text.
•
Entries in the table of contents are linked to the corresponding locations in the manual.
•
Ability to print sections (or all) of the manual
Additional documentation for the Model GFC7000E CO2 Analyzer is available from Teledyne
Analytical Instruments’ website at http://www.teledyne-ai.com/manuals/
•
APICOM software manual, part number 03945
•
Multi-drop manual, part number 01842
•
DAS Manual, part number 02837.
1.1. Using This Manual
This manual has the following data structures:
1.0 Table of Contents:
Outlines the contents of the manual in the order the information is presented. This is a good
overview of the topics covered in the manual. There is also a list of tables, a list of figures and a
list of appendices. In the electronic version of the manual, clicking on a any of these table entries
automatically views that section.
04584 Rev A1
1
Model GFC7000E Instruction Manual
MGFC7000E Documentation
2.0 Specifications and Warranty
This section contains a list of the analyzer’s performance specifications, a description of the
conditions and configuration under which EPA equivalency was approved and Teledyne
Instruments Incorporated’s warranty statement.
3.0 Getting Started:
A concise set of instructions for setting up, installing and running your analyzer for the first time.
4.0 FAQ:
Answers to the most frequently asked questions about operating the analyzer.
5.0 Optional Hardware & Software
A description of optional equipment to add functionality to your analyzer.
6.0 Operation Instructions
This section includes step by step instructions for operating the analyzer and using its various
features and functions.
7.0 Calibration Procedures
General information and step by step instructions for calibrating your analyzer.
8.0 EPA Protocol Calibration
Because CO2 is not declared a criteria air pollutant by the US EPA, EPA equivalency is not required
for this type of analyzer. Therefore no special calibration methods are needed to satisfy EPA
requirements.
9.0 Instrument Maintenance
Description of certain preventative maintenance procedures that should be regularly performed on
you instrument to keep it in good operating condition. This section also includes information on
using the iDAS to record diagnostic functions useful in predicting possible component failures
before they happen.
10.0
Theory of Operation
An in-depth look at the various principals by which your analyzer operates as well as a description
of how the various electronic, mechanical and pneumatic components of the instrument work and
interact with each other. A close reading of this section is invaluable for understanding the
instrument’s operation.
11.0
Troubleshooting Section:
This section includes pointers and instructions for diagnosing problems with the instrument, such
as excessive noise or drift, as well as instructions on performing repairs of the instrument’s major
subsystems.
04584 Rev A1
2
Model GFC7000E Instruction Manual
MGFC7000E Documentation
Appendices:
For easier access and better updating, some information has been separated out of the manual
and placed in a series of appendices at the end of this manual. These include: software menu
trees, warning messages, definitions of iDAS & serial I/O variables, spare parts list, repair
questionnaire, interconnect listing and drawings, and electronic schematics.
NOTE
Throughout this manual, words printed in capital, bold letters, such as SETUP or ENTR
represent messages as they appear on the analyzer’s front panel display.
NOTE
The flowcharts in this manual contain typical representations of the analyzer’s display
during the various operations being described. These representations are not intended
to be exact and may differ slightly from the actual display of your instrument.
User Notes
04584 Rev A1
3
Model GFC7000E Instruction Manual
Specifications, Approvals and Warranty
2. SPECIFICATIONS, APPROVALS AND
WARRANTY
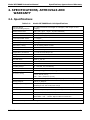
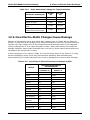
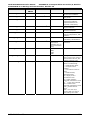
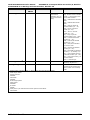
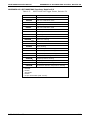
2.1. Specifications
Table 2-1:
Model GFC7000E Basic Unit Specifications
Min/Max Range
(Physical Analog Output)
In 1ppb increments from 50ppb to 2 000ppm, dual ranges or auto
ranging
Measurement Units
ppb, ppm, µg/m3, mg/m3, %(user selectable)
Zero Noise
< 0.1 ppm (RMS)
Span Noise
< 1% of reading (RMS)
Lower Detectable Limit1
< 0.2 ppm1
Zero Drift (24 hours)
<0.25 ppm1
Zero Drift (7 days)
<0.5 ppm1
Span Drift (7 Days)
1% of reading above 50 PPM1
Linearity
1% of full scale
Precision
0.5% of reading
Temperature Coefficient
< 0.1% of Full Scale per oC
Voltage Coefficient
< 0.05% of Full Scale per V
Lag Time
10 sec
Rise/Fall Time
95% in <60 sec
Sample Flow Rate
800cm3/min. ±10%
Temperature Range
5-40oC
Humidity Range
0 - 95% RH, non-condensing
Dimensions H x W x D
7" x 17" x 23.5" (178 mm x 432 mm x 597 mm)
Weight, Analyzer
38 lbs. (17 kg); add 1 lbs (0.5 kg) for IZS
AC Power Rating
100 V, 50/60 Hz (3.25A);
115 V, 60 Hz (3.0 A);
220 – 240 V, 50/60 Hz (2.5 A)
Environmental
Installation category (over-voltage category) II; Pollution degree 2
Analog Outputs
Three (3) Outputs
Analog Output Ranges
0.1V, 1 V, 5 V, 10 V, 2-20 or 4-20 mA isolated current loop.
All Ranges with 5% Under/Over Range
Analog Output Resolution
1 part in 4096 of selected full-scale voltage
Status Outputs
8 Status outputs - opto-isolated; including 2 alarm outputs
Control Inputs
6 Control Inputs, 3 defined, 3 spare
Serial I/O
One (1) RS-232; One (1) RS-485
Baud Rate : 300 – 115200: Optional Ethernet Interface
Certifications
CE: EN61010-1:90 + A1:92 + A2:95, EN61326 - Class A
1
At constant temperature and voltage.
04584 Rev A1
5
Model GFC7000E Instruction Manual
Specifications, Approvals and Warranty
2.2. CE Mark Compliance
Emissions Compliance
The Teledyne Instruments Model GFC7000E Gas Filter Correlation CO2 Analyzer was tested and
found to be fully compliant with:
EN61326 (1997 w/A1: 98) Class A, FCC Part 15 Subpart B Section 15.107 Class A, ICES-003
Class A (ANSI C63.4 1992) & AS/NZS 3548 (w/A1 & A2; 97) Class A.
Tested on 11-29-2001 at CKC Laboratories, Inc., Report Number CE01-249.
Safety Compliance
The Teledyne Instruments Model GFC7000E Gas Filter Correlation CO2 Analyzer was tested and
found to be fully compliant with:
IEC 61010-1:90 + A1:92 + A2:95,
Tested on 02-06-2002 at Nemko, Report Number 2002-012219.
2.3. Warranty
Warranty Policy (02024)
Prior to shipment, Teledyne Instruments Incorporated equipment is thoroughly inspected and
tested. Should equipment failure occur, Teledyne Instruments Incorporated assures its customers
that prompt service and support will be available.
Coverage
After the warranty period and throughout the equipment lifetime, Teledyne Instruments
Incorporated stands ready to provide on-site or in-plant service at reasonable rates similar to
those of other manufacturers in the industry. All maintenance and the first level of field
troubleshooting is to be performed by the customer.
Non-API Manufactured Equipment
Equipment provided but not manufactured by Teledyne Instruments Incorporated is warranted
and will be repaired to the extent and according to the current terms and conditions of the
respective equipment manufacturers warranty.
General
Teledyne Instruments Incorporated warrants each product manufactured by Teledyne Instruments
Incorporated to be free from defects in material and workmanship under normal use and service
for a period of one year from the date of delivery. All replacement parts and repairs are warranted
for 90 days after the purchase.
If a product fails to conform to its specifications within the warranty period, Teledyne Instruments
Incorporated shall correct such defect by, in Teledyne Instruments Incorporated’s discretion,
repairing or replacing such defective product or refunding the purchase price of such product.
04584 Rev A1
6
Model GFC7000E Instruction Manual
Specifications, Approvals and Warranty
The warranties set forth in this section shall be of no force or effect with respect to any product:
(i) that has been altered or subjected to misuse, negligence or accident, or (ii) that has been used
in any manner other than in accordance with the instruction provided by TELEDYNE ANALYTICAL
INSTRUMENTS or (iii) not properly maintained.
THE WARRANTIES SET FORTH IN THIS SECTION AND THE REMEDIES THEREFORE ARE
EXCLUSIVE AND IN LIEU OF ANY IMPLIED WARRANTIES OF MERCHANTABILITY,
FITNESS FOR PARTICULAR PURPOSE OR OTHER WARRANTY OF QUALITY, WHETHER
EXPRESSED OR IMPLIED. THE REMEDIES SET FORTH IN THIS SECTION ARE THE
EXCLUSIVE REMEDIES FOR BREACH OF ANY WARRANTY CONTAINED HEREIN. Teledyne
Instruments Incorporated SHALL NOT BE LIABLE FOR ANY INCIDENTAL OR
CONSEQUENTIAL DAMAGES ARISING OUT OF OR RELATED TO THIS AGREEMENT OF
TELEDYNE INSTRUMENTS INCORPORATED’S PERFORMANCE HEREUNDER, WHETHER
FOR BREACH OF WARRANTY OR OTHERWISE.
Terms and Conditions
All units or components returned to Teledyne Amnalytical Instruments should be properly packed
for handling and returned freight prepaid to the nearest designated Service Center. After the
repair, the equipment will be returned, freight prepaid.
User Notes
04584 Rev A1
7
Model GFC7000E Instruction Manual
Getting Started
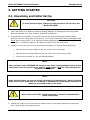
3. GETTING STARTED
3.1. Unpacking and Initial Set Up
CAUTION
To avoid personal injury, always use two persons to lift and carry the
Model GFC7000E.
1. Verify that there is no apparent external shipping damage. If damage has occurred, please
advise the shipper first, then Teledyne Analytical Instruments.
2. Included with your analyzer is a printed record of the final performance characterization
performed on your instrument at the factory. This record, titled Final Test and Validation Data
Sheet (part number 04307) is an important quality assurance and calibration record for this
instrument. It should be placed in the quality records file for this instrument.
3. Carefully remove the top cover of the analyzer and check for internal shipping damage.
•
Remove the set screw located in the top, center of the rear panel.
•
Remove the four screws fastening the top cover to the unit (two per side).
•
Lift the cover straight up. Do not slide backwards.
NOTE
Some versions of the GFC7000E CO2 Analyzer may have a spring loaded fastener at the
top center of the rear panel and as many as eight screws (four per side) fastening the
top cover to the chassis.
NOTE
Static sensitive parts are present on PCA (Printed Circuit Assemblies). Before touching
PCAs, touch a bare metal part of the chassis to discharge any electrostatic potentials or
connect a grounding strap to your wrist.
CAUTION
Never disconnect PCAs, wiring harnesses or electronic subassemblies
while under power.
4. Inspect the interior of the instrument to make sure all circuit boards and other components
are in good shape and properly seated.
04584 Rev A1
9
Model GFC7000E Instruction Manual
Getting Started
5. Check the connectors of the various internal wiring harnesses and pneumatic hoses to make
sure they are firmly and properly seated.
6. Verify that all of the optional hardware ordered with the unit has been installed. These are
listed on the paperwork accompanying the analyzer.
7. Once you have determined that no shipping damage exists, and the unit includes all expected
hardware options, remove all red colored shipping screws from the bottom of the chassis as
shown in Figure 3-1.
Shipping
Screws
Figure 3-1:
Removal of Shipping Screws
NOTE
Save these shipping screws and re-install them whenever the unit is shipped to another
location.
04584 Rev A1
10
Model GFC7000E Instruction Manual
Getting Started
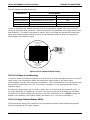
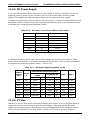
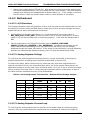
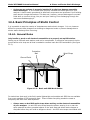
8. VENTILATION CLEARANCE: Whether the analyzer is set up on a bench or installed into an
instrument rack, be sure to leave sufficient ventilation clearance.
•
AREA
MINIMUM REQUIRED CLEARANCE
Back of the instrument
4 in.
Sides of the instrument
1 in.
Above and below the instrument
1 in.
Various rack mount kits are available for this analyzer. See Section 5.1 of this manual
for more information.
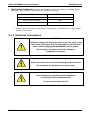
3.1.1. Electrical Connections
CAUTION
Check the voltage and frequency label on the rear panel of the
instrument (See Figure 3-2) for compatibility with the local
power before plugging the MGFC7000E into line power.
Do not plug in the power cord if the voltage or
frequency is incorrect.
CAUTION
Power connection must have functioning ground connection.
Do not defeat the ground wire on power plug.
CAUTION
Turn off analyzer power before disconnecting or
connecting electrical subassemblies.
Do not operate with cover off.
04584 Rev A1
11
Model GFC7000E Instruction Manual
Getting Started
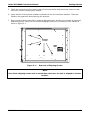
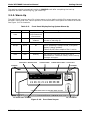
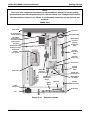
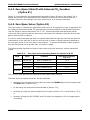
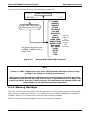
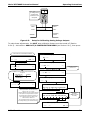
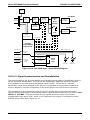
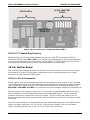
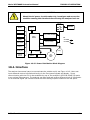
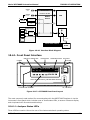
Figure 3-2:
Rear Panel Layout
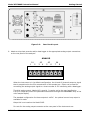
9. Attach a strip chart recorder and/or data-logger to the appropriate analog output connections
on the rear panel of the analyzer.
ANALOG
1
A1
2
A2
3 4
5
A3
6
A4
7
8
When the instrument is in its default configuration, the A1 and A2 channels output a signal
that is proportional to the CO2 concentration of the sample gas. Either can be used for
connecting the analog output signal to a chart recorder or for interfacing with a datalogger.
The third analog output, labeled A3 is special. It can be set by the user (see Section
6.9.9) to output any one of the parameters accessible through the <TST TST> keys of the
units sample display.
The standard configuration for these outputs is mVDC. An optional current loop output is
available for each.
Output A4 is not used on the Model 306E.
Pin-outs for the analog output connector at the rear panel of the instrument are:
04584 Rev A1
12
Model GFC7000E Instruction Manual
Table 3-1:
Pin
Getting Started
GFC7000E Analog Output Pin Outs
Analog Output
VDC Signal
A1
1
V Out
2
A2
3
4
A3
5
6
A4 (Spare)
7
mADC Signal
8
I Out +
Ground
I Out -
V Out
I Out +
Ground
I Out -
V Out
I Out +
Ground
I Out -
V Out
Not Available
Ground
Not Available
•
The default analog output voltage setting of the GFC7000E CO2 Analyzer is 0 – 5 VDC
with a range of 0 – 500 ppm.
•
TO change these settings, see Sections 6.9.4 and 6.7 respectively.
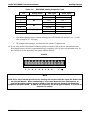
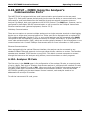
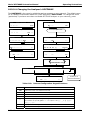
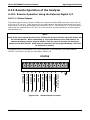
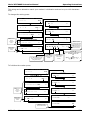
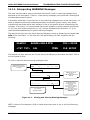
10. If you wish utilize the analyzer’s status outputs to interface with a device that accepts logiclevel digital inputs, such as programmable logic controllers (PLC’s) they are accessed via a 12pin connector on the analyzer’s rear panel labeled STATUS.
STATUS
1
2
3
4
5
6
7
8
D
+
NOTE
Most PLC’s have internal provisions for limiting the current that the input will draw from
an external device. When connecting to a unit that does not have this feature, an
external dropping resistor must be used to limit the current through the transistor
output to less than 50mA. At 50mA, the transistor will drop approximately 1.2V from its
collector to emitter.
04584 Rev A1
13
Model GFC7000E Instruction Manual
Getting Started
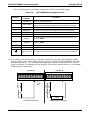
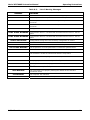
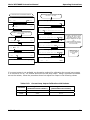
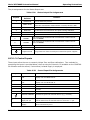
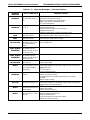
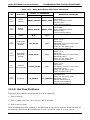
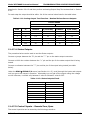
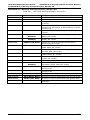
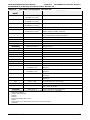
The pin assignments for the status outputs can be found in the table below:
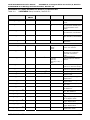
Table 3-2:
GFC7000E Status Output Pin Outs
Output #
Status
Definition
1
SYSTEM OK
On if no faults are present.
CONC VALID
On if CO2 concentration measurement is valid.
If the CO2 concentration measurement is invalid, this bit is OFF.
3
HIGH RANGE
On if unit is in high range of DUAL or AUTO range modes.
4
ZERO CAL
On whenever the instruments ZERO point is being calibrated.
5
SPAN CAL
On whenever the instruments SPAN point is being calibrated.
6
DIAG MODE
7
ALARM1
On whenever the measured CO2 concentration is above the set
point for ALM1
8
ALARM2
On whenever the measured CO2 concentration is above the set
point for ALM2
D
EMITTER BUSS
The emitters of the transistors on pins 1-8 are bussed together.
+
DC POWER
2
Condition
On whenever the instrument is in DIAGNOSTIC mode.
+ 5 VDC
Digital Ground
The ground level from the analyzer’s internal DC power supplies.
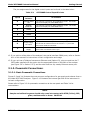
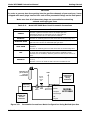
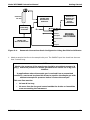
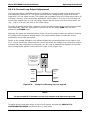
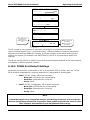
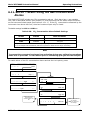
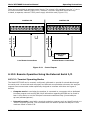
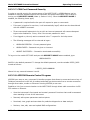
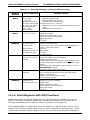
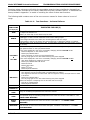
11. If you wish to use the analyzer’s to remotely activate the zero and span calibration modes,
several digital control inputs are provided via a 10-pin connector labeled CONTROL IN on the
analyzer’s rear panel. Two methods for energizing the inputs are provided below; the first
using the internal +5V available on the CONTROL IN connector and the second, if an external,
isolated supply is employed.
CONTROL IN
CONTROL IN
A
Z
E
R
O
B
C
D
E
F
U
A
+
Z
E
R
O
S
P
A
N
B
C
04584 Rev A1
E
F
U
+
S
P
A
N
Local Power Connections
D
5 VDC Power
Supply
+
External Power Connections
14
Model GFC7000E Instruction Manual
Getting Started
The pin assignments for the digital control inputs can be found in the table below:
Table 3-3:
GFC7000E Control Input Pin Outs
Input #
Status
Definition
A
REMOTE ZERO
CAL
The Analyzer is placed in Zero Calibration mode. The mode
field of the display will read ZERO CAL R.
B
REMOTE
SPAN CAL
The Analyzer is placed in Span Calibration mode. The mode
field of the display will read SPAN CAL R.
C
SPARE
D
SPARE
E
SPARE
F
SPARE
Digital Ground
On Condition
May be connected to the ground of the datalogger/recorder.
U
Pullup supply
for inputs
Input pin for +5 VDC required to activate pins A – F. This
can be from an external source or from the “+” pin of the
instruments STATUS connector.
+
Internal +5V
Supply
Internal source of +5V which can be used to actuate control
inputs when connected to the U pin.
12. If you wish to utilize either of the analyzer’s two serial interface COMM ports, refer to Section
6.10 of this manual for instructions on their configuration and usage.
13. If your unit has a Teledyne Instruments Ethernet card (Option 63), plug one end into the 7’
CAT5 cable supplied with the option into the appropriate place on the back of the analyzer
(see Figure 5-4 in Section 5.5.3) and the other end into any nearby Ethernet access port.
3.1.2. Pneumatic Connections:
3.1.2.1. Basic Pneumatic Connections
Figures 3-3 and 3-4 illustrate the most common configurations for gas supply and exhaust lines to
the Model GFC7000E Analyzer. Figure 3-13 illustrates the internal gas flow of the instrument in
its basic configuration.
Please refer to Figure 3-2 for pneumatic connections at the rear panel and Table 3-4 for
nomenclature.
NOTE
Sample and calibration gases should only come into contact with PTFE (Teflon), FEP,
glass, stainless steel or brass. CAUTION
04584 Rev A1
15
Model GFC7000E Instruction Manual
Getting Started
CAUTION
In order to prevent dust from getting into the gas flow channels of your analyzer, it was
shipped with small plugs inserted into each of the pneumatic fittings on the back panel.
Make sure that all of these dust plugs are removed before attaching
exhaust and supply gas lines.
Table 3-4:
Model GFC7000E Rear Panel Pneumatic Connections
Rear Panel Label
SAMPLE
EXHAUST
PRESSURE SPAN
Function
Connect a gas line from the source of sample gas here.
Calibration gasses are also inlet here on units without
zero/span/shutoff valve or IZS options installed.
Connect an exhaust gas line of not more than 10 meters long here.
On units with zero/span/shutoff valve options installed, connect a
gas line to the source of calibrated span gas here.
VENT SPAN
Span gas vent outlet for units with zero/span/shutoff valve options
installed.
Connect an exhaust gas line of not more than 10 meters long here.
IZS
Internal zero air scrubber.
on units with zero/span/shutoff valve options installed but NO
internal zero air scrubber, attach a gas line to the source of zero air
here.
PURGE IN
This inlet supplies purge air to the GFC wheel housing (see section
10.2.2)
Connect a source of dried air that has been scrubbed of CO2.
Calibrated CO2
gas at desired
span gas
concentration
VENT
Source of
SAMPLE Gas
Removed
during
Calibration
Needle
valve to
control
flow
Indicating
soda-lime
Sample
Valve
Exhaust
Vent Span
MODEL
GFC7000E
Pressure Span
MODEL 701
Zero Air
Generator
Figure 3-3:
04584 Rev A1
IZS
Purge In
Pneumatic Connections–Basic Configuration–Using Bottled Span Gas
16
Model GFC7000E Instruction Manual
Calibrated
CO2 Gas
Indicating
soda-lime
Getting Started
Source of
SAMPLE Gas
Removed
during
Calibration
MODEL 700
Gas Dilution
Calibrator
VENT
Sample
Exhaust
Vent Span
MODEL
GFC7000E
Pressure Span
MODEL 701
Zero Air Generator
IZS
Purge In
Figure 3-4:
Pneumatic Connections–Basic Configuration–Using Gas Dilution Calibrator
1. Attach a sample inlet line to the sample inlet port. The SAMPLE input line should not be more
than 2 meters long.
NOTE
Ideally, the pressure of the sample gas should be at ambient pressure (0
psig). Maximum pressure of sample gas should not exceed 1.5 in-Hg over
ambient.
In applications where the sample gas is received from a pressurized
manifold, a vent must be placed as shown to equalize the sample gas with
ambient atmospheric pressure before it enters the analyzer.
This vent line must be:
•
At least 0.2m long
•
No more than 2m long and vented outside the shelter or immediate
area surrounding the instrument.
04584 Rev A1
17
Model GFC7000E Instruction Manual
Getting Started
2. Attach sources of zero air and span gas (see Figures 3-3 through 3-8 inclusive).
•
Span Gas is a gas specifically mixed to match the chemical composition of the type of gas
being measured at near full scale of the desired measurement range.
In the case of CO2 measurements made with the Teledyne Analytical Instruments Model
GFC7000E Analyzer it is recommended that you use a gas calibrated to have a CO2 content
equaling 80% of the range of compositions being measured.
EXAMPLE: If the application is to measure between 0 ppm and 500 ppm, an appropriate
Span Gas would be 400 ppm. If the application is to measure between 0 ppm and 100
ppm, an appropriate Span Gas would be 80 ppm.
•
•
Span Gas can be purchased in pressurized canisters or created using Dynamic Dilution
Calibrator such as the Teledyne Analytical Instruments Model 700 and a source of dried
air scrubbed of CO2 such as a Teledyne Analytical Instruments Model 701 Zero Air
Generator in combination with a canister of indicating soda-lime.
Zero Air is similar in chemical composition to the earths atmosphere but scrubbed of all
components that might affect the analyzer’s readings.
In the case of CO2 measurements this means CO2 less than 0.1 ppm of CO2 and Water
Vapor. Zero Air can be purchased in pressurized canisters or created using a Teledyne
Instruments Model 701 Zero Air Generator in combination with a canister of indicating
soda-lime.
3. Attach an exhaust line to the exhaust outlet port.
•
The exhaust from the pump and vent lines should be vented to atmospheric pressure using
maximum of 10 meters of ¼” PTEF tubing.
CAUTION
Venting should be outside the shelter or immediate area surrounding the
instrument.
4. Attach a source of dried air scrubbed of CO2 to the purge inlet port
NOTE
The source of purge air should be at 20-25 psig and capable of maintaining a flow of at
least 0.5 liters/min.
Purge source air pressure should not exceed 35 pisg
5. Once the appropriate pneumatic connections have been made, check all pneumatic fittings for
leaks using a procedure similar to that defined in Section 9.3.3.
04584 Rev A1
18
Model GFC7000E Instruction Manual
Getting Started
3.1.2.2. Connections with Internal Valve Options Installed
Figures 3-5 through 3-8 show the proper pneumatic connections for MGFC7000E’s with various
optional internal valve sets installed.
Source of
SAMPLE Gas
VENT if input is pressurized
Certified
CO2 Gas
Sample
MODEL 701
Zero Air
Generator
Needle
valve to
control
flow
Exhaust
VENT
Vent Span
MODEL
GFC7000E
Pressure Span
VENT
IZS
Purge In
Indicating
soda-lime
Figure 3-5:
Pneumatic Connections–MGFC7000E with Zero/Span/Shutoff Valves (OPT
50)
Source of
SAMPLE Gas
VENT if input is pressurized
Certified
CO2 Gas
Sample
Exhaust
MODEL 701
Zero Air
Generator
VENT
Vent Span
MODEL
GFC7000E
Pressure Span
External Zero
Air Scrubber
Indicating
soda-lime
Figure 3-6
04584 Rev A1
IZS
Purge In
Pneumatic Connections–MGFC7000E with Zero/Span/Shutoff Valves and
External Zero Air Scrubber (OPT 51)
19
Model GFC7000E Instruction Manual
Getting Started
Source of
SAMPLE Gas
VENT if input is pressurized
MODEL 700
Gas Dilution
Calibrator
Certified
CO2 Gas
Sample
Needle
valve to
control flow
Exhaust
VENT
Vent Span
MODEL
GFC7000E
Pressure Span
Indicating
soda-lime
VENT
IZS
Purge In
MODEL 701
Zero Air
Generator
Figure 3-7:
Pneumatic Connections–MGFC7000E with Zero/Span Valves (OPT 52)
Source of
SAMPLE Gas
VENT if input is pressurized
Certified
CO Gas
MODEL 700
Gas Dilution
Calibrator
Sample
Indicating
soda-lime
VENT
Exhaust
Vent Span
MODEL
GFC7000E
Pressure Span
MODEL 701
Zero Air Generator
Figure 3-8:
04584 Rev A1
External Zero
Air Scrubber
IZS
Purge In
Pneumatic Connections–MGFC7000E with Zero/Span Valves with External
Zero air Scrubber (OPT 53)
20
Model GFC7000E Instruction Manual
Getting Started
Some applications may require multipoint calibration checks where span gas of several different
concentrations is needed. We recommend using high-concentration, certified, calibration gas
supplied to the analyzer through a Gas Dilution Calibrator such as a Teledyne Instruments Model
700. This type of calibrator precisely mixes Span Gas and Zero Air to produce any concentration
level between 0 ppm and the concentration of the calibrated gas.
Figure 3-8 depicts the pneumatic set up in this sort of application of a Model GFC7000E CO2
Analyzer with zero/span/shutoff valve option 50 installed (a common configuration for this type of
application).
Gas Pressure should
be regulated at
30 – 35 PSIG
Source of
SAMPLE Gas
VENT if input is pressurized
MODEL 700
Gas Dilution
Calibrator
Sample
VENT
Exhaust
VENT
Calibrated
CO2 Gas
Vent Span
MODEL
GFC7000E
Pressure Span
Indicating
soda-lime
VENT
IZS
Purge In
Needle
valve to
control flow
MODEL 701
Zero Air Generator
Figure 3-9:
Example of Pneumatic Set up for Multipoint Calibration of M360
3.2. Initial Operation
If you are unfamiliar with the MGFC7000E theory of operation, we recommend that you read
Chapter 10.
For information on navigating the analyzer’s software menus, see the menu trees described in
Appendix A.1.
NOTE
The analyzer’s cover must be installed to ensure that the temperatures of the GFC
wheel and absorption cell assemblies are properly controlled.
04584 Rev A1
21
Model GFC7000E Instruction Manual
Getting Started
3.2.1. Startup
After electrical and pneumatic connections are made, turn on the instrument and pump power.
The exhaust and PMT cooler fans should start. The display should immediately display a single,
horizontal dash in the upper left corner of the display. This will last approximately 30 seconds
while the CPU loads the operating system.
Once the CPU has completed this activity it will begin loading the analyzer firmware and
configuration data. During this process, string of messages will appear on the analyzer’s front
panel display:
SELECT START OR REMOTE
:
System waits 3 seconds
then automatically begins
its initialization routine.
No action required.
3
START
.
CHECKING FLASH STATUS
STARTING INSTRUMENT CODE
:
1
:
1
System is checking the format
of the instrument’s flash
memory chip.
If at this point,
**FLASH FORMAT INVALID**
appears, contact T–API customer service
STARTING INSTRUMENT
W/FLASH
:
1
The instrument is
loading the analyzer
firmware.
M200E NOX ANALYZER
BOOT PROGRESS [XXXXX 50%_ _ _ _ _]
The revision level of the
firmware installed in your
analyzer is briefly displayed
SOFTWARE REVISION D.6
BOOT PROGRESS [XXXXXXXX 80% _ _]
SAMPLE
TEST
SYSTEM RESET
CAL
CO2=X.XXX
CLR
The instrument is loading
configuration and calibration
data from the flash chip
SETUP
Firmware
fully booted
Press CLR to clear initial
warning messages.
(see Section 3.2.3)
04584 Rev A1
22
Model GFC7000E Instruction Manual
Getting Started
The analyzer should automatically switch to SAMPLE mode after completing the boot-up
sequence and start monitoring CO2 gas. Warm-Up
3.2.2. Warm Up
The MGFC7000E requires about 30 minutes warm-up time before reliable CO2 measurements can
be taken. During that time, various portions of the instrument’s front panel will behave as follows.
See Figure 3-10 for locations.
Table 3-5:
Front Panel Display During System Warm-Up
Name
Color
Behavior
Significance
Concentration
Field
N/A
Displays current,
compensated CO2
Concentration
N/A
Mode Field
N/A
Displays blinking
“SAMPLE”
Instrument is in sample mode but is still in the
process of warming up.
Sample
Green
On
Unit is operating in sample mode, front panel
display is being updated.
Flashes On/Off when adaptive filter is active
Cal
Yellow
Off
The instrument’s calibration is not enabled.
Fault
Red
Blinking
STATUS LED’s
MODE FIELD
MESSAGE FIELD
The analyzer is warming up and hence out of
specification for a fault-free reading. various warning
messages will appear.
LOCKING SCREW
CONCENTRATION FIELD
STATUS LED’s
FASTENER
FASTENER
SAMPLE A
<TST
TST>
RANGE = 500.0 PPM
CAL
CO2 = 400.0
SETUP
SAMPLE
CAL
FAULT
POWER
GAS FILTER CORRELATION CO2 ANALYZER- MODEL GFC7000E
KEY DEFINITIONS KEYBOARD
ON / OFF SWITCH
Figure 3-10:
04584 Rev A1
Front Panel Layout
23
Model GFC7000E Instruction Manual
Getting Started
3.2.3. Warning Messages
Because internal temperatures and other conditions may be outside be specified limits during the
analyzer’s warm-up period, the software will suppress most warning conditions for 30 minutes
after power up.
If warning messages persist after the 30 minutes warm up period is over, investigate their cause
using the troubleshooting guidelines in Chapter 11 of this manual. The following table includes a
brief description of the various warning messages that may appear.
Table 3-6:
MESSAGE
Possible Warning Messages at Start-Up
MEANING
ANALOG CAL WARNING
The instruments A/D circuitry or one of its analog outputs is not calibrated.
BENCH TEMP WARNING
The Temperature of the optical bench is outside the specified limits.
BOX TEMP WARNING
Remote span calibration failed while the dynamic span feature was set to
turned on
CANNOT DYN SPAN
Remote zero calibration failed while the dynamic zero feature was set to
turned on
CANNOT DYN ZERO
CONFIG INITIALIZED
Configuration was reset to factory defaults or was erased.
Configuration storage was reset to factory configuration or erased.
CONC ALRM1 WARNING
Concentration alarm 1 is enabled and the measured CO2 level is ≥ the set
point.
CONC ALRM2 WARNING
Concentration alarm 2 is enabled and the measured CO2 level is ≥ the set
point.
DATA INITIALIZED
FRONT PANEL WARN
PHOTO TEMP WARNING
REAR BOARD NOT DET
RELAY BOARD WARN
SAMPLE FLOW WARN
SAMPLE PRESS WARN
SAMPLE TEMP WARN
SOURCE WARNING
SYNC WARNING
SYSTEM RESET
WHEEL TEMP WARNING
04584 Rev A1
iDAS data storage was erased.
Firmware is unable to communicate with the front panel.
The temperature of the IR photometer is outside the specified limits.
The CPU is unable to communicate with the motherboard.
The firmware is unable to communicate with the relay board.
The flow rate of the sample gas is outside the specified limits.
Sample gas pressure outside of operational parameters.
The temperature of the sample gas is outside the specified limits.
The IR source may be faulty.
The instrument is not properly tracking the rotation of the Gas Filter
Correlation wheel.
The computer was rebooted.
The Gas Filter Correlation wheel temperature is outside the specified limits.
24
Model GFC7000E Instruction Manual
Getting Started
To View and Clear the various warning messages press:
SAMPLE
TEST deactivates warning
messages
TEST
HVPS WARNING
CAL
MSG
RANGE=500.000 PPM
SAMPLE
MSG
< TST TST > CAL
SAMPLE
TEST
NOTE:
If the warning message persists
after several attempts to clear it,
the message may indicate a
real problem and not an artifact
of the warm-up period
CO2 = 0.00
HVPS WARNING
CAL
MSG
CLR
SETUP
CO2 = 0.00
CLR
SETUP
CO2 = 0.00
CLR
SETUP
MSG activates warning
messages.
<TST TST> keys replaced with
TEST key
Press CLR to clear the current
message.
If more than one warning is active, the
next message will take its place
Once the last warning has been
cleared, the analyzer returns to
SAMPLE mode
Make sure warning messages are
not due to real problems.
3.2.4. Functional Check
1. After the analyzer’s components has warmed up for at least 30 minutes, verify that the
software properly supports any hardware options that were installed.
2. Check to make sure that the analyzer is functioning within allowable operating parameters.
Appendix C includes a list of test functions viewable from the analyzer’s front panel as well as
their expected values. These functions are also useful tools for diagnosing performance
problems with your analyzer (Section 11.1.2). The enclosed Final Test and Validation Data
sheet (part number 04307) lists these values before the instrument left the factory.
To view the current values of these parameters press the following key sequence on the
analyzer’s front panel. Remember until the unit has completed its warm up these parameters
may not have stabilized.
SAMPLE
RANGE = 500.000 PPM
< TST TST > CAL
Toggle <TST TST> keys to
scroll through list of functions
1
04584 Rev A1
Only appears instrument is set
for DUAL or AUTO reporting
range modes
CO2 = XXX.X
SETUP
RANGE
RANGE11
RANGE21
STABIL
CO2 MEAS
CO2 REF
MR RATIO
PRES
Refer to
SAMP FL
Section
SAMP TEMP 6.X.X for
BENCH TEMP definitions
WHEEL TEMP of these
test
BOX TEMP
functions.
PHT DRIVE
SLOPE
OFFSET
TEST
TIME
25
Model GFC7000E Instruction Manual
Getting Started
3. If your analyzer has a Ethernet card (Option 63) installed and your network is running a
dynamic host configuration protocol (DHCP) software package, the Ethernet option will
automatically configure its interface with your LAN. However, it is a good idea to check these
settings to make sure that the DHCP has successfully downloaded the appropriate network
settings from your network server (See Section 6.10.9.2).
If your network is not running DHCP, you will have to configure the analyzer’s interface
manually (See Section 6.10.9.3).
3.3. Initial Calibration Procedure
The next task is to calibrate the analyzer.
To perform the following calibration you must have sources for zero air and span gas available for
input into the sample port on the back of the analyzer. See Section 3.1.2 for instructions for
connecting these gas sources.
While it is possible to perform this procedure with any range setting we recommend that you
perform this initial checkout using the 50 ppm range.
NOTE
The following procedure assumes that the instrument does not have any of
the available Zero/Span Valve Options installed.
See Section 7.4 for instructions for calibrating instruments possessing Z/S
valve options.
1. Set the Analog Output Range of the MGFC7000E
04584 Rev A1
26
Model GFC7000E Instruction Manual
SAMPLE
Getting Started
RANGE = 500.000 PPM
CO2 =X.XXX
< TST TST > CAL
SAMPLE
8
SETUP
ENTER SETUP PASS : 818
1
8
ENTR EXIT
SETUP X.X
CFG DAS RNGE PASS CLK MORE
SETUP X.X
EXIT
RANGE CONTROL MENU
MODE SET UNIT
EXIT
Press this button to select the
concentration units of measure:
Press this button to set
the analyzer for SNGL
DUAL or AUTO ranges
PPB, PPM, UGM, MGM
SETUP X.X
0
To change the value of the
reporting range span, enter the
number by pressing the key under
each digit until the expected value
appears.
5
SETUP X.X
0
04584 Rev A1
0
RANGE: 500.000 CONC
0
0
0
.0
ENTR EXIT
RANGE: 500.000 Conc
0
5
0
.0
EXIT ignores the new setting and
returns to the RANGE CONTROL
MENU.
ENTR accepts the new setting and
returns to the
RANGE CONTROL MENU.
ENTR EXIT
27
Model GFC7000E Instruction Manual
Getting Started
2. Set the expected CO2 span gas concentration
SAMPLE*
RANGE = 500.000 PPM
CO2 =X.XXX
< TST TST > CAL
The CO2 span
concentration values
automatically default to
400.0 Conc.
To change this value to
the actual concentration of
the span gas, enter the
number by pressing the
key under each digit until
the expected value
appears.
SETUP
M-P CAL
RANGE = 500.000 PPM
< TST TST >
ZERO
CO2 =X.XXX
EXIT
CONC
M-P CAL
CO2 SPAN CONC: 400.000 Conc
0
0
0
4
5
.0
This sequence causes the
analyzer to prompt for the
expected CO2 span
concentration.
ENTR EXIT
EXIT ignores the new setting
and returns to the previous
display.
ENTR accepts the new setting
and returns to the
previous display..
NOTE
For this Initial Calibration it is important to independently verify the precise CO2
Concentration Value of the SPAN gas.
If the source of the Span Gas is from a Calibrated Bottle, use the exact concentration
value printed on the bottle.
04584 Rev A1
28
Model GFC7000E Instruction Manual
Getting Started
3. Perform the Zero/Span Calibration Procedure
SAMPLE*
RANGE = 500.000 PPM
CO2 =XXX.X
< TST TST > CAL
SAMPLE
SETUP
STABIL=XXX.X PPM
Set the Display to show the
STABIL test function.
This function calculates the
stability of the COx
measurement
CO2 =XXX.X
< TST TST > CAL
SETUP
ACTION:
Allow zero gas to enter the sample port at the
rear of the instrument.
Wait until STABIL
falls below 1.0 ppm.
M-P CAL
STABIL=XXX.X PPM
CO2 =XXX.X
< TST TST > CAL
M-P CAL
SETUP
STABIL=XXX.X PPM
< TST TST > ZERO
M-P CAL
CO2 =XXX.X
CONC
STABIL=XXX.X PPM
< TST TST > ENTR
This may take several
minutes.
EXIT
CO2 =XXX.X
CONC
EXIT
Press ENTR to changes the
OFFSET & SLOPE values for the
CO2 measurements.
Press EXIT to leave the calibration
unchanged and return to the
previous menu.
ACTION:
Allow span gas to enter the sample port at the
rear of the instrument.
The value of
STABIL may jump
significantly.
Wait until it falls back
below 1.0 ppm
The SPAN key now
appears during the
transition from zero to
span.
M-P CAL
STABIL=XXX.X PPM
< TST TST >
SPAN
CO2 =XXX.X
CONC
This may take several
minutes.
EXIT
You may see both keys.
If either the ZERO or
SPAN buttons fail to
appear see Section 11
for troubleshooting tips.
M-P CAL
RANGE = 500.000 PPM
CO2 =XXX.X
< TST TST > ENTR SPAN CONC
M-P CAL
RANGE = 500.000 PPM
< TST TST > ENTR
EXIT
Press ENTR to change the
OFFSET & SLOPE values for the
CO2 measurements.
Press EXIT to leave the calibration
unchanged and return to the
previous menu.
CO2 =XXX.X
CONC
EXIT
EXIT returns to the main
SAMPLE display
The Model GFC7000E Analyzer is now ready for operation
04584 Rev A1
29
Model GFC7000E Instruction Manual
Getting Started
NOTE
Once you have completed the above set-up procedures, please fill out the Quality
Questionnaire that was shipped with your unit and return it to Teledyne Instruments.
This information is vital to our efforts in continuously improving our service and our
products.
THANK YOU.
Front Panel
IR Source
On/Off Switch &
Circuit Breaker
Particulate Filter
GFC Wheel
Housing Purge
Gas Inlet & Flow
Control Orifice
GFC Motor
PS1 (+5 VDC; ±15VDC)
Optional
Sample/Cal
Valve
Optional
Zero/Span
Valve
Gas Flow
Sensor Assy
Flow Sensor
Optional
Shutoff
Valve
Purge Gas
Pressure
Control Assy
Relay Board
Pump Assy
PS2 (+12 VDC)
Sample Gas
Critical
Flow Orifice
OPTICAL BENCH
GFC Wheel Housing
& IR Source Heat
SYNC/DEMOD BOARD
Optical Bench
Gas Inlet
Sample Gas
Pressure Sensor
Optical Bench
Gas Outlet
Sample Gas
Temperature
Sensor
Mother
Board
CPU Card
Power
Receptacle
Optional
Ethernet Card
Rear Panel
Fan
Figure 3-11:
04584 Rev A1
Assembly Layout
30
Model GFC7000E Instruction Manual
Getting Started
Sample Gas Outlet
fitting
Sample Gas Flow
Sensor
Sample Chamber
Sync/Demod PCA
Housing
Pressure Sensor(s)
Bench
Temperature
Thermistor
Shock Absorbing
Mounting Bracket
Opto-Pickup
PCA
Purge Gas
Pressure Regulator
IR Source
GFC Wheel
Heat Sync
GFC Wheel Motor
GFC Temperature
Sensor
Purge Gas
Inlet
GFC Heater
Figure 3-12:
Optical Bench Layout
SAMPLE GAS
INLET
PUMP
EXHAUST GAS
OUTLET
Purge Gas
Pressure
Control Assy
Sample Gas Critical
Flow Orifice
INSTRUMENT CHASSIS
Purge Gas
Flow Rate
Control
Orifice
GFC Wheel
Motor
GFC Motor
Heat Sync
GFC Wheel
Housing
PURGE GAS
INLET
FLOW / PRESSURE
SENSOR PCA
VENT SPAN
OUTLET
FLOW
SENSOR
SAMPLE
PRESSURE
SENSOR
SAMPLE CHAMBER
PRESSURE
SPAN INLET
PARTICULATE
FILTER
IZS INLET
Figure 3-13:
04584 Rev A1
Internal Pneumatic Flow – Basic Configuration
31
Model GFC7000E Instruction Manual
Getting Started
User Notes
04584 Rev A1
32
Model GFC7000E Instruction Manual
Frequently Asked Questions
4. FREQUENTLY ASKED QUESTIONS
4.1. FAQ’s
The following is a list from the Teledyne Instruments’ Customer Service Department of the most
commonly asked questions relating to the Model CO2 Analyzer.
Q: How do I get the instrument to zero / Why is the zero key not displayed?
A: See Section 11.2.4 Inability to zero.
Q: How do I get the instrument to span / Why is the span key not displayed?
A: See Section 11.2.3 Inability to span.
Q: Why does the ENTR key sometimes disappear on the Front Panel Display?
A: During certain types of adjustments or configuration operations, the ENTR key will disappear if
you select a setting that is nonsensical (such as trying to set the 24-hour clock to 25:00:00) or
out of the allowable range for that parameter (such as selecting an iDAS Holdoff period of more
than 20 minutes).
Once you adjust the setting in question to an allowable value, the ENTR key will re-appear.
Q: Is there an optional midpoint calibration?
A: There is an optional mid point linearity adjustment, however, midpoint adjustment is applicable
only to applications where CO2 measurements are expected above 100 ppm. Call Teledyne
Instruments’ Service Department for more information on this topic.
Q: How do I make the display and datalogger analog input agree?
A: This most commonly occurs when an independent metering device is used besides the
datalogger/recorded to determine gas concentration levels while calibrating the analyzer. These
disagreements result from the analyzer, the metering device and the datalogger having slightly
different ground levels.
If the only difference is a DC offset then it is possible to enter a compensating value in the analog
outputs. This procedure is described in Section 6.9.4.3 of this manual.
Alternately, use the datalogger itself as the metering device during calibrations procedures.
Q: How do I perform a leak check?
See Section 9.3.3.
Q: How do I measure the sample flow?
A: Sample flow is measured by attaching a calibrated rotameter, wet test meter, or other flowmeasuring device to the sample inlet port when the instrument is operating. The sample flow
should be 800 cm3/min ±10%. See Section 9.3.4.
04584 Rev A1
33
Model GFC7000E Instruction Manual
Frequently Asked Questions
Q: How long does the IR source last?
A: Typical lifetime is about 2-3 years.
Q: Where is the sintered filter/sample flow control orifice?
A: These components are located inside the flow control assembly that is attached to the inlet side
of the sample pump, see Figure 3-13. See Section 11.5.1 for instructions on disassembly and
replacement.
Q: How do I set up a SEQUENCE to run a nightly calibration check?
A: The setup of this option is located in Section 7.6.
Q: How do I set the analog output signal range and offset?
A: Instructions for this can be found in Section 6.9.4 which describes analog I/O configuration.
Q: What is the averaging time for an GFC7000E?
A: The default averaging time, optimized for ambient pollution monitoring, is 150 seconds for
stable concentrations and 10 seconds for rapidly changing concentrations; see Section 10.5.1 for
more information. However, it is adjustable over a range of 0.5 second to 200 seconds (please
contact customer service for more information).
4.2. Glossary
ASSY - acronym for Assembly
DAS - acronym for data acquisition system, the old acronym of iDAS.
DIAG - acronym for diagnostics, the diagnostic settings of the analyzer
DHCP: acronym for dynamic host configuration protocol. A protocol used by LAN or Internet
servers to automatically set up the interface protocols between themselves and any other
addressable device connected to the network.
DOC - Disk On Chip, the analyzer’s central storage area for analyzer firmware, configuration
settings and data. This is a solid state device without mechanically moving parts that acts as a
computer hard disk drive under Æ DOS with disk label “C”. DOC chips come with 8 mb in the Eseries analyzer standard configuration but are available in larger sizes.
DOS - Disk Operating System. The E-series analyzers uses DR DOS
EEPROM - also referred to as a FLASH chip.
FLASH - flash memory is non-volatile, solid-state memory.
GFC – Acronym for Gas Filter Correlation.
I2C bus - a clocked, bi-directional, serial bus for communication between individual analyzer
components
04584 Rev A1
34
Model GFC7000E Instruction Manual
Frequently Asked Questions
iDAS - acronym for internal data acquisition system
IP – acronym for internet protocol
LAN - acronym for local area network
LED - acronym for light emitting diode
PCA - acronym for printed circuit assembly, the Æ PCB with electronic components, ready to use.
PCB - acronym for printed circuit board, the bare board without electronic components
RS-232 - an electronic communications type of a serial communications port
RS-485 - an electronic communications type of a serial communications port
TCP/IP - acronym for transfer control protocol / internet protocol, the standard communications
protocol for Ethernet devices.
VARS - acronym for variables, the variables settings of the analyzer
User Notes
04584 Rev A1
35
Model GFC7000E Instruction Manual
Optional Hardware and Software
5. OPTIONAL HARDWARE AND SOFTWARE
This section includes a brief description of the hardware and software options available for the
Model GFC7000E Gas Filter Correlation Carbon Dioxide Analyzer. For assistance with ordering
these options please contact the Sales department of Teledyne – Advanced Pollution Instruments
at:
TEL:
TEL:
FAX:
WEB SITE:
626-961-9221
626-934-1500
626-961-2538
www.teledyne-ai.com
5.1. Rack Mount Kits (Options 20a, 20b & 21)
Option Number
OPT 20A
OPT 20B
OPT 21
Description
Rack mount brackets with 26 in. chassis slides.
Rack mount brackets with 24 in. chassis slides.
Rack mount brackets only
Each of these options, permits the Analyzer to be mounted in a standard 19" x 30" RETMA rack.
5.2. Current Loop Analog Outputs (Option 41)
This option adds isolated, voltage-to-current conversion circuitry to the analyzer’s analog outputs.
This option may be ordered separately for any of the analog outputs, it can be installed at the
factory or added later. Call Teledyne Instruments sales for pricing and availability.
The current loop option can be configured for any output range between 0 and 20 mA.
Information on calibrating or adjusting these outputs can be found in Section 6.9.4.9.
Figure 5-1:
04584 Rev A1
Current Loop Option Installed on the Motherboard
37
Model GFC7000E Instruction Manual
Optional Hardware and Software
5.3. Expendable Kits (Options 42C, 42D and 43)
OPTION NUMBER
DESCRIPTION
OPT 42C
1 year’s supply of replacement of 47mm dia. particulate filters
OPT 42D
1 full replacement’s volume of indicating soda-lime for the external CO2
scrubber included with options 51 & 53 ( approximate active lifetime: 1
year)
OPT 43
Options 42 C & 42D
5.4. Calibration Valves Options
There are four available options involving Zero/Span/Shutoff valves. From an operational and
software standpoint, all of the options are the same, only the source of the span and zero gases
are different.
5.4.1. Zero/Span/Shutoff Valve (Option 50)
This option requires that both zero air and span gas be supplied from external sources. It is
specifically designed for applications where span gas will be supplied from a pressurized bottle of
calibrated CO2 gas. A critical flow control orifice, internal to the instrument ensures that the
proper flow rate is maintained. An internal vent line, isolated by a shutoff valve ensures that the
gas pressure of the span gas is reduced to ambient atmospheric pressure. normally zero air would
be supplied from zero air module such as a Teledyne Instruments Model 701.
In order to ensure that span gas does not migrate backwards through the vent line and alter the
concentration of the span gas, a gas line not less than 2 meters in length should be attached to
the vent span outlet on the rear panel of the analyzer. To prevent the buildup of back pressure,
this vent line should not be greater than 10 meters in length.
The following table describes the state of each valve during the analyzer’s various operational
modes.
Table 5-1:
MODE
SAMPLE
(Normal State)
ZERO CAL
SPAN CAL
Zero/Span Valve Operating States for Options 50 & 51
VALVE
CONDITION
VALVE PORT CONNECTION
(Fig. 5-2)
Sample/Cal
Open to SAMPLE inlet
3Æ2
Zero/Span
Open to ZERO AIR inlet
3Æ2
Shutoff Valve
Closed
N/A
Sample/Cal
Open to zero/span inlet
1Æ2
Zero/Span
Open to ZERO AIR inlet
3Æ2
Shutoff Valve
Closed
N/A
Sample/Cal
Open to ZERO/SPAN inlet
1Æ2
Zero/Span
Open to SPAN GAS inlet
1Æ2
Shutoff Valve
Open to PRESSURE SPAN
Inlet
1Æ2
The minimum span gas flow rate required for this option is 800 cm3/min.
04584 Rev A1
38
Model GFC7000E Instruction Manual
Optional Hardware and Software
The state of the zero/span valves can also be controlled:
•
Manually from the analyzer’s front panel by using the SIGNAL I/O controls located under
the DIAG Menu (Section 6.9.2),
•
By activating the instrument’s AutoCal feature (Section 7.6),
•
Remotely by using the external digital control inputs (Section 6.13.1.2 and Section 7.5.2),
or
•
Remotely through the RS-232/485 serial I/O ports (see Appendix A-6 for the appropriate
commands).
SAMPLE GAS
INLET
PUMP
Sample Gas Critical
Flow Orifice
INSTRUMENT CHASSIS
EXHAUST GAS
OUTLET
GFC Wheel
Motor
Purge Gas
Flow Control
Orifice
GFC Motor
Heat Sync
Purge Gas
Pressure
Control Assy
GFC Wheel
Housing
PURGE GAS
INLET
FLOW / PRESSURE
SENSOR PCA
FLOW
SENSOR
SAMPLE CHAMBER
PRESSURE
SPAN INLET
(Opt 53 Only)
external CO2 Scrubber
VENT SPAN
OUTLET
SAMPLE
PRESSURE
SENSOR
SHUT OFF
VALVE
1
IZS INLET
Figure 5-2:
04584 Rev A1
2
ZERO/SPAN
VALVE
SAMPLE /CAL
VALVE
2
3
3
1
1
2
PARTICULATE
FILTER
Internal Pneumatic Flow – Zero/Span/Shutoff Valves OPT 50 & 51
39
Model GFC7000E Instruction Manual
Optional Hardware and Software
5.4.2. Zero/Span/Shutoff with External CO2 Scrubber
(Option 51)
Option 51 is operationally and pneumatically identical to Option 50 above (see section 5.4.1),
except that the zero air is generated by an externally mounted zero air scrubber filled with
indicating soda-lime that changes color from white to pink as it becomes saturated.
5.4.3. Zero/Span Valve (Option 52)
This valve option is intended for applications where zero air is supplied by a zero air generator like
the Teledyne Instruments Model 701 and span gas are being supplied by Gas Dilution Calibrator
Like the Teledyne Instruments Model 700 or 702. Internal zero/span and sample/cal valves
control the flow of gas through the instrument, but because the calibrator limits the flow of span
gas no shutoff valve is required.
In order to ensure that span gas does not migrate backwards through the vent line and alter the
concentration of the span gas, a gas line not less than 2 meters in length should be attached to
the vent span outlet on the rear panel of the analyzer. To prevent the buildup of back pressure,
this vent line should not be greater than 10 meters in length.
The following table describes the state of each valve during the analyzer’s various operational
modes.
Table 5-2:
Zero/Span Valve Operating States for Options 52 & 53
Mode
Valve
Condition
Valve Port Connection
(Fig. 5-2)
SAMPLE
Sample/Cal
Open to SAMPLE inlet
3Æ2
(Normal State)
Zero/Span
Open to ZERO AIR inlet
3Æ2
Sample/Cal
Open to zero/span inlet
1Æ2
Zero/Span
Open to ZERO AIR inlet
3Æ2
Sample/Cal
Open to ZERO/SPAN inlet
1Æ2
Zero/Span
Open to SPAN GAS inlet
ZERO CAL
SPAN CAL
1Æ2
3
The minimum span gas flow rate required for this option is 800 cm /min.
The state of the zero/span valves can also be controlled:
•
Manually from the analyzer’s front panel by using the SIGNAL I/O controls located under
the DIAG Menu (Section 6.9.2),
•
By activating the instrument’s AutoCal feature (Section 7.6),
•
Remotely by using the external digital control inputs (Section 6.13.1.2 and Section 7.5.2),
or
•
Remotely through the RS-232/485 serial I/O ports (see Appendix A-6 for the appropriate
commands).
04584 Rev A1
40
Model GFC7000E Instruction Manual
Optional Hardware and Software
Sample Gas Critical
Flow Orifice
INSTRUMENT CHASSIS
SAMPLE GAS
INLET
PUMP
EXHAUST GAS
OUTLET
GFC Wheel
Motor
Purge Gas
Flow Control
Orifice
GFC Motor
Heat Sync
Purge Gas
Pressure
Control Assy
GFC Wheel
Housing
PURGE GAS
INLET
FLOW / PRESSURE
SENSOR PCA
External CO2 Scrubber
( Option 53 Only)
VENT SPAN
OUTLET
SAMPLE
PRESSURE
SENSOR
SAMPLE CHAMBER
FLOW
SENSOR
PRESSURE
SPAN INLET
ZERO/SPAN
VALVE
SAMPLE /CAL
VALVE
2
3
3
1
1
IZS INLET
Figure 5-3:
2
PARTICULATE
FILTER
Internal Pneumatic Flow – Zero/Span OPT 52 & 53
5.4.4. Zero/Span Valve with External CO2 Scrubber (Option 53)
Option 53 is operationally and pneumatically identical to Option 52 above (see Section 5.4.3),
except that the zero air is generated by an externally mounted zero air scrubber filled with
indicating soda-lime that changes color from white to pink as it becomes saturated.
5.5. Communication Options
5.5.1. RS232 Modem Cable (Option 60)
This option consists of a cable to connect the analyzer’s COM1 port to a computer, a code
activated switch or any other communications device that is equipped with a DB-9 male
connector. The cable is terminated with two DB-9 female connectors, one of which fits the
analyzer’s COM1 port.
Some older computers or code activated switches with a DB-25 serial connector will need a
different cable or an appropriate adapter.
04584 Rev A1
41
Model GFC7000E Instruction Manual
Optional Hardware and Software
5.5.2. RS-232 Multidrop (Option 62)
The multidrop option is used with any of the RS-232 serial ports to enable communications of
several analyzers with the host computer over a chain of RS-232 cables. The option consists of a
small box, which can be attached to the analyzer, with a termination switch, a power connector
and two serial ports, one incoming from the analyzer (cable supplied) and one outgoing (requires
additional cable) to the next analyzer’s multi-drop box. One Option 62 is required per analyzer.
The first incoming port on the first box connects to the host computer and the outgoing port on
the last multi-drop box needs to be terminated. Setup and user instructions are covered in the
Teledyne Instruments’ multi-drop manual, part number 021790000.
5.5.3. Ethernet (Option 63)
The Ethernet option allows the analyzer to be connected to any Ethernet local area network (LAN)
running TCP/IP. The local area network must have routers capable of operating at 10BaseT. If
Internet access is available through the LAN, this option also allows communication with the
instrument over the public Internet.
When installed, this option is electronically connected to the instrument’s COM2 serial port making
that port no longer available for RS-232/RS-485 communications through the COM2 connector on
the rear panel. The option consists of a Teledyne Instruments designed Ethernet card (Figure 54), which is mechanically attached to the instrument’s rear panel. A 7-foot long, CAT-5 network
cable terminated at both ends with standard RJ-45 connectors is included as well. Maximum
communication speed is limited by the RS-232 port to 115.2 kBaud.
Figure 5-4:
MGFC7000E Ethernet Card and rear panel With Ethernet Installed
5.6. Additional Manuals
5.6.1. Printed Manuals (Option 70)
Additional printed copies of this manual are available from Teledyne Instruments
04584 Rev A1
42
Model GFC7000E Instruction Manual
Optional Hardware and Software
5.6.2. Manual on CD (Part number 045840200)
This operators manual is also available on CD. The electronic document is stored in Adobe
Systems Inc. Portable Document Format (PDF) and is viewable with Adobe Acrobat Reader®
software, downloadable for free at http://www.adobe.com/
The CD version of the manual has many advantages:
•
Fully searchable text.
•
Hypertext links for figures, tables, table of contents and embedded references for quick
access of individual manual portions.
•
A list of thumbnails, chapters and sections displayed at the left of the text.
•
Internet links embedded in the manual will take you to the corresponding web site
(requires an internet connection).
5.7. Extended Warranty (Options 92 & 93)
Two options are available for extending Teledyne Instruments’ standard warranty (Section 2.3).
Both options have to be specified upon ordering the analyzer.
Option Number
OPT 92
OPT 93
Description
Extends warranty to cover a two (2) year period from the date of
purchase.
Extends warranty to cover a five (5) year period from the date of
purchase.
5.8. Dilution Ratio Option
The Dilution Ration Option is a software option that is designed for applications where the Sample
gas is diluted before being analyzed by the Model GFC7000E. Typically this occurs in Continuous
Emission Monitoring (CEM) applications where the quality of gas in a smoke stack is being tested
and the sampling method used to remove the gas from the stack dilutes the gas.
Once the degree of dilution is known, this feature allows the user to add an appropriate scaling
factor to the analyzer’s CO2 concentration calculation so that the Measurement Range and
concentration values displayed on the instrument’s Front Panel Display and reported via the
Analog and Serial Outputs reflect the undiluted values.
Instructions for using the dilution ratio option can be found in Section 6.7.7..
5.9. Maintenance Mode Switch
API’s instruments can be equipped with an switch that places the instrument in maintenance
mode. When present, the switch accessed by opening the hinged front panel and is located on
the rearward facing side of the display/keyboard driver PCA; on the left side; near the particulate
filter.
04584 Rev A1
43
Model GFC7000E Instruction Manual
Optional Hardware and Software
When in maintenance mode the instrument ignores all commands received via the COMM ports
that alter the operation state of the instrument This includes all calibration commands, diagnostic
menu commands and the reset instrument command. the instrument continues to measure
concentration and send data when requested.
This option is of particular use for instruments connected to multidrop or Hessen protocol
networks.
5.10. Second Language Switch
API’s instruments can be equipped with switch that activates an alternate set of display message
in a language other than the instruments default language. When present, the switch accessed by
opening the hinged front panel and is located on the rearward facing side of the display/keyboard
driver PCA; on the right side.
To activate this feature, the instrument must also have a specially programmed Disk on Chip
containing the second language.
User Notes
04584 Rev A1
44
Model GFC7000E Instruction Manual
Operating Instructions
6. OPERATING INSTRUCTIONS
To assist in navigating the analyzer’s software, a series of menu trees can be found in Appendix
A-1 of this manual.
NOTES
The flow charts appearing in this section contain typical representations of the
analyzer’s display during the various operations being described. These representations
may differ slightly from the actual display of your instrument.
The ENTR key may disappear if you select a setting that is invalid or out of the allowable
range for that parameter, such as trying to set the 24-hour clock to 25:00:00. Once you
adjust the setting to an allowable value, the ENTR key will re-appear.
6.1. Overview of Operating modes
The MGFC7000E software has a variety of operating modes. Most commonly, the analyzer will be
operating in SAMPLE mode. In this mode, a continuous read-out of the CO2 concentration is
displayed on the front panel and output as an analog voltage from rear panel terminals,
calibrations can be performed, and TEST functions and WARNING messages can be examined.
The second most important operating mode is SETUP mode. This mode is used for performing
certain configuration operations, such as for the iDAS system, the reporting ranges, or the serial
(RS-232/RS-485/Ethernet) communication channels. The SET UP mode is also used for
performing various diagnostic tests during troubleshooting.
Mode Field
SAMPLE A
<TST
RANGE = 500.00 PPM
CO2
TST> CAL
Figure 6-1:
400.00
SETUP
Front Panel Display
The mode field of the front panel display indicates to the user which operating mode the unit is
currently running.
Besides SAMPLE and SETUP, other modes the analyzer can be operated in are:
04584 Rev A1
45
Model GFC7000E Instruction Manual
Table 6-1:
Operating Instructions
Analyzer Operating modes
MODE
MEANING
DIAG
One of the analyzer’s diagnostic modes is being utilized (see Section 6.9).
M-P CAL
This is the basic, multi-point calibration mode of the instrument and is activated
by pressing the CAL key.
SAMPLE
Sampling normally, flashing indicates adaptive filter is on.
SAMPLE A
1
SETUP
1
Indicates that unit is in SAMPLE Mode and AUTOCAL feature is activated.
SETUP mode is being used to configure the analyzer (CO2 sampling will continue
during this process).
SPAN CAL A
Unit is performing span cal procedure initiated automatically by the analyzer’s
AUTOCAL feature.
SPAN CAL M
Unit is performing span cal procedure initiated manually by the user.
SPAN CAL R
Unit is performing span cal procedure initiated remotely via the RS-232, RS-4485
or digital i/o control inputs.
ZERO CAL A
Unit is performing zero cal procedure initiated automatically by the analyzer’s
AUTOCAL feature.
ZERO CAL M
Unit is performing zero cal procedure initiated manually by the user.
ZERO CAL R
Unit is performing zero cal procedure initiated remotely via the RS-232, RS-4485
or digital I/O control inputs.
The revision of the Teledyne Instruments software installed in this analyzer will be displayed
following the word SETUP. E.g. “SETUP E.0”
Finally, the various CAL modes allow calibration of the analyzer. Because of its importance, this
mode is described separately in Chapter 7.
6.2. Sample Mode
This is the analyzer’s standard operating mode. In this mode the instrument is analyzing the gas
in the sample chamber, calculating CO2 concentration and reporting this information to the user
via the front panel display, the analog outputs and, if set up properly, the RS-232/485/Ethernet
ports.
NOTE
A value of “XXXX” displayed in the CO2 Concentration field means that the M/R ratio is
invalid because CO2 REF is either too high(> 4950 mVDC) or too low (< 1250 VDC).
6.2.1. Test Functions
A series of test functions is available at the front panel while the analyzer is in SAMPLE mode.
These parameters provide information about the present operating status of the instrument and
are useful during troubleshooting (Section 11.1.2 ). They can also be recorded in one of the iDAS
channels (Section 6.12) for data analysis. To view the test functions, press one of the <TST TST>
keys repeatedly in either direction.
Table 6-2:
Parameter
04584 Rev A1
Display
Units
Test Functions Defined
Meaning
46
Model GFC7000E Instruction Manual
Operating Instructions
Title
PPB, PPM,
UGM,
MGM
The full scale limit at which the reporting range of the
analyzer is currently set.
THIS IS NOT the Physical Range of the instrument. See
Section 6.7 for more information.
STABIL
PPB, PPM
UGM,
MGM
Standard deviation of CO2 concentration readings. Data
points are recorded every ten second. The calculation uses
the last 25 data points.
CO2
MEAS
MV
The demodulated, peak IR detector output during the
measure portion of the CFG Wheel cycle.
CO2 Reference
CO2 REF
MV
The demodulated, peak IR detector output during the
reference portion of the CFG wheel cycle.
Measurement /
Reference
Ratio
MR Ratio
-
The result of CO2 MEAS divided by CO2 REF. This ratio is
the primary value used to compute CO2 concentration. The
value displayed is not linearized.
PRES
In-Hg-A
The absolute pressure of the Sample gas as measured by a
solid state pressure sensor located inside the sample
chamber.
Sample Flow
SAMPLE
FL
cc/min
Sample
Temperature
SAMP
TEMP
°C
The temperature of the gas inside the sample chamber.
Bench
Temperature
BENCH
TEMP
°C
Optical bench temperature.
Wheel
Temperature
WHEEL
TEMP
°C
Filter wheel temperature.
Box
Temperature
BOX
TEMP
°C
The temperature inside the analyzer chassis.
Photo-detector
Temp. Control
Voltage
PHT
DRIVE
mV
The drive voltage being supplied to the thermoelectric coolers
of the IR photo-detector by the sync/demod Board.
Slope
SLOPE
-
The sensitivity of the instrument as calculated during the last
calibration activity. The SLOPE parameter is used to set the
span calibration point of the analyzer.
Offset
OFFSET
-
The overall offset of the instrument as calculated during the
last calibration activity. The OFFSET parameter is used to
set the zero point of the analyzer response.
Test channel
output signal
TEST
mV, mA
Displays the signal level of the TEST analog output channel.
Only appears when the TEST channel has been activated.
Current Time
TIME
-
Range
RANGE
1
RANGE1
RANGE21
Stability
CO2 Measure
Sample
Pressure
1
Sample mass flow rate. This is computed from the differential
between the pressures measured up-stream and downstream of the sample critical flow orifice pressures.
The current time. This is used to create a time stamp on
iDAS readings, and by the AUTOCAL feature to trigger
calibration events.
Only appears when the instrument’s reporting range mode is set for DUAL or AUTO
04584 Rev A1
47
Model GFC7000E Instruction Manual
Operating Instructions
To view the TEST Functions press the following Key sequence:
SAMPLE
RANGE = 500.000 PPM
< TST TST > CAL
SETUP
RANGE
RANGE11
RANGE21
STABIL
CO2 MEAS
CO2 REF
MR RATIO
PRES
Refer to
SAMP FL
Table 6-2
for
SAMP TEMP
BENCH TEMP definitions
WHEEL TEMP of these
test
BOX TEMP
functions.
PHT DRIVE
SLOPE
OFFSET
TEST
TIME
Toggle <TST TST> keys to
scroll through list of functions
1
Only appears instrument is set
for DUAL or AUTO reporting
range modes
Figure 6-2
CO2 = XXX.X
Viewing MGFC7000E TEST Functions
NOTE
A value of “XXXX” displayed for any of the TEST functions indicates an out-of-range
reading or the analyzer’s inability to calculate it.
All pressure measurements are represented in terms of absolute pressure. Absolute,
atmospheric pressure is 29.92 in-Hg-A at sea level. It decreases about 1 in-Hg per 300
m gain in altitude. A variety of factors such as air conditioning and passing storms can
cause changes in the absolute atmospheric pressure.
6.2.2. Warning Messages
The most common instrument failures will be reported as a warning on the analyzer’s front panel
and through the COM ports. Section 11.1.1 explains how to use these messages to troubleshoot
problems. Section 3.2.3 shows how to view and clear warning messages.
Table 6-3 lists all warning messages for the current version of software.
04584 Rev A1
48
Model GFC7000E Instruction Manual
Table 6-3:
MESSAGE
Operating Instructions
List of Warning Messages
MEANING
ANALOG CAL WARNING
The instruments A/D circuitry or one of its analog outputs is not calibrated.
BENCH TEMP WARNING
The Temperature of the optical bench is outside the specified limits.
BOX TEMP WARNING
Remote span calibration failed while the dynamic span feature was set to
turned on
CANNOT DYN SPAN
Remote zero calibration failed while the dynamic zero feature was set to
turned on
CANNOT DYN ZERO
Configuration was reset to factory defaults or was erased.
CONC ALRM1 WARNING
Concentration alarm 1 is enabled and the measured CO2 level is ≥ the set
point.
CONC ALRM2 WARNING
Concentration alarm 2 is enabled and the measured CO2 level is ≥ the set
point.
CONFIG INITIALIZED
DATA INITIALIZED
FRONT PANEL WARN
PHOTO TEMP WARNING
REAR BOARD NOT DET
Configuration storage was reset to factory configuration or erased.
iDAS data storage was erased.
Firmware is unable to communicate with the front panel.
The temperature of the IR photometer is outside the specified limits.
The CPU is unable to communicate with the motherboard.
RELAY BOARD WARN
The firmware is unable to communicate with the relay board.
SAMPLE FLOW WARN
The flow rate of the sample gas is outside the specified limits.
SAMPLE PRESS WARN
Sample gas pressure outside of operational parameters.
SAMPLE TEMP WARN
The temperature of the sample gas is outside the specified limits.
SOURCE WARNING
SYNC WARNING
SYSTEM RESET
WHEEL TEMP WARNING
04584 Rev A1
The IR source may be faulty.
The instrument is not properly tracking the rotation of the Gas Filter
Correlation wheel.
The computer was rebooted.
The Gas Filter Correlation wheel temperature is outside the specified limits.
49
Model GFC7000E Instruction Manual
Operating Instructions
To view and clear warning messages
SAMPLE
TEST deactivates warning
messages
TEST
HVPS WARNING
CAL
MSG
RANGE=500.000 PPM
SAMPLE
MSG
< TST TST > CAL
HVPS WARNING
SAMPLE
NOTE:
If the warning message persists
after several attempts to clear it,
the message may indicate a
real problem and not an artifact
of the warm-up period
Figure 6-3
TEST
CAL
MSG
CO2 = 0.00
CLR
SETUP
CO2 = 0.00
CLR
SETUP
CO2 = 0.00
CLR
SETUP
Make sure warning messages are
not due to real problems.
MSG activates warning
messages.
<TST TST> keys replaced with
TEST key
Press CLR to clear the current
message.
If more than one warning is active, the
next message will take its place
Once the last warning has been
cleared, the analyzer returns to
SAMPLE mode
Viewing and Clearing MGFC7000E WARNING Messages
6.3. Calibration Mode
Pressing the CAL key switches the MGFC7000E into multi-point calibration mode. In this mode,
the user can calibrate the instrument or check the instruments calibration with the use of
calibrated zero or span gases.
If the instrument includes either the zero/span valve option or IZS option, the display will also
include CALZ and CALS keys. Pressing either of these keys also puts the instrument into
multipoint calibration mode.
•
The CALZ key is used to initiate a calibration of the zero point.
•
The CALS key is used to calibrate the span point of the analyzer. It is recommended that
this span calibration is performed at 90% of full scale of the analyzer’s currently selected
reporting range.
Because of their critical importance and complexity, calibration operations are described in detail
in Chapter 7 of this manual. For more information concerning the zero/span, zero/span/shutoff
and IZS valve options, see Section 5.4.
6.3.1. SETUP – PASS: Calibration Password Security
The MGFC7000E calibration functions may be password protected for to prevent inadvertent
adjustments. When the calibration password has been enabled using the PASS menu item found
under the Setup Menu (see below), the system will prompt the user for a password anytime CAL,
CALZ, CALS activated.
04584 Rev A1
50
Model GFC7000E Instruction Manual
Operating Instructions
The default status of the calibration password is OFF. To enable the calibration password press:
SAMPLE
RANGE = 500.000 PPM
CO2 =X.XXX
< TST TST > CAL
SAMPLE
8
SETUP
ENTR accepts
displayed
password value
ENTER SETUP PASS : 818
1
SETUP X.X
8
ENTR EXIT
PRIMARY SETUP MENU
CFG DAS RNGE PASS CLK MORE
SETUP X.X
CAL. PASSWORD
default state is
OFF
EXIT
CAL. PASSWORD ENABLE: OFF
OFF
SETUP X.X
EXIT returns to
SAMPLE display
Toggles
password
status On/Off
ENTR EXIT
PASSWORD ENABLE: ON
ON
ENTR EXIT
ENTR accepts
the change
SETUP X.X
PASSWORD ENABLE: ON
ON
EXIT ignores
the change
ENTR EXIT
If the calibration password (101) is enabled, the following keypad sequence will be required to
enter one of the calibration modes:
SAMPLE*
RANGE = 500.000 PPM
CO2 =X.XXX
< TST TST > CAL CALZ CALS
SAMPLE
Prompts
password
number
0
ENTER SETUP PASS : 0
0
0
SAMPLE
Press
individual
keys to set
1
SETUP
ENTR EXIT
ENTER SETUP PASS : 0
0
1
ENTR EXIT
101
M-P CAL
RANGE = 500.000 PPM
< TST TST >
ZERO
CONC
CO2 =X.XXX
EXIT
Continue calibration process …
04584 Rev A1
51
Model GFC7000E Instruction Manual
Operating Instructions
6.4. SETUP Mode
The SETUP mode contains a variety of choices that are used to configure the analyzer’s hardware
and software features, perform diagnostic procedures, gather information on the instruments
performance and configure or access data from the internal data acquisition system (iDAS). For a
visual representation of the software menu trees, refer to Appendix A-1.
The areas access under the Setup mode are:
Table 6-4:
Primary Setup Mode Features and Functions
MODE OR FEATURE
KEYPAD
LABEL
Analyzer Configuration
CFG
Auto Cal Feature
ACAL
Internal Data Acquisition
(iDAS)
DAS
Analog Output Reporting
Range Configuration
RNGE
Used to configure the output signals generated by the
instruments Analog outputs.
Calibration Password
Security
PASS
Turns the calibration password feature ON/OFF
Internal Clock
Configuration
CLK
Advanced SETUP features
MORE
Table 6-5:
DESCRIPTION
MANUAL
SECTION
Lists key hardware and software configuration
information
6.5
Used to set up an operate the AutoCal feature.
Only appears if the analyzer has one of the internal
valve options installed
7.6
Used to set up the iDAS system and view recorded data
6.12
6.7
6.3.1
Used to Set or adjust the instrument’s internal clock
This button accesses the instruments secondary setup
menu
6.6
See
Table 6-5
Secondary Setup Mode Features and Functions
MANUAL
SECTION
MODE OR FEATURE
KEYPAD
LABEL
External Communication
Channel Configuration
COMM
Used to set up and operate the analyzer’s various
external I/O channels including RS-232; RS 485,
modem communication and/or Ethernet access.
System Status Variables
VARS
Used to view various variables related to the
instruments current operational status
6.8
System Diagnostic
Features
DIAG
Used to access a variety of functions that are used to
configure, test or diagnose problems with a variety of
the analyzer’s basic systems
6.9
CO2 Concentration Alarms
ALRM
DESCRIPTION
Used to activate the analyzer’s two gas concentration
status alarms and set the alarm limits
6.10 &
6.13
6.11
NOTE
Any changes made to a variable during one of the following procedures is not
acknowledged by the instrument until the ENTR Key is pressed
04584 Rev A1
52
Model GFC7000E Instruction Manual
Operating Instructions
If the EXIT key is pressed before the ENTR key, the analyzer will beep alerting the user
that the newly entered value has been lost.
6.4.1. SETUP Mode Password Security
Whenever the Model GFC7000E’s SETUP mode is activated the instrument will prompt the user to
enter a security password. The default password is 818. This allows access to all of the
instruments basic functions and operating modes as well as some of its more powerful diagnostic
tools and variables.
The analyzer will automatically insert 818 into the password prompt field. Simply press ENTR to
proceed.
Other password levels exist allowing access to special diagnostic tools and variables used only for
specific and rarely needed troubleshooting and adjustment procedures. They may be made
available as needed by Teledyne Instruments’ Customer Service department.
6.5. SETUP – CFG: Viewing the Analyzer’s
Configuration Information
Pressing the CFG key displays the instrument configuration information. This display lists the
analyzer model, serial number, firmware revision, software library revision, CPU type and other
information. Use this information to identify the software and hardware when contacting customer
service. Special instrument or software features or installed options may also be listed here.
SAMPLE*
RANGE = 500.000 PPB
CO2 =X.XXX
< TST TST > CAL
SAMPLE
Press NEXT of PREV to move back
and forth through the following list
of Configuration information:
• MODEL NAME
• SERIAL NUMBER
• SOFTWARE REVISION
• LIBRARY REVISION
•
iCHIP SOFTWARE REVISION1
•
HESSEN PROTOCOL REVISION1
•
ACTIVE SPECIAL SOFTWARE
OPTIONS1
• CPU TYPE
• DATE FACTORY CONFIGURATION
SAVED
SETUP
ENTER SETUP PASS : 818
8
1
SAMPLE
8
ENTR EXIT
PRIMARY SETUP MENU
CFG DAS RNGE PASS CLK MORE
SAMPLE
NEXT
PREV
EXIT
GFC7000E CO2 ANALYZER
EXIT
Press EXIT at
any time to
return to the
SAMPLE display
Press EXIT at
any time to
return to
SETUP menu
1
Only appears if relevant option of Feature is active.
04584 Rev A1
53
Model GFC7000E Instruction Manual
Operating Instructions
6.6. SETUP – CLK: Setting the Internal Time-of-Day
Clock
The MGFC7000E has a time of day clock that supports the AutoCal timer, time of day TEST
function, and time stamps on most COM port messages. To set the time-of-day, press:
SAMPLE
RANGE = 500.000 PPM
CO2 =X.XXX
SETUP
< TST TST > CAL
ENTER SETUP PASS : 818
SAMPLE
8
1
SETUP X.X
8
ENTR EXIT
PRIMARY SETUP MENU
CFG DAS RNGE PASS CLK MORE
SETUP X.X
Enter Current
Time-of-Day
TIME-OF-DAY CLOCK
TIME DATE
SETUP X.X
SETUP X.X3
0 1
ENTR EXIT
0 1
ENTR EXIT
SETUP X.X
0 2
SETUP X.X
JAN
ENTR EXIT
DATE: 01-JAN-02
0 2
ENTR EXIT
TIME-OF-DAY CLOCK
TIME DATE
EXIT
PRIMARY SETUP MENU
CFG DAS RNGE PASS CLK MORE
04584 Rev A1
JAN
Enter Current
Date-of-Year
DATE: 01-JAN-02
SETUP X.X
TIME: 12:00
1 2 :0 0
EXIT
SETUP X.X
TIME: 12:00
1 2 :0 0
EXIT
EXIT
EXIT returns
to the main
SAMPLE display
54
Model GFC7000E Instruction Manual
Operating Instructions
In order to compensate for CPU clocks which run faster or slower, you can adjust a variable called
CLOCK_ADJ to speed up or slow down the clock by a fixed amount every day. To change this
variable, press:
SAMPLE
RANGE = 500.000 PPM
CO2 =X.XXX
< TST TST > CAL
SAMPLE
SETUP
SETUPX.X
1 ) CONC_PRECISION = 3
PREV NEXT JUMP
EDIT PRNT EXIT
ENTER SETUP PASS : 818
Continue to press NEXT until …
8
1
SETUP X.X
8
ENTR EXIT
SETUP X.X
PRIMARY SETUP MENU
CFG DAS RNGE PASS CLK MORE
EXIT
PREV
JUMP
SETUP X.X
SETUP X.X
4) CLOCK_ADJ=0 Sec/Day
EDIT PRNT EXIT
CLOCK_ADJ:0 Sec/Day
SECONDARY SETUP MENU
+
COMM VARS DIAG
0
0
ENTR EXIT
EXIT
Enter sign and number of seconds per
day the clock gains (-) or loses (+).
SETUP X.X
0 ) DAS_HOLD_OFF=15.0 Minutes
NEXT JUMP
EDIT PRNT EXIT
SETUP X.X
4) CLOCK_ADJ=0 Sec/Day
PREV NEXT JUMP
EDIT PRNT EXIT
3x EXIT returns
to the main SAMPLE display
04584 Rev A1
55
Model GFC7000E Instruction Manual
Operating Instructions
6.7. SETUP – RNGE: Analog Output Reporting Range
Configuration
The analyzer has three active analog output signals, accessible through a connector on the rear
panel.
ANALOG OUT
SO2 concentration
outputs
Test Channel
Not Used
+
A1
-
LOW range when
DUAL mode is selected
Figure 6-4:
+
A2
-
A3
+
-
A4
+
-
HIGH range when
DUAL mode is selected
Analog Output Connector Pin Out
All three outputs can be configured either at the factory or by the user for full scale outputs of 0.1
VDC, 1VDC, 5VDC or 10VDC. Additionally A1 and A2 may be equipped with optional 0-20 mADC
current loop drivers and configured for any current output within that range (e.g. 0-20, 2-20, 420, etc.). The user may also adjust the signal level and scaling of the actual output voltage or
current to match the input requirements of the recorder or datalogger (see Section 6.9.4).
The A1 and A2 channels output a signal that is proportional to the CO2 concentration of the
sample gas. Several modes are available which allow them to operate independently or be slaved
together (see Section 6.7). The user may also select between a variety of reporting range spans
(see Sections 6.7.3, 6.7.4 and 6.7.5).
EXAMPLE:
A1 OUTPUT: Output Signal = 0-5 VDC representing 0-1000 ppm concentration values
A2 OUTPUT: Output Signal = 0 – 10 VDC representing 0-500 ppm concentration values.
The output, labeled A3 is special. It can be set by the user (see Section 6.9.9) to output several
of the test functions accessible through the <TST TST> keys of the units sample display.
Output A4 is not available on the Model GFC7000E analyzer.
6.7.1. Physical Range versus Analog Output Reporting Ranges
Functionally, the Model GFC7000E Gas Filter Correlation CO2 Analyzer has one hardware Physical
Range that is capable of determining CO2 concentrations between 50 ppb and 2 000 ppm. This
architecture improves reliability and accuracy by avoiding the need for extra, switchable, gainamplification circuitry. Once properly calibrated, the analyzer’s front panel will accurately report
concentrations along the entire span of its 50 ppb and 2 000 ppm physical range.
Because, most applications use only a small part of the analyzer’s physical range, the width of the
Model GFC7000E’s physical range can create data resolution problems for most analog recording
devices. For example, in an application where the expected concentration of CO2 is typically less
04584 Rev A1
56
Model GFC7000E Instruction Manual
Operating Instructions
than 500 ppm, the full scale of expected values is only 25% of the instrument’s 2 000 ppm
physical range. Unmodified, the corresponding output signal would also be recorded across only
25% of the range of the recording device.
The MGFC7000E solves this problem by allowing the user to select a scaled reporting range for the
analog outputs that only includes that portion of the physical range relevant to the specific
application. Only the reporting range of the analog outputs is scaled, the physical range of the
analyzer and the readings displayed on the front panel remain unaltered.
6.7.2. Reporting Range Modes
The MGFC7000E provides three analog output range modes to choose from.
•
Single range (SNGL) mode sets a single maximum range for the analog output. If single
range is selected (see Section 6.7.3) both outputs are slaved together and will represent
the same measurement span (e.g. 0-50 ppm), however their electronic signal levels may
be configured for different ranges (e.g. 0-10 VDC vs. 0-.1 VDC – See Section 6.9.4.1).
Dual range (DUAL) allows the A1 and A2 outputs to be configured with different
measurement spans (see Section 6.7.4) as well as separate electronic signal levels (see
Section 6.9.4.1).
•
Auto range (AUTO) mode gives the analyzer to ability to output data via a low range and
high range. When this mode is selected (see Section 6.7.5) the MGFC7000E will
automatically switch between the two ranges dynamically as the concentration value
fluctuates.
Range status is also output via the External Digital I/O Status Bits (see Section 6.13.1.1).
To select the Analog Output Range Type press:
04584 Rev A1
57
Model GFC7000E Instruction Manual
SAMPLE*
Operating Instructions
RANGE = 500.000 PPM
CO2 =X.XXX
< TST TST > CAL
SAMPLE
SETUP
ENTER SETUP PASS : 818
8
1
ENTR EXIT
8
SETUP X.X
CFG DAS RNGE PASS CLK MORE
SETUP X.X
EXIT
RANGE CONTROL MENU
MODE SET UNIT
SETUP X.X
EXIT
RANGE MODE: SNGL
SNGL DUAL AUTO
Only one of the
range modes may
be active at any
time.
Go To
Section
6.7.3
ENTR EXIT
Go To
Section
6.7.4
EXIT Returns
to the Main
SAMPLE Display
Go To
Section
6.7.5
NOTE
Upper span limit setting for the individual range modes are shared. Resetting the span
limit in one mode also resets the span limit for the corresponding range in the other
modes as follows:
SNGL
Range
DUAL
ÅÆ Range1
Range2
ÅÆ
ÅÆ
AUTO
Low Range
High Range
6.7.3. Single Range mode (SNGL)
This is the default reporting range mode for the analyzer. In single range mode both A1 and A2
are set to the same reporting range. This reporting range can be any value between 50 ppb and 2
000 ppm.
While the two outputs always have the same reporting range, the span, signal offset and scaling
of their electronic signals may be configured for differently (e.g., A1 = 0-10 V; A2 = 0-0.1 V).
See Section 6.9.4 for instructions on adjusting these parameters.
To select SNGLE range mode and to set the upper limit of the range, press:
04584 Rev A1
58
Model GFC7000E Instruction Manual
SAMPLE*
RANGE = 500.000 PPM
CO2 X.XXX
< TST TST > CAL
8
SETUP
1
SETUP C.3
8
ENTR EXIT
PRIMARY SETUP MENU
CFG DAS RNGE PASS CLK MORE
SETUP C.3
SETUP C.3
EXIT
RANGE MODE: SNGL
04584 Rev A1
MODE SET UNIT
0
0
EXIT
RANGE: 500.0 Conc
5
SETUP C.3
ENTR EXIT
ENTR EXIT
RANGE CONTROL MENU
SETUP C.3
EXIT
SNGL DUAL AUTO
SNGL DUAL AUTO
SETUP C.3
RANGE CONTROL MENU
MODE SET UNIT
RANGE MODE: SNGL
SETUP C.3
ENTER SETUP PASS : 818
SAMPLE
Operating Instructions
MODE SET UNIT
0
0
.0
ENTR EXIT
RANGE CONTROL MENU
EXIT
EXIT x 2 returns
to the main
SAMPLE display
59
Model GFC7000E Instruction Manual
Operating Instructions
6.7.4. Dual Range Mode (DUAL)
Selecting Dual Range mode allows the A1 and A2 outputs to be configured with different
reporting ranges. The analyzer software calls these two ranges low and high. The low range
setting corresponds with the analog output labeled A1 on the Rear Panel of the instrument. The
high Range Setting corresponds with the A2 output. While the software names these two ranges
low and high, they do not have to be configured that way. For example: The low range can be set
for a span of 0-1000 ppm while the high range is set for 0-500 ppm.
In DUAL range mode the RANGE test function displayed on the front panel will be replaced by
two separate functions:
•
RANGE1: The range setting for the A1 output.
•
RANGE2: The range setting for the A2 output.
To set the ranges press following keystroke sequence
.
SAMPLE*
RANGE = 500.000 PPM
CO2 =X.XXX
< TST TST > CAL
SAMPLE
8
SETUP
ENTER SETUP PASS : 818
1
SETUP X.X
PRIMARY SETUP MENU
CFG DAS RNGE PASS CLK MORE
SETUP X.X
SETUP X.X
EXIT
RANGE MODE: SNGL
MODE SET UNIT
0
0
0
0
SETUP X.X
ENTR EXIT
ENTR EXIT
RANGE CONTROL MENU
EXIT
LOW RANGE: 500.0 Conc
1
0
SETUP X.X
EXIT
SNGL DUAL AUTO
SNGL DUAL AUTO
SETUP X.X
RANGE CONTROL MENU
MODE SET UNIT
RANGE MODE: DUAL
SETUP X.X
ENTR EXIT
8
SETUP X.X
0
.0
ENTR EXIT
HIGH RANGE: 500.0 Conc
5
0
0
.0
ENTR EXIT
RANGE CONTROL MENU
MODE SET UNIT
Toggle the
Numeral Keys
to set the upper
limit of each
range.
EXIT
EXIT Returns
to the Main
SAMPLE Display
When the instrument’s range mode is set to DUAL the concentration field in the upper right hand
corner of the display alternates between displaying the low range value and the high range value.
The concentration currently being displayed is identified as follows: C1 = Low (or A1) and C2 =
High (or A2).
NOTE
In DUAL range mode the LOW and HIGH ranges have separate slopes and offsets for
computing CO2 concentration.
The two ranges must be independently calibrated.
04584 Rev A1
60
Model GFC7000E Instruction Manual
Operating Instructions
6.7.5. Auto Range Mode (AUTO)
In AUTO range mode, the analyzer automatically switches the reporting range between two userdefined ranges (low and high). The unit will switch from low range to high range when the CO2
concentration exceeds 98% of the low range span. The unit will return from high range back to
low range once both the CO2 concentration falls below 75% of the low range span.
In AUTO Range mode the instrument reports the same data in the same range on both the A1
and A2 outputs and automatically switches both outputs between ranges as described above.
Also, the RANGE test function displayed on the front panel will automatically switch to show
which range is in effect.
The high/low range status is also reported through the external, digital status bits (Section
6.13.1.1).
To set individual ranges press the following keystroke sequence.
SAMPLE*
RANGE = 500.000 PPM
CO2 =X.XXX
SETUP X.X
< TST TST > CAL
RANGE MODE: AUTO
SETUP
SNGL DUAL AUTO
ENTER SETUP PASS : 818
SAMPLE
8
ENTR EXIT
1
SETUP X.X
8
ENTR EXIT
RANGE CONTROL MENU
MODE SET UNIT
PRIMARY SETUP MENU
CFG DAS RNGE PASS CLK MORE
SETUP X.X
EXIT
SETUP X.X
SETUP X.X
LOW RANGE: 500.0 Conc
RANGE CONTROL MENU
0
MODE SET UNIT
SETUP X.X
EXIT
0
5
0
0
.0
ENTR EXIT
EXIT
RANGE MODE: SNGL
SNGL DUAL AUTO
EXIT x 2 returns
to the main
SAMPLE display
SETUP X.X
ENTR EXIT
0
0
HIGH RANGE: 500.0 Conc
5
0
0
.0
Toggle the numeral
keys to set the
LOW and HIGH
range value.
ENTR accepts the
new setting, EXIT
ignores the new
setting.
ENTR EXIT
CAUTION
In AUTO range mode the LOW and HIGH ranges have separate slopes and offsets for
computing CO2 concentration.
The two ranges must be independently calibrated.
NOTE
Avoid accidentally setting the low range of the instrument with a higher span limit than
the high range. This will cause the unit to stay in the low reporting range perpetually
and defeat the function of the AUTO range mode.
04584 Rev A1
61
Model GFC7000E Instruction Manual
Operating Instructions
6.7.6. Range Units
The MGFC7000E can display concentrations in parts per billion (109 mols per mol, PPB), parts per
million (106 mols per mol, PPM), micrograms per cubic meter (µg/m3, UG), milligrams per cubic
meter (mg/m3, MG) or percent (volume CO2/volume sample gas, %). Changing units affects all of
the display, analog outputs, COM port and iDAS values for all reporting ranges regardless of the
analyzer’s range mode.
NOTE
Concentrations displayed in mg/m3 and ug/m3 use 0°C, 760 mmHg for Standard
Temperature and Pressure (STP). Consult your local regulations for the STP used by
your agency.
Conversion factors from volumetric to mass units are:
CO2: ppb x 1.96 = µg/m3; ppm x 1.96 = mg/m3
To change the concentration units:
SAMPLE
RANGE = 500.00 PPB
CO2=X.XXX
< TST TST > CAL
ENTER SETUP PASS : 818
SAMPLE
8
SETUP
1
SETUP X.X
8
ENTR EXIT
PRIMARY SETUP MENU
CFG DAS RNGE PASS CLK MORE
SETUP X.X
SETUP X.X
EXIT
CONC UNITS: PPM
PPM PPB UGM MGM
SETUP X.X
EXIT returns
to the main menu.
RANGE CONTROL MENU
MODE SET UNIT
Select the preferred
concentration unit.
EXIT
%
ENTER EXIT
CONC UNITS: %
PPM PPB UGM MGM
%
ENTER EXIT
ENTR accepts
the new unit,
EXIT returns
to the SETUP
menu.
NOTE
Once the units of measurement have been changed the unit MUST be recalibrated, as
the “expected span values” previously in effect will no longer be valid. Simply entering
new expected span values without running the entire calibration routine is not
sufficient.
04584 Rev A1
62
Model GFC7000E Instruction Manual
Operating Instructions
6.7.7. Dilution Ratio
The dilution ratio is a software option that allows the user to compensate for any dilution of the
sample gas before it enters the sample inlet. Using the dilution ratio option is a 4-step process:
1. Select reporting range units: Follow the procedure in Section 6.7.6.
2. Select the range: Use the procedures in Section 6.7.2 – 6.7.5. Make sure that the SPAN value
entered is the maximum expected concentration of the undiluted calibration gas and that the
span gas is either supplied through the same dilution inlet system as the sample gas or has an
appropriately lower actual concentration. For example, with a dilution set to 100, a 10 ppm
gas can be used to calibrate a 1000 ppm sample gas if the span gas is not routed through the
dilution system. On the other hand, if a 1000 ppm span gas is used, it needs to pass through
the same dilution steps as the sample gas.
3. Set the dilution factor as a gain (e.g., a value of 20 means 20 parts diluting gas and 1 part of
sample gas):
SAMPLE*
RANGE = 500.000 PPM
CO2 =X.XXX
< TST TST > CAL
ENTER SETUP PASS : 818
SAMPLE
8
SETUP
1
8
ENTR EXIT
PRIMARY SETUP MENU
SETUP C.3
CFG DAS RNGE PASS CLK MORE
DIL only appears
if the dilution ratio
option has been
installed
RANGE CONTROL MENU
SETUP C.3
MODE SET UNIT DIL
This is the number by which the
analyzer will multiply the CO2
concentrations of the gas passing
through the reaction cell.
EXIT
EXIT ignores the
new setting.
DIL FACTOR: 1.0 GAIN
SETUP C.3
Toggle these keys to set the dilution
factor.
EXIT
0
0
0
SETUP C.3
0
0
1
.0
ENTR
ENTR accepts the
new setting.
EXIT
DIL FACTOR: 20.0 GAIN
2
0
.0
ENTR
EXIT
The analyzer multiplies the measured gas concentrations with this dilution factor and displays the
result.
NOTE
Once the above settings have been entered, the instrument needs to be recalibrated
using one of the methods discussed in Chapter 7.
04584 Rev A1
63
Model GFC7000E Instruction Manual
Operating Instructions
6.8. SETUP – VARS: Using the Internal Variables
The MGFC7000E has several-user adjustable software variables, which define certain operational
parameters. Usually, these variables are automatically set by the instrument’s firmware, but can
be manually re-defined using the VARS menu. Table 6-6 lists all variables that are available within
the 818 password protected level.
Table 6-6:
No.
0
1
2
Variable Names (VARS) Revision B.3
Variable
Description
DAS_HOLD_OFF
Changes the internal data acquisition system (iDAS)
hold-off time, which is the duration when data are
not stored in the iDAS because the software
considers the data to be questionable. That is the
case during warm-up or just after the instrument
returns from one of its calibration modes to SAMPLE
mode. DAS_HOLD_OFF can be disabled entirely in
each iDAS channel.
Allowed Values
Can be between
0.5 and 20
minutes
Default=15 min.
Allows the user to set the number of significant digits
AUTO, 1, 2, 3, 4
CONC_PRECISION to the right of the decimal point display of
Default=AUTO
concentration and stability values.
DYN_ZERO
3
DYN_SPAN
4
CLOCK_ADJ
04584 Rev A1
Dynamic zero automatically adjusts offset and slope
of the CO2 response when performing a zero point
calibration during an AutoCal (Chapter 7).
Dynamic span automatically adjusts slope and slope
of the CO2 response when performing a zero point
calibration during an AutoCal (Chapter 7).
Note that the DYN_ZERO and DYN_SPAN features
are not allowed for applications requiring EPA
equivalency.
ON/OFF
ON/OFF
Adjusts the speed of the analyzer’s clock. Choose the
-60 to +60 s/day
+ sign if the clock is too slow, choose the - sign if
the clock is too fast.
64
Model GFC7000E Instruction Manual
Operating Instructions
To access and navigate the VARS menu, use the following key sequence.
SAMPLE*
RANGE = 500.000 PPM
CO2 =X.XXX
< TST TST > CAL
SAMPLE
SETUP
ENTER SETUP PASS : 818
8
1
SETUP X.X
8
ENTR EXIT
PRIMARY SETUP MENU
CFG DAS RNGE PASS CLK MORE
SETUP X.X
EXIT
EXIT ignores the new setting.
SECONDARY SETUP MENU
ENTR accepts the new setting.
COMM VARS DIAG ALRM
SETUP X.X
EXIT
0 ) DAS_HOLD_OFF=15.0 Minutes
SETUP X.X
NEXT JUMP
DAS_HOLD_OFF=15.0 Minutes
EDIT PRNT EXIT
1
5
.0
ENTR EXIT
Toggle this keys to change setting
SETUP X.X
6) CONC_PRECUISION : 3
PREV NEXT JUMP
EDIT PRNT EXIT
SETUP X.X
AUTO
CONC_PRECUISION : 3
0
1
2
3
4
ENTR EXIT
Toggle these keys to change setting
SETUP X.X
4 ) DYN_ZERO=ON
PREV NEXT JUMP
EDIT PRNT EXIT
SETUP X.X
DYN_ZERO=ON
ON
SETUP X.X
ENTR EXIT
Toggle this keys to change setting
5) DYN_SPAN=ON
PREV NEXT JUMP
EDIT PRNT EXIT
SETUP X.X
DYN_SPAN=ON
ON
ENTR EXIT
Toggle this keys to change setting
SETUP X.X
7) CLOCK_ADJ=0 Sec/Day
SETUP X.X
PREV NEXT JUMP
EDIT PRNT EXIT
+
0
0
CLOCK_ADJ=0 Sec/Day
ENTR EXIT
Toggle tese keys to change setting
04584 Rev A1
65
Model GFC7000E Instruction Manual
Operating Instructions
6.9. SETUP – DIAG: Using the Diagnostics Functions
A series of diagnostic tools is grouped together under the SETUPÆMOREÆDIAG menu. As these
parameters are dependent on firmware revision (see Menu Tree A-6 in Appendix A). The individual
parameters, however, are explained in more detail in the section indicated in Table 6-7. These
tools can be used in a variety of troubleshooting and diagnostic procedures and are referred to in
many places of the maintenance and trouble-shooting sections.
Table 6-7:
GFC7000E Diagnostic (DIAG) Functions
Front Panel
Mode
Indicator
SECTION
DIAG I/O
6.9.2
ANALOG OUTPUT: When entered, the analyzer performs
an analog output step test. This can be used to calibrate
a chart recorder or to test the analog output accuracy.
DIAG AOUT
6.9.3
ANALOG I/O CONFIGURATION: the signal levels of the
instruments analog outputs may be calibrated (either
individually or as a group). Various electronic
parameters such as signal span, and offset are available
for viewing and configuration.
DIAG AIO
6.9.4
ELECTRIC TEST: The analyzer is performing an electric
test. This test simulates IR detector signal in a known
manner so that the proper functioning of the
sync/demod board can be verified.
DIAG
OPTIC
6.9.5
DARK CALIBRATION: The analyzer is performing a dark
calibration procedure. This procedure measures and
stores the inherent dc offset of the sync/demod board
electronics.
DIAG ELEC
6.9.6
PRESSURE CALIBRATION: The analyzer records the
current output of the sample gas pressure sensor. This
value is used by the CPU to compensate the CO2
concentration.
DIAG PCAL
6.9.7
FLOW CALIBRATION: This function is used to calibrate
the gas flow output signals of sample gas and ozone
supply. These settings are retained when exiting DIAG.
DIAG FCAL
6.9.8
TEST CHAN OUTPUT: Configures the A4 analog output
channel.
DIAG TCHN
6.9.9
DIAGNOSTIC FUNCTION AND MEANING
SIGNAL I/O: Allows observation of all digital and analog
signals in the instrument. Allows certain digital signals
such as valves and heaters to be toggled ON and OFF.
04584 Rev A1
66
Model GFC7000E Instruction Manual
Operating Instructions
6.9.1. Accessing the Diagnostic Features
To access the DIAG functions press the following keys:
SAMPLE*
RANGE = 500.00 PPM
CO2 =X.XXX
DIAG
< TST TST > CAL
PREV
SAMPLE
ANALOG I / O CONFIGURATION
SETUP
ENTER SETUP PASS : 818
DIAG
8
1
EXIT returns
to the PRIMARY
SETUP MENU
DIAG
CFG DAS RNGE PASS CLK MORE
ENTR EXIT
NEXT
SECONDARY SETUP MENU
DIAG
COMM VARS DIAG ALRM
DIAG
DIAG
ENTR EXIT
PREV
FLOW CALIBRATION
PREV
ENTR EXIT
NEXT
DIAG
ENTR EXIT
ENTR EXIT
NEXT
DIAG
ANALOG OUTPUT
NEXT
PRESSURE CALIBRATION
EXIT
SIGNAL I / O
NEXT
PREV
DARK CALIBRATION
EXIT
PREV
SETUP X.X
ENTR EXIT
NEXT
PRIMARY SETUP MENU
SETUP X.X
PREV
From this point
forward, EXIT returns
to the
SECONDARY
SETUP MENU
ELECTRICAL TEST
ENTR EXIT
8
PREV
EXIT returns
to the main
SAMPLE
display
ENTR EXIT
NEXT
TEST CHAN OUTPUT
NEXT
ENTR EXIT
6.9.2. Signal I/O
The signal I/O diagnostic mode allows to review and change the digital and analog input/output
functions of the analyzer. See Appendix A-4 for a complete list of the parameters available for
review under this menu.
NOTE
Any changes of signal I/O settings will remain in effect only until the signal I/O menu is
exited. Exceptions are the ozone generator override and the flow sensor calibration,
which remain as entered when exiting.
04584 Rev A1
67
Model GFC7000E Instruction Manual
Operating Instructions
To enter the signal I/O test mode, press:
SAMPLE
RANGE = 500.000 PPM
SETUP
< TST TST > CAL
8
1
8
PREV NEXT JUMP
DIAG I / O
ENTER SETUP PASS : 818
SAMPLE
SIGNAL I / O
DIAG
CO2 =X.XXX
ENTR EXIT
EXIT returns
to the main
SAMPLE display
ENTR EXIT
Test Signals Displayed Here
PREV NEXT JUMP
PRNT EXIT
EXAMPLE
SETUP X.X
CFG DAS RNGE PASS CLK MORE
SETUP X.X
DIAG I / O
PRIMARY SETUP MENU
EXIT
EXIT
Use the JUMP key to
go directly to a
specific signal
See Appendix A-4 for
a complete list of
available SIGNALS
JUMP TO: 12
2
ENTR EXIT
DIAG I / O
SECONDARY SETUP MENU
COMM VARS DIAG ALRM
1
Use the NEXT & PREV
keys to move between
signal types.
ST_CONC_VALID = ON
PREV NEXT JUMP
ON PRNT EXIT
EXAMPLE:
Enter 12 to Jump to
12) ST_CONC_VALID
Exit to return
to the
DIAG menu
Pressing the PRNT key will send a formatted printout to the serial port and can be
captured with a computer or other output device.
6.9.3. Analog Output Step Test
This test can be used to check the accuracy and proper operation of the analog outputs. The test
forces all four analog output channels to produce signals ranging from 0% to 100% of the full
scale range in 20% increments. This test is useful to verify the operation of the data
logging/recording devices attached to the analyzer.
To begin the Analog Output Step Test press:
SAMPLE
RANGE = 500.000 PPM
CO2 =X.XXX
DIAG
SETUP
NEXT
< TST TST > CAL
SAMPLE
8
SETUP X.X
8
ENTR EXIT
EXIT
NEXT
EXIT
ENTR
[0%]
EXIT
ANALOG OUTPUT
EXIT
0%
DIAG AOUT
SECONDARY SETUP MENU
COMM VARS DIAG ALRM
PREV
ANALOG OUTPUT
DIAG AOUT
PRIMARY SETUP MENU
CFG DAS RNGE PASS CLK MORE
SETUP X.X
ENTR EXIT
DIAG
ENTER SETUP PASS : 818
1
SIGNAL I / O
Performs
analog output
step test.
0% - 100%
Exit-Exit
returns to the
DIAG menu
ANALOG OUTPUT
EXIT
Pressing the key under “0%” while performing the test will
pause the test at that level. Brackets will appear around
the value: example: [20%] Pressing the same key again
will resume the test.
04584 Rev A1
68
Model GFC7000E Instruction Manual
Operating Instructions
6.9.4. Analog I/O Configuration
The analog I/O functions that are available in the MGFC7000E are:
Table 6-8:
DIAG - Analog I/O Functions
Sub Menu
Function
AOUTS CALIBRATED:
Shows the status of the analog output calibration (YES/NO) and initiates a
calibration of all analog output channels.
CONC_OUT_1
Sets the basic electronic configuration of the A1 analog output (CO2 ) . There are
three options:
Range: Selects the signal type (voltage or current loop) and full scale level of the
output.
REC_OFS: Allows to set a voltage offset (not available when RANGE is set to
CURRent loop.
Auto_CAL: Performs the same calibration as AOUT CALIBRATED, but on this one
channel only.
NOTE: Any change to RANGE or REC_OFS requires recalibration of this output.
CONC_OUT_2
Same as for CONC_OUT_1 but for analog channel 2 (CO2 )
TEST OUTPUT
Same as for CONC_OUT_1 but for analog channel 4 (TEST)
AIN CALIBRATED
Shows the calibration status (YES/NO) and initiates a calibration of the analog to
digital converter circuit on the motherboard.
To configure the analyzer’s three analog outputs, set the electronic signal type of each channel
and calibrate the outputs. This consists of:
•
Selecting an output type (voltage or current, if an optional current output driver has been
installed) and the signal level that matches the input requirements of the recording device
attached to the channel, see Sections 6.9.4.1.
•
Calibrating the output channel. This can be done automatically or manually for each
channel, see Sections 6.9.4.2 and 6.9.4.3.
•
Adding a bipolar recorder offset to the signal, if required (Section 6.9.4.2.)
In its standard configuration, the analyzer’s outputs can be set for the following DC voltages. Each
range is usable from -5% to + 5% of the nominal range.
Table 6-9:
Analog Output Voltage Ranges
RANGE
MINIMUM OUTPUT
MAXIMUM OUTPUT
0-0.1 V
-5 mV
+105 mV
0-1 V
-0.05 V
+1.05 V
0-5 V
-0.25 V
+5.25 V
0-10 V
-0.5 V
+10.5 V
The default offset for all ranges is 0 VDC.
04584 Rev A1
69
Model GFC7000E Instruction Manual
Operating Instructions
The following DC current output limits apply to the current loop modules:
Table 6-10:
Analog Output Current Loop Range
RANGE
MINIMUM OUTPUT
MAXIMUM OUTPUT
0-20 mA
0 mA
20 mA
These are the physical limits of the current loop modules, typical
applications use 2-20 or 4-20 mA for the lower and upper limits.
Please specify desired range when ordering this option.
The default offset for all ranges is 0 mA.
Pin assignments for the output connector at the rear panel of the instrument are shown in Table
6-11.
ANALOG OUT
+
A1
-
Table 6-11:
PIN
1
2
3
4
5
6
7&8
+
A2
-
A3
+
-
A4
+
-
Analog Output Pin Assignments
ANALOG
OUTPUT
A1
A2
A4
A3
VOLTAGE
SIGNAL
CURRENT
SIGNAL
V Out
I Out +
Ground
I Out -
V Out
I Out +
Ground
I Out -
V Out
I Out +
Ground
I Out -
Not Used
Not Used
See Figure 3-2 for a the location of the analog output connector on the instruments rear panel.
04584 Rev A1
70
Model GFC7000E Instruction Manual
Operating Instructions
6.9.4.1. Analog Output Signal Type and Range Span Selection
To select an output signal type (DC Voltage or current) and level for one output channel, activate
the ANALOG I/O CONFIGURATION MENU (see Section 6.9.1) then press:
FROM ANALOG I/O CONFIGURATION MENU
DIAG
PREV
ANALOG I / O CONFIGURATION
NEXT
DIAG AIO
ENTR
EXIT
AOUTS CALIBRATED: NO
< SET SET>
DIAG AIO
CAL
EXIT
Press SET> to select the
analog output channel to be
configured. Press EDIT to
continue
CONC_OUT_2:5V, CAL
< SET SET>
DIAG AIO
EDIT
EXIT
CONC_OUT_2 RANGE: 5V
SET>
EDIT
EXIT
DIAG AIO OUTPUT RANGE: 5V
These keys set
the signal level
and type of the
selected channel
0.1V
1V
5V
10V CURR
ENTR EXIT
DIAG AIO OUTPUT RANGE: 10V
0.1V
1V
5V
10V CURR
ENTR EXIT
Pressing ENTR records the new setting
and returns to the previous menu.
Pressing EXIT ignores the new setting and
returns to the previous menu.
6.9.4.2. Analog Output Calibration Mode
The analog outputs can be calibrated automatically or manually. In its default mode, the
instrument is configured for automatic calibration of all channels. Manual calibration should be
used for the 0.1V range or in cases where the outputs must be closely matched to the
characteristics of the recording device. Outputs configured for automatic calibration can be
calibrated as a group or individually. Calibration of the analog outputs needs to be carried out on
first startup of the analyzer (performed in the factory as part of the configuration process) or
whenever re-calibration is required.
04584 Rev A1
71
Model GFC7000E Instruction Manual
Operating Instructions
To calibrate the outputs as a group, activate the ANALOG I/O CONFIGURATION MENU (see
Section 6.9.1), then press:
STARTING FROM DIAGNOSTIC MENU
(see Section 6.7.1)
DIAG
Exit at any time
to return to the
main DIAG
menu
PREV
ANALOG I / O CONFIGURATION
NEXT
DIAG AIO
ENTR EXIT
AOUTS CALIBRATED: NO
< SET SET>
CAL
If AutoCal has been
turned off for any
channel, the message
for that channel will be
similar to:
EXIT
DIAG AIO AUTO CALIBRATING CONC_OUT_1
AUTO CALIBRATING CONC_OUT_2
AUTO CALIBRATING TEST_OUTPUT
NOT AUTO CAL
CONC_OUT_1
If any of the channels have
not been calibrated this
message will read NO.
DIAG AIO
AOUTS CALIBRATED:
< SET SET>
CAL
Exit to return to
the I/O
configuration
menu
YES
EXIT
To automatically calibrate a single analog channel, activate the ANALOG I/O
CONFIGURATION MENU (see Section 6.9.1), then press:
DIAG
PREV
ANALOG I / O CONFIGURATION
NEXT
ENTR EXIT
DIAG AIO
<
EXIT to Return
to the main
Sample Display
AOUTS CALIBRATED: NO
SET>
CAL
DIAG AIO
EXIT
Press SET> to select the
Analog Output channel to
be configured. Then Press
EDIT to continue
CONC_OUT_2:5V, CAL
< SET SET>
EDIT
DIAG AIO
EXIT
CONC_OUT_2 RANGE: 5V
DIAG AIO
SET>
EDIT
<SET
DIAG AIO
CAL
EXIT
CONC_OUT_2 REC OFS: 0 mV
DIAG AIO
< SET SET>
DIAG AIO
CONC_OUT_2 CALIBRATED: NO
EXIT
EDIT
EXIT
CONC_OUT_2 AUTO CAL: ON
< SET SET>
EDIT
04584 Rev A1
AUTO CALIBRATING CONC_OUT_2
DIAG AIO
EXIT
<SET
CONC_OUT_2 CALIBRATED: YES
CAL
EXIT
72
Model GFC7000E Instruction Manual
Operating Instructions
To select manual output calibration for a particular channel, activate the ANALOG I/O
CONFIGURATION MENU (see Section 6.9.1), then press:
DIAG
Exit to return to
the main
sample display
PREV
ANALOG I / O CONFIGURATION
NEXT
ENTR EXIT
DIAG AIO
< SET SET>
DIAG AIO
AOUTS CALIBRATED: NO
CAL
Press SET> to select the analog output channel to
be configured. Then press EDIT to continue
DIAG AIO
< SET SET>
SET>
EDIT
EXIT
CONC_OUT_2 AUTO CAL: ON
< SET SET>
DIAG AIO
CONC_OUT_2:5V, CAL
EDIT
EXIT
CONC_OUT_2 AUTO CAL: ON
ON
EDIT
DIAG AIO
< SET SET>
DIAG AIO
EXIT
CONC_OUT_2 REC OFS: 0 mV
ENTR EXIT
EXIT
CONC_OUT_2 RANGE: 5V
EDIT
EXIT
Toggles the
auto cal mode
ON/ OFF for
this analog
output channel
only.
ENTR accepts the new setting
and returns to the previous menu.
EXIT ignores the new setting and
returns to the previous menu.
Now the analog output channels should either be automatically calibrated or they should be set to
manual calibration, which is described next.
6.9.4.3. Manual Analog Output Calibration and Voltage Adjustment
For highest accuracy, the voltages of the analog outputs can be manually calibrated. Calibration is
done through the instrument software with a voltmeter connected across the output terminals
(Figure 6-5). Adjustments are made using the front panel keys by setting the zero-point first and
then the span-point (Table 6-12).
The software allows this adjustment to be made in 100, 10 or 1 count increments.
Table 6-12:
Voltage Tolerances for Analog Output Calibration
Full Scale
Zero Tolerance
Span Voltage
Span Tolerance
0.1 VDC
±0.0005V
90 mV
±0.001V
1 VDC
±0.001V
900 mV
±0.001V
5 VDC
±0.002V
4500 mV
±0.003V
10 VDC
±0.004V
4500 mV
±0.006V
NOTE
Outputs configured for 0.1V full scale should always be calibrated manually
04584 Rev A1
73
Model GFC7000E Instruction Manual
Operating Instructions
See Table 3-1 for
pin assignments
of Analog Out
connector on the
rear panel
V
+DC
Gnd
V OUT +
V IN +
V OUT -
V IN -
Recording
Device
ANALYZER
Figure 6-5:
Setup for Calibrating Analog Voltage Outputs
To make these adjustments, the AOUT auto-calibration feature must be turned off (Section
6.9.4.2). Activate the ANALOG I/O CONFIGURATION MENU (see Section 6.9.1), then press:
FROM ANALOG I/O CONFIGURATION MENU
DIAG AIO
DIAG
CONC_OUT_1 RANGE: 5V
ANALOG I / O CONFIGURATION
SET>
PREV
NEXT
EDIT
DIAG AIO
DIAG AIO
EXIT
ENTR EXIT
CONC_OUT_1 REC OFS: 0 mV
AOUTS CALIBRATED: NO
< SET SET>
< SET SET>
CAL
DISPLAYED AS =
CONC_OUT_1 =
CONC_OUT_2 =
TEST OUTPUT =
CHANNEL
A1
A2
A4
CONC_OUT_1 AUTO CAL: OFF
< SET SET>
DIAG AIO
< SET
< SET SET>
EXIT
If AutoCal is ON, go to
Section 6.7.3
DIAG AIO
Press SET> to select the analog output channel to be
configured:
DIAG AIO
EDIT
EXIT
EDIT
EXIT
CONC_OUT_2 CALIBRATED: NO
CAL
EXIT
CONC_OUT_1 :5V, NO CAL
EDIT
EXIT
DIAG AIO
CONC_OUT_1 VOLT–Z : 0 mV
U100 UP10 UP DOWN DN10 D100 ENTR EXIT
These keys increase / decrease the analog
output by 100, 10 or 1 counts.
Continue adjustments until the voltage measured
at the output of the analyzer and/or the input of
the recording device matches the value in the
upper right hand corner of the display to the
tolerance listed in Table 6-10.
DIAG AIO
CONC_OUT_1 VOLT–S : 4500 mV
U100 UP10 UP DOWN DN10 D100 ENTR EXIT
EXIT ignores the
new setting.
ENTR accepts the
new setting.
The concentration display will not change. Only
the voltage reading of your voltmeter will change.
DIAG AIO
< SET
04584 Rev A1
CONC_OUT_1 CALIBRATED: YES
CAL
EXIT
74
Model GFC7000E Instruction Manual
Operating Instructions
6.9.4.4. Current Loop Output Adjustment
A current loop option is available and can be installed as a retrofit for each of the analog outputs
of the analyzer (Sections 5.2). This option converts the DC voltage analog output to a current
signal with 0-20 mA output current. The outputs can be scaled to any set of limits within that 0-20
mA range. However, most current loop applications call for either 2-20 mA or 4-20 mA range. All
current loop outputs have a +5% over-range. Ranges with the lower limit set to more than 1 mA
(e.g., 2-20 or 4-20 mA) also have a -5% under-range.
To switch an analog output from voltage to current loop after installing the current output printed
circuit assembly, follow the instructions in Section 6.9.4.4 and select CURR from the list of
options on the RANGE menu.
Adjusting the signal zero and span values of the current loop output is done by raising or lowering
the voltage of the respective analog output. This proportionally raises or lowers the current
produced by the current loop option.
Similar to the voltage calibration, the software allows this current adjustment to be made in 100,
10 or 1 count increments. Since the exact current increment per voltage count varies from output
to output and from instrument to instrument, you will need to measure the change in the current
with a current meter placed in series with the output circuit (Figure 6-6).
See Table 3-2 for
pin assignments of
the Analog Out
connector on the
rear panel.
mA
IN
OUT
V OUT +
I IN +
V OUT -
I IN -
Recording
Device
Analyzer
Figure 6-6:
Setup for Calibrating Current Outputs
NOTE
Do not exceed 60 V between current loop outputs and instrument ground.
To adjust the zero and span values of the current outputs, activate the ANALOG I/O
CONFIGURATION MENU (see Section 6.9.1), then press:
04584 Rev A1
75
Model GFC7000E Instruction Manual
Operating Instructions
FROM ANALOG I/O CONFIGURATION MENU
DIAG
The instrument attempt to automatically calibrate
the channel … then beep.
ANALOG I / O CONFIGURATION
PREV
NEXT
DIAG AIO
SET>
ENTR EXIT
DIAG AIO CONC_OUT_2 D/A/ CAL ERROR
EXIT
AIN CALIBRATED: NO
EDIT
EXIT
DIAG AIO
CONC_OUT_2 CURR-Z: 0 mV
U100 UP10 UP DOWN DN10 D100 ENTR EXIT
Press SET> to select the analog output channel
to be configured:.
DIAG AIO
DIAG AIO
U100 UP10 UP DOWN DN10 D100 ENTR EXIT
CONC_OUT_2:CURR, NO CAL
< SET SET>
EDIT
EXIT
DIAG AIO
DIAG AIO
<SET
CONC_OUT_2 RANGE: CURR
SET>
EDIT
< SET
EXIT
CONC_OUT_2 CALIBRATED: NO
CAL
CONC_OUT_2 ZERO: 9731 mV
U100 UP10 UP DOWN DN10 D100 ENTR EXIT
EXIT ignores the
new setting, ENTR
accepts the new
setting.
EXIT
DIAG AIO
DIAG AIO
CONC_OUT_2 SPAN: 10000 mV
Increase or decrease the current
output by 100, 10 or 1 counts.
The resulting change in output
voltage is displayed in the upper
line.
Continue adjustments until the
correct current is measured with
the current meter.
U100 UP10 UP DOWN DN10 D100 ENTR EXIT
DIAG AIO
DIAG AIO
CONC_OUT_2 ZERO: 27 mV
AUTO CALIBRATING CONC_OUT_2
< SET
CONC_OUT_2 CALIBRATED: YES
CAL
EXIT
If a current meter is not available, an alternative method for calibrating the current loop outputs
is to connect a 250 Ω ± 1% resistor across the current loop output. Using a voltmeter connected
across the resistor, follow the procedure above but adjust the output to the following values:
Table 6-13:
Current Loop Output Calibration with Resistor
Full scale
Voltage for 2-20 mA
(measured across resistor)
Voltage for 4-20 mA
(measured across resistor)
0%
0.5 V
1.0 V
100%
5.0 V
5.0 V
04584 Rev A1
76
Model GFC7000E Instruction Manual
Operating Instructions
6.9.4.5. AIN Calibration
This is the sub-menu to conduct the analog input calibration. This calibration should only be
necessary after major repair such as a replacement of CPU, motherboard or power supplies.
Activate the ANALOG I/O CONFIGURATION MENU (see Section 6.9.1), then press:
STARTING FROM ANALOG I / O CONFIGURATION MENU
DIAG
PREV
Exit at any time to
return to the main
DIAG menu
ANALOG I / O CONFIGURATION
ENTR EXIT
NEXT
Continue pressing SET? until …
DIAG AIO
< SET SET>
DIAG AIO
Instrument
calibrates
automatically
AIN CALIBRATED: NO
CAL
EXIT
CALIBRATING A/D ZERO
CALIBRATING A/D SPAN
DIAG AIO
< SET SET>
Exit to return to the
ANALOG I/O
CONFIGURATION
MENU
AIN CALIBRATED: YES
CAL
EXIT
6.9.5. Electric Test
The electric test function substitutes simulated signals for CO2 MEAS and CO2 REF, generated by
circuitry on the sync/demod board, for the output of the IR photo-detector. While in this mode the
user can also view the same test functions viewable from the main SAMPLE display. When the
test is running, the concentration reported on the front panel display should be 40.0 ppm.
SAMPLE
RANGE = 500.000 PPM
CO2 =X.XXX
DIAG
< TST TST > CAL
SAMPLE
SETUP
SIGNAL I / O
ENTR
NEXT
EXIT
ENTER SETUP PASS : 818
Repeat Pressing NEXT unti . . .
8
1
ENTR EXIT
8
DIAG
SETUP X.X
PREV
CFG DAS RNGE PASS CLK MORE
SETUP X.X
ELECTRIC TEST
PRIMARY SETUP MENU
DIAG ELEC
SECONDARY SETUP MENU
COMM VARS DIAG ALRM
NEXT
ENTR
EXIT
EXIT
EXIT
RANGE=50.000 PPM
<TST TST>
CO2= 40.0
EXIT
Exit returns
to the
DIAG Menu
Press <TST TST> to view Test Functions
NOTE: CO MEAS and CO REF will be artificially altered to
enforce a CO2 reading of 40.0 ppm.
All other Test Functions will report the correct operational
value
04584 Rev A1
77
Model GFC7000E Instruction Manual
Operating Instructions
6.9.6. Dark Calibration Test
The dark calibration test interrupts the signal path between the IR photo-detector and the
remainder of the sync/demod board circuitry. This allows the instrument to compensate for any
voltage levels inherent in the sync/demod circuitry that might effect the calculation of CO2
concentration. Performing this calibration returns two offset voltages, One for CO2 MEAS and on
for CO2 REF that are automatically added to the CPU’s calculation routine. The two offset voltages
from the last calibration procedure may be reviewed by the user via the front panel display.
To activate the dark calibration procedure or review the results of a previous calibration, press:
SAMPLE
RANGE = 500.000 PPM
CO2 =X.XXX
< TST TST > CAL
ENTER SETUP PASS : 818
SAMPLE
8
SETUP
1
8
ENTR EXIT
DIAG
SIGNAL I / O
NEXT
SETUP X.X
CFG DAS RNGE PASS CLK MORE
SETUP X.X
ENTR
EXIT
PRIMARY SETUP MENU
EXIT
Repeat Pressing NEXT until . . .
SECONDARY SETUP MENU
DIAG
COMM VARS DIAG ALRM
DARK CALIBRATION
EXIT
PREV
NEXT
DIAG DARK
ENTR
EXIT
CO DARK CALIBRATION
VIEW CAL
Exit returns
to the
previous menu
EXIT
Calibration runs automatically
Electric offset for Reference signal
DIAG DARK
REF DARK OFFSET: 0.0 mV
DIAG DARK
DARK CAL 1% COMPLETE
EXIT
EXIT
Display
tracks %
complete
Electric offset for Measurement signal
DIAG DARK
MEAS DARK OFFSET: 0.0 mV
DIAG DARK
EXIT
DARK CALIBRATION ABORTED
EXIT
6.9.7. Pressure Calibration
A sensor at the exit of the sample chamber continuously measures the pressure of the sample
gas. This data is used to compensate the final CO2 concentration calculation for changes in
atmospheric pressure and is stored in the CPU’s memory as the test function PRES (also viewable
via the front panel).
NOTE
04584 Rev A1
78
Model GFC7000E Instruction Manual
Operating Instructions
This calibration must be performed when the pressure of the sample gas is equal to
ambient atmospheric pressure.
Before performing the following pressure calibration procedure, disconnect the sample
gas pump and the sample gas-line vent from the sample gas inlet on the instrument’s
rear panel.
04584 Rev A1
79
Model GFC7000E Instruction Manual
Operating Instructions
To cause the analyzer to measure and record a value for PRES, press.
SAMPLE
RANGE = 500.000 PPM
CO2 =X.XXX
SIGNAL I / O
DIAG
< TST TST > CAL
SETUP
NEXT
SAMPLE
ENTR
EXIT
ENTR
EXIT
ENTER SETUP PASS : 818
SIGNAL I / O
DIAG
8
1
8
SETUP X.X
ENTR EXIT
PRIMARY SETUP MENU
CFG DAS RNGE PASS CLK MORE
EXIT
NEXT
Exit at
any time
to return
to main
the
SETUP
menu
Repeat Pressing NEXT until . . .
ACTUAL PRESS : 27.20 IN-HG-A
DIAG FCAL
SETUP X.X
SECONDARY SETUP MENU
2
COMM VARS DIAG ALRM
7
.2
0
ENTR EXIT
EXIT
Adjust these values until
the displayed flow rate
equals the flow rate being
measured by the
independent flow meter.
ENTR accepts the
new value and
returns to the
previous menu
EXIT ignores the
new value and
returns to the
previous menu
6.9.8. Flow Calibration
The flow calibration allows the user to adjust the values of the sample flow rates as they are
displayed on the front panel and reported through COM ports to match the actual flow rate
measured at the sample inlet. This does not change the hardware measurement of the flow
sensors, only the software calculated values.
To carry out this adjustment, connect an external, sufficiently accurate flow meter to the sample
inlet (see Chapter 11 for more details). Once the flow meter is attached and is measuring actual
gas flow, press:
SAMPLE
RANGE = 500.000 PPM
CO2 =X.XXX
< TST TST > CAL
SAMPLE
SETUP
SIGNAL I / O
DIAG
ENTER SETUP PASS : 818
NEXT
8
SETUP X.X
1
8
PRIMARY SETUP MENU
CFG DAS RNGE PASS CLK MORE
EXIT
Exit at
any time
to return
to main
the
SETUP
menu
EXIT
Repeat Pressing NEXT until . . .
FLOW CALIBRATION
DIAG
SETUP X.X
ENTR
ENTR EXIT
SECONDARY SETUP MENU
ENTR EXIT
PREV NEXT
COMM VARS DIAG ALRM
EXIT
ACTUAL FLOW: 607 CC / M
DIAG FCAL
Adjust these values until
the displayed flow rate
equals the flow rate being
measured by the
independent flow meter.
04584 Rev A1
0
6
0
7
ENTR EXIT
ENTR accepts the
new value and
returns to the
previous menu
EXIT ignores the
new value and
returns to the
previous menu
80
Model GFC7000E Instruction Manual
Operating Instructions
6.9.9. Test Channel Output
When activated, output channel A3 can be used to report one of the test functions viewable from
the SAMPLE mode display. To activate the A3 channel and select a test function, follow this key
sequence:
SAMPLE*
RANGE = 500.000 PPM
CO2 =X.XXX
Continue to press NEXT until …
SETUP
< TST TST > CAL
SAMPLE
8
DIAG
ENTER SETUP PASS : 818
1
SETUP X.X
8
ENTR EXIT
EXIT returns
to the main
SAMPLE
display
PREV
TEST CHAN OUTPUT
NEXT
ENTR
PRIMARY SETUP MENU
DIAG TCHN
CFG DAS RNGE PASS CLK MORE
TEST CHANNEL: NONE
EXIT
NEXT
SETUP X.X
EXIT
ENTR
EXIT
SECONDARY SETUP MENU
COMM VARS DIAG
DIAG
ALRM
DIAG TCHN TEST CHANNEL: CO2 MEASURE
EXIT
PREV
SIGNAL I / O
NEXT
NEXT
ENTR
EXIT
ENTR EXIT
DIAG
ANALOG OUTPUT
PREV NEXT
ENTR EXIT
Table 6-14:
Press PREV or NEXT
to move through the
list of available
parameters
(Table 6-13)
Press ENTR to select
the displayed
parameter activating
the test channel.
Press EXIT to
return to the
DIAG menu
Test Parameters Available for Analog Output A3
Test Channel
NONE
Zero
Full Scale
Test Channel is turned off
CO2 MEASURE
0 mV
5000 mV*
CO2 REFERENCE
0 mV
5000 mV*
SAMPLE PRESS
0 "Hg
40 "Hg
SAMPLE FLOW
0 cc/m
1000 cc/m
SAMPLE TEMP
0°C
70°C
BENCH TEMP
0°C
70°C
WHEEL TEMP
0°C
70°C
CHASSIS TEMP
0°C
70°C
PHT DRIVE
0 mV
5000 mV
* This refers to the internal voltage level of the function NOT the output
signal level of the Test channel itself.
04584 Rev A1
81
Model GFC7000E Instruction Manual
Operating Instructions
6.10. SETUP – COMM: Using the Analyser’s
Communication Ports
The MGFC7000E is equipped with two serial communication ports located on the rear panel
(Figure 3-2). Both ports operate similarly and give the user the ability to communicate with, issue
commands to, and receive data from the analyzer through an external computer system or
terminal. By default, both ports operate on the RS-232 protocol. The COM2 port, however, can be
configured for half-duplex RS-485 communication or can be used for the Teledyne Instruments
Ethernet interface card (optional equipment, Section 5.5.3).
Multidrop Communications
There are two options to connect multiple analyzers to a single computer terminal or data logging
device over a single serial communications line. Either port can be equipped with an optional RS232 multidrop assembly (Section 5.5.2), or up to eight analyzers can be connected using COM2
configured for RS-485 operation (contact the factory for further information). A third option is to
use a code-activated switch (CAS), which can connect typically between 2 and 16 analyzers to one
communications hub. Contact Teledyne Instruments sales for more information on CAS systems.
Ethernet Communications
When equipped with the optional Ethernet interface, the analyzer can be connected to any
standard 10BaseT Ethernet network via low-cost network hubs, switches or routers. The interface
operates as a standard TCP/IP device on port 3000. This allows a remote computer to connect
through the internet to the analyzer using APIcom, terminal emulators or other programs.
6.10.1. Analyzer ID Code
The first entry in the COMM menu is for configuration of the analyzer ID code, a numerical value
of up to 4 digits. Each type of Teledyne Instruments analyzer is configured with a default ID code.
The MGFC7000E default ID code is 360. When more than one Teledyne Instruments analyzer of
the same model type is connected to the same communications channel , such as two Model
GFC7000E’s operating on the same Hessen Protocol network, each analyzer needs to be
addressed with a unique ID number.
To edit the instrument’s ID code, press:
04584 Rev A1
82
Model GFC7000E Instruction Manual
Operating Instructions
SAMPLE*
RANGE = 500.000 PPM
CO2 =X.XXX
< TST TST > CAL
ENTER SETUP PASS : 818
SAMPLE
8
SETUP
1
8
SETUP X.X
ENTR EXIT
PRIMARY SETUP MENU
CFG DAS RNGE PASS CLK MORE
SETUP X.X
EXIT
SECONDARY SETUP MENU
COMM VARS DIAG ALRM
Toggle these keys to
cycle through the
available character set:
0-9
EXIT
SETUP X.X
COMMUNICATIONS MENU
ID
COM2
COM1
SETUP X.
0
3
EXIT
ENTR key accepts the
new settings
MACHINE ID: 360 ID
6
0
ENTR EXIT
EXIT key ignores the
new settings
The ID number is only important if more than one analyzer is connected to the same
communications channel (e.g., a multi-drop setup). Different models of Teledyne Instruments
analyzers have different default ID numbers, but if two analyzers of the same model type are
used on one channel (for example, two MGFC7000E’s), the ID of one instrument needs to be
changed.
The ID can also be used for to identify any one of several analyzers attached to the same network
but situated in different physical locations.
6.10.2. COMM Port Default Settings
Received from the factory, the analyzer is set up to emulate a DCE or modem, with pin 3 of the
DB-9 connector designated for receiving data and pin 2 designated for sending data.
•
•
COM1: RS-232 (fixed), DB-9 male connector.
o
Baud rate: 19200 bits per second (baud).
o
Data Bits: 8 data bits with 1 stop bit.
o
Parity: None.
COM2: RS-232 (configurable), DB-9 female connector.
o
Baud rate: 115000 bits per second (baud).
o
Data Bits: 8 data bits with 1 stop bit.
o
Parity: None.
NOTE
Cables that appear to be compatible because of matching connectors may incorporate
internal wiring that make the link inoperable. Check cables acquired from sources other
than Teledyne Instruments for pin assignments before using.
04584 Rev A1
83
Model GFC7000E Instruction Manual
Operating Instructions
6.10.3. COMM Port Cable Connections
There are two DB-9 connectors on the MGFC7000E rear panel. COM1 is a male connector, COM2
a female connector (Table 6-15 lists pin assignments). Teledyne Instruments offers two mating
cables, one of which should be applicable for your use.
Part number WR000077, a DB-9 female to DB-9 female cable, 6 feet long, allows connection of
COM1 with the serial port of most personal computers. Also available as Option 60 (Section
5.5.1).
Part number WR0000024, a DB-9 female to DB-25 male cable. Allows connection to the most
common styles of modems (e.g. Hayes-compatible) and code activated switches.
Both cables are configured with straight-through wiring and should require no additional adapters.
To assist in properly connecting the serial ports to either a computer or a modem, there are
activity indicators just above each COM port. When power is applied to the analyzer, the red LED
should be illuminated. If this LED is dark, it indicates a communications error between serial port
and CPU.
Once a cable is connected between the analyzer and a computer or modem, both the red and
green LEDs should be on. If not, COM1 can be switched between DTE and DCE modes using a
small switch on the rear panel to exchange the receive and transmit lines (emulating a cross-over
or null-modem cable). If both LEDs are still not illuminated, check the cable for proper wiring. For
COM2 it may be necessary to install a null-modem cable (contact customer service for
information).
6.10.4. RS-485 Configuration of COM2
As delivered from the factory, COM2 is configured for RS-232 communications. This port can be
re-configured for operation as a non-isolated, half-duplex RS-485 port with a 150 Ω termination
resistor (Table 6-15 shows the pin assignments of the DB-9 connector).
For RS-485 operation, jumper JP3 on the CPU board should be installed and switch 6 of SW1
should be set to the ON position. For RS-232, remove the jumper and set the switch to OFF
(default). JP3 is just to the right of the third connector from the left on the top of the CPU board
(as seen from the inside of the analyzer). SW1 is in the middle of the CPU board between disk-onchip and BIOS. For non-terminated RS-485 operation, remove the jumper on JP3 but leave switch
6 in the ON position. Refer to Figure 3-11 to locate the CPU board.
04584 Rev A1
84
Model GFC7000E Instruction Manual
Table 6-15:
Operating Instructions
COM1 and COM2 DB-9 Pin Assignments
Pin #
COM1 (RS-232)
COM2 (RS-232)
COM2 (RS-485)
1
Not used
Not used
Not used
2
Transmit Data*
Receive Data
DATA -
3
Receive Data*
Transmit Data
Data +
4
Not used
Not used
Not used
5
Signal Ground
Signal Ground
Signal Ground
6
Not used
Not used
Not used
7
DATA SET READY*
DATA SET READY
Not used
8
REQUEST TO SEND*
(=DTE Ready)
REQUEST TO SEND
Not used
Not used
Not used
Not used
9
* Configurable for COM1 at rear panel using the DTE-DCE switch
6.10.5. DTE and DCE Communication
RS-232 was developed for allowing communications between data terminal equipment (DTE) and
data communication equipment (DCE). Basic terminals always fall into the DTE category whereas
modems are always considered DCE devices. The difference between the two is the pin
assignment of the Data Receive and Data Transmit functions. DTE devices receive data on pin 2
and transmit data on pin 3, DCE devices receive data on pin 3 and transmit data on pin 2.
To allow the analyzer to be used with terminals (DTE), modems (DCE) and computers (which can
be either), a switch mounted below the serial ports on the rear panel allows the user to switch
between the two functions.
6.10.6. COMM Port Communication Modes
Each of the analyzer’s serial ports can be configured to operate in a number of different modes,
listed in Table 6-16, which can be combined by adding the mode ID numbers. For example, quiet
mode, computer mode and internet-enabled mode would carry a combined mode ID of 11, the
standard configuration on the MGFC7000E COM2 port. Note that each COM port needs to be
configured independently.
04584 Rev A1
85
Model GFC7000E Instruction Manual
Table 6-16:
MODE1
Operating Instructions
COMM Port Communication modes
ID
DESCRIPTION
1
Quiet mode suppresses any feedback from the analyzer (iDAS reports, and
warning messages) to the remote device and is typically used when the port
is communicating with a computer program such as APICOM. Such feedback
is still available but a command must be issued to receive them.
COMPUTER
2
Computer mode inhibits echoing of typed characters and is used when the
port is communicating with a computer program, such as APICOM.
SECURITY
4
When enabled, the serial port requires a password before it will respond.
The only command that is active is the help screen (? CR).
QUIET
HESSEN
PROTOCOL
16
E, 7, 1
The Hessen communications protocol is used in some European countries.
Teledyne Instruments part number 02252 contains more information on this
protocol.
2048
When turned on this mode switches the COMM port settings
from
No parity; 8 data bits; 1 stop bit
to
Even parity; 7 data bits; 1 stop bit
RS-485
1024
Configures the COM2 Port for RS-485 communication. RS-485 mode has
precedence over multidrop mode if both are enabled.
MULTIDROP
PROTOCOL
32
Multidrop protocol allows a multi-instrument configuration on a single
communications channel. Multidrop requires the use of instrument IDs.
ENABLE
MODEM
64
Enables to send a modem initialization string at power-up. Asserts certain
lines in the RS-232 port to enable the modem to communicate.
ERROR
CHECKING2
128
Fixes certain types of parity errors at certain Hessen protocol installations.
XON/XOFF
HANDSHAKE2
256
Disables XON/XOFF data flow control also known as software handshaking.
HARDWARE
HANDSHAKE
8
HARDWARE
FIFO2
512
COMMAND
PROMPT
4096
1
2
Enables CTS/RTS style hardwired transmission handshaking. This style of
data transmission handshaking is commonly used with modems or terminal
emulation protocols as well as by Teledyne Instrument’s APICOM software.
Improves data transfer rate when on of the COMM ports.
Enables a command prompt when in terminal mode.
Modes are listed in the order in which they appear in the
SETUP Æ MORE Æ COMM Æ COM[1 OR 2] Æ MODE menu
The default sting for this feature is ON. Do not disable unless instructed to by Teledyne Instruments
Customer Service personnel.
04584 Rev A1
86
Model GFC7000E Instruction Manual
Operating Instructions
Press the following keys to select a communication mode for a one of the COMM Ports, such as the
following example where HESSEN PROTOCOL mode is enabled:
SAMPLE*
RANGE = 500.000 PPM
CO2 =X.XXX
< TST TST > CAL
ENTER SETUP PASS : 818
SAMPLE
8
SETUP
1
8
ENTR EXIT
PRIMARY SETUP MENU
SETUP X.X
CFG DAS RNGE PASS CLK MORE
SECONDARY SETUP MENU
SETUP X.X
COMM VARS DIAG
Select which COM
port to configure
SETUP X.X
ID
The sum of the mode
IDs of the selected
modes is displayed
here
ALRM
EXIT
EXIT returns
to the
previous
menu
COMMUNICATIONS MENU
COM1
COM2
EXIT
COM1 MODE:0
SETUP X.X
SET>
EXIT
EDIT
EXIT
COM1 QUIET MODE: OFF
SETUP X.X
NEXT OFF
ENTR EXIT
Continue pressing next until …
SETUP X.X
Use PREV and NEXT
keys to move between
available modes.
A mode is enabled by
toggling the ON/OFF
key.
PREV NEXT
SETUP X.X
COM1 HESSEN PROTOCOL : OFF
OFF
ENTR EXIT
COM1 HESSEN PROTOCOL : ON
PREV NEXT ON
ENTR EXIT
ENTR key accepts the
new settings
EXIT key ignores the
new settings
Continue pressing the NEXT and PREV keys to select any other
modes you which to enable or disable
04584 Rev A1
87
Model GFC7000E Instruction Manual
Operating Instructions
6.10.7. COM Port Baud Rate
To select the baud rate of one of the COM Ports, press:
SAMPLE*
RANGE = 500.000 PPM
CO2 =X.XXX
< TST TST > CAL
ENTER SETUP PASS : 818
SAMPLE
8
SETUP
1
8
ENTR EXIT
PRIMARY SETUP MENU
SETUP X.X
CFG DAS RNGE PASS CLK MORE
EXIT
SECONDARY SETUP MENU
SETUP X.X
COMM VARS DIAG ALRM
SETUP X.X
Select which COM
port to configure.
ID
COMMUNICATIONS MENU
COM1
COM2
SET>
EXIT
COM1 MODE:0
SETUP X.X
Press SET> until you
reach COM1 BAUD
RATE
EXIT
EXIT returns
to the
previous
menu
EDIT
EXIT
EXAMPLE
Use PREV and NEXT
keys to move
between available
baud rates.
300
1200
4800
9600
19200
38400
57600
115200
SETUP X.X
<SET SET>
COM1 BAUD RATE:19200
EDIT
SETUP X.X
PREV NEXT
SETUP X.X
NEXT ON
04584 Rev A1
EXIT
EXIT key
ignores
the new
setting
COM1 BAUD RATE:19200
ENTR
EXIT
ENTR key
accepts
the new
setting
COM1 BAUD RATE:9600
ENTR
EXIT
88
Model GFC7000E Instruction Manual
Operating Instructions
6.10.8. COM Port Testing
The serial ports can be tested for correct connection and output in the COMM menu. This test
sends a string of 256 ‘w’ characters to the selected COM port. While the test is running, the red
LED on the rear panel of the analyzer should flicker.
To initiate the test press the following key sequence.
SAMPLE
RANGE = 500.000 PPM
CO2 =X.XXX
< TST TST > CAL
SAMPLE
8
SETUP
ENTER SETUP PASS : 818
1
SETUP X.X
PRIMARY SETUP MENU
CFG DAS RNGE PASS CLK MORE
SETUP X.X
ID
COM1
COMMUNICATIONS MENU
COM2
SETUP X.X
ENTR EXIT
8
SETUP X.X
SET>
SETUP X.X
EXIT
<SET SET>
EXIT
Select which
COM port to
test.
COM1 MODE:0
EDIT
EXIT
COM1 BAUD RATE:19200
EDIT
EXIT
SECONDARY SETUP MENU
SETUP X.X
COMM VARS DIAG ALRM
COM1 : TEST PORT
EXIT
<SET
Test runs
automatically
SETUP X.X
<SET
TEST
EXIT
TRANSMITTING TO COM1
TEST
EXIT returns to
COMM menu
EXIT
6.10.9. Ethernet Card Configuration
The optional Ethernet card (Option 63) allows the analyzer to communicate via standard 10BaseT
Ethernet protocol through the COM2 serial port. Refer to Figure and 5-4 for the physical location
of this option.
The card has four LEDs that are visible on the rear panel of the analyzer, indicating its current
operating status.
Table 6-17: Ethernet Status Indicators
LED
04584 Rev A1
FUNCTION
LNK (green)
ON when connection to the LAN is valid.
ACT (yellow)
Flickers on any activity on the LAN.
TxD (green)
Flickers when the RS-232 port is transmitting
data.
RxD (yellow)
Flickers when the RS-232 port is receiving data.
89
Model GFC7000E Instruction Manual
Operating Instructions
6.10.9.1. Ethernet Card COM2 Communication Modes and Baud Rate
The firmware on board the Ethernet card automatically sets the communication modes and baud
rate (115 200 kBaud ) for the COM2 port. Once the Ethernet option is installed and activated,
the COM2 submenu is replaced by a new submenu, INET. This submenu is used to manage and
configure the Ethernet interface with your LAN or Internet Server(s).
6.10.9.2. Configuring the Ethernet Interface Option using DHCP
The Ethernet option for you MGFC7000E uses Dynamic Host Configuration Protocol (DHCP) to
automatically configure its interface with your LAN. This requires your network servers also be
running DHCP. The analyzer will do this the first time you turn the instrument on after it has been
physically connected to your network. Once the instrument is connected and turned on it will
appear as an active device on your network without any extra set up steps or lengthy procedures.
Should you need to, the following Ethernet configuration properties are viewable via the analyzer’s
front panel.
Table 6-18:
PROPERTY
LAN/Internet Configuration Properties
DEFAULT STATE
DESCRIPTION
This displays whether the DHCP is turned ON or
OFF.
DHCP
STATUS
On
Editable
INSTRUMENT
IP ADDRESS
Configured
by DHCP
EDIT key
disabled
when DHCP
is ON
This string of four packets of 1 to 3 numbers each
(e.g. 192.168.76.55.) is the address of the
analyzer itself.
GATEWAY IP
ADDRESS
Configured
by DHCP
EDIT key
disabled
when DHCP
is ON
A string of numbers very similar to the Instrument
IP address (e.g. 192.168.76.1.)that is the address
of the computer used by your LAN to access the
Internet.
EDIT key
disabled
when DHCP
is ON
Also a string of four packets of 1 to 3 numbers
each (e.g. 255.255.252.0) that defines that
identifies the LAN the device is connected to.
All addressable devices and computers on a LAN
must have the same subnet mask. Any
transmissions sent devices with different assumed
to be outside of the LAN and are routed through
gateway computer onto the Internet.
Editable
This number defines the terminal control port by
which the instrument is addressed by terminal
emulation software, such as Internet or Teledyne
Instruments’ APICOM.
Editable
The name by which your analyzer will appear
when addressed from other computers on the LAN
or via the Internet. While the default setting for
all Teledyne Instruments MGFC7000E analyzers is
“mGFC7000E” the host name may be changed to
fit customer needs.
SUBNET
MASK
TCP PORT
HOST NAME
1
Configured
by DHCP
3000
MGFC7000E
Do not change the setting for this property unless instructed to by Teledyne Instruments
04584 Rev A1
90
Model GFC7000E Instruction Manual
Operating Instructions
Customer Service personnel.
NOTE
It is a good idea to check these settings the first time you power up your analyzer after
it has been physically connected to the LAN/Internet to make sure that the DHCP has
successfully downloaded the appropriate information from you network server(s).
If the gateway IP, instrument IP and the subnet mask are all zeroes (e.g. “0.0.0.0”),
the DCHP was not successful.
You may have to manually configure the analyzer’s Ethernet properties.
See your network administrator.
To view the above properties, press:
SAMPLE*
RANGE = 500.000 PPM
CO2 =X.XXX
< TST TST > CAL
SAMPLE
8
SETUP
ENTER SETUP PASS : 818
1
SETUP X.X
8
ENTR
ID
INET
EXIT
PRIMARY SETUP MENU
EXIT
<SET
EXIT
<SET
From this point on,
EXIT returns to
COMMUNICATIONS
MENU
<SET
<SET
EXIT
GATEWAY IP: 0.0.0.0
SET>
EDIT Key
Disabled
EXIT
SUBNET MASK: 0.0.0.0
SET>
EXIT
TCP PORT: 3000
SET>
SETUP X.X
EXIT
INST IP: 0.0.0.0
SETUP X.X
EXIT
EDIT
SET>
SETUP X.X
COMMUNICATIONS MENU
COM1
<SET
SETUP X.X
SECONDARY SETUP MENU
COMM VARS DIAG ALRM
SETUP X.X
SET>
SETUP X.X
CFG DAS RNGE PASS CLK MORE
SETUP X.X
DHCP: ON
SETUP X.X
EDIT
EXIT
HOSTNAME: M360E
EDIT
EXIT
Don not alter unless
directed to by Teledyne
Instruments Customer
Service personnel
04584 Rev A1
91
Model GFC7000E Instruction Manual
Operating Instructions
6.10.9.3. Manually Configuring the Network IP Addresses
There are several circumstances when you may need to manually configure the interface settings
of the analyzer’s Ethernet card. The INET sub-menu may also be used to edit the Ethernet card’s
configuration properties
•
Your LAN is not running a DHCP software package,
•
The DHCP software is unable to initialize the analyzer’s interface;
•
You wish to program the interface with a specific set of IP addresses that may not be the
ones automatically chosen by DHCP.
Editing the Ethernet Interface properties is a two step process.
STEP 1: Turn DHCP OFF: While DHCP is turned ON, the ability to manually set INSTRUMENT IP,
GATEWAY IP and SUBNET MASK is disabled
SAMPLE*
RANGE = 500.000 PPM
CO2 =X.XXX
< TST TST > CAL
SAMPLE
8
SETUP
SETUP X.X
8
ENTR
EXIT
PRIMARY SETUP MENU
CFG DAS RNGE PASS CLK MORE
SETUP X.X
INET
EXIT
COM1
OFF
Continue with editing of Ethernet interface
properties (see Step 2, below).
EXIT
DHCP: ON
EXIT
DHCP: ON
ENTR EXIT
ON
SETUP X.X
EXIT
COMMUNICATIONS MENU
<SET SET> EDIT
SETUP X.X
SECONDARY SETUP MENU
COMM VARS DIAG ALRM
ID
SETUP X.X
ENTER SETUP PASS : 818
1
SETUP X.X
DHCP: ON
ENTR EXIT
ENTR accept
new settings
EXIT ignores
new settings
04584 Rev A1
92
Model GFC7000E Instruction Manual
Operating Instructions
STEP 2: Configure the INSTRUMENT IP, GATEWAY IP and SUBNET MASK addresses by
pressing:
Internet Configuration Keypad Functions
From Step 1 above)
DHCP: OFF
SETUP X.X
SET> EDIT
SETUP X.X
EXIT
FUNCTION
[0]
Press this key to cycle through the range of
numerals and available characters (“0 – 9” & “ . ”)
<CH CH>
Moves the cursor one character left or right.
DEL
Deletes a character at the cursor location.
ENTR
Accepts the new setting and returns to the previous
menu.
EXIT
Ignores the new setting and returns to the previous
menu.
Some keys only appear as needed.
INST IP: 000.000.000.000
<SET SET> EDIT
KEY
EXIT
SETUP X.X
Cursor
location is
indicated by
brackets
INST IP: [0] 00.000.000
<CH CH>
DEL [0]
ENTR EXIT
SETUP X.X GATEWAY IP: 000.000.000.000
<SET
SET> EDIT
EXIT
SETUP X.X
GATEWAY IP: [0] 00.000.000
<CH CH>
DEL [?]
ENTR EXIT
SETUP X.X SUBNET MASK:255.255.255.0
<SET
SET> EDIT
EXIT
SETUP X.X SUBNET MASK:[2]55.255.255.0
SETUP X.X TCP PORT 3000
<SET
<CH CH>
EDIT
DEL [?]
ENTR EXIT
EXIT
The PORT number needs to remain at 3000.
Do not change this setting unless instructed to by
Teledyne Instruments Customer Service personnel.
Pressing EXIT from
any of the above
display menus
causes the Ethernet
option to reinitialize
its internal interface
firmware
SETUP X.X
SETUP X.X
INITIALIZING INET 0%
…
INITIALIZING INET 100%
INITIALIZATI0N SUCCEEDED
SETUP X.X
ID
04584 Rev A1
INET
SETUP X.X
INITIALIZATION FAILED
Contact your IT
Network Administrator
COMMUNICATIONS MENU
COM1
EXIT
93
Model GFC7000E Instruction Manual
Operating Instructions
6.10.9.4. Changing the Analyzer’s HOSTNAME
The HOSTNAME is the name by which the analyzer appears on your network. The default name
for all Teledyne Instruments Model GFC7000E analyzers is MGFC7000E. To change this name
(particularly if you have more than one Model GFC7000E analyzer on your network), press.
SAMPLE*
RANGE = 500.000 PPM
CO2 =X.XXX
< TST TST > CAL
SAMPLE
8
SETUP
SETUP X.X
8
SETUP X.X
ENTR
INET
EXIT
EXIT
PRIMARY SETUP MENU
EXIT
<SET
EDIT
<CH CH>
COMMUNICATIONS MENU
INS
SETUP X.X
EXIT
EXIT
HOSTNAME: [M]360E
SETUP X.X
EXIT
COM1
HOSTNAME: M360E
SETUP X.X
SECONDARY SETUP MENU
COMM VARS DIAG ALRM
SETUP X.X
EDIT
Continue pressing SET> UNTIL …
CFG DAS RNGE PASS CLK MORE
ID
SET>
ENTER SETUP PASS : 818
1
DHCP: ON
SETUP X.X
DEL
[?]
ENTR EXIT
HOSTNAME: M360E-FIELD1
<SET
EDIT
SETUP X.X
EXIT
INITIALIZING INET
0%
…
INITIALIZING INET 100%
SETUP X.X
INITIALIZATI0N SUCCEEDED
SETUP X.X
ID
Table 6-19:
INET
SETUP X.X
INITIALIZATION FAILED
COMMUNICATIONS MENU
COM1
Contact your IT
Network Administrator
EXIT
Internet Configuration Keypad Functions
KEY
FUNCTION
<CH
Moves the cursor one character to the left.
CH>
Moves the cursor one character to the right.
INS
Inserts a character before the cursor location.
DEL
Deletes a character at the cursor location.
[?]
Press this key to cycle through the range of numerals and characters available
for insertion. 0-9, A-Z, space ’ ~ ! © # $ % ^ & * ( ) - _ = +[ ] { } <
>\ | ; : , . / ?
ENTR
Accepts the new setting and returns to the previous menu.
EXIT
Ignores the new setting and returns to the previous menu.
04584 Rev A1
94
Model GFC7000E Instruction Manual
Operating Instructions
Some keys only appear as needed.
6.11. SETUP – ALRM: Using the Gas Concentration
Alarms
The Model GFC7000E includes two CO2 concentration alarms Each alarm has a user settable
limit, and is associated with an opto-isolated TTL relay accessible via the status output connector
on the instrument’s back panel (see Section 6.13.1.1). If the CO2 concentration measured by the
instrument rises above that limit, the alarm‘s status output relay is closed.
The default settings for ALM1 and ALM2 are:
Table 6-20:
CO2 Concentration Alarm Default Settings
1
ALARM
STATUS
ALM1
Disabled
100 ppm
ALM2
Disabled
300 ppm
LIMIT SET POINT
1
Set points listed are for PPM. Should the reporting range units of measure be changed (see Section
6.7.6) the analyzer will automatically scale the set points to match the new range unit setting.
Note
To prevent the concentration alarms from activating during span calibration operations
make sure to press CAL or CALS button prior to introducing span gas into the analyzer.
To enable either of the CO2 concentration alarms and set the Limit points, press:
SAMPLE*
RANGE = 500.000 PPM
CO2 =X.XXX
SETUP
< TST TST > CAL
SAMPLE
8
ENTER SETUP PASS : 818
1
8
ENTR EXIT
SETUP X.X
SETUP X.X
ALARM MENU
PRIMARY SETUP MENU
ALM1
CFG DAS RNGE PASS CLK MORE
ALM2
ALARM 1 LIMIT: OFF
SETUP X.
SETUP X.X
EXIT
EXIT
SECONDARY SETUP MENU
OFF
COMM VARS DIAG ALRM
ENTR EXIT
EXIT
SETUP X.
ALARM 1 LIMIT: ON
ON
Toggle these keys to
cycle through the
available character set:
0-9
SETUP X.
0
04584 Rev A1
ENTR EXIT
1
ALARM 1 LIMIT: 200,00 PPM
0
0
.0
0
ENTR EXIT
ENTR key accepts the
new settings
EXIT key ignores the
new settings
95
Model GFC7000E Instruction Manual
Operating Instructions
6.12. SETUP – DAS: Using the Data Acquisition System
(iDAS)
The MGFC7000E analyzer contains a flexible and powerful, internal data acquisition system (iDAS)
that enables the analyzer to store concentration and calibration data as well as a host of
diagnostic parameters. The iDAS of the MGFC7000E can store up to about one million data points,
which can, depending on individual configurations, cover days, weeks or months of valuable
measurements. The data are stored in non-volatile memory and are retained even when the
instrument is powered off. Data are stored in plain text format for easy retrieval and use in
common data analysis programs (such as spreadsheet-type programs).
The iDAS is designed to be flexible, users have full control over the type, length and reporting
time of the data. The iDAS permits users to access stored data through the instrument’s front
panel or its communication ports. Using APICOM, data can even be retrieved automatically to a
remote computer for further processing.
The principal use of the iDAS is logging data for trend analysis and predictive diagnostics, which
can assist in identifying possible problems before they affect the functionality of the analyzer. The
secondary use is for data analysis, documentation and archival in electronic format.
To support the iDAS functionality, Teledyne Instruments offers APICOM, a program that provides
a visual interface for remote or local setup, configuration and data retrieval of the iDAS (Section
6.12). The APICOM manual, which is included with the program, contains a more detailed
description of the iDAS structure and configuration, which is briefly described in this section.
The MGFC7000E is configured with a basic iDAS configuration, which is enabled by default. New
data channels are also enabled by default but each channel may be turned off for later or
occasional use. Note that iDAS operation is suspended while its configuration is edited through the
front panel. To prevent such data loss, it is recommended to use the APICOM graphical user
interface for iDAS changes.
The green SAMPLE LED on the instrument front panel, which indicates the analyzer status, also
indicates certain aspects of the iDAS status:
Table 6-21:
Front Panel LED Status Indicators for iDAS
LED STATE
iDAS Status
OFF
System is in calibration mode. Data logging can be enabled or disabled for this
mode. Calibration data are typically stored at the end of calibration periods,
concentration data are typically not sampled, diagnostic data should be collected.
BLINKING
Instrument is in hold-off mode, a short period after the system exits calibrations.
IDAS channels can be enabled or disabled for this period. Concentration data are
typically disabled whereas diagnostic should be collected.
ON
Sampling normally.
The iDAS can be disabled only by disabling or deleting its individual data channels.
6.12.1. iDAS Structure
The iDAS is designed around the feature of a “record”. A record is a single data point of one
parameter, stored in one (or more) data channels and generated by one of several triggering
event. The entire iDAS configuration is stored in a script, which can be edited from the front panel
04584 Rev A1
96
Model GFC7000E Instruction Manual
Operating Instructions
or downloaded, edited and uploaded to the instrument in form of a string of plain-text lines
through the communication ports.
iDAS data are defined by the PARAMETER type and are stored through different triggering EVENTS
in data CHANNELS, which relate triggering events to data parameters and define certain
operational functions related to the recording and reporting of the data.
6.12.1.1. iDAS Channels
The key to the flexibility of the iDAS is its ability to store a large number of combinations of
triggering events and data parameters in the form of data channels. Users may create up to 20
data channels and each channel can contain one or more parameters. For each channel one
triggering event is selected and up to 50 data parameters, which can be the same or different
between channels. Each data channel has several properties that define the structure of the
channel and allow the user to make operational decisions regarding the channel (Table 6-22).
Table 6-22:
PROPERTY
NAME
iDAS Data Channel Properties
DESCRIPTION
DEFAULT
SETTING RANGE
The name of the data channel.
“NONE”
Up to 6 letters and
digits (more with
APICOM, but only the
first six are displayed
on the front panel).
TRIGGERIN
G EVENT
The event that triggers the data channel to
measure and store its data parameters. See
APPENDIX A-5 for a list of available triggering
events.
ATIMER
See Appendix A-5 For
a complete list.
NUMBER &
PARAMETER
LIST
A User-configurable list of data types to be
recorded in any given channel. See APPENDIX
A-5 for a list of available parameters
1 – DETMES
See Appendix A-5 For
a complete list.
The starting date when a channel starts
collecting data
01-JAN-03
Any actual date in the
past or future.
SAMPLE
PERIOD
The amount of time between each data point
that is averaged into one mean reported every
REPORT PERIOD.
000:01:00
000:00:01 to
366:23:59
(Days:Hours:Minutes)
REPORT
PERIOD
The amount of time between each channel
data point.
000:01:00
STARTING
DATE
000:00:01 to
366:23:59
(Days:Hours:Minutes)
The number of reports that will be stored in
the data file. Once the specified limit has been
exceeded, the oldest data are over-written to
make space for new data.
100
RS-232
REPORT
Enables the analyzer to automatically report
channel values to the RS-232 ports.
OFF
OFF or ON
CHANNEL
ENABLED
Enables or disables the channel. Provides a
convenient means to temporarily disable a
data channel.
ON
OFF or ON
CAL HOLD
OFF
Disables sampling of data parameters while
instrument is in calibration mode.
When enabled here – there is also a length of
the DAS HOLD OFF after calibration mode,
which is set in the VARS menu
OFF
OFF or ON
(Section 6.12.2.11.)
NUMBER OF
RECORDS
04584 Rev A1
1 to 1 million, limited
by available storage
space.
97
Model GFC7000E Instruction Manual
Operating Instructions
6.12.1.2. iDAS Parameters
Data parameters are types of data that may be measured and stored by the iDAS. For each
Teledyne Instruments analyzer model, the list of available data parameters is different, fully
defined and not customizable. Appendix A-5 lists firmware specific data parameters for the
MGFC7000E. iDAS parameters include things like CO2 concentration measurements, temperatures
of the various heater placed around the analyzer, pressures and flows of the pneumatic
subsystem and other diagnostic measurements as well as calibration data such as slope and
offset.
Most data parameters have associated measurement units, such as mV, ppb, cm³/min, etc.,
although some parameters have no units. With the exception of concentration readings, none of
these units of measure can be changed. To change the units of measure for concentration
readings see Section 6.7.6.
Note
iDAS does not keep track of the unit of each concentration value and iDAS data files
may contain concentrations in multiple units if the unit was changed during data
acquisition.
Each data parameter has user-configurable functions that define how the data are recorded:
Table 6-23:
iDAS Data Parameter Functions
FUNCTION
PARAMETER
SAMPLE MODE
PRECISION
STORE NUM.
SAMPLES
EFFECT
Instrument-specific parameter name.
INST: Records instantaneous reading.
AVG: Records average reading during reporting interval.
MIN: Records minimum (instantaneous) reading during reporting interval.
MAX: Records maximum (instantaneous) reading during reporting interval.
Decimal precision of parameter value(0-4).
OFF: stores only the average (default).
ON: stores the average and the number of samples in each average for a
parameter. This property is only useful when the AVG sample mode is used. Note
that the number of samples is the same for all parameters in one channel and
needs to be specified only for one of the parameters in that channel.
Users can specify up to 50 parameters per data channel (the MGFC7000E provides about 30
parameters). However, the number of parameters and channels is ultimately limited by available
memory.
6.12.1.3. iDAS Triggering Events
Triggering events define when and how the iDAS records a measurement of any given data
channel. Triggering events are firmware-specific and a complete list of Triggers for this model
analyzer can be found in Appendix A-5. The most commonly used triggering events are:
•
ATIMER: Sampling at regular intervals specified by an automatic timer. Most
trending information is usually stored at such regular intervals, which can be
instantaneous or averaged.
04584 Rev A1
98
Model GFC7000E Instruction Manual
Operating Instructions
•
EXITZR, EXITSP, SLPCHG (exit zero, exit span, slope change): Sampling at the
end of (irregularly occurring) calibrations or when the response slope changes.
These triggering events create instantaneous data points, e.g., for the new slope
and offset (concentration response) values at the end of a calibration. Zero and
slope values are valuable to monitor response drift and to document when the
instrument was calibrated.
•
WARNINGS: Some data may be useful when stored if one of several warning
messages appears such as WTEMPW (GFC wheel temperature warning) or
PPRESW (purge pressure warning). This is helpful for trouble-shooting by
monitoring when a particular warning occurred.
6.12.2. Default iDAS Channels
A set of default Data Channels has been included in the analyzer’s software for logging CO2
concentration and certain predictive diagnostic data. These default channels include but are not
limited to:
CONC: Samples CO2 concentration at one minute intervals and stores an average every hour
with a time and date stamp. Readings during calibration and calibration hold off are not included
in the data. By default, the last 800 hourly averages are stored.
PNUMTC: Collects sample flow and sample pressure data at five minute intervals and stores an
average once a day with a time and date stamp. This data is useful for monitoring the condition of
the pump and critical flow orifice (sample flow) and the sample filter (clogging indicated by a drop
in sample pressure) over time to predict when maintenance will be required. The last 360 daily
averages (about 1 year) are stored.
CALDAT: Logs new slope and offset every time a zero or span calibration is performed. This Data
Channel also records the instrument readings just prior to performing a calibration. This
information is useful for performing predictive diagnostics as part of a regular maintenance
schedule (see Section 9.1).
STBZRO: Logs the concentration stability, the electronic output of the IR detector of the most
recent measure phase and the measure/reference ratio every time the instrument exits zero
calibration mode. Data from the last 200 zero calibrations is stored. A time and date stamp is
recorded for every data point logged. This information is useful for performing predictive
diagnostics as part of a regular maintenance schedule (see Section 9.1).
STBSPN: Logs the electronic output of the IR detector of the most recent measure phase and the
measure/reference ratio every time the instrument exits span calibration mode. Data from the
last 200 zero calibrations is stored. A time and date stamp is recorded for every data point logged.
This information is useful for performing predictive diagnostics as part of a regular maintenance
schedule (see Section 9.1).
TEMP: Samples the analyzer’s bench temperature, box temperature and PHT cooler drive voltage
every five minutes and records a average once every six hours. Data from the last 400
averaging periods is recorded. A time and date stamp is recorded for every data point logged.
This information is useful for performing predictive diagnostics as part of a regular maintenance
schedule (see Section 9.1).
Note
04584 Rev A1
99
Model GFC7000E Instruction Manual
Operating Instructions
The CALDAT, STBZRO and STBSPN channels collect data based on events (e.g. a
calibration operation) rather than a timed interval. This does not represent any specific
length of time since it is dependent on how often calibrations are performed.
04584 Rev A1
100
Model GFC7000E Instruction Manual
Operating Instructions
Triggering Events and Data Parameters/Functions for these default channels are:
LIST OF CHANNELS
LIST OF PARAMETERS
NAME: CONC
EVENT: ATIMER
REPORT PERIOD: 000:01:00
NO. OF RECORDS: 800
RS-232 REPORT: OFF
CHANNEL ENABLED: ON
PARAMETER: CONC1
MODE: AVG
PRECISION: 1
STORE NUM SAMPLES OFF
CAL HOLD OFF: ON
NAME: PNUMTC
EVENT: ATIMER
REPORT PERIOD: 001:00:00
NO. OF RECORDS: 360
RS-232 REPORT: OFF
CHANNEL ENABLED: ON
CAL HOLD OFF: OFF
PARAMETER: SMPLFLW
MODE: AVG
PRECISION: 1
STORE NUM SAMPLES OFF
PARAMETER: SMPLPRS
MODE: AVG
PRECISION: 1
STORE NUM SAMPLES OFF
PARAMETER: SLOPE1
MODE: INST
PRECISION:3
STORE NUM SAMPLES OFF
NAME: CALDAT
EVENT: SLPCHG
PARAMETER: OFSET1
MODE: INST
PRECISION: 1
STORE NUM SAMPLES OFF
REPORT PERIOD: N/A
NO. OF RECORDS:200
RS-232 REPORT: OFF
CHANNEL ENABLED: ON
CAL HOLD OFF: OFF
PARAMETER: ZSCNC1
MODE: INST
PRECISION: 1
STORE NUM SAMPLES OFF
PARAMETER: STABIL
MODE: INST
PRECISION:2
STORE NUM SAMPLES OFF
NAME: STBZRO
EVENT: EXITZR
REPORT PERIOD: N/A
NO. OF RECORDS:200
RS-232 REPORT: OFF
CHANNEL ENABLED: ON
PARAMETER: DETMES
MODE: INST
PRECISION: 1
STORE NUM SAMPLES OFF
CAL HOLD OFF: OFF
PARAMETER: RATIO
MODE: INST
PRECISION: 3
STORE NUM SAMPLES OFF
PARAMETER: DETMES
MODE: INST
PRECISION: 1
STORE NUM SAMPLES OFF
NAME: STBSPN
EVENT: EXITSP
REPORT PERIOD: N/A
NO. OF RECORDS:200
RS-232 REPORT: OFF
CHANNEL ENABLED: ON
PARAMETER: RATIO
MODE: INST
PRECISION: 3
STORE NUM SAMPLES OFF
CAL HOLD OFF: OFF
PARAMETER: BNTEMP
MODE: AVG
PRECISION:1
STORE NUM SAMPLES OFF
NAME: TEMP
EVENT: ATIMER
REPORT PERIOD: 000:06:00
NO. OF RECORDS:400
RS-232 REPORT: OFF
CHANNEL ENABLED: ON
PARAMETER: BOXTMP
MODE: AVG
PRECISION: 1
STORE NUM SAMPLES OFF
CAL HOLD OFF: OFF
PARAMETER: PHTDRV
MODE: AVG
PRECISION: 1
STORE NUM SAMPLES OFF
Figure 6-7:
04584 Rev A1
Default iDAS Channels Setup
101
Model GFC7000E Instruction Manual
Operating Instructions
These default Data Channels can be used as they are, or they can be customized from the front
panel to fit a specific application. They can also be deleted to make room for custom userprogrammed Data Channels.
Appendix A-5 lists the firmware-specific iDAS configuration in plain-text format. This text file can
either be loaded into APICOM and then modified and uploaded to the instrument or can be copied
and pasted into a terminal program to be sent to the analyzer.
NOTE
Sending an iDAS configuration to the analyzer through its COM ports will replace the
existing configuration and will delete all stored data. Back up any existing data and the
iDAS configuration before uploading new settings.
04584 Rev A1
102
Model GFC7000E Instruction Manual
Operating Instructions
6.12.2.1. Viewing iDAS Data and Settings
iDAS data and settings can be viewed on the front panel through the following keystroke
sequence.
SAMPLE*
RANGE = 500.000 PPM
CO2 =X.XXX
< TST TST > CAL
SAMPLE
8
SETUP
VIEW KEYPAD FUNCTIONS
KEY
FUNCTION
<PRM
Moves to the next Parameter
PRM>
Moves to the previous
Parameter
NX10
Moves the view forward 10
data points/channels
NEXT
Moves to the next data
point/channel
PREV
Moves to the previous data
point/channel
PV10
Moves the view back 10 data
points/channels
ENTER SETUP PASS : 818
1
SETUP X.X
8
ENTR EXIT
PRIMARY SETUP MENU
CFG DAS RNGE PASS CLK MORE
SETUP X.X
EXIT
DATA ACQUISITION
VIEW EDIT
EXIT
Keys only appear as needed
SETUP X.X
NEXT
CONC : DATA AVAILABLE
VIEW
EXIT
SETUP X.X
PV10 PREV
SETUP X.X
PREV
NEXT
00:00:00
NXCNC1=0.0 PPM
NEXT NX10 <PRM
VIEW
EXIT
00:00:00 SMPFLW=000.0 cc / m
<PRM
PREV
NEXT
NEXT
00:00:00
<PRM
NEXT
00:00:00
NEXT
PRM>
EXIT
EXIT
VIEW
00:00:00
DETMES=0.000
<PRM
PRM>
EXIT
TEMP: DATA AVAILABLE
VIEW
EXIT
SETUP X.X
PV10 PREV
04584 Rev A1
STABIL=0.000
<PRM
PV10 PREV
PREV
EXIT
STBSPN: DATA AVAILABLE
SETUP X.X
SETUP X.X
PRM>
EXIT
VIEW
PV10 PREV
PREV
NXSLP1=0.000
STBZRO: DATA AVAILABLE
SETUP X.X
SETUP X.X
EXIT
EXIT
VIEW
PV10 PREV
PREV
PRM>
CALDAT: DATA AVAILABLE
SETUP X.X
SETUP X.X
EXIT
PNUMTC: DATA AVAILABLE
SETUP X.X
SETUP X.X
PRM>
00:00:00
BOXTMP=0.000
<PRM
PRM>
EXIT
103
Model GFC7000E Instruction Manual
Operating Instructions
6.12.2.2. Editing iDAS Data Channels
IDAS configuration is most conveniently done through the APICOM remote control program. The
following list of key strokes shows how to edit using the front panel.
SAMPLE*
RANGE = 500.000 PPM
CO2 =X.XXX
< TST TST > CAL
SAMPLE
EXIT will return to the
previous SAMPLE
display.
8
SETUP
ENTER SETUP PASS : 818
1
SETUP X.X
ENTR EXIT
8
PRIMARY SETUP MENU
CFG DAS RNGE PASS CLK MORE
EXIT
Main Data Acquisition Menu
SETUP X.X
DATA ACQUISITION
VIEW EDIT
EXIT
Edit Data Channel Menu
Moves the
display up &
down the list of
Data Channels
Inserts a new Data
Channel into the list
BEFORE the Channel
currently being displayed
Moves the display
between the
PROPERTIES for this
data channel.
SETUP X.X
0) CONC:
PREV NEXT
INS
ATIMER,
DEL EDIT
1,
900
PRNT
EXIT
Exits to the Main
Data Acquisition
Menu
Exports the
configuration of all
data channels to
RS-232 interface.
Deletes The Data
Channel currently
being displayed
SETUP X.X
NAME:CONC
Exits returns to the
previous Menu
<SET SET> EDIT PRNT
Allows to edit the channel name, see next key sequence.
EXIT
Reports the configuration of current
data channels to the RS-232 ports.
When editing the data channels, the top line of the display indicates some of the configuration
parameters. For example, the display line:
0) CONC : ATIMER, 4, 800
translates to the following configuration:
Channel No.: 0
NAME: CONC
TRIGGER EVENT: ATIMER
04584 Rev A1
104
Model GFC7000E Instruction Manual
Operating Instructions
PARAMETERS: Four parameters are included in this channel
EVENT: This channel is set up to record 800 data points.
To edit the name of a data channel, follow the above key sequence and then press:
From the end of the previous key sequence …
SETUP X.X
<SET
SET> EDIT
SETUP X.X
C
NAME:CONC
O
PRINT
EXIT
NAME:CONC
N
C
-
-
ENTR
EXIT
ENTR accepts the new string
and returns to the previous
menu.
EXIT ignores the new string
and returns to the previous
menu.
Press each key repeatedly to cycle through the
available character set:
0-9, A-Z, space ’ ~ ! © # $ % ^ & * ( ) - _ = +[ ]
{ } < >\ | ; : , . / ?
6.12.2.3. Trigger Events
To edit the list of data parameters associated with a specific data channel, press:
From the DATA ACQUISITION menu
(see Section 6.12.2.2)
Edit Data Channel Menu
SETUP X.X
0) CONC:
PREV NEXT
SETUP X.X
<SET
900
PRNT
EXIT
Exits to the Main
Data Acquisition
menu
PRINT
EXIT
EVENT:ATIMER
SET> EDIT
SETUP X.X
DEL EDIT
1,
NAME:CONC
SET> EDIT
SETUP X.X
<SET
INS
ATIMER,
PRINT
EXIT
EVENT:ATIMER
<PREV NEXT>
ENTR
EXIT
ENTR accepts the new string
and returns to the previous
menu.
EXIT ignores the new string
and returns to the previous
menu.
Press each key repeatedly to cycle through the
list of available trigger events.
04584 Rev A1
105
Model GFC7000E Instruction Manual
Operating Instructions
6.12.2.4. Editing iDAS Parameters
Data channels can be edited individually from the front panel without affecting other data
channels. However, when editing a data channel, such as during adding, deleting or editing
parameters, all data for that particular channel will be lost, because the iDAS can store only data
of one format (number of parameter columns etc.) for any given channel. In addition, an iDAS
configuration can only be uploaded remotely as an entire set of channels. Hence, remote update
of the iDAS will always delete all current channels and stored data.
To modify, add or delete a parameter, follow the instruction shown in section 6.12.2.2 then press:
From the DATA ACQUISITION menu
(see Section 6.12.2.2)
Edit Data Channel Menu
SETUP X.X
PREV NEXT
SETUP X.X
0) CONC:
INS
DEL EDIT
1,
900
EXIT
PRNT
Exits to the main
Data Acquisition
menu
NAME:CONC
SET> EDIT
<SET
ATIMER,
PRINT
EXIT
Press SET> key until…
SETUP X.X
SET> EDIT
<SET
YES will delete
all data in that
entire channel.
SETUP X.X
YES
PARAMETERS:1
PRINT
EXIT
EDIT PARAMS (DELETE DATA)
NO
NO returns to
the previous
menu and
retains all data.
Edit Data Parameter Menu
Moves the
display between
existing
Parameters
Inserts a new Parameter
before the currently
displayed Parameter
04584 Rev A1
SETUP X.X
PREV NEXT
0) PARAM=CONC1, MODE=AVG
INS
DEL EDIT
Deletes the Parameter
currently displayed.
EXIT
Exits to the main
Data Acquisition
menu
Use to configure
the functions for
this Parameter.
106
Model GFC7000E Instruction Manual
Operating Instructions
To configure a specific data parameter, press:
FROM THE EDIT DATA PARAMETER MENU
(see previous section)
SETUP X.X
0) PARAM=CONC1, MODE=AVG
PREV NEXT
SETUP X.X
INS
DEL EDIT
EXIT
PARAMETERS:CONC!
SET> EDIT
EXIT
SETUP X.X
PARAMETERS: PMTDET
PREV NEXT
ENTR
EXIT
If more than on parameter is active for
this channel, these cycle through list of
existing Parameters.
SETUP X.X
<SET SET>
SAMPLE MODE:AVG
EDIT
EXIT
SETUP X.X
INST
AVG
SAMPLE MODE: INST
MIN
MAX
EXIT
Press the key for the desired mode
ENTR accepts the new
setting and returns to the
previous menu.
EXIT ignores the new setting
and returns to the previous
SETUP X.X PRECISION: 1
<SET SET>
EDIT
EXIT
SETUP X.X PRECISION: 1
1
EXIT
Set for 0-4
<SET Returns to
previous
Functions
SETUP X.X STORE NUM. SAMPLES: OFF
<SET
EDIT
EXIT
SETUP X.X STORE NUM. SAMPLES: OFF
OFF
ENTR
EXIT
Turn ON or OFF
6.12.2.5. Sample Period and Report Period
The iDAS defines two principal time periods by which sample readings are taken and permanently
recorded:
•
SAMPLE PERIOD: Determines how often iDAS temporarily records a sample reading of
the parameter in volatile memory. The SAMPLE PERIOD is set to one minute by default
and generally cannot be accessed from the standard iDAS front panel menu, but is
available via the instruments communication ports by using APICOM or the analyzer’s
standard serial data protocol.
SAMPLE PERIOD is only used when the iDAS parameter’s sample mode is set for AVG,
MIN or MAX.
04584 Rev A1
107
Model GFC7000E Instruction Manual
•
Operating Instructions
REPORT PERIOD: Sets how often the sample readings stored in volatile memory are
processed, (e.g. average, minimum or maximum are calculated) and the results stored
permanently in the instruments Disk-on-Chip as well as transmitted via the analyzer’s
communication ports. The REPORT PERIOD may be set from the front panel.
If the INST sample mode is selected the instrument stores and reports an instantaneous
reading of the selected parameter at the end of the chosen REPORT PERIOD
In AVG, MIN or MAX sample modes, the settings for the SAMPLE PERIOD and the REPORT
PERIOD determine the number of data points used each time the average, minimum or
maximum is calculated, stored and reported to the COMM ports. The actual sample readings are
not stored past the end of the of the chosen REPORT PERIOD.
Also, the SAMPLE PERIOD and REPORT PERIOD intervals are synchronized to the beginning
and end of the appropriate interval of the instruments internal clock.
•
If SAMPLE PERIOD were set for one minute the first reading would occur at the beginning
of the next full minute according to the instrument’s internal clock.
•
If the REPORT PERIOD were set for of one hour the first report activity would occur at
the beginning of the next full hour according to the instrument’s internal clock.
EXAMPLE: Given the above settings, if iDAS were activated at 7:57:35 the first sample
would occur at 7:58 and the first report would be calculated at 8:00 consisting of data
points for 7:58. 7:59 and 8:00.
During the next hour (from 8:01 to 9:00) the instrument will take a sample reading every
minute and include 60 sample readings.
When the STORE NUM. SAMPLES feature is turned on the instrument will also store how many
sample readings were used for the AVG, MIN or MAX calculation but not the readings
themselves.
REPORT PERIODS IN PROGRESS WHEN INSTRUMENT IS POWERED OFF
If the instrument is powered off in the middle of a REPORT PERIOD, the samples accumulated so
far during that period are lost. Once the instrument is turned back on, the iDAS restarts taking
samples and temporarily them in volatile memory as part of the REPORT PERIOD currently
active at the time of restart. At the end of this REPORT PERIOD only the sample readings taken
since the instrument was turned back on will be included in any AVG, MIN or MAX calculation.
Also, the STORE NUM. SAMPLES feature will report the number of sample readings taken since
the instrument was restarted.
04584 Rev A1
108
Model GFC7000E Instruction Manual
Operating Instructions
To define the REPORT PERIOD, follow the instruction shown in section 6.12.2.2 then press:
From the DATA ACQUISITION menu
(see Section 6.12.2.2)
Edit Data Channel Menu
Use the PREV and NEXT
keys to scroll to the data
channel to be edited.
SETUP X.X
0) CONC:
PREV NEXT
SETUP X.X
<SET
ATIMER,
DEL EDIT
INS
1,
900
PRNT
EXIT
Exits to the main
Data Acquisition
menu.
NAME:CONC
SET> EDIT
PRINT
EXIT
Press SET> key until you reach REPORT PERIOD …
SETUP X.X
<SET
SET> EDIT
SETUP X.X
Set the number of days
between reports (0-366).
Press keys to set hours
between reports in the format :
HH:MM (max: 23:59). This is a
24 hour clock . PM hours are 13
thru 23, midnight is 00:00.
Example 2:15 PM = 14:15
0
0
SETUP X.X
0
REPORT PERIOD:000:01:00
1
PRINT
EXIT
REPORT PERIODD:DAYS:0
0
ENTR
EXIT
REPORT PERIODD:TIME:01:01
0
0
ENTR
EXIT
IIf at any time an illegal entry is selected (e.g., days > 366)
the ENTR key will disappear from the display.
ENTR accepts the new string and
returns to the previous menu.
EXIT ignores the new string and
returns to the previous menu.
6.12.2.6. Number of Records
The number of data records in the MGFC7000E is limited to about a cumulative one million data
points in all channels (one megabyte of space on the disk-on-chip). However, the actual number
of records is also limited by the total number of parameters and channels and other settings in the
iDAS configuration. Every additional data channel, parameter, number of samples setting etc. will
reduce the maximum amount of data points somewhat. In general, however, the maximum data
capacity is divided amongst all channels (max: 20) and parameters (max: 50 per channel).
The iDAS will check the amount of available data space and prevent the user from specifying too
many records at any given point. If, for example, the iDAS memory space can accommodate 375
more data records, the ENTR key will disappear when trying to specify more than that number of
records. This check for memory space may also make an upload of an iDAS configuration with
APICOM or a Terminal program fail, if the combined number of records would be exceeded. In this
case, it is suggested to either try from the front panel what the maximum number of records can
be or use trial-and-error in designing the iDAS script or calculate the number of records using the
DAS or AICOM manuals. To set the number of records for one channel from the front panel, press
SETUP-DAS-EDIT-ENTR and the following key sequence.
04584 Rev A1
109
Model GFC7000E Instruction Manual
Operating Instructions
From the DATA ACQUISITION menu
(see Section 6.12.2.2)
Edit Data Channel Menu
SETUP X.X
0) CONC:
PREV NEXT
SETUP X.X
<SET
INS
ATIMER, 1 2,
DEL EDIT
PRNT
900
EXIT
Exits to the main
Data Acquisition
menu
NAME:CONC
SET> EDIT
PRINT
EXIT
Press SET> key until…
SETUP X.X
<SET
SET> EDIT
SETUP X.X
YES will delete all data
in this channel.
Toggle keys to set
number of records
(1-99999)
YES
PRINT
EXIT
EDIT RECOPRDS (DELET DATA)
NO returns to the
previous menu.
NO
SETUP X.X
0
NUMBER OF RECORDS:000
0
REPORT PERIODD:DAYS:0
0
0
0
ENTR
EXIT
ENTR accepts the new
setting and returns to the
previous menu.
EXIT ignores the new setting
and returns to the previous
menu.
6.12.2.7. RS-232 Report Function
The MGFC7000E iDAS can automatically report data to the communications ports, where they can
be captured with a terminal emulation program or simply viewed by the user.
04584 Rev A1
110
Model GFC7000E Instruction Manual
Operating Instructions
To enable automatic COM port reporting, follow the instruction shown in section 6.12.2.2 then
press:
From the DATA ACQUISITION menu
(see Section 6.12.2.2)
Edit Data Channel Menu
SETUP X.X
PREV NEXT
SETUP X.X
<SET
0) CONC:
INS
ATIMER,
DEL EDIT
1,
900
PRNT
EXIT
Exits to the main
Data Acquisition
menu
NAME:CONC
SET> EDIT
PRINT
EXIT
Press SET> key until…
SETUP X.X
<SET
SET> EDIT
SETUP X.X
Toggle key to turn
reporting ON or OFF
OFF
RS-232 REPORT: OFF
PRINT
EXIT
RS-232 REPORT: OFF
ENTR
EXIT
ENTR accepts the new
setting and returns to the
previous menu.
EXIT ignores the new setting
and returns to the previous
menu.
6.12.2.8. Compact Report
When enabled, this option avoids unnecessary line breaks on all RS-232 reports. Instead of
reporting each parameter in one channel on a separate line, up to five parameters are reported in
one line.
6.12.2.9. Starting Date
This option allows to specify a starting date for any given channel in case the user wants to start
data acquisition only after a certain time and date. If the Starting Date is in the past, the iDAS
ignores this setting.
6.12.2.10. Disabling/Enabling Data Channels
Data channels can be temporarily disabled, which can reduce the read/write wear on the disk-onchip. The ALL_01 channel of the MGFC7000E, for example, is disabled by default.
04584 Rev A1
111
Model GFC7000E Instruction Manual
Operating Instructions
To disable a data channel, follow the instruction shown in section 6.12.2.2 then press:
From the DATA ACQUISITION menu
(see Section 6.12.2.2)
Edit Data Channel Menu
SETUP X.X
0) CONC:
PREV NEXT
SETUP X.X
<SET
INS
ATIMER,
DEL EDIT
1,
900
PRNT
EXIT
Exits to the main
Data Acquisition
menu
NAME:CONC
SET> EDIT
PRINT
EXIT
Press SET> key until…
SETUP X.X
<SET
SET> EDIT
SETUP X.X
Toggle key to turn
channel ON or OFF
CHANNEL ENABLE:ON
PRINT
EXIT
CHANNEL ENABLE:ON
OFF
ENTR
EXIT
ENTR accepts the new
setting and returns to the
previous menu.
EXIT ignores the new setting
and returns to the previous
menu.
6.12.2.11. HOLDOFF Feature
The iDAS HOLDOFF feature allows to prevent data collection during calibrations and during the
DAS_HOLDOFF period enabled and specified in the VARS (Section 6.8). To enable or disable the
HOLDOFF, follow the instruction shown in section 6.12.2.2 then press:
From the DATA ACQUISITION menu
(see Section 6.12.2.2)
Edit Data Channel Menu
SETUP X.X
0) CONC:
PREV NEXT
SETUP X.X
<SET
INS
ATIMER,
DEL EDIT
1,
PRNT
900
EXIT
Exits to the main
Data Acquisition
menu
NAME:CONC
SET> EDIT
PRINT
EXIT
Press SET> key until…
SETUP X.X
CAL HOLD OFF:ON
SET> EDIT
SETUP X.X
Toggle key to turn
HOLDOFF ON or OFF
04584 Rev A1
ON
PRINT
EXIT
CAL HOLD OFF:ON
ENTR
EXIT
ENTR accepts the new
setting and returns to the
previous menu.
EXIT ignores the new setting
and returns to the previous
menu.
112
Model GFC7000E Instruction Manual
Operating Instructions
6.12.3. Remote iDAS Configuration
Editing channels, parameters and triggering events as described in this section can be performed
via the APICOM remote control program using the graphic interface shown in Figure 6-8. Refer to
Section 6.13 for details on remote access to the MGFC7000E analyzer.
Figure 6-8:
APICOM user interface for configuring the iDAS.
Once an iDAS configuration is edited (which can be done offline and without interrupting DAS data
collection), it is conveniently uploaded to the instrument and can be stored on a computer for
later review, alteration or documentation and archival. Refer to the APICOM manual for details on
these procedures. The APICOM user manual (Teledyne Instruments part number 039450000) is
included in the APICOM installation file, which can be downloaded at http://www.teledyneapi.com/software/apicom/.
Although Teledyne Analytical Instruments recommends the use of APICOM, the iDAS can also be
accessed and configured through a terminal emulation program such as HyperTerminal (Figure
6-9). However, all configuration commands must be created following a strict syntax or be pasted
in from of a text file, which was edited offline and then uploaded through a specific transfer
procedure.
04584 Rev A1
113
Model GFC7000E Instruction Manual
Figure 6-9:
Operating Instructions
iDAS Configuration Through a Terminal Emulation Program.
Both procedures are best started by downloading the default iDAS configuration, getting familiar
with its command structure and syntax conventions, and then altering a copy of the original file
offline before uploading the new configuration.
CAUTION
Whereas the editing, adding and deleting of iDAS channels and parameters of one
channel through the front-panel keyboard can be done without affecting the other
channels, uploading an iDAS configuration script to the analyzer through its
communication ports will erase all data, parameters and channels by replacing them
with the new iDAS configuration. Backup of data and the original iDAS configuration is
advised before attempting any iDAS changes.
04584 Rev A1
114
Model GFC7000E Instruction Manual
Operating Instructions
6.13. Remote Operation of the Analyzer
6.13.1. Remote Operation Using the External Digital I/O
6.13.1.1. Status Outputs
The status outputs report analyzer conditions via optically isolated NPN transistors, which sink up
to 50 mA of DC current. These outputs can be used interface with devices that accept logic-level
digital inputs, such as programmable logic controllers (PLC’s). Each Status bit is an open collector
output that can withstand up to 40 VDC. All of the emitters of these transistors are tied together
and available at D.
NOTE
Most PLC’s have internal provisions for limiting the current that the input will draw from
an external device. When connecting to a unit that does not have this feature, an
external dropping resistor must be used to limit the current through the transistor
output to less than 50 mA. At 50 mA, the transistor will drop approximately 1.2V from
its collector to emitter.
The status outputs are accessed via a 12-pin connector on the analyzer’s rear panel labeled
STATUS. The function of each pin is defined in Table 6–24.
STATUS
Figure 6-10:
04584 Rev A1
D
+
Connect to
Internal Ground of
Monitoring Device
8
ALARM 2
7
ALARM 1
6
DIAGNOSTIC MODE
5
SPAN CAL
4
ZERO CAL
3
HIGH RANGE
2
CONC VALID
SYSTEM OK
1
Status Output Connector
115
Model GFC7000E Instruction Manual
Operating Instructions
The pin assignments for the Status Outputs are:
Table 6-24:
Status Output Pin Assignments
Output #
Status
Definition
1
SYSTEM OK
On if no faults are present.
CONC VALID
On if CO2 concentration measurement is valid.
If the CO2 concentration measurement is invalid, this bit is OFF.
3
HIGH RANGE
On if unit is in high range of DUAL or AUTO range modes.
4
ZERO CAL
On whenever the instruments zero point is being calibrated.
5
SPAN CAL
On whenever the instruments span point is being calibrated.
6
DIAG MODE
2
Condition
On whenever the instrument is in diagnostic mode.
7
ALARM1
On whenever the measured CO2 concentration is above the set
point for ALM1
8
ALARM2
On whenever the measured CO2 concentration is above the set
point for ALM2
D
EMITTER BUSS
+
DC POWER
Digital Ground
The emitters of the transistors on pins 1-8 are bussed together.
+ 5 VDC
The ground level from the analyzer’s internal DC power supplies.
6.13.1.2. Control Inputs
These inputs allow the user to remotely initiate Zero and Span calibrations. Two methods for
energizing the inputs is provided below; the first using the internal +5V available on the CONTROL
IN connector and the second, if an external, isolated supply is employed.
Table 6-25:
Input
Control Input Pin Assignments
Status
Condition when enabled
A
EXTERNAL ZERO
CAL
Zero calibration mode is activated. The mode field of the
display will read ZERO CAL R.
B
EXTERNAL SPAN
CAL
Span calibration mode is activated. The mode field of the
display will read SPAN CAL R.
C
Unused
D
Unused
E
Unused
F
Unused
DIGITAL GROUND
Provided to ground an external device (e.g., recorder).
U
DC power for
Input pull ups
Input for +5 VDC required to activate inputs A - F. This voltage
can be taken from an external source or from the “+” pin.
+
Internal +5V
Supply
Internal source of +5V which can be used to activate inputs
when connected to pin U.
04584 Rev A1
116
Model GFC7000E Instruction Manual
Operating Instructions
There are two methods to activate control inputs. The internal +5V available from the “+” pin is
the most convenient method (Figure 6.11). However, to ensure that these inputs are truly
isolated, a separate, external 5 VDC power supply should be used (Figure 6.11).
CONTROL IN
CONTROL IN
A
Z
E
R
O
B
C
D
E
F
U
A
+
Z
E
R
O
S
P
A
N
B
C
Figure 6-11:
E
F
U
+
S
P
A
N
Local Power Connections
D
5 VDC Power
Supply
+
External Power Connections
Control Inputs
6.13.2. Remote Operation Using the External Serial I/O
6.13.2.1. Terminal Operating Modes
The Model GFC7000E can be remotely configured, calibrated or queried for stored data through
the serial ports. As terminals and computers use different communication schemes, the analyzer
supports two communicate modes specifically designed to interface with these two types of
devices.
•
Computer mode is used when the analyzer is connected to a computer with a dedicated
interface program such as APICOM. More information regarding APICOM can be found in
later in this section or on the Teledyne Instruments website at http://www.teledyneapi.com/software/apicom/.
•
Interactive mode is used with a terminal emulation programs such as HyperTerminal or a
“dumb” computer terminal. The commands that are used to operate the analyzer in this
mode are listed in Table 6-26.
04584 Rev A1
117
Model GFC7000E Instruction Manual
Operating Instructions
6.13.2.2. Help Commands in Terminal Mode
Table 6-26:
Terminal Mode Software Commands
COMMAND
Function
Control-T
Switches the analyzer to terminal mode (echo, edit). If mode flags 1 & 2 are OFF,
the interface can be used in interactive mode with a terminal emulation program.
Control-C
Switches the analyzer to computer mode (no echo, no edit).
CR
(carriage return)
BS
(backspace)
A carriage return is required after each command line is typed into the
terminal/computer. The command will not be sent to the analyzer to be executed
until this is done. On personal computers, this is achieved by pressing the ENTER
key.
Erases one character to the left of the cursor location.
ESC
(escape)
Erases the entire command line.
? [ID] CR
This command prints a complete list of available commands along with the
definitions of their functionality to the display device of the terminal or computer
being used. The ID number of the analyzer is only necessary if multiple analyzers
are on the same communications line, such as the multi-drop setup.
Control-C
Pauses the listing of commands.
Control-P
Restarts the listing of commands.
6.13.2.3. Command Syntax
Commands are not case-sensitive and all arguments within one command (i.e. ID numbers,
keywords, data values, etc.) must be separated with a space character.
All Commands follow the syntax:
X [ID] COMMAND <CR>
Where
X
is the command type (one letter) that defines the type of command. Allowed
designators are listed in Table 6-27 and Appendix A-6.
[ID]
is the analyzer identification number (Section 6.10.1.). Example: the Command
“? 200” followed by a carriage return would print the list of available commands
for the revision of software currently installed in the instrument assigned ID
Number 200.
COMMAND is the command designator: This string is the name of the command being
issued (LIST, ABORT, NAME, EXIT, etc.). Some commands may have additional
arguments that define how the command is to be executed. Press ? <CR> or
refer to Appendix A-6 for a list of available command designators.
<CR>
04584 Rev A1
is a carriage return. All commands must be terminated by a carriage return
(usually achieved by pressing the ENTER key on a computer).
118
Model GFC7000E Instruction Manual
Table 6-27:
Operating Instructions
Command Types
COMMAND
COMMAND TYPE
C
Calibration
D
Diagnostic
L
Logon
T
Test measurement
V
Variable
W
Warning
6.13.2.4. Data Types
Data types consist of integers, hexadecimal integers, floating-point numbers, Boolean expressions
and text strings.
•
Integer data are used to indicate integral quantities such as a number of records, a filter
length, etc. They consist of an optional plus or minus sign, followed by one or more digits.
For example, +1, -12, 123 are all valid integers.
•
Hexadecimal integer data are used for the same purposes as integers. They consist of the
two characters “0x,” followed by one or more hexadecimal digits (0-9, A-F, a-f), which is
the ‘C’ programming language convention. No plus or minus sign is permitted. For
example, 0x1, 0x12, 0x1234abcd are all valid hexadecimal integers.
•
Floating-point numbers are used to specify continuously variable values such as
temperature set points, time intervals, warning limits, voltages, etc. They consist of an
optional plus or minus sign, followed by zero or more digits, an optional decimal point, and
zero or more digits. (At least one digit must appear before or after the decimal point.)
Scientific notation is not permitted. For example, +1.0, 1234.5678, -0.1, 1 are all valid
floating-point numbers.
•
Boolean expressions are used to specify the value of variables or I/O signals that may
assume only two values. They are denoted by the keywords ON and OFF.
•
Text strings are used to represent data that cannot be easily represented by other data
types, such as data channel names, which may contain letters and numbers. They consist
of a quotation mark, followed by one or more printable characters, including spaces,
letters, numbers, and symbols, and a final quotation mark. For example, “a”, “1”,
“123abc”, and “()[]<>” are all valid text strings. It is not possible to include a quotation
mark character within a text string.
•
Some commands allow you to access variables, messages, and other items, such as iDAS
data channels, by name. When using these commands, you must type the entire name of
the item; you cannot abbreviate any names.
04584 Rev A1
119
Model GFC7000E Instruction Manual
Operating Instructions
6.13.2.5. Status Reporting
Reporting of status messages as an audit trail is one of the three principal uses for the RS-232
interface (the other two being the command line interface for controlling the instrument and the
download of data in electronic format). You can effectively disable the reporting feature by setting
the interface to quiet mode (Section 6.10.6., Table 6-16).
Status reports include iDAS data (when reporting is enabled), warning messages, calibration and
diagnostic status messages. Refer to Appendix A-3 for a list of the possible messages, and this
section for information on controlling the instrument through the RS-232 interface.
General Message Format
All messages from the instrument (including those in response to a command line request) are in
the format:
X DDD:HH:MM [Id] MESSAGE<CRLF>
Where:
X
is a command type designator, a single character indicating the message
type, as shown in the Table 6-27.
DDD:HH:MM is the time stamp, the date and time when the message was issued. It
consists of the Day-of-year (DDD) as a number from 1 to 366, the hour of
the day (HH) as a number from 00 to 23, and the minute (MM) as a number
from 00 to 59.
[ID]
is the analyzer ID, a number with 1 to 4 digits.
MESSAGE
is the message content that may contain warning messages, test
measurements, iDAS reports, variable values, etc.
<CRLF>
is a carriage return / line feed pair, which terminates the message.
The uniform nature of the output messages makes it easy for a host computer to parse them into
an easy structure. Keep in mind that the front panel display does not give any information on the
time a message was issued, hence it is useful to log such messages for trouble-shooting and
reference purposes. Terminal emulation programs such as HyperTerminal can capture these
messages to text files for later review.
6.13.2.6. Remote Access by Modem
The MGFC7000E can be connected to a modem for remote access. This requires a cable between
the analyzer’s COM port and the modem, typically a DB-9F to DB-25M cable (available from
Teledyne Instruments with part number WR0000024).
Once the cable has been connected, check to make sure the DTE-DCE is in the correct position.
Also make sure the MGFC7000E COM port is set for a baud rate that is compatible with the
modem, which needs to operate with an 8-bit word length with one stop bit.
The first step is to turn on the MODEM ENABLE communication mode (Mode 64, Section 6.10.6).
Once this is completed, the appropriate setup command line for your modem can be entered into
the analyzer. The default setting for this feature is
AT Y0 &D0 &H0 &I0 S0=2 &B0 &N6 &M0 E0 Q1 &W0
04584 Rev A1
120
Model GFC7000E Instruction Manual
Operating Instructions
This string can be altered to match your modem’s initialization and can be up to 100 characters
long.
To change this setting press:
SAMPLE*
RANGE = 500.000 PPM
CO2 =X.XXX
< TST TST > CAL
SETUP
SETUP X.X
SET>
SAMPLE
8
COM1 MODE:0
EDIT
EXIT
ENTER SETUP PASS : 818
1
8
ENTR EXIT
SETUP X.X
<SET SET>
SETUP X.X
COM1 BAUD RATE:19200
EDIT
CFG DAS RNGE PASS CLK MORE
EXIT
SETUP X.X
EXIT returns
to the
previous
menu
SETUP X.X
<SET SET>
SECONDARY SETUP MENU
COMM VARS DIAG
ALRM
COM1 MODEM INIT:AT Y∅ &D∅ &H
EDIT
SETUP X.X
ID
COM1
EXIT
EXIT
SETUP X.X
Select which
COM Port is
tested
EXIT
PRIMARY SETUP MENU
<CH CH>
COMMUNICATIONS MENU
COM2
COM1 MODEM INIT:[A]T Y∅ &D∅ &H
INS
DEL
[A]
ENTR
EXIT
ENTR accepts the
new string and returns
to the previous menu.
EXIT ignores the new
string and returns to
the previous menu.
EXIT
The <CH and CH> keys move
the [ ] cursor left and right
along the text string
The INS key
inserts a character
before the cursor
location.
The DEL key
deletes a character
at the cursor
location.
Press the [?]
key repeatedly to cycle through the
available character set:
0-9
A-Z
space ’ ~ ! © # $ % ^ & * ( ) - _ =
+[ ] { } < >\ | ; : , . / ?
To Initialize the modem press:
SAMPLE*
RANGE = 500.000 PPM
CO2 =X.XXX
< TST TST > CAL
SETUP
SETUP X.X
SET>
SAMPLE
8
COM1 MODE:0
EDIT
1
8
ENTR EXIT
SETUP X.X
SETUP X.X
<SET SET>
PRIMARY SETUP MENU
CFG DAS RNGE PASS CLK MORE
EXIT returns
to the
previous
menu
SECONDARY SETUP MENU
COMM VARS DIAG
ALRM
COM1 BAUD RATE:19200
EDIT
<SET SET>
COM1 MODEM INIT:AT Y∅ &D∅ &H
EDIT
COM1 INITIALIZE MODEM
COMMUNICATIONS MENU
<SET SET> INIT
COM1
COM2
EXIT
EXIT
SETUP X.X
EXIT returns to the
Communications Menu.
04584 Rev A1
EXIT
EXIT
SETUP X.X
ID
EXIT
EXIT
SETUP X.X
SETUP X.X
SETUP X.X
Select which
COM Port is
tested
EXIT
ENTER SETUP PASS : 818
<SET SET> INIT
INITIALIZING MODEM
EXIT
121
Model GFC7000E Instruction Manual
Operating Instructions
6.13.2.7. COM Port Password Security
In order to provide security for remote access of the MGFC7000E, a LOGON feature can be
enabled to require a password before the instrument will accept commands. This is done by
turning on the SECURITY MODE (Mode 4, Section 6.10.6). Once the SECURITY MODE is
enabled, the following items apply.
•
A password is required before the port will respond or pass on commands.
•
If the port is inactive for one hour, it will automatically logoff, which can also be achieved
with the LOGOFF command.
•
Three unsuccessful attempts to log on with an incorrect password will cause subsequent
logins to be disabled for 1 hour, even if the correct password is used.
•
If not logged on, the only active command is the '?' request for the help screen.
•
The following messages will be returned at logon:
•
LOGON SUCCESSFUL - Correct password given
•
LOGON FAILED - Password not given or incorrect
•
LOGOFF SUCCESSFUL - Connection terminated successfully
To log on to the model GFC7000E analyzer with SECURITY MODE feature enabled, type:
LOGON 940331
940331 is the default password. To change the default password, use the variable RS232_PASS
issued as follows:
V RS232_PASS=NNNNNN
Where N is any numeral between 0 and 9.
6.13.2.8. APICOM Remote Control Program
APICOM is an easy-to-use, yet powerful interface program that allows to access and control any of
Teledyne Instruments’ main line of ambient and stack-gas instruments from a remote connection
through direct cable, modem or Ethernet. Running APICOM, a user can:
Establish a link from a remote location to the MGFC7000E through direct cable connection via RS232 modem or Ethernet.
•
View the instrument’s front panel and remotely access all functions that could be accessed
when standing in front of the instrument.
•
Remotely edit system parameters and set points.
•
Download, view, graph and save data for predictive diagnostics or data analysis.
•
Retrieve, view, edit, save and upload iDAS configurations.
04584 Rev A1
122
Model GFC7000E Instruction Manual
•
Operating Instructions
Check on system parameters for trouble-shooting and quality control.
APICOM is very helpful for initial setup, data analysis, maintenance and trouble-shooting. Figure
6-8 shows an example of APICOM being used to remotely configuration the instruments iDAS
feature. Figure 6-12 shows examples of APICOM’s main interface, which emulates the look and
functionality of the instruments actual front panel
Figure 6-12:
APICOM Remote Control Program Interface
APICOM is included free of cost with the analyzer and the latest versions can also be downloaded
for free at http://www.teledyne-api.com/software/apicom/.
6.13.3. Additional Communications Documentation
Table 6-28:
INTERFACE / TOOL
APICOM
Multi-drop
DAS Manual
Serial Interface Documents
DOCUMENT TITLE
PART
NUMBER
AVAILABLE
ONLINE*
APICOM User Manual
039450000
YES
RS-232 Multi-drop Documentation
021790000
YES
Detailed description of the iDAS.
028370000
YES
* These documents can be downloaded at http://www.teledyne-api.com/manuals/
6.13.4. Using the GFC7000E with a Hessen Protocol Network
6.13.4.1. General Overview of Hessen Protocol
The Hessen protocol is a multidrop protocol, in which several remote instruments are connected
via a common communications channel to a host computer. The remote instruments are regarded
as slaves of the host computer. The remote instruments are unaware that they are connected to
a multidrop bus and never initiate Hessen protocol messages. They only respond to commands
from the host computer and only when they receive a command containing their own unique ID
number.
04584 Rev A1
123
Model GFC7000E Instruction Manual
Operating Instructions
The Hessen protocol is designed to accomplish two things: to obtain the status of remote
instruments, including the concentrations of all the gases measured; and to place remote
instruments into zero or span calibration or measure mode. API’s implementation supports both of
these principal features.
The Hessen protocol is not well defined, therefore while API’s application is completely compatible
with the protocol itself, it may be different from implementations by other companies.
The following subsections describe the basics for setting up your instrument to operate over a
Hessen Protocol network. for more detailed information as well as a list of host computer
commands and examples of command and response message syntax, download the Manual
Addendum for Hessen Protocol from the Teledyne Instruments web site: http://www.teledyneai.com/manuals/index.asp .
6.13.4.2. Hessen COMM Port Configuration
Hessen protocol requires the communication parameters of the MGFC7000E’s COMM ports to be
set differently than the standard configuration as shown in the table below.
Table 6-29:
RS-232 Communication Parameters for Hessen Protocol
Parameter
Standard
Hessen
Data Bits
8
7
Stop Bits
1
2
Parity
None
Even
Duplex
Full
Half
To change the rest of the COMM port parameters. see Section 6.10.6.
To change the baud rate of the GFC7000E’s COMM ports, see Section 6.10.7.
NOTE
Make sure that the communication parameters of the host computer are also properly
set.
Also, the instrument software has a 200 ms. latency before it responds to commands
issued by the host computer. This latency should present no problems, but you should
be aware of it and not issue commands to the instrument too frequently.
6.13.4.3. Activating Hessen Protocol
The first step in configuring the GFC7000E to operate over a Hessen protocol network is to
activate the Hessen mode for COMM ports and configure the communication parameters for the
port(s) appropriately. Press:
04584 Rev A1
124
Model GFC7000E Instruction Manual
SAMPLE*
Repeat the
entire process to
set up the
COM2 port
RANGE = 500.000 PPM
CO2 =X.XXX
< TST TST > CAL
SAMPLE
8
Operating Instructions
SETUP X.X
SETUP
NEXT OFF
ENTER SETUP PASS : 818
1
Continue pressing next until …
COM1 HESSEN PROTOCOL : OFF
PRIMARY SETUP MENU
PREV NEXT
CFG DAS RNGE PASS CLK MORE
SETUP X.X
SETUP X.X
ID
The sum of the mode
IDs of the selected
modes is displayed
here
SETUP X.X
COM2
SETUP X.X
EXIT
COM1 MODE:0
EXIT
EDIT
COM1 HESSEN PROTOCOL : ON
PREV NEXT ON
EXIT
COMMUNICATIONS MENU
COM1
SET>
ALRM
ENTR EXIT
OFF
EXIT
SECONDARY SETUP MENU
COMM VARS DIAG
Select which COMM
port to configure
ENTR EXIT
ENTR EXIT
8
SETUP X.X
SETUP X.X
COM1 QUIET MODE: OFF
ENTR EXIT
SETUP X.X
COM1 E,7,1 MODE: OFF
PREV NEXT
OFF
SETUP X.X
COM1 E,7,1 MODE: ON
Toggle OFF/ON keys
to change
activate/deactivate
selected mode.
ENTR EXIT
PREV NEXT ON
ENTR key accepts the
new settings
ENTR EXIT
EXIT key ignores the
new settings
6.13.4.4. Selecting a Hessen Protocol Type
Currently there are two versions of Hessen Protocol in use. The original implementation, referred
to as TYPE 1, and a more recently released version, TYPE 2 that has more flexibility when
operating with instruments that can measure more than one type of gas. For more specific
information about the difference between TYPE 1and TYPE 2 download the Manual Addendum for
Hessen Protocol from the Teledyne Instruments web site: http://www.teledyneai.com/manuals/index.asp .
To select a Hessen Protocol Type press:
SAMPLE*
RANGE = 500.000 PPM
CO2 =X.XXX
< TST TST > CAL
SETUP
SETUP X.X
SAMPLE
8
SETUP X.X
1
8
ENTR EXIT
ID HESN
EXIT
COM1
COM2
SETUP X.
HESSEN VARIATION: TYPE 1
PRIMARY SETUP MENU
SET>
CFG DAS RNGE PASS CLK MORE
EDIT
EXIT
EXIT
ENTR key accepts the
new settings
SETUP X.X
SETUP X.X
COMMUNICATIONS MENU
ENTER SETUP PASS : 818
HESSEN VARIATION: TYPE 1
SECONDARY SETUP MENU
TYE1 TYPE 2
COMM VARS DIAG
ALRM
ENTR EXIT
EXIT
SETUP X.X
Press to change
protocol type.
04584 Rev A1
EXIT key ignores the
new settings
PREV NEXT
HESSEN VARIATION: TYPE 2
OFF
ENTR EXIT
125
Model GFC7000E Instruction Manual
Operating Instructions
NOTE
While Hessen Protocol Mode can be activated independently for COM1 and COM2, The
TYPE selection affects both Ports.
6.13.4.5. Setting The Hessen Protocol Response Mode
The Teledyne Instruments implementation of Hessen Protocol allows the user to choose one of
several different modes of response for the analyzer.
Table 6-30:
Teledyne Instruments Hessen Protocol Response Modes
MODE ID
MODE DESCRIPTION
CMD
This is the Default Setting. Reponses from the instrument are encoded as the traditional
command format. Style and format of responses depend on exact coding of the initiating
command.
BCC
Responses from the instrument are always delimited with <STX> (at the beginning of the
response, <ETX> (at the end of the response followed by a 2 digit Block Check Code
(checksum), regardless of the command encoding.
TEXT
Responses from the instrument are always delimited with <CR> at the beginning and the end
of the string, regardless of the command encoding.
To Select a Hessen response mode, press:
SAMPLE*
RANGE = 500.000 PPM
CO2 =X.XXX
< TST TST > CAL
SAMPLE
8
SETUP X.X
SETUP
ENTER SETUP PASS : 818
1
8
ENTR EXIT
SETUP X.X
ID
PRIMARY SETUP MENU
CFG DAS RNGE PASS CLK MORE
SETUP X.X
EXIT
SETUP X.X
SET>
SECONDARY SETUP MENU
COMM VARS DIAG
ALRM
HESN
COMMUNICATIONS MENU
COM1
COM2
EXIT
HESSEN VARIATION: TYPE 1
EDIT
EXIT
ENTR key accepts the
new settings
EXIT
Press to
change
response
mode.
SETUP X.X
HESSEN RESPONSE MODE :CMD
<SET SET>
EDIT
SETUP X.X
HESSEN RESPONSE MODE :CMD
BCC TEXT
EDIT
EXIT key ignores the
new settings
EXIT
ENTR EXIT
6.13.4.6. Hessen Protocol Gas ID
The Model GFC7000E Analyzer is a single gas instrument that measures CO2. As such it’s default
gas ID has already been set to 310. There is no need to change this setting.
04584 Rev A1
126
Model GFC7000E Instruction Manual
Operating Instructions
6.13.4.7. Setting Hessen Protocol Status Flags
Teledyne Instruments’ implementation of Hessen protocols includes a set of status bits that the
instrument includes in responses to inform the host computer of its condition. Each bit can be
assigned to one operational and warning message flag. The default settings for these bit/flags
are:
Table 6-31:
Default Hessen Status Bit Assignments
STATUS FLAG NAME
DEFAULT BIT
ASSIGNMENT
WARNING FLAGS
SAMPLE FLOW WARNING
0001
BENCH TEMP WARNING
0002
SOURCE WARNING
0004
BOX TEMP WARNING
0008
WHEEL TEMP WARNING
0010
SAMPLE TEMP WARNING
0020
SAMPLE PRESSURE WARNING
0040
INVALID CONC
(The Instrument’s Front Panel Display Will Show
The Concentration As “XXXX”)
0080
OPERATIONAL FLAGS
Instrument Off
0100
In Manual Calibration Mode
0200
In Zero Calibration Mode
0400
In Span Calibration Mode
0800
UNITS OF MEASURE FLAGS
UGM
0000
MGM
2000
PPB
4000
PPM
6000
SPARE/UNUSED BITS
100, 1000, 8000
UNASSIGNED FLAGS (0000)
Sync Warning
Relay Board Warning
Conc Alarm 1
Front Panel Warning
Conc Alarm 2
Analog Cal Warning
Photo Temp Warning
Cannot Dyn Zero
System Reset
Cannot Dyn Span
Rear Board Not Detected
Invalid Conc
NOTES:
It is possible to assign more than one flag to the same Hessen status bit. This allows
the grouping of similar flags, such as all temperature warnings, under the same status
bit.
Be careful not to assign conflicting flags to the same bit as each status bit will be
triggered if any of the assigned flags is active.
04584 Rev A1
127
Model GFC7000E Instruction Manual
Operating Instructions
To assign or reset the status flag bit assignments, press:
SAMPLE*
RANGE = 500.000 PPM
CO2 =X.XXX
< TST TST > CAL
SAMPLE
8
SETUP
ENTER SETUP PASS : 818
1
ENTR EXIT
8
PRIMARY SETUP MENU
SETUP X.X
CFG DAS RNGE PASS CLK MORE
SECONDARY SETUP MENU
SETUP X.X
COMM VARS DIAG
SETUP X.X
ID
EXIT
ALRM
EXIT
COMMUNICATIONS MENU
COM1
HESN
COM2
EXIT
Repeat pressing SET> until …
SETUP X.
HESSEN STATUS FLAGS
<SET SET>
EDIT
SETUP X.
SYNC WARNING: 0000
PREV NEXT
EXIT
EDIT
PRNT EXIT
Repeat pressing NEXT or PREV until the desired
message flag is displayed. See Table 6-27.
For xxample …
SETUP X.
PREV NEXT
The <CH and
CH> keys move
the [ ] cursor left
and right along
the bit string.
SETUP X.
<CH
CH>
SYSTEM RESET: 0000
EDIT
PRNT EXIT
SYSTEM RESET: [0]000
[0]
ENTR key accepts the
new settings
ENTR EXIT
EXIT key ignores the
new settings
Press the [?] key repeatedly to cycle through the available character set: 0-9
Note: Values of A-F can also be set but are meaningless.
6.13.4.8. Instrument ID Code
Each instrument on a Hessen Protocol network must have a unique ID code. The MGFC7000E is
programmed with a default ID code of 360. To change this code see Section 6.10.1
User Notes
04584 Rev A1
128
Model GFC7000E Instruction Manual
Calibration Procedures
7. CALIBRATION PROCEDURES
This section contains a variety of information regarding the various methods for calibrating a
Model GFC7000E CO2 Analyzer as well as other supporting information.
NOTE
The procedures in this section assume that the calibration password feature is disabled
(the instruments default state). If it is enabled a password prompt screen (see Section
6.3.1) will appear after the CAL, CALZ or CALS buttons are pushed but before the
instrument enters the associated calibration mode.
7.1. Before Calibration
The calibration procedures in this section assume that the Range Type, Range Span and units of
measure have already been selected for the analyzer. If this has not been done, please do so
before continuing (see Section 6.7 for instructions).
All Gas lines should be PTFE (Teflon), FEP, glass, stainless steel or brass.
NOTE
If any problems occur while performing the following calibration procedures, refer to
Chapter 11 of this manual for troubleshooting tips.
7.1.1. Zero Air and Span Gas
To perform the following calibration you must have sources for zero air and span gas available.
Zero Air is similar in chemical composition to the Earth’s atmosphere but scrubbed of all
components that might affect the analyzer’s readings. Zero air should contain less than 25 ppb of
CO2 and other major interfering gases such as CO and Water Vapor. It should have a dew point
of -5°C or less
Span Gas is a gas specifically mixed to match the chemical composition of the type of gas being
measured at near full scale of the desired measurement range. It is recommended that the span
gas used have a concentration equal to 80% of the full measurement range.
If Span Gas is sourced directly from a calibrated, pressurized tank, the gas mixture should be CO2
mixed with Zero Air or N2 at the required ratio.
Zero air generators that condition ambient air by drying and removal of pollutants are available on
the commercial market such as the Teledyne Instruments Model 701 Zero Air Generator. We
recommend this type of device, in conjunction with a CO2 scrubber such as soda-lime, for
generating zero air.
04584 Rev A1
129
Model GFC7000E Instruction Manual
Calibration Procedures
7.1.2. Calibration Gas Traceability
All equipment used to produce calibration gases should be verified against standards of the
National Institute for Standards and Technology (NIST). To ensure NIST traceability, we
recommend to acquire cylinders of working gas that are certified to be traceable to NIST Standard
Reference Materials (SRM). These are available from a variety of commercial sources.
7.1.3. Data Recording Devices
A strip chart recorder, data acquisition system or digital data acquisition system should be used to
record data from the MGFC7000E’s serial or analog outputs. If analog readings are used, the
response of the recording system should be checked against a NIST traceable voltage source or
meter. Data recording device should be capable of bi-polar operation so that negative readings
can be recorded. For electronic data recording, the MGFC7000E provides an internal data
acquisition system (iDAS), which is described in detail in Section 6.12.
7.2. Manual Calibration without Zero/Span Valves
This is the basic method for manually calibrating the Model GFC7000E CO2 Analyzer without
functioning zero/span valve options. It is identical to the method described in the GETTING
STARTED (Chapter 3) of this manual and is repeated her for you convenience.
STEP ONE: Connect the Sources of Zero Air and Span Gas as shown below.
Calibrated CO2
gas at desired
span gas
concentration
VENT
Source of
SAMPLE Gas
Removed
during
Calibration
Needle
valve to
control
flow
Indicating
soda-lime
Sample
Valve
Exhaust
Vent Span
MODEL
GFC7000E
Pressure Span
MODEL 701
Zero Air
Generator
Figure 7-1:
04584 Rev A1
IZS
Purge In
Pneumatic Connections–Basic Configuration–Using Bottled Span Gas
130
Model GFC7000E Instruction Manual
Calibration Procedures
Calibrated
CO2 Gas
Source of
SAMPLE Gas
Removed
during
Calibration
MODEL 700
Gas Dilution
Calibrator
Indicating
soda-lime
VENT
Sample
Exhaust
Vent Span
MODEL
GFC7000E
Pressure Span
MODEL 701
Zero Air Generator
IZS
Purge In
Figure 7-2:
Pneumatic Connections–Basic Configuration–Using Gas Dilution Calibrator
STEP TWO: Set the expected CO2 Span Gas concentration:
SAMPLE*
RANGE = 500.000 PPM
CO2 =X.XXX
< TST TST > CAL
The SO2 span
concentration values
automatically default to
400.0 Conc.
To change this value to
the actual concentration of
the span gas, enter the
number by pressing the
key under each digit until
the expected value
appears.
SETUP
M-P CAL
RANGE = 500.000 PPM
< TST TST >
ZERO
CO2 =X.XXX
EXIT
CONC
M-P CAL
SO2 SPAN CONC: 400.000 Conc
0
0
0
4
5
.0
This sequence causes the
analyzer to prompt for the
expected COx span
concentration.
ENTR EXIT
EXIT ignores the new setting
and returns to the previous
display.
ENTR accepts the new setting
and returns to the
previous display..
NOTE
For this Initial Calibration it is important to independently verify the PRECISE CO2
Concentration Value of the SPAN gas.
If the source of the Span Gas is from a Calibrated Bottle, use the exact concentration
value printed on the bottle.
04584 Rev A1
131
Model GFC7000E Instruction Manual
Calibration Procedures
STEP THREE: Perform the Zero/Span Calibration Procedure:
SAMPLE*
RANGE = 500.000 PPM
< TST TST > CAL
SAMPLE
CO2 =XXX.X
SETUP
STABIL=XXX.X PPM
< TST TST > CAL
Set the Display to show the
STABIL test function.
This function calculates the
stability of the COx
measurement
CO2 =XXX.X
SETUP
ACTION:
Allow zero gas to enter the sample port at the
rear of the instrument.
Wait until STABIL
falls below 1.0 ppb.
M-P CAL
STABIL=XXX.X PPM
< TST TST > CAL
M-P CAL
STABIL=XXX.X PPM
CONC
STABIL=XXX.X PPM
< TST TST > ENTR
This may take several
minutes.
SETUP
< TST TST > ZERO
M-P CAL
CO2 =XXX.X
CONC
CO2 =XXX.X
EXIT
CO2 =XXX.X
EXIT
Press ENTR to changes the
OFFSET & SLOPE values for the
CO2 measurements.
Press EXIT to leave the calibration
unchanged and return to the
previous menu.
ACTION:
Allow span gas to enter the sample port at the
rear of the instrument.
The value of
STABIL may jump
significantly.
Wait until it falls back
below 1.0 ppb.
The SPAN key now
appears during the
transition from zero to
span.
M-P CAL
STABIL=XXX.X PPM
< TST TST >
SPAN
CONC
CO2 =XXX.X
This may take several
minutes.
EXIT
You may see both keys.
If either the ZERO or
SPAN buttons fail to
appear see Section 11
for troubleshooting tips.
M-P CAL
RANGE = 500.000 PPM
< TST TST > ENTR SPAN CONC
M-P CAL
RANGE = 500.000 PPM
< TST TST > ENTR
CONC
CO2 =XXX.X
EXIT
Press ENTR to change the
OFFSET & SLOPE values for the
CO2 measurements.
Press EXIT to leave the calibration
unchanged and return to the
previous menu.
CO2 =XXX.X
EXIT
EXIT returns to the main
SAMPLE display
If the ZERO or SPAN keys are not displayed, this means that the measurement made during that
part of the procedure is too far out of the allowable range to do allow a reliable calibration. The
reason for this must be determined before the analyzer can be calibrated. See Chapter 11 for
troubleshooting tips.
04584 Rev A1
132
Model GFC7000E Instruction Manual
Calibration Procedures
7.3. Manual Calibration Checks
Informal calibration checks, which only evaluate but do not alter the analyzer’s response curve,
are recommended as a regular maintenance item and in order to monitor the analyzer’s
performance. To carry out a calibration check rather than a full calibration, follow these steps.
STEP ONE: Connect the sources of zero air and span gas as shown in Figures 7.1 or 7.2.
STEP TWO: Perform the zero/span calibration check procedure:
ACTION:
Supply the instrument with zero gas.
SAMPLE
Scroll the display to the
STABIL test function.
CO2=X.XXX
< TST TST > CAL
SAMPLE
Wait until
STABIL is
below 1.0 ppb.
This may take
several minutes.
RANGE = 500.0 PPM
STABIL=XXX.X PPM
SETUP
CO2=X.XXX
< TST TST > CAL
SAMPLE
STABIL=XXX.X PPM
SETUP
CO2=X.XXX
< TST TST > CAL
The value of
STABIL may jump
significantly.
Wait until it falls
below 1.0 ppb. This
may take several
minutes.
ACTION:
Record the CO2
concentration
reading.
SETUP
ACTION:
Supply span gas to the instrument
SAMPLE
STABIL=XXX.X PPM
< TST TST > CAL
CO2=X.XXX
SETUP
ACTION:
Record the CO2
concentration
reading.
The SPAN key appears during the transition from zero to
span. You may see both keys.
7.4. Manual Calibration with Zero/Span Valves
There are four different zero/span valve option configurations (see Section 5.4). They all operate
identically, differing only in the method used to supply calibration gas to the Analyzer.
STEP ONE: Connect the sources of Zero Air and Span Gas as shown below.
Figures 7-3 through 7-6 show the proper pneumatic connections for GFC7000E’s with various
optional internal valve sets installed.
04584 Rev A1
133
Model GFC7000E Instruction Manual
Calibration Procedures
Source of
SAMPLE Gas
VENT if input is pressurized
Certified
CO2 Gas
Sample
Needle
valve to
control
flow
MODEL 701
Zero Air
Generator
Exhaust
VENT
Vent Span
MODEL
GFC7000E
Pressure Span
VENT
IZS
Purge In
Indicating
soda-lime
Figure 7-3:
Pneumatic Connections–MGFC7000E with Zero/Span/Shutoff Valves (OPT
50)
Source of
SAMPLE Gas
VENT if input is pressurized
Certified
CO2 Gas
Sample
Exhaust
MODEL 701
Zero Air
Generator
VENT
Vent Span
MODEL
GFC7000E
Pressure Span
External Zero
Air Scrubber
Figure 7-4
IZS
Purge In
Indicating
soda-lime
Pneumatic Connections–MGFC7000E with Zero/Span/Shutoff Valves and
External Zero Air Scrubber (OPT 51)
Source of
SAMPLE Gas
VENT if input is pressurized
MODEL 700
Gas Dilution
Calibrator
Certified
CO2 Gas
Sample
Needle
valve to
control flow
Exhaust
VENT
Indicating
soda-lime
Vent Span
MODEL
GFC7000E
Pressure Span
VENT
IZS
Purge In
MODEL 701
Zero Air
Generator
04584 Rev A1
134
Model GFC7000E Instruction Manual
Figure 7-5:
Calibration Procedures
Pneumatic Connections–MGFC7000E with Zero/Span Valves (OPT 52)
Source of
SAMPLE Gas
VENT if input is pressurized
Certified
CO Gas
MODEL 700
Gas Dilution
Calibrator
Sample
Indicating
soda-lime
MODEL
Exhaust
VENT
Vent Span
GFC7000E
Pressure Span
External Zero
Air Scrubber
MODEL 701
Zero Air Generator
Figure 7-6:
IZS
Purge In
Pneumatic Connections–MGFC7000E with Zero/Span Valves with External
Zero air Scrubber (OPT 53)
STEP TWO: Set the expected CO2 Span Gas concentration:
SAMPLE*
RANGE = 500.000 PPM
CO2 =X.XXX
< TST TST > CAL CALZ CALS
The SO2 span
concentration values
automatically default to
400.0 Conc.
To change this value to
the actual concentration of
the span gas, enter the
number by pressing the
key under each digit until
the expected value
appears.
SETUP
M-P CAL
RANGE = 500.000 PPM
< TST TST >
ZERO
CO2 =X.XXX
CONC
EXIT
M-P CAL
SO2 SPAN CONC: 450.000 Conc
0
0
0
4
5
.0
This sequence causes the
analyzer to prompt for the
expected COx span
concentration.
ENTR EXIT
EXIT ignores the new setting
and returns to the previous
display.
ENTR accepts the new setting
and returns to the
previous display..
NOTE
For this Initial Calibration it is important to independently verify the PRECISE CO2
Concentration Value of the SPAN gas.
If the source of the Span Gas is from a Calibrated Bottle, use the exact concentration
value printed on the bottle.
04584 Rev A1
135
Model GFC7000E Instruction Manual
Calibration Procedures
STEP THREE: Perform the zero/span calibration. Zero and span checks using the zero/span
valve option are similar to that described in Section 3.3, except that zero air and span gas is
supplied to the analyzer through the zero/span valves rather than through the sample inlet port.
The zero and cal operations are initiated directly and independently with dedicated keys (CALZ &
CALS).
SAMPLE*
<TST TST>
SAMPLE
RANGE = 500.000 PPM
CAL CALZ
CALS
SETUP
STABIL=XXX.X PPM
< TST TST > CAL
CALZ
CALS
CO2 =XXX.X
Set the Display to show the
STABIL test function.
This function calculates the
stability of the COx
measurement
CO2 =XXX.X
SETUP
ACTION:
Allow zero gas to enter the sample port at the
rear of the instrument.
Wait until STABIL
falls below1.0 ppb.
M-P CAL
STABIL=XXX.X PPM
< TST TST > CAL CALZ
M-P CAL
STABIL=XXX.X PPM
< TST TST > ZERO
M-P CAL
CALS
CONC
STABIL=XXX.X PPM
< TST TST > ENTR
CONC
CO2 =XXX.X
This may take several
minutes.
SETUP
CO2 =XXX.X
EXIT
CO2 =XXX.X
EXIT
Press ENTR to changes the
OFFSET & SLOPE values for the
CO2 measurements.
Press EXIT to leave the calibration
unchanged and return to the
previous menu.
ACTION:
Allow span gas to enter the sample port at the
rear of the instrument.
The value of
STABIL may jump
significantly.
Wait until it falls back
below 1.0 ppb.
The SPAN key now
appears during the
transition from zero to
span.
M-P CAL
STABIL=XXX.X PPM
< TST TST >
SPAN
CONC
CO2 =XXX.X
This may take several
minutes.
EXIT
You may see both keys.
If either the ZERO or
SPAN buttons fail to
appear see Section 11
for troubleshooting tips.
M-P CAL
RANGE = 500.000 PPM
< TST TST > ENTR SPAN CONC
M-P CAL
RANGE = 500.000 PPM
< TST TST > ENTR
04584 Rev A1
CONC
CO2 =XXX.X
EXIT
Press ENTR to change the
OFFSET & SLOPE values for the
CO2 measurements.
Press EXIT to leave the calibration
unchanged and return to the
previous menu.
CO2 =XXX.X
EXIT
EXIT returns to the main
SAMPLE display
136
Model GFC7000E Instruction Manual
Calibration Procedures
7.5. Manual Calibration Checks with Zero/Span Valves
Zero and span checks using the VARIOUS zero/span valve options available for the MGFC7000E
are similar to that described in Section 7.3, except that the zero and calibration operations are
initiated directly and independently with dedicated keys CALZ and CALS.
To perform a manual calibration check of an analyzer with a valve option installed, use the
following method.
STEP ONE: Connect the sources of Zero Air and Span Gas as shown in figures 7-3 through 7-6.
STEP TWO: Perform the zero/span check.
SAMPLE*
Scroll to the STABIL test
function.
< TST TST > CAL CALZ CALS
SAMPLE
Wait until STABIL
falls below 1.0
ppb.
This may take
several minutes.
RANGE = 500.000 PPM
STABIL=XXX.X PPM
< TST TST > CAL CALZ CALS
ZERO CAL M
STABIL=XXX.X PPM
< TST TST > ZERO
SAMPLE
The value of STABIL
may jump
significantly. Wait
until STABIL falls
below 1.0 ppb. This
may take several
minutes.
CONC
STABIL=XXX.X PPM
< TST TST > CAL CALZ CALS
SPAN CAL M
STABIL=XXX.X PPM
< TST TST > ZERO SPAN CONC
CO2 =X.XXX
SETUP
CO2 =X.XXX
SETUP
CO2 =X.XXX
EXIT
ACTION:
Record the
CO2 readings
presented in the
upper right corner of
the display.
CO2 =X.XXX
SETUP
ACTION:
Record the
CO2 readings
presented in the
upper right corner of
the display.
CO2 =X.XXX
EXIT
EXIT returns to the main
SAMPLE display
7.5.1. Zero/Span Calibration on Auto Range or Dual Ranges
If the analyzer is being operated in dual range mode or auto range mode, then the high and low
ranges must be independently calibrated.
When the analyzer is in either dual or auto range modes the user must run a separate calibration
procedure for each range. After pressing the CAL, CALZ or CALS keys the user is prompted for
the range that is to be calibrated as seen in the CALZ example below:
04584 Rev A1
137
Model GFC7000E Instruction Manual
SAMPLE*
Calibration Procedures
RANGE = 500.000 PPM
<TST TST>
CAL CALZ
SAMPLE
CO2 =XXX.X
CALS
SETUP
CO2 =XXX.X
STABIL=XXX.X PPM
< TST TST > CAL
CALZ
Set the Display to show the
STABIL test function.
This function calculates the
stability of the COx
measurement
CALS
SETUP
ACTION:
Allow zero gas to enter the sample port at the
rear of the instrument.
Wait until STABIL
falls below 1.0 ppb.
M-P CAL
< TST TST > CAL CALZ
SAMPLE
CALS
This may take several
minutes.
SETUP
RANGE TO CAL: LOW
LOW HIGH
ENTR
SAMPLE
SETUP
RANGE TO CAL: HIGH
LOW HIGH
ANALYZER ENTERS
ZERO CAL MODE
CO2 =XXX.X
STABIL=XXX.X PPM
ENTR
ZERO CAL M
RANGE = 500.000 PPB
< TST TST > ZERO SPAN CONC
SETUP
SO2 =X.XXX
EXIT
Continue Calibration as per
Standard Procedure
Once this selection is made, the calibration procedure continues as previously described in Section
7.2. The other range may be calibrated by starting over from the main SAMPLE display.
7.5.2. Use of Zero/Span Valves with Remote Contact Closure
Contact closures for controlling calibration are located on the rear panel CONTROL IN connector.
Instructions for setup and use of these contacts are found in Section 6.11.1.2. When the contacts
are closed for at least 5 seconds, the instrument switches into zero or span mode. The remote
calibration contact closures may be activated in any order. It is recommended that contact
closures remain closed for at least 10 minutes to establish a reliable reading.
The instrument will stay in the selected mode for as long as the contacts remain closed. If
calibration is enabled, the MGFC7000E will re-calibrate when the contact is opened, then go into
SAMPLE mode. If calibration is disabled, the instrument will return to SAMPLE mode, leaving the
calibration unchanged.
04584 Rev A1
138
Model GFC7000E Instruction Manual
Calibration Procedures
7.6. Automatic Zero/Span Cal/Check (AutoCal)
The AutoCal system allows unattended periodic operation of the ZERO/SPAN valve options by
using the MGFC7000E’s internal time of day clock. AutoCal operates by executing SEQUENCES
programmed by the user to initiate the various calibration modes of the analyzer and open and
close valves appropriately. It is possible to program and run up to 3 separate sequences (SEQ1,
SEQ2 and SEQ3). Each sequence can operate in one of 3 Modes, or be disabled.
Table 7-1:
AUTOCAL Modes
MODE NAME
DISABLED
ZERO
ZERO-SPAN
SPAN
ACTION
Disables the Sequence
Causes the Sequence to perform a zero calibration/check
Causes the Sequence to perform a zero and span
concentration calibration/check
Causes the Sequence to perform a span concentration
calibration/check
For each mode there are seven parameters that control operational details of the SEQUENCE.
They are:
Table 7-2:
ATTRIBUTE NAME
AutoCal ATTRIBUTE Setup Parameters
ACTION
TIMER ENABLED
Turns on the Sequence timer
STARTING DATE
Sequence will operate after Starting Date
STARTING TIME
Time of day sequence will run
DELTA DAYS
Number of days to skip between each Seq. execution
DELTA TIME
Number of hours later each “Delta Days” Seq is to be run
DURATION
Number of minutes the sequence operates
CALIBRATE
Enable to do a calibration – Disable to do a cal check only
04584 Rev A1
139
Model GFC7000E Instruction Manual
Calibration Procedures
The following example sets Sequence #2 to do a Zero-Span Calibration every other day starting
at 1 am on September 4, 2001, lasting 15 minutes, without calibration. This will start ½ hour later
each iteration.
MODE AND
ATTRIBUTE
VALUE
Sequence
2
Mode
ZERO-SPAN
Timer Enable
ON
Starting Date
Sept. 4, 2001
Starting Time
01:00
Delta Days
2
Delta Time
00:30
Duration
15.0
Calibrate
NO
COMMENT
Define Sequence #2
Select Zero and Span Mode
Enable the timer
Start after Sept 4, 2001
First Span starts at 1:00AM
Do Sequence #2 every other day
Do Sequence #2 ½ hr later each day
Operate Span valve for 15 min
Do not calibrate at end of Sequence
NOTE
The programmed STARTING_TIME must be a minimum of 5 minutes later than the real
time clock (See Section 6.6 for setting real time clock).
NOTE
Avoid setting two or more sequences at the same time of the day. Any new sequence
which is initiated whether from a timer, the COM ports, or the contact closure inputs
will override any sequence which is in progress.
NOTE
If at any time an illegal entry is selected (Example: Delta Days > 367) the ENTR key will
disappear from the display.
04584 Rev A1
140
Model GFC7000E Instruction Manual
Calibration Procedures
To program the Sequence:
SAMPLE*
RANGE = 500.000 PPM
CO2 =X.XXX
SETUP
< TST TST > CAL CALZ CALS
SETUP X.X
STARTING TIME:14:15
<SET SET> EDIT
EXIT
ENTER SETUP PASS : 818
SAMPLE
8
1
8
ENTR EXIT
DELTA DAYS: 1
SETUP X.X
<SET SET> EDIT
PRIMARY SETUP MENU
SETUP X.X
ACAL DAS RNGE PASS CLK MORE
CFG
EXIT
EXIT
SETUP X.X
0
SETUP X.X
0
DELTA DAYS: 1
2
ENTR EXIT
SEQ 1) DISABLED
NEXT MODE
EXIT
SETUP X.X
DELTA DAYS:2
<SET SET> EDIT
SETUP X.X
EXIT
SEQ 2) DISABLED
PREV NEXT MODE
EXIT
SETUP X.X
DELTA TIME00:00
<SET SET> EDIT
SETUP X.X
EXIT
MODE: DISABLED
NEXT
ENTR EXIT
SETUP X.X
0
SETUP X.X
0
DELTA TIME: 00:00
:3
0
ENTR EXIT
MODE: ZERO
PREV NEXT
ENTR EXIT
SETUP X.X
SETUP X.X
ENTR EXIT
SETUP X.X
SETUP X.X
3
TIMER ENABLE: ON
SET> EDIT
0
SETUP X.X
SETUP X.X
SEP
EXIT
0
CALIBRATE: OFF
<SET SET> EDIT
3
EXIT
ENTR EXIT
Format :
DD-MON-Y Y
SETUP X.X
SETUP X.X
DURATION:30.0 MINUTES
CALIBRATE: OFF
STARTING DATE: 04–SEP–03
ON
<SET SET> EDIT
ENTR EXIT
CALIBRATE: ON
STARTING DATE: 04–SEP–03
EXIT
<SET SET> EDIT
<SET SET> EDIT
Toggle keys to
set time:
Format : HH:MM
This is a 24 hr
clock .
PM hours are
13 – 24.
Example
2:15 PM = 14:15
SETUP X.X
EXIT
SETUP X.X
STARTING TIME:00:00
<SET SET> EDIT
EXIT
SEQ 2) ZERO–SPAN, 2:00:30
EXIT
PREV NEXT MODE SET
Sequence
MODE
SETUP X.X
1
04584 Rev A1
4
Toggle key
between
Off and
ON
EXIT
SETUP X.X
SETUP X.X
Toggle keys
to set
duration for
each
iteration of
the
sequence:
Set in
Decimal
minutes
from
0.1 – 60.0
EXIT
STARTING DATE: 01–JAN–02
4
ENTR EXIT
<SET SET> EDIT
<SET SET> EDIT
SETUP X.X
DURATION 15.0MINUTES
.0
EXIT
STARTING DATE: 01–JAN–02
SETUP X.X
EXIT
EXIT
SETUP X.X
SETUP X.X
DURATION:15.0 MINUTES
<SET SET> EDIT
SEQ 2) ZERO–SPAN, 1:00:00
PREV NEXT MODE SET
0
EXIT
MODE: ZERO–SPAN
PREV NEXT
Toggle keys
to set
day, month &
year:
Toggle keys
to set
delay time for
each iteration
of the
sequence:
HH:MM
(0 – 24:00)
DELTA TIEM:00:30
<SET SET> EDIT
Default
value is
ON
Toggle keys
to set
number of
days
between
procedures
(1-367)
EXIT returns
to the SETUP
Menu
Delta Time
Delta Days
STARTING TIME:00:00
:1
5
ENTR EXIT/
141
Model GFC7000E Instruction Manual
Calibration Procedures
7.6.1. AutoCal with Auto or Dual Reporting Ranges Modes
Selected
SETUP C.4
<SET
RANGE TO CAL: LOW
EDIT
SETUP C.4
EXIT
RANGE TO CAL: LOW
LOW HIGH
SETUP C.4
ENTR SETUP
RANGE TO CAL: HIGH
<SET
EDIT
EXIT
SETUP C.4
SEQ 2) ZERO–SPAN, 2:00:30
PREV NEXT MODE SET
EXIT
EXIT returns to the
PRIMARY SETUP
Menu
NOTE
In order to automatically calibrate both the HIGH and LOW ranges, you must set up a
separate sequence for each.
7.7. Calibration Quality
After completing one of the calibration procedures described above, it is important to evaluate the
analyzer’s calibration SLOPE and OFFSET parameters. These values describe the linear response
curve of the analyzer. The values for these terms, both individually and relative to each other,
indicate the quality of the calibration. To perform this quality evaluation, you will need to record
the values of both test functions (Section 6.2.1 or Appendix A-3), all of which are automatically
stored in the iDAS channel CALDAT for data analysis, documentation and archival.
Make sure that these parameters are within the limits listed in Table 7-3.
Table 7-3:
Calibration Data Quality Evaluation
FUNCTION
MINIMUM VALUE
OPTIMUM VALUE
MAXIMUM VALUE
SLOPE
0.700
1.000
1.300
OFFS
-0.500
0.000
0.500
These values should not be significantly different from the values recorded on the Teledyne
Instruments Final Test and Validation Data sheet that was shipped with your instrument. If
they are, refer to the troubleshooting Chapter 11.
User Notes
04584 Rev A1
142
Model GFC7000E Instruction Manual
EPA Protocol Calibration
8. EPA PROTOCOL CALIBRATION
At the writing of this manual there is no EPA requirements for the monitoring of CO2 or published
calibration protocols.
User Notes
04584 Rev A1
143
Model GFC7000E Instruction Manual
MAINTENANCE SCHEDULE & PROCEDURES
9. MAINTENANCE SCHEDULE & PROCEDURES
Predictive diagnostic functions including failure warnings and alarms built into the analyzer’s
firmware allow the user to determine when repairs are necessary without performing painstaking
preventative maintenance procedures. There are, however, a minimal number of simple
procedures that when performed regularly will ensure that the analyzer continues to operate
accurately and reliably over its the lifetime. Repairs and troubleshooting are covered in Chapter 11
of this manual.
9.1. Maintenance Schedule
Table 9-1 shows a typical maintenance schedule for the analyzer. Please note that in certain
environments (i.e. dusty, very high ambient pollutant levels) some maintenance procedures may
need to be performed more often than shown.
NOTE
A Span and Zero Calibration Check (see CAL CHECK REQ’D Column of Table 9-1) must be
performed following certain of the maintenance procedure listed below.
See Sections 7.3, 7.5 and 7.6 for instructions on performing checks.
CAUTION
Risk of electrical shock. Disconnect power before performing any of the
following operations that require entry into the interior of the analyzer.
NOTE
The operations outlined in this chapter are to be performed by qualified
maintenance personnel only.
04584 Rev A1
145
Model GFC7000E Instruction Manual
MAINTENANCE SCHEDULE & PROCEDURES
Table 9-1:
Item
Action
Freq
Cal
Check
Req’d.
Particulate
Filter
Replace
Weekly or as
needed
Yes
Verify Test
Functions
Record and
analyze
Weekly or
after any
Maintenance
or Repair
No
Pump
Diaphragm
Replace
Every 2
years
Yes
Perform
Flow Check
Check Flow
Every 6
Months
No
Perform
Leak Check
Verify Leak
Tight
Annually or
after any
Maintenance
or Repair
Yes
Pneumatic
lines
Examine
and clean
As needed
Yes if
cleaned
Cleaning
Clean
As needed
Only if
cover
remv’d
04584 Rev A1
GFC7000E Maintenance Schedule
Manual
Section
Date Performed
146
Model GFC7000E Instruction Manual
MAINTENANCE SCHEDULE & PROCEDURES
Table 9-2:
Operating
Mode*
Function
GFC7000E Test Function Record
Date Recorded
ZERO CAL
STABILITY
ZERO CAL
CO2 MEAS
Zero CAL
MR RATIO
SPAN CAL
SAMPLE
PRES
PHT DRIVE
SAMPLE After
SLOPE
OFFSET
04584 Rev A1
Warn-up
SPAN CAL
ZERO CAL
147
Model GFC7000E Instruction Manual
MAINTENANCE SCHEDULE & PROCEDURES
9.2. Predicting Failures Using the Test Functions
The Test Functions can be used to predict failures by looking at how their values change over
time. Initially it may be useful to compare the state of these Test Functions to the values recorded
on the printed record of the final calibration performed on your instrument at the factory, p/n
04307. Table 9-3 can be used as a basis for taking action as these values change with time. The
internal data acquisition system (iDAS) is a convenient way to record and track these changes.
Use APIcom to download and review this data from a remote location.
Table 9-3:
Function
Stability
CO2 MEAS
Condition
Zero Cal
Zero Cal
Predictive uses for Test Functions
Behavior
Increasing
Decreasing
Increasing
Zero Cal
Decreasing
MR Ratio
Increasing
Span Cal
Decreasing
Increasing > 1”
Pres
Sample
Decreasing > 1”
PHT Drive
Offset
Any, but with
Bench Temp
at 48°C
Zero Cal
Increasing
Increasing
Decreasing
Increasing
Slope
Span Cal
Decreasing
Interpretation
Pneumatic Leaks – instrument & sample
system
Detector deteriorating
Source Aging
Detector deteriorating
Optics getting dirty or contaminated
Source Aging
Detector deteriorating
Contaminated zero gas (H2O)
Source Aging
Detector deteriorating
GFC Wheel Leaking
Pneumatic Leaks
Contaminated zero gas (CO2)
Source Aging
Pneumatic Leaks – instrument & sample
system
Calibration system deteriorating
Source Aging
GFC Wheel Leaking
Calibration system deteriorating
Pneumatic Leak between sample inlet
and Sample Cell
Change in sampling manifold
Dirty particulate filter
Pneumatic obstruction between sample
inlet and Sample Cell
Obstruction in sampling manifold
Mechanical Connection between IRDetector and Sample Cell deteriorating
IR-Photodetector deteriorating
See MR Ratio - Zero Cal Decreasing
above
See MR Ratio - Zero Cal Increasing above
See MR Ratio - Span Cal Decreasing
above
See MR Ratio – Span Cal Increasing
above
9.3. Maintenance Procedures
The following procedures are to be performed periodically as part of the standard maintenance of
the Model GFC7000E.
04584 Rev A1
148
Model GFC7000E Instruction Manual
MAINTENANCE SCHEDULE & PROCEDURES
9.3.1. Replacing the Sample Particulate Filter
The particulate filter should be inspected often for signs of plugging or contamination. We
recommend that when you change the filter, handle it and the wetted surfaces of the filter
housing as little as possible. Do not touch any part of the housing, filter element, PTFE retaining
ring, glass cover and the o-ring.
To change the filter:
1. Turn OFF the analyzer to prevent drawing debris into the instrument.
2. Open the MGFC7000E’s hinged front panel and unscrew the knurled retaining ring on the filter
assembly.
Figure 9-1:
Sample Particulate Filter Assembly
3. Carefully remove the retaining ring, PTFE o-ring, glass filter cover and filter element.
4. Replace the filter, being careful that the element is fully seated and centered in the bottom of
the holder.
5. Re-install the PTFE o-ring with the notches up, the glass cover, then screw on the retaining
ring and hand tighten. Inspect the seal between the edge of filter and the o-ring to assure a
proper seal.
6. Re-start the Analyzer.
04584 Rev A1
149
Model GFC7000E Instruction Manual
MAINTENANCE SCHEDULE & PROCEDURES
9.3.2. Rebuilding the Sample Pump
The diaphragm in the sample pump periodically wears out and must be replaced. A sample
rebuild kit is available – see Appendix B of this manual for the part number of the pump rebuild
kit. Instructions and diagrams are included with the kit.
Always perform a Flow and Leak Check after rebuilding the Sample Pump.
9.3.3. Performing Leak Checks
Leaks are the most common cause of analyzer malfunction; Section 9.3.3.1 presents a simple leak
check procedure. Section 9.3.3.2 details a more thorough procedure.
9.3.3.1. Vacuum Leak Check and Pump Check
This method is easy and fast. It detects, but does not locate most leaks, it also verifies that the
sample pump is in good condition.
1. Turn the analyzer ON, and allow enough time for flows to stabilize.
2. Cap the sample inlet port.
3. After several minutes, when the pressures have stabilized, note the following. In the TEST
menu, note the SAMPLE PRESSURE reading.
4. If the reading is < 10 in-Hg, the pump is in good condition and there are no large leaks.
5. If both readings are equal within 10%, the instrument is free of large leaks.
9.3.3.2. Pressure Leak Check
If you can’t locate the leak by the above procedure, use the following procedure. Obtain a leak
checker similar to the Teledyne Instruments part number 01960, which contains a small pump,
shut-off valve, and pressure gauge. Alternatively, a convenient source of low-pressure gas is a
tank of span gas, with the two-stage regulator adjusted to less than 15 psi with a shutoff valve
and pressure gauge.
CAUTION
Do not use bubble solution with vacuum applied to the analyzer. The
solution may contaminate the instrument. Do not exceed 15 PSIG
pressure.
1. Turn OFF power to the instrument.
2. Install a leak checker or tank of gas as described above on the sample inlet at the rear panel.
3. Remove the instrument cover and locate the inlet side of the sample pump. Remove the flow
assembly from the pump and plug it with the appropriate gas-tight fitting.
04584 Rev A1
150
Model GFC7000E Instruction Manual
MAINTENANCE SCHEDULE & PROCEDURES
4. Pressurize the instrument with the leak checker, allowing enough time to fully pressurize the
instrument through the critical flow orifice. Check each fitting with soap bubble solution,
looking for bubbles. Once the fittings have been wetted with soap solution, do not re-apply
vacuum, as it will suck soap solution into the instrument and contaminate it. Do not exceed
15 psi pressure.
5. If the instrument has one of the zero and span valve options, the normally closed ports on
each valve should also be separately checked. Connect the leak checker to the normally closed
ports and check with soap bubble solution.
6. Once the leak has been located and repaired, the leak-down rate should be < 1 in-Hg (0.4 psi)
in 5 minutes after the pressure is shut off.
9.3.4. Performing a Sample Flow Check
CAUTION
Always use a separate calibrated flow meter capable of measuring flows
in the 0 – 1000 cc/min range to measure the gas flow rate though the
analyzer.
DO NOT use the built in flow measurement viewable from the Front Panel
of the instrument. This measurement is only for detecting major flow
interruptions such as clogged or plugged gas lines.
See Figure 3-2 for sample port location.
1. Turn off power.
2. Attach the Flow Meter to the sample inlet port on the rear panel. Ensure that the inlet to the
Flow Meter is at atmospheric f.
3. Turn on instrument power.
4. Sample flow should be 800 cc/min ± 10%.
5. Once an accurate measurement has been recorded by the method described above, adjust the
analyzer’s internal flow sensors (see Section 6.9.8)
Low flows indicate blockage somewhere in the pneumatic pathway. High flows indicate leaks
downstream of the Flow Control Assembly.
9.3.5. Cleaning the Optical Bench
The MGFC7000E sensor assembly and optical bench is complex and delicate. Disassembly and
cleaning is not recommended. Please check with the factory before disassembling the optical
bench.
9.3.6. Cleaning Exterior Surfaces of the MGFC7000E
If necessary, the exterior surfaces of the MGFC7000E can be cleaned with a clean damp cloth. Do
not submerge any part of the instrument in water or cleaning solution.
04584 Rev A1
151
Model GFC7000E Instruction Manual
MAINTENANCE SCHEDULE & PROCEDURES
User Notes
04584 Rev A1
152
Model GFC7000E Instruction Manual
THEORY OF OPERATION
10. THEORY OF OPERATION
The Model GFC7000E Gas Filter Correlation Carbon Dioxide Analyzer is a microprocessorcontrolled analyzer that determines the concentration of carbon dioxide (CO2) in a sample gas
drawn through the instrument. It requires that sample and calibration gasses be supplied at
ambient atmospheric pressure in order to establish a stable gas flow through the sample chamber
where the gases ability to absorb infrared radiation is measured.
Calibration of the instrument is performed in software and does not require physical adjustments
to the instrument. During calibration the microprocessor measures the current state of the IR
Sensor output and various other physical parameters of the instrument and stores them in
memory.
The microprocessor uses these calibration values, the ir absorption measurements made on the
sample gas along with data regarding the current temperature and pressure of the gas to
calculate a final co2 concentration.
This concentration value and the original information from which it was calculated are stored in
one of the unit’s internal data acquisition system (iDAS - see Sections 6.12) as well as reported to
the user via a vacuum florescent display or a variety of digital and analog signal outputs.
10.1. Measurement Method
10.1.1. Beer’s Law
The basic principle by which the analyzer works is called Beer’s Law. It defines the how light of a
specific wavelength is absorbed by a particular gas molecule over a certain distance. The
mathematical relationship between these three parameters is:
I = Io e-αLc
Where:
Io is the intensity of the light if there was no absorption.
I
is the intensity with absorption.
L is the absorption path, or the distance the light travels as it is being absorbed.
C is the concentration of the absorbing gas. In the case of the Model GFC7000E,
carbon dioxide (CO2).
α is the absorption coefficient that tells how well CO
2
absorbs light at the specific
wavelength of interest.
04584 Rev A1
153
Model GFC7000E Instruction Manual
THEORY OF OPERATION
10.1.2. Measurement Fundamentals
In the most basic terms, the Model GFC7000E uses a high energy heated element to generate a
beam of broad-band IR light with a known intensity (measured during Instrument calibration.
This beam is directed through multi-pass cell filled with sample gas. The sample cell uses mirrors
at each end to reflect the IR beam back and forth through the sample gas to generate a 2.5 meter
absorption path (see Figure 10–1). This length was chosen to give the analyzer maximum
sensitivity to fluctuations in CO2 density.
Band-Pass
Filter
Sample Chamber
IR
Source
Photo-Detector
IR Beam
Figure 10-1:
Measurement Fundamentals
Upon exiting the sample cell, the beam shines through a band-pass filter that allows only light at
a wavelength of 4.3 µm to pass. Finally, the beam strikes a solid-state photo-detector that
converts the light signal into a modulated voltage signal representing the attenuated intensity of
the beam.
10.1.3. Gas Filter Correlation
Unfortunately, water vapor absorbs light at 4.3 µm too. To overcome the interfering effects of
water vapor the Model GFC7000E adds another component to the IR light path called a gas filter
correlation (GFC) wheel (see Figure 10-2).
04584 Rev A1
154
Model GFC7000E Instruction Manual
THEORY OF OPERATION
Measurement
Cell
(Pure N2)
Reference Cell
(N2 with CO2)
Figure 10-2:
GFC Wheel
A GFC wheel is a metallic wheel into which two chambers are carved. The chambers are sealed on
both sides with material transparent to 4.3 µm IR radiation creating two airtight cavities. Each
cavity is filled with specially composed gases. One cell is filled with pure N2 (the measure cell).
The other is filled with a combination of N2 and a high concentration of CO2 (the reference cell).
IR unaffected by N2 in Measurement Cell
ΔH
IR IS affected by CO in Reference Cell
IR
Source
M
Photo-Detector
R
GFC Wheel
Figure 10-3:
Measurement Fundamentals with GFC Wheel
As the GFC wheel spins, the IR light alternately passes through the two cavities. When the beam
is exposed to the reference cell, the CO2 in the gas filter wheel strips the beam of most of the IR
at 4.3μm. When the light beam is exposed to the measurement cell, the N2 in the filter wheel
04584 Rev A1
155
Model GFC7000E Instruction Manual
THEORY OF OPERATION
does not absorb IR light. This results in a fluctuation in the intensity of the IR light striking the
photo-detector (See Figure 10-3) that results in the output of the detector resembling a square
wave.
The Model GFC7000E determines the amount of CO2 in the sample chamber by computing the
ratio between the peak of the measurement pulse (CO2 MEAS) and the peak of the reference
pulse (CO2 REF).
IR unaffected by N2 in Measurement
Cell of the GDC Wheel and no
additional CO2 in the Sample Chamber
CO2 MEAS
CO2 REF
IR affected by CO2 in Reference
Cell with no interfering gas in the
Sample Chamber
IR shinning through Measurement Cell
of the GDC Wheel is reduced by
additional CO2 in the Sample Chamber
M/R
is reduced
IR shining through Reference Cell
is also reduced by additional CO2
in the Sample Chamber, but to a
lesser extent
Figure 10-4:
Affect of CO2 in the Sample on CO2 MEAS & CO2 REF
If no gases exist in the sample chamber that absorb light at 4.3μm, the high concentration of CO2
in the gas mixture of the reference cell will attenuate the intensity of the IR beam by 60% giving
a M/R ratio of approximately 2.4:1.
Adding CO2 to the sample chamber causes the peaks corresponding to both cells to be attenuated
by a further percentage. Since the intensity of the light passing through the measurement cell is
greater, the effect of this additional attenuation is greater. This causes CO2 MEAS to be more
sensitive to the presence of CO2 in the sample chamber than CO2 REF and the ratio between
them (M/R) to move closer to 1:1 as the concentration of CO2 in the sample chamber increases.
Once the Model GFC7000E has computed this ratio, a look-up table is used, with interpolation, to
linearize the response of the instrument. This linearized concentration value is combined with
04584 Rev A1
156
Model GFC7000E Instruction Manual
THEORY OF OPERATION
calibration SLOPE and OFFSET values to produce the CO2 concentration which is then normalized
for changes in sample pressure.
M/R
is Shifted
IR shining through both cells is
effected equally by interfering gas
in the Sample Chamber
Figure 10-5:
Effects of Interfering Gas on CO2 MEAS & CO2 REF
If an interfering gas, such as H2O vapor is introduced into the sample chamber, the spectrum of
the IR beam is changed in a way that is identical for both the reference and the measurement
cells, but without changing the ratio between the peak heights of CO2 MEAS and CO2 REF. In
effect, the difference between the peak heights remains the same.
Thus, the difference in the peak heights and the resulting M/R ratio is only due to CO2 and not to
interfering gases. In this way, Gas filter correlation rejects the effects of interfering gases and so
that the analyzer responds only to the presence of CO2.
To improve the signal-to-noise performance of the IR photo-detector, the GFC wheel also
incorporates an optical mask that chops the IR beam into alternating pulses of light and dark at
six times the frequency of the measure/reference signal. This limits the detection bandwidth
helping to reject interfering signals from outside this bandwidth improving the signal to noise
ration.
The IR Signal as the Photo-Detector
sees it after being chopped by the GFC
Wheel Screen
CO MEAS
CO REF
Figure 10-6:
04584 Rev A1
Chopped IR Signal
157
Model GFC7000E Instruction Manual
THEORY OF OPERATION
10.1.4. Ambient CO2 Interference Rejection
CO2 absorbs IR light very well. So well that even the narrow volume of ambient air between the
IR source and the sample chamber is enough to alter the analyzer’s measured concentration of
CO2. Also, ambient air, which averages around 350 ppm to 400 ppm, will vary significantly over
the course of the day. The ambient CO2 concentration can rise as high as 1 000 ppm during the
time of the day when people are present. It can fluctuate ± 300 ppm as the photosynthesis of
plant life in the nearby area increases during the day and decreases at night.
The basic design of the GFC7000E rejects most of this interference at a 100:1 ratio, however this
still can allow small fluctuations in CO2 concentration during the course of the day. To completely
remove all effects of ambient CO2 from the analyzer’s measurement of CO2, dried air, scrubbed of
all CO2 is pumped into the GFC wheel housing to purge all ambient CO2 (see Figure 10-7)
10.2. Pneumatic Operation
Caution
It is important that the sample airflow system is both leak tight and
not pressurized over ambient pressure.
Regular leak checks should be performed on the analyzer as described
in the maintenance schedule, Table 9-1.
Procedures for correctly performing leak checks can be found in
Section 9.3.3.
An internal pump evacuates the sample chamber creating a small vacuum that draws sample gas
into the analyzer. Normally the analyzer is operated with its inlet near ambient pressure either
because the sample is directly drawn at the inlet or a small vent is installed at the inlet. There are
several advantages to this “pull through” configuration.
•
By placing the pump down stream from the sample chamber several problems are avoided.
•
First the pumping process heats and compresses the sample air complicating the
measurement process.
•
Additionally, certain physical parts of the pump itself are made of materials that might
chemically react with the sample gas.
•
Finally, in certain applications where the concentration of the target gas might be high
enough to be hazardous, maintaining a negative gas pressure relative to ambient means
that should a minor leak occur, no sample gas will be pumped into the atmosphere
surrounding analyzer.
04584 Rev A1
158
Model GFC7000E Instruction Manual
THEORY OF OPERATION
10.2.1. Sample Gas Flow
SAMPLE GAS
INLET
PUMP
EXHAUST GAS
OUTLET
Sample Gas Critical
Flow Orifice
INSTRUMENT CHASSIS
Purge Gas
Flow Rate
Control
Orifice
GFC Wheel
Motor
GFC Motor
Heat Sync
Purge Gas
Pressure
Control Assy
GFC Wheel
Housing
PURGE GAS
INLET
FLOW / PRESSURE
SENSOR PCA
FLOW
SENSOR
VENT SPAN
OUTLET
SAMPLE
PRESSURE
SENSOR
SAMPLE CHAMBER
PRESSURE
SPAN INLET
PARTICULATE
FILTER
IZS INLET
Figure 10-7:
Internal Pneumatic Flow – Basic Configuration
10.2.1.1. Critical Flow Orifice
The most important component of this flow control assembly is the critical flow orifice.
Critical flow orifices are a remarkably simple way to regulate stable gas flow rates. They operate
without moving parts by taking advantage of the laws of fluid dynamics. By restricting the flow of
gas though the orifice, a pressure differential is created. This pressure differential combined with
the action of the analyzer’s external pump draws the gas through the orifice.
As the pressure on the downstream side of the orifice (the pump side) continues to drop, the
speed that the gas flows though the orifice continues to rise. Once the ratio of upstream pressure
to downstream pressure is greater than 2:1, the velocity of the gas through the orifice reaches
the speed of sound. As long as that ratio stays at least 2:1 the gas flow rate is unaffected by any
fluctuations, surges, or changes in downstream pressure because such variations only travel at
the speed of sound themselves and are therefore cancelled out by the sonic shockwave at the
downstream exit of the critical flow orifice.
04584 Rev A1
159
Model GFC7000E Instruction Manual
THEORY OF OPERATION
CRITICAL
FLOW
ORIFICE
AREA OF
LOW
PRESSURE
AREA OF
HIGH
PRESSURE
Sonic
Shockwave
SPRING
Figure 10-8:
O-RINGS
FILTER
Flow Control Assembly & Critical Flow Orifice
The actual flow rate of gas through the orifice (volume of gas per unit of time), depends on the
size and shape of the aperture in the orifice. The larger the hole, the more gas molecules, moving
at the speed of sound, pass through the orifice. Also, because the flow rate of gas through the
orifice is only related to the minimum 2:1 pressure differential and not absolute pressure:
•
Pressure wave created by the pump’s action are filtered out.
•
The flow rate of gas through the sample chamber will be the same regardless of whether
the analyzer is at the bottom of Death Valley or on top of Pikes Peak.
•
The flow rate of the gas is also unaffected by degradations in pump efficiency due to age.
The critical flow orifice used in the Model GFC7000E is designed to provide a flow rate of 800
cm3/min.
10.2.1.2. Sample Pressure Sensor
An absolute value pressure transducer plumbed to the outlet of the sample chamber is used to
measure sample pressure. The output of the sensor is used to compensate the concentration
measurement for changes in air pressure. This sensor is mounted to a printed circuit board with
the sample flow sensor on the sample chamber; see following section and Figure 3-11.
10.2.1.3. Sample Flow Sensor
A thermal-mass flow sensor is used to measure the sample flow through the analyzer. The sensor
is calibrated at the factory with ambient air or N2, but can calibrated to operate with samples
consisting of other gases such as CO2, see Section 9.3.4. This sensor is mounted to a printed
circuit board with the Sample Pressure sensor on the sample chamber; see previous section and
Figure 3-11.
04584 Rev A1
160
Model GFC7000E Instruction Manual
THEORY OF OPERATION
Particulate Filter
The Model GFC7000E Analyzer comes equipped with a 47 mm diameter, Teflon, particulate filter
with a 5 micron pore size. The filter is accessible through the front panel, which folds down to
allow access, and should be changed according to the suggested maintenance schedule described
in Table 9-1.
10.2.1.4. Valve Options
A variety of optional valve sets can be purchased for the analyzer which allow the user to more
easily supply and manipulate various calibration gases, such as zero air and span gas during
various calibration procedures. For more information of these options see Section 5.4.
10.2.2. Purge Gas Pressure and Flow Control
In order to ensure that all of the ambient CO2 is purged from the GFC Wheel housing a adequate
supply of dried air, scrubbed of CO2 must be supplied to the PURGE AIR inlet at the back of the
instrument. The source of purge air must be capable of maintaining a pressure of 20-25 psig at a
flow rate of at least 0.5 liters/min. Purge source air pressure should not exceed 35 pisg.
In order to maintain the proper pressure differential between the inside of the GFC wheel housing
and ambient air, the M360 design includes a manually settable pressure regulator that maintains
the pressure of the purge air feed at 7.5 psig and a flow control orifice that ensures a 0.5 liter/min
flow though the GFC wheel housing.
10.3. Electronic Operation
10.3.1. Overview
Figure 10-9 shows a block diagram of the major electronic components of the Model GFC7000E.
At its heart the analyzer is a microcomputer (CPU) that controls various internal processes,
interprets data, makes calculations, and reports results using specialized firmware developed by
Teledyne Instruments. It communicates with the user as well as receives data from and issues
commands to a variety of peripheral devices via a separate printed circuit assembly called the
Mother Board.
The mother board collects data, performs signal conditioning duties and routs incoming and
outgoing signals between the cpu and the analyzer’s other major components.
Data is generated by a gas-filter-correlation optical bench which outputs an analog signal
corresponding to the concentration of CO2 in the sample gas. This analog signal is transformed
into two, pre-amplified, DC voltages (CO2 MEAS and CO2 REF) by a synchronous demodulator
printed circuit assembly. CO2 MEAS and CO2 REF are converted into digital data by a unipolar,
analog-to-digital converter, located on the mother board.
A variety of sensors report the physical and operational status of the analyzer’s major
components, again through the signal processing capabilities of the mother board. These status
reports are used as data for the CO2 concentration calculation and as trigger events for certain
control commands issued by the CPU. They are stored in memory by the CPU and in most cases
can be viewed but the user via the front panel display.
The CPU communicates with the user and the outside world in a variety of manners:
04584 Rev A1
161
Model GFC7000E Instruction Manual
THEORY OF OPERATION
•
Through the analyzer’s keyboard and vacuum florescent display over a clocked, digital,
serial I/O bus (using a protocol called I2C);
•
RS 232 & RS485 Serial I/O channels;
•
Via an optional Ethernet communications card:
•
Various DCV and DCA analog outputs, and
•
Several sets of Digital I/O channels.
Finally, the CPU issues commands via a series of relays and switches (also over the I2C bus)
located on a separate printed circuit assembly to control the function of key electromechanical
devices such as heaters, motors and valves.
A1
Back Panel
Connectors
Analog Outputs
Optional
4-20 mA
A2
Control Inputs:
1–8
A3
COM-A COM-B
Optional
Ethernet
Interface
Status Outputs:
1–8
Analog
Outputs
(D/A)
Power-Up
Circuit
External
Digital I/O)
A/D
Converter
(V/F)
MOTHER
BOARD
Flash Chip
PC 104 Bus
Internal
Digital I/O
SAMPLE
TEMP
BENCH
TEMP
WHEEL
TEMP
Disk On
Chip
RS – 232
Box
Temp
Thermistor
Interface
PC 104
CPU Card
RS–232
or RS-485
Sensor
Status
&
Control
Sensor Inputs
C
O2
C
O2
M
E
A
S
R
E
F
Zero/Span
Valve
Options
I2C
Bus
Sample
Flow &
Pressure
Sensors
Keyboard &
Display
TEC Control
SYNC
DEMOD
PHT
Drive
PUMP
RELAY
BOARD
CPU Status
LED
IR
Source
Photodetector
Detector
Output
Schmidt
Trigger
GFC
Wheel
Optical
Bench
Segment Sensor
M / R Sensor
Figure 10-9:
04584 Rev A1
GFC
Motor
Wheel
Heater
Bench Heater
GFC7000E Electronic Block Diagram
162
Model GFC7000E Instruction Manual
THEORY OF OPERATION
10.3.2. CPU
The Model GFC7000E’s CPU is a, low power (5 VDC, 0.8A max), high performance, 386-based
microcomputer running MS-DOS. Its operation and assembly conform to the PC/104 Specification
version 2.3 for embedded PC and PC/AT applications. It has 2 MB of DRAM on board and operates
at 40MHz over an internal 32-bit data and address bus. Chip to chip data handling is performed
by two 4-channel DMA devices over data busses of either 8-bit or 16-bit configuration. The CPU
supports both RS-232 and RS-485 serial I/O.
The CPU includes two types of non-volatile data storage.
Disk On Chip
While technically an EEPROM, the Disk –on-Chip (DOC), this device appears to the CPU as,
behaves as, and performs the same function in the system as an 8MB disk drive. It is used to
store the operating system for the computer, the Teledyne Instruments Firmware, and most of
the operational data generated by the analyzer’s internal data acquisition system (iDAS - see
Section 6.12).
Flash Chip
Another, smaller EEPROM used to store critical calibration and configuration data. Segregating
this data on a separate, less heavily accessed chip significantly decreases the chance of this key
data being corrupted.
10.3.3. Optical Bench & GFC Wheel
Electronically, the Model GFC7000E’s optical bench, GFC wheel and associated components do
more than simply measure the amount of CO2 present in the sample chamber. A variety of other
critical functions are performed here as well.
10.3.3.1. Sample Gas and GFC Temperature Control
Because the temperature of a gas affects its density and therefore the amount of light absorbed
by that gas it is important to reduce the effect of fluctuations in ambient temperature on the
Model GFC7000E’s measurement of CO2. To accomplish this both the temperature of the sample
chamber and the GFC Wheel are maintained at constant temperatures above their normal
operating ranges.
Bench Temperature : To minimize the effects of ambient temperature variations on the sample
measurement, the sample chamber is heated to 48°C (8 degrees above the maximum suggested
ambient operating temperature for the analyzer). A strip heater attached to the underside of the
chamber housing is the heat source. The temperature of the sample chamber is sensed by a
thermistor, also attached to the sample chamber housing.
Wheel Temperature: To minimize the effects of temperature variations caused by the near
proximity of the IR Source to the GFC wheel on the gases contained in the wheel, it is also raised
to a high temperature level. Because the IR Source itself is very hot, the set point for this heat
circuit is 68°C. A cartridge heater is implanted into the heat sync on the motor is the heat source.
The temperature of the wheel/motor assembly is sensed by a thermistor also inserted into the
heat sync.
Both heaters operate off of the AC line voltage supplied to the instrument.
04584 Rev A1
163
Model GFC7000E Instruction Manual
THEORY OF OPERATION
10.3.3.2. IR Source
The light used to detect CO2 in the sample chamber is generated by a element heated to
approximately 1100oC producing infrared radiation across a broad band. This radiation is optically
filtered after it has passed through the GFC Wheel and the sample chamber and just before it
reaches the photo-detector to eliminate all black body radiation and other extraneous IR emitted
by the various components of those components.
10.3.3.3. GFC Wheel
A synchronous AC motor turns the GFC wheel motor. For analyzers operating on 60Hz line power
this motor turns at 1800 rpm. For those operating on 50Hz line power the spin rate is 1500 rpm.
The actual spin rate is unimportant within a large rate since a phase lock loop circuit is used to
generate timing pulses for signal processing.
In order to accurately interpret the fluctuations of the IR beam after it has passed through the
sample gas, the GFC wheel several other timing signals are produced by other photo
emitters/detectors. These devices consist of a combination LED and detector mounted so that the
light emitted by the LED shines through the same mask on the GFC wheel that chops the IR
beam.
KEY:
Detection Beam shining
through MEASUREMENT
side of GFC Wheel
Detection Beam shining
through REFERENCE
side of GFC Wheel
IR Detection Ring
Segment Sensor Ring
M/R Sensor Ring
Figure 10-10: GFC Light Mask
M/R Sensor
The emitter/detector assembly that produces this signal shines through a portion of the mask that
allows light to pass for half of a full revolution of the wheel. The resulting light signal tells the
analyzer whether the IR beam is shining through the measurement or the reference side of the
GFC wheel.
Segment Sensor
This emitter/detector shines through a portion of the mask that is divided into the same number
of segments as the portion of the mask through which the IR beam passes. It is used by the
04584 Rev A1
164
Model GFC7000E Instruction Manual
THEORY OF OPERATION
synchronous / demodulation circuitry of the analyzer to latch onto the most stable part of each
measurement and reference IR pulse.
Reference
Pulses
Measurement
Pulses
IR Beam
Pulses
Segment Sensor
Pulses
MR Sensor
Pulses
Figure 10-11: Segment Sensor and M/R Sensor Output
Schmidt Triggers
To ensure that the waveforms produced by the Segment Sensor and the M/R Sensor are properly
shaped and clean, these signals are passed through a set of Schmidt Triggers circuits.
10.3.3.4. IR Photo-Detector
The IR beam is converted into an electrical signal by a cooled solid-state photo-conductive
detector The detector is composed of a narrow-band optical filter, a piece of lead-salt crystal
whose electrical resistance changes with temperature, and a two-stage thermo-electric cooler.
When the analyzer is on, a constant electrical current is directed through the detector, The IR
beam is focused onto the detector surface, raising its temperature and lowering its electrical
resistance that results in a change in the voltage drop across the detector.
During those times that the IR beam is bright, the temperature of the detector is high; the
resistance of the detector is correspondingly low and the its output voltage output is low. During
those times when the IR beam intensity is low or completely blocked by the GFC Wheel mask, the
temperature of the detector is lowered by the two-stage thermo-electric cooler, increasing the
detectors resistance and raising the output voltage.
10.3.4. Synchronous Demodulator (Sync/Demod) Assembly
10.3.4.1. Overview
While the photo-detector converts fluctuations of the IR beam into electronic signals, the Sync /
Demod Board amplifies these signals and converts them into usable information. Initially the
output by the photo-detector is a complex and continuously changing waveform made up of
Measure and Reference pulses. The sync/demod board demodulates this waveform and outputs
two analog DC voltage signals, corresponding to the peak values of these pulses. CO2 MEAS and
CO2 REF are converted into digital signals by circuitry on the Motherboard then used by the CPU
to calculate the CO2 concentration of the sample gas.
Additionally the synch/demod board contains circuitry that controls the photo-detector’s
thermoelectric cooler as well as circuitry for performing certain diagnostic tests on the analyzer.
04584 Rev A1
165
Model GFC7000E Instruction Manual
THEORY OF OPERATION
56V
Bias
CO2 MEAS
Photodetector
Sample
&
Hold
Circuits
Variable
Gain Amp
Dark
Switch
Pre
Amp
TEC Control
PHT DRIVE
E-Test
Generator
Signal
Conditioner
CO2 Reference
(x4)
Thermo-Electric
Cooler
Signal
Amplifiers
Conditioner
Control Circuit
E Test A Gate
E Test B Gate
Dark Test Gate
Compact
Programmable
Logic Device
Measure Gate
Measure Dark Gate
Reference Gate
Reference Dark Gate
Phase Lock Warning
M/R Sensor
Segment
From GFC
Wheel
Sensor
Segment Clock
X1 Reference
E Test Control
Dark Switch
Control
From CPU
via Mother
Board
x10
÷10
X10 Clock
Phase
Lock
Loop
Phase Lock
M/R
Status LED
Segment
Status LED
Figure 10-12: GFC7000E Sync / Demod Block Diagram
10.3.4.2. Signal Synchronization and Demodulation
The signal emitted by the IR photo-detector goes through several stages of amplification before it
can be accurately demodulated. The first is a pre-amplification stage that raises the signal to
levels readable by the rest of the synch/demod board circuitry. The second is a variable
amplification stage that is adjusted at the factory to compensate for performance variations of
mirrors, detectors, and other components of the optical bench from instrument to instrument.
The workhorses of the sync/demod board are the four sample-and-hold circuits that capture
various voltage levels found in the amplified detector signal needed to determine the value of CO2
MEAS and CO2 REF. They are activated by logic signals under the control of a compact
programmable logic device (PLD), which in turn responds to the output of the Segment Sensor
and M/R Sensor described in Figure 10–11.
04584 Rev A1
166
Model GFC7000E Instruction Manual
THEORY OF OPERATION
The four sample and hold circuits are:
DESIGNATION
ACTIVE WHEN:
IR BEAM PASSING THROUGH
SEGMENT SENSOR PULSE IS:
Measure Gate
MEASUREMENT cell of GFC Wheel
HIGH
Measure Dark Gate
MEASUREMENT Cell of GFC Wheel
LOW
Reference Gate
REFERENCE cell of GFC Wheel
HIGH
Reference Dark Gate
REFERENCE cell of GFC Wheel
LOW
Timing for activating the Sample and Hold circuits is provided by a phase lock loop circuit (PLL).
Using the segment sensor output as a reference signal the PLL generates clock signal at ten times
that frequency. This faster clock signal is used by the PLD to make the sample and hold circuits
capture the signal during the center portions of the detected waveform, ignore the rising and
falling edges of the detector signal.
Sample & Hold
Active
Detector
Output
Sample & Hold
Inactive
Figure 10-13: Sample & Hold Timing
10.3.4.3. Phase Lock Warning
In order to detect critical fault conditions such as a failure of either the segment sensor or the GFC
wheel motor, the synch/demod board also performs a simple check of the above signal
synchronization to make sure everything is operation. The PLD divides the X10 clock signal by ten
and sends this signal back to the PLL circuit which compares it to the original segment sensor
reference signal.
If these two signals match, the PLL sends a status level to the PLD that the phase lock is OK. If
for some reason the two signals do not match, the PLL alerts the PLD that phase lock has been
lost and the PLD issues a phase lock warning to the CPU. Should this occur, A SYNC warning will
appear on the analyzer’s front panel display (see Section 11.1.1 for more information).
10.3.4.4. Sync/Demod Status LED’s
The following two status LED’s located on the synch/demod board provide additional diagnostic
tools for checking the GFC wheel rotation.
04584 Rev A1
167
Model GFC7000E Instruction Manual
Table 10-1:
THEORY OF OPERATION
Sync/Demod Status LED Activity
LED
FUNCTION
STATUS OK
FAULT STATUS
D1
M/R Sensor Status
LED flashes approximately
2/second
LED is stuck
ON or OFF
D2
Segment Sensor
Status
LED flashes approximately
6/second
LED is stuck
ON or OFF
See Section 11.1.4 for more information.
10.3.4.5. Photo-Detector Temperature Control
The synch/demod board also contains circuitry that controls the IR photo-detector’s thermoelectric
coolers. A drive voltage, PHT DRIVE, is supplied to the coolers by the synch/demod board which
is adjusted by the synch/demod board based on a return signal called TEC control which alerts
informs the synch/demod board of the detector’s temperature. The warmer the detector, the
harder the coolers are driven.
PHT DRIVE is one of the Test Functions viewable by the user via the form panel. Press <TST or
TST> until it appears on the display.
10.3.4.6. Dark Calibration Switch
This switch initiates the Dark Calibration procedure. When initiated by the user (see Section 6.9.6
for more details), the dark calibration process opens this switch, interrupting the signal from the
IR photo-detector. This allows the analyzer to measure any offset caused by the synch/demod
board circuitry.
10.3.4.7. Electric Test Switch
When active this circuit generates a specific waveform intended to simulate the function of the IR
photo-detector but with a known set of value which is substituted for the detector’s actual signal
via the dark switch. It may also be initiated by the user (see Section 6.9.5 for more details).
10.3.5. Relay Board
By actuating various switches and relays located on this board, the CPU controls the status of
other key components. The relay board receives instructions in the form of digital signals over
the I2C bus, interprets these digital instructions and activates its various switches and relays
appropriately.
Heater Control
The two heaters attached to the sample chamber housing and the GFC wheel motor are controlled
by solid state relays located on the relay board.
The GFC wheel heater is simply turned on or off, however control of the bench heater also
includes circuitry that selects which one of its two separate heating elements is activated
depending on whether the instrument is running on 100 VAC, 115 VAC or 230 VAC line power.
04584 Rev A1
168
Model GFC7000E Instruction Manual
THEORY OF OPERATION
GFC Wheel Motor Control:
The GFC wheel operates from a AC voltage supplied by a multi-input transformer located on the
relay board. The step-down ratio of this transformer is controlled by factory-installed jumpers to
adjust for 100 VAC, 115 VAC or 230 VAC line power. Other circuitry slightly alters the phase of the
AC power supplied to the motor during start up based on whether line power is 50Hz or 60 Hz.
Normally, the GFC Wheel Motor is always turning while the analyzer is on. A physical switch
located on the relay board can be used to turn the motor off for certain diagnostic procedures.
Zero/Span Valve Options
Any zero/span/shutoff valve options installed in the analyzer are controlled by a set of electronic
switches located on the relay board. These switches, under CPU control, supply the +12VDC
needed to activate each valve’s solenoid.
IR Source
The Relay board supplies a constant 11.5VDC to the IR Source. Under normal operation the IR
source is always on.
10.3.5.1. Status LED’s
Eight LED’s are located on the analyzer’s relay board to show the current status on the various
control functions performed by the relay board (see Figure 10-14). They are:
Table 10-2:
Relay Board Status LED’s
LED
COLOR
FUNCTION
D1
RED
Watchdog Circuit
D2
YELLOW
Wheel Heater
HEATING
NOT HEATING
D3
YELLOW
Bench Heater
HEATING
NOT HEATING
D4
YELLOW
Spare
N/A
N/A
D5
GREEN
Sample/Cal Gas
Valve Option
Valve Open to CAL GAS
FLOW
Valve Open to SAMPLE GAS
FLOW
D6
GREEN
Zero/Span Gas
Valve Option
Valve Open to SPAN GAS
FLOW
Valve Open to ZERO GAS
FLOW
D7
GREEN
Shutoff Valve
Option
Valve Open to CAL GAS
FLOW
Valve CLOSED to CAL GAS
FLOW
D8
GREEN
IR SOURCE
Source ON
Source OFF
04584 Rev A1
STATUS WHEN LIT
STATUS WHEN UNLIT
Cycles On/Off Every 3 Seconds under direct control of the
analyzer’s CPU.
169
Model GFC7000E Instruction Manual
THEORY OF OPERATION
DC VOLTAGE TEST
POINTS
STATUS LED’s
RELAY PCA
PN 04135
Figure 10-14: Location of relay board Status LED’s
10.3.5.2. I2C Watch Dog Circuitry
Special circuitry on the relay board monitors the activity on the I2C bus and drives LED D1.
Should this LED ever stay ON or OFF for 30 seconds, the watchdog circuit will automatically shut
of all valves as well as turn off the IR Source and all heaters. The GFC wheel motor will still be
running as will the Sample Pump, which is not controlled by the relay board.
10.3.6. Mother Board
This printed circuit assembly provides a multitude of functions including, A/D conversion, digital
input/output, PC-104 to I2C translation, temperature sensor signal processing and is a pass
through for the RS-232 and RS-485 signals.
10.3.6.1. A to D Conversion
Analog signals, such as the voltages received from the analyzer’s various sensors, are converted
into digital signals that the CPU can understand and manipulate by the analog to digital converter
(A/D). Under the control of the CPU, this functional block selects a particular signal input (e.g.
BOX TEMP, CO2 MEAS, CO2 REF, etc.) and then coverts the selected voltage into a digital word.
The A/D consists of a voltage-to-frequency (V-F) converter, a programmable logic device (PLD),
three multiplexers, several amplifiers and some other associated devices. The V-F converter
produces a frequency proportional to its input voltage. The PLD counts the output of the V-F
during a specified time period, and sends the result of that count, in the form of a binary number,
to the CPU.
The A/D can be configured for several different input modes and ranges but in the MGFC7000E is
used in uni-polar mode with a +5 V full scale. The converter includes a 1% over and underrange. This allows signals from –0.05 V to +5.05 V to be fully converted.
04584 Rev A1
170
Model GFC7000E Instruction Manual
THEORY OF OPERATION
For calibration purposes, two reference voltages are supplied to the A/D converter: Reference
Ground and +4.096 VDC. During calibration, the device measures these two voltages, outputs
their digital equivalent to the CPU. The CPU uses these values to compute the converter’s offset
and slope and uses these factors for subsequent conversions.
See Section 6.9.4 for instructions on performing this calibration.
10.3.6.2. Sensor Inputs
The key analog sensor signals are coupled to the A/D through the master multiplexer from two
connectors on the motherboard. 100K terminating resistors on each of the inputs prevent cross
talk from appearing on the sensor signals.
Co2 Measure And Reference
These are the primary signals that are used in the computation of the CO2 concentration. They
are the demodulated IR-sensor signals from the sync demodulator board.
Sample Pressure And Flow
These are analog signals from two sensors that measure the pressure and flow rate of the gas
stream at the outlet of the sample chamber. This information is used in two ways. First, the
sample pressure is used by the CPU to calculate CO2 Concentration. Second, the pressure and
flow rate are monitored as a test function to assist the user in predicting and troubleshooting
failures.
10.3.6.3. Thermistor Interface
This circuit provides excitation, termination and signal selection for several negative-coefficient,
thermistor temperature sensors located inside the analyzer. They are:
Sample Temperature Sensor
The source of this signal is a thermistor located inside the sample chamber of the Optical Bench.
It measures the temperature of the sample gas in the chamber. This data is used to during the
calculation of the CO2 concentration value.
Bench Temperature Sensor
This thermistor, attached to the sample chamber housing, reports the current temperature of the
chamber housing to the CPU as part of the bench heater control loop.
Wheel Temperature Sensor
This thermistor attached a the heat-sync on the GFC wheel motor assembly reports the current
temperature of the wheel/motor assembly to the cpu as part of the Wheel Heater control loop.
Box Temperature Sensor
A thermistor is attached to the mother board. It measures the analyzer’s inside temperature.
This information is stored by the CPU and can be viewed by the user for troubleshooting purposes
via the front panel display (see Section 11.1.2).
04584 Rev A1
171
Model GFC7000E Instruction Manual
THEORY OF OPERATION
10.3.6.4. Analog Outputs
The analyzer comes equipped with four analog outputs: A1, A2, A3 and a fourth that is a spare.
A2 and A1 Output
The first two, A2 and A1 are normally set up to operate in parallel so that the same data can be
sent to two different recording devices. While the names imply that one should be used for
sending data to a chart recorder and the other for interfacing with a datalogger, either can be
used for both applications.
Both of these channels output a signal that is proportional to the CO2 concentration of the sample
gas. The A1 and A2 outputs can be slaved together or set up to operated independently. A variety
of scaling factors are available, See Section 6.9.4 for information on setting the range type and
scaling factors for these output channels.
A3 Output
The third analog output, labeled A3 is special. It can be set by the user (see Section 6.9.9) to
carry the current signal level of any one of the parameters accessible through the A3 menu of the
unit’s software.
Spare Output
The fourth analog output, termed SPARE is not used in the MGFC7000E.
In its standard configuration, the analyzer comes with all four of these channels set up to output a
DC voltage. However, 4-20mA current loop drivers can be purchased for the first three of these
outputs: A2, A2 & A3.
Output Loop-back
All four analog outputs are connected back to the A/D converter through a Loop-back circuit. This
permits the voltage outputs to be calibrated by the CPU without need for any additional tools or
fixtures.
10.3.6.5. Internal Digital I/O
This channel is used to communicate digital status and control signals about the operation of key
components of the Optical Bench. The CPU sends signals to the synch/demod board that initiate
the ELECTRICAL TEST and DARK CALIBRATION procedures. Likewise, the synch/demod board
uses this interface to send the SYNC warning signal to the CPU (see Sections 6.9.5, 6.9.6 and
11.1.1).
04584 Rev A1
172
Model GFC7000E Instruction Manual
THEORY OF OPERATION
10.3.6.6. External Digital I/O
This External Digital I/O performs two functions.
Status Outputs
Logic-Level voltages are output through an optically isolated 8-pin connector located on the rear
panel of the analyzer. These outputs convey good/bad and on/off information about certain
analyzer conditions. They can be used to interface with certain types of programmable devices
(see Section 6.13.1.1).
Control Inputs
By applying +5VDC power supplied from an external source such as a PLC or Datalogger (see
Section 6.13.1.2), Zero and Span calibrations can be initiated by contact closures on the rear
panel.
10.3.7. I2C Data Bus
An I2C data bus is used to communicate data and commands between the cpu and the
keyboard/display interface and the relay board. I2C is a two-wire, clocked, digital serial i/o bus
that is used widely in commercial and consumer electronic systems. A transceiver on the
motherboard converts data and control signals from the PC-104 bus to I2C. The data is then fed
to the keyboard/display interface and finally onto the relay board.
Interface circuits on the keyboard/display interface and relay boards convert the i2c data to
parallel inputs and outputs. An additional, interrupt line from the keyboard to the motherboard
allows the CPU to recognize and service key presses on the keyboard.
Power up Circuit
This circuit monitors the +5V power supply during start-up and sets the Analog outputs, external
digital I/O ports, and I2C circuitry to specific values until the CPU boots and the instrument
software can establish control.
10.3.8. Power Supply/ Circuit Breaker
The analyzer operates on 100 VAC, 115 VAC or 230 VAC power at either 50Hz or 60Hz. Individual
units are set up at the factory to accept any combination of these five attributes. As illustrated in
Figure 10-15, power enters the analyzer through a standard IEC 320 power receptacle located on
the rear panel of the instrument. From there it is routed through the On/Off switch located in the
lower right corner of the Front Panel. A 6.75 Amp circuit breaker is built into the ON/OFF Switch.
AC power is distributed directly to the sample gas pump. The bench and GFC wheel heaters as
well as the GFC wheel receive AC power via the relay board.
AC Line power is converted stepped down and converted to DC power by two DC power supplies.
One supplies +12 VDC, for valves and the IR source, while a second supply provides +5 VDC and
±15 VDC for logic and analog circuitry. All DC voltages are distributed via the relay board.
04584 Rev A1
173
Model GFC7000E Instruction Manual
THEORY OF OPERATION
CAUTION
Should the AC power circuit breaker trip, investigate and correct the
condition causing this situation before turning the analyzer back on.
ON/OFF
SWITCH
AC POWER
ENTRANCE
Pressure
Sensors
Display
Keypad
PS 1 (+5 VDC; ±15 VDC)
CPU
RELAY
BOARD
Mother
Board
KEY
AC POWER
PS 2 (+12 VDC)
Sync/Demod
DC POWER
IR Source
Cooling Fan
Pump
M/R &
Segment
Sensors
Valve
Options
Heaters
GFC
Wheel
Motor
Figure 10-15: Power Distribution Block Diagram
10.4. Interface
The analyzer has several ways to communicate the outside world, see Figure 10-16. Users can
input data and receive information directly via the Front panel keypad and display. Direct
communication with the CPU is also available by way of the analyzer’s RS232 & RS485 I/O ports
or an optional Ethernet port. The analyzer can also send and receive different kinds of information
via its external digital I/O connectors and the three analog outputs located on the rear panel.
04584 Rev A1
174
Model GFC7000E Instruction Manual
COMM A
Male
RS–232 ONLY
RS-232 or RS–485
COMM B
Female
ETHERNET
OPTION
THEORY OF OPERATION
Control Inputs:
1–6
Status Outputs:
1–8
A1
A2
CPU
Mother
Board
PC/104 BUS
Analog Outputs
KEYBOARD
Optional
4-20 mA
I2C BUS
A3
I2C BUS
A4ST
FRONT PANEL DISPLAY
RELAY
BOARD
Figure 10-16: Interface Block Diagram
10.4.1. Front Panel Interface
MODE FIELD
MESSAGE FIELD
LOCKING SCREW
CONCENTRATION FIELD
STATUS LED’s
FASTENER
FASTENER
SAMPLE A
<TST
RANGE = 500.0 PPM
TST> CAL
SAMPLE
CO2 = 400.0
CAL
SETUP
FAULT
POWER
GAS FILTER CORRELATION CO2 ANALYZER- MODEL GFC7000E
KEY DEFINITIONS KEYBOARD
ON / OFF SWITCH
Figure 10-17: GFC7000E Front Panel Layout
The most commonly used method for communicating with the MGFC7000E Analyzer is via the
instrument’s front panel which includes a set of three status LEDs, a vacuum florescent display
and a keyboard with 8 context sensitive keys.
10.4.1.1. Analyzer Status LED’s
Three LEDS are used to inform the user of the instruments basic operating status
04584 Rev A1
175
Model GFC7000E Instruction Manual
Table 10-3:
THEORY OF OPERATION
Front Panel Status LED’s
NAME
COLOR
STATE
DEFINITION
SAMPLE
Green
Off
On
Blinking
Unit is not operating in sample mode, iDAS is disabled.
Sample Mode active; Front Panel Display being updated, iDAS data being stored.
Unit is operating in sample mode, front panel display being updated, iDAS hold-off
mode is ON, iDAS disabled
CAL
Yellow
Off
On
Blinking
Auto Cal disabled
Auto Cal enabled
Unit is in calibration mode
FAULT
Red
Off
Blinking
CO2 warnings exist
Warnings exist
10.4.1.2. Keyboard
A row of eight keys just below the vacuum florescent display (see Figure 10-17) is the main
method by which the user interacts with the analyzer. As the software is operated, labels appear
on the bottom row of the display directly above each active key, defining the function of that key
as it is relevant for the operation being performed. Pressing a key causes the associated
instruction to be performed by the analyzer.
Note that the keys do not auto-repeat. In circumstances where the same key must be activated
for two consecutive operations, it must be released and re-pressed.
10.4.1.3. Display
The main display of the analyzer is a vacuum florescent display with two lines of 40 text
characters each. Information is organized in the following manner (see Figure 10-17):
Mode Field: Displays the name of the analyzer’s current operating mode.
Message Field: Displays a variety of informational messages such as warning messages, operation
data and response messages during interactive tasks.
Concentration Field: Displays the actual concentration of the sample gas currently being measured
by the analyzer
Keypad Definition Field: Displays the definitions for the row of keys just below the display. These
definitions dynamic, context sensitive and software driven.
04584 Rev A1
176
Model GFC7000E Instruction Manual
THEORY OF OPERATION
Serial
Data
Display Power
Watchdog
Clock
I2C Interface
Display
Controller
Display Write
Display Data
Decoder
Parallel Data
Keypad
Decoder
I2C to Relay Board
I2C to/from CPU
Key Press
Detect
Keyboard Interrupt Status Bit
10.4.1.4. Keyboard/Display Interface Electronics
From 5 VDC
Power Supply
Sample LED
(Green)
Cal LED
(Yellow)
Maint.
Switch
2nd Lang.
Switch
2 x 40 CHAR. VACUUM
FLUORESCENT DISPLAY
Fault LED
(Red)
KEYBOARD
Optional
Maintenance
LED
Beeper
FRONT PANEL
Figure 10-18: Keyboard and Display Interface Block Diagram
The keyboard/display interface electronics of the MGFC7000E Analyzer watches the status of the
eight front panel keys, alerts the CPU when keys are depressed, translates data from parallel to
serial and back and manages communications between the keyboard, the CPU and the front panel
display. Except for the Keyboard interrupt status bit, all communication between the CPU and the
keyboard/display is handle by way of the instrument’s I2C buss. The CPU controls the clock signal
and determines when the various devices on the bus are allowed to talk or required to listen. Data
packets are labeled with addresses that identify for which device the information is intended.
Keypad Decoder
Each key on the front panel communicates with a decoder IC via a separate analog line. When a
key is depressed the decoder chip notices the change of state of the associated signal; latches and
holds the state of all eight lines (in effect creating an 8-bit data word); alerts the key-depressdetect circuit (a flip-flop IC); translates the 8-bit word into serial data and; sends this to the I2C
interface chip.
Key-Depress-Detect Circuit
This circuit flips the state of one of the inputs to the I2C interface chip causing it to send an
interrupt signal to the CPU
I2C Interface Chip
04584 Rev A1
177
Model GFC7000E Instruction Manual
THEORY OF OPERATION
This IC performs several functions:
•
Using a dedicated digital status bit, it sends an interrupt signal alerting the CPU that new
data from the keyboard is ready to send.
•
Upon acknowledgement by the CPU that it has received the new keyboard data, the I2C
interface chip resets the key-depress-detect flip-flop.
•
In response to commands from the CPU, it turns the front panel status LEDs on and off and
activates the beeper.
•
Informs the CPU when the optional maintenance and second language switches have been
opened or closed (see Chapter 5 for information on these options).
Display Data Decoder
This decoder the serial translates the data sent by the CPU (in TTY format) into a bitmapped
image which is sent over a parallel data bus to the display.
Display Controller
This circuit manages the interactions between the display data decoder and the display itself. It
generates a clock pulse that keeps the two devices synchronized. It can also, in response to
commands from the CPU turn off and/or reset the display.
Additionally, for analyzers with the optional maintenance switch is installed (See Chapter 5), the
display controller turns on an LED located on the back of the keyboard interface PCA whenever
the instrument is placed in maintenance mode.
Display Power Watchdog
The Model GFC7000E’s display can begin to show garbled information or lock-up if the DC voltage
supplied to it falls too low, even momentarily. To alleviate this, a brown-out watchdog circuit
monitors the level of the power supply and in the event that the voltage level falls below a certain
level, turns the display off, then on resetting it
I2C Link To The Relay PCA
While the CPU’s I2C communication with the relay board is also routed through the
keyboard/display interface, information passed to and from the relay board via this channel is not
recognized by, acted upon or affected by the circuitry of the keyboard/display interface.
10.5. Software Operation
The Model GFC7000E Gas Filter Correlation Carbon Dioxide Analyzer is at its heart a high
performance, 386-based microcomputer running MS-DOS. Inside the DOS shell, special software
developed by Teledyne Instruments interprets user commands via the various interfaces,
performs procedures and tasks, stores data in the CPU’s various memory devices and calculates
the concentration of the sample gas.
04584 Rev A1
178
Model GFC7000E Instruction Manual
THEORY OF OPERATION
DOS Shell
AI FIRMWARE
Memory Handling
IDAS Records
Calibration Data
System Status Data
Analyzer Operations
Calibration Procedures
Configuration Procedures
Autonomic Systems
Diagnostic Routines
PC/104 BUS
ANALYZER
HARDWARE
Interface Handling
Measurement
Algorithm
Sensor input Data
Display Messages
Keypad
Analog Output Data
RS232 & RS485
External Digital I/O
PC/104 BUS
Linearization Table
Figure 10-19: Basic Software Operation
10.5.1. Adaptive Filter
The MGFC7000E software processes the CO2 MEAS and CO2 REF signals, after they are
digitized by the motherboard, through an adaptive filter built into the software. Unlike other
analyzers that average the output signal over a fixed time period, the MGFC7000E averages over
a set number of samples, where each sample is 0.2 seconds. This is technique is known as
boxcar averaging. During operation, the software automatically switches between two different
length filters based on the conditions at hand. Once triggered, the short filter remains engaged
for a fixed time period to prevent chattering.
During conditions of constant or nearly constant concentration the software, by default, computes
an average of the last 750 samples, or approximately 150 seconds. This provides the calculation
portion of the software with smooth stable readings. If a rapid change in concentration is detected
the filter includes, by default, the last 48 samples, approximately 10 seconds of data, to allow the
analyzer to more quickly respond. If necessary, these boxcar lengths can be changed between 1
and 1000 samples but with corresponding tradeoffs in rise time and signal-to-noise ratio (contact
customer service for more information).
Two conditions must be simultaneously met to switch to the short filter. First the instantaneous
concentration must exceed the average in the long filter by a fixed amount. Second the
instantaneous concentration must exceed the average in the long filter by a portion, or
percentage, of the average in the long filter.
10.5.2. Calibration - Slope and Offset
Calibration of the analyzer is performed exclusively in software.
04584 Rev A1
179
Model GFC7000E Instruction Manual
THEORY OF OPERATION
During instrument calibration (see Chapter 7) the user enters expected values for zero and span
via the front panel keypad and commands the instrument to make readings of calibrated sample
gases for both levels. The readings taken are adjusted, linearized, and compared to the expected
values, With this information the software computes values for instrument slope and offset and
stores these values in memory for use in calculating the CO2 concentration of the sample gas.
The instrument slope and offset values recorded during the last calibration can be viewed by
pressing the following keystroke sequence:
SAMPLE
RANGE = 50.0 MGM
< TST TST > CAL
CO =XX.XX
SETUP
SAMPLE
SAMPLE
TIME = 16:23:34
< TST TST > CAL
CO =XX.XX
OFFSET = 0.000
< TST TST > CAL
CO =XX.XX
SETUP
SETUP
SAMPLE
SLOPE = 1.000
< TST TST > CAL
CO =XX.XX
SETUP
10.5.3. Measurement Algorithm
Once the IR photo-detector is signal is demodulated into CO2 MEAS and CO2 REF by the
sync/demod board and converted to digital data by the mother board the MGFC7000E analytical
software calculates the ratio between CO2 MEAS and CO2 REF. this value is compared to a lookup table is used, with interpolation, to linearize the response of the instrument. The linearized
concentration value is combined with calibration slope and offset values, then normalized for
changes in sample gas pressure to produce the final CO2 concentration. This is the value that is
displayed on the instrument front panel display and is stored in memory by the analyzer’s iDAS
system.
10.5.4. Temperature and Pressure Compensation
Changes in pressure can have a noticeable, effect on the CO2 concentration calculation. To
account for this, the Model GFC7000E software includes a feature which allows the instrument to
compensation of the CO2 calculations based on changes in ambient pressure.
The TPC feature multiplies the analyzer’s CO2 concentration by a factor which is based on the
difference between the ambient pressure of the sample gas normalized to standard atmospheric
pressure. As ambient pressure increases, the compensated CO2 concentration is increased.
10.5.5. Internal Data Acquisition System (iDAS)
The iDAS is designed to implement predictive diagnostics that stores trending data for users to
anticipate when an instrument will require service. Large amounts of data can be stored in nonvolatile memory and retrieved in plain text format for further processing with common data
analysis programs. The iDAS has a consistent user interface in all Teledyne Instruments
analyzers. New data parameters and triggering events can be added to the instrument as needed.
04584 Rev A1
180
Model GFC7000E Instruction Manual
THEORY OF OPERATION
Depending on the sampling frequency and the number of data parameters the iDAS can store
several months of data, which are retained even when the instrument is powered off or a new
firmware is installed. The iDAS permits users to access the data through the instrument’s front
panel or the remote interface. The latter can automatically download stored data for further
processing. For information on using the iDAS, refer to Sections 6.12.
User Notes
04584 Rev A1
181
Model GFC7000E Instruction Manual
TROUBLESHOOTING & REPAIR PROCEDURES
11. TROUBLESHOOTING & REPAIR PROCEDURES
This section contains a variety of methods for identifying the source of performance problems with
the analyzer. Also included in this section are procedures that are used in repairing the
instrument.
CAUTION
The operations outlined in this chapter are to be performed by qualified
maintenance personnel only.
CAUTION
Risk of electrical shock. Disconnect power before performing the
following operations.
11.1. General Troubleshooting Hints
The analyzer has been designed so that problems can be rapidly detected, evaluated and
repaired. During operation, the analyzer continuously performs self-check diagnostics and
provides the ability to monitor the key operating parameters of the instrument without disturbing
monitoring operations.
A systematic approach to troubleshooting will generally consist of the following four steps:
1. Note any WARNING MESSAGES and take corrective action as required.
2. Examine the values of all TEST functions and compare to factory values. Note any major
deviations from the factory values and take correction action as required.
3. Use the internal electronic status LED’s to determine whether the CPU and I2C buses are
running, and if the sync/demodulator and relay board are operating properly. Verify that the
DC power supplies are operating properly by checking the voltage test points on the relay
board. Please note that the analyzer’s DC power wiring is color-coded and these colors match
the color of the corresponding test points on the relay board.
4. SUSPECT A LEAK FIRST! Data from Teledyne Instruments’ service department indicates
that 50% of all problems are eventually traced to leaks in the pneumatic connections and gas
lines of the analyzer itself, the source of zero air, span gases or sample gas delivery system.
Check for gas flow problems such as clogged or blocked internal/external gas lines, damaged
seals, punctured gas lines, a damaged pump diaphragm, etc.
5. Follow the procedures defined in Section 11.4 for confirming that the analyzer’s basic
components are working (power supplies, CPU, relay board, sync/demod board, keypad, GFC
wheel motor, etc.). See Figure 3-11 for general layout of components and sub-assemblies in
the analyzer. See the wiring Interconnect Drawing and Interconnect List, documents 04216
and 04217.
04584 Rev A1
183
Model GFC7000E Instruction Manual
TROUBLESHOOTING & REPAIR PROCEDURES
11.1.1. Interpreting WARNING Messages
The most common and/or serious instrument failures will result in a warning message being
displayed on the front panel. Table 11-1 lists warning messages, along with their meaning and
recommended corrective action.
It should be noted that if more than two or three warning messages occur at the same time, it is
often an indication that some fundamental analyzer sub-system (power supply, relay board,
motherboard) has failed rather than indication of the of the specific failures referenced by the
warnings. In this case, it is recommended that proper operation of power supplies (see Section
11.4.2), the relay board (see Section 11.4.5), and the A/D Board (see Section11.4.7.1) be
confirmed before addressing the specific warning messages.
The analyzer will alert the user that a Warning Message is active by displaying the keypad label
MSG on the Front Panel. In this case the Front panel display will look something like the
following:
SAMPLE
RANGE=500.0 PPM
<TST TST>
CO2 = 00.00
MSG
CAL
CLR SETUP
The analyzer will also alert the user via the Serial I/O COM port(s) and cause the FAULT LED on
the front panel to blink.
To view or clear the various warning messages press:
TEST deactivates Warning
Messages until New warning(s)
are activated
SAMPLE
TEST
WHEEL TEMP WARNING
CAL
SAMPLE
RANGE=500.00 PPM
< TST TST > CAL
SAMPLE
MSG
WHEEL TEMP WARNING
< TST TST > CAL
Make sure warning messages
are not due to
legitimate problems..
Figure 11-1:
MSG
MSG
CO2 = XX.XX
CLR
SETUP
CO2 = XX.XX
CLR
SETUP
MSG activates Warning
Messages.
<TST TST> keys replaced with
TEST key
CO2 = XX.XX
CLR
SETUP
Press CLR to clear the
message currently being
Displayed.
If more than one warning is
active the next message will
take its place
Once the last warning has been
cleared, the analyzer returns to
SAMPLE Mode
Viewing and Clearing Warning Messages
NOTE: A failure of the analyzer’s CPU or mother board can result in any or all of the following
messages.
04584 Rev A1
184
Model GFC7000E Instruction Manual
Table 11-1:
WARNING
MESSAGE
BENCH TEMP
WARNING
Warning Messages - Indicated Failures
FAULT CONDITION
The optical bench temp
is controlled at 48 ± 5
°
C.
BOX TEMP
WARNING
Box Temp is < 5 °C or
> 48 °C.
CANNOT DYN
SPAN
CANNOT DYN
ZERO
CONFIG
INITIALIZED
Dynamic Span
operation failed
Dynamic Zero
operation failed
Configuration and
Calibration data reset
to original Factory
state.
Concentration alarm 1
is enabled and the
measured CO2 level is
≥ the set point.
Concentration alarm 2
is enabled and the
measured CO2 level is
≥ the set point.
Data Storage in iDAS
was erased
The CPU is unable to
Communicate with the
Front Panel Display
/Keyboard
CONC ALRM1
WARNING
CONC ALRM2
WARNING
DATA
INITIALIZED
FRONT PANEL
WARN
PHOTO TEMP
WARNING
PHT DRIVE is >2500
mVDC
REAR BOARD
NOT DET
Mother Board not
detected on power up.
RELAY BOARD
WARN
The CPU cannot
communicate with the
Relay Board.
SAMPLE FLOW
WARN
Sample flow rate is <
500 cc/min or > 1000
cc/min.
04584 Rev A1
TROUBLESHOOTING & REPAIR PROCEDURES
POSSIBLE CAUSES
Bad bench heater
Bad bench temperature sensor
Bad relay controlling the bench heater
Entire relay board is malfunctioning
I2C buss malfunction
NOTE: Box temperature typically runs ~7oc warmer than
ambient temperature.
Poor/blocked ventilation to the analyzer.
Stopped exhaust-fan
Ambient temperature outside of specified range
Measured concentration value is too high or low.
Concentration slope value to high or too low
Measured concentration value is too high.
Concentration offset value to high.
Failed disk on chip
User erased data
Failed disk on chip
User cleared data
Warning only appears on serial I/O com port(s)
Front panel display will be frozen, blank or will not respond.
Failed keyboard
I2C buss failure
Loose connector/wiring
Failed IR photo-detector
Failed sync/demod board
IR photo-detector improperly attached to the sample
chamber
Bench temp too high.
Warning only appears on serial i/o com port(s)
Front panel display will be frozen, blank or will not respond.
Massive failure of mother board
I2C buss failure
Failed relay board
Loose connectors/wiring
Failed sample pump
Blocked sample inlet/gas line
Dirty particulate filter
Leak downstream of critical flow orifice
Failed flow sensor/circuitry
185
Model GFC7000E Instruction Manual
Table 11-1:
WARNING
MESSAGE
SAMPLE PRES
WARN
SAMPLE TEMP
WARN
SOURCE
WARNING
Warning Messages – Indicated Failures (cont.)
FAULT CONDITION
Sample Pressure is
<10 in-Hg or
> 35 in-Hg
Normally 29.92 in-Hg
at sea level decreasing
at 1 in-Hg per 1000 ft
of altitude (with no
flow – pump
disconnected).
Sample temperature is
< 10oC or > 100oC.
Occurs when CO2 Ref
is <1250 mVDC or
>4950 mVDC.
Either of these
conditions will result in
an invalid M/R ratio.
SYNC WARNING
SYSTEM RESET
WHEEL TEMP
WARNING
TROUBLESHOOTING & REPAIR PROCEDURES
Phase Lock Loop (PLL)
has lost lock on wheel
rotation.
The computer has
rebooted.
The filter wheel
temperature is
controlled at 68 ± 5 °C
POSSIBLE CAUSES
If sample pressure is < 10 in-hg:
o Blocked particulate filter
o Blocked sample inlet/gas line
o Failed pressure sensor/circuitry
If sample pressure is > 35 in-hg:
o Blocked vent line on pressurized sample/zero/span gas
supply
o Bad pressure sensor/circuitry
Ambient temperature outside of specified range
Failed bench heater
Failed bench temperature sensor
Relay controlling the bench heater
Failed relay board
I2C buss
GFC wheel stopped
Failed sync/demod board
If status LED’s on the sync/demod board ARE flashing the
cause is most likely a failed:
IR source
Relay board
I2C buss
IR photo-detector
GFC wheel stopped
GFC wheel rotation very slow/dragging
Failed sync/demod board
If status LED’s on the sync/demod board ARE flashing the
cause is most likely an a problem with the analyzer’s main
power:
Intermittent loss of the power supply too short to cause a
SYSTEM RESET warning;
Frequency problem with the AC mains.
This message occurs at power on.
If it is confirmed that power has not been interrupted:
Failed +5 VDC power,
Fatal error caused software to restart
Loose connector/wiring
Blocked Cooling Vents below GFC Assembly
Analyzer’s top cover removed
Wheel heater
Wheel temperature sensor
Relay controlling the wheel heater
Entire relay board
I2C buss
11.1.2. Fault Diagnosis with TEST Functions
Besides being useful as predictive diagnostic tools, the test functions viewable from the front
panel can be used to isolate and identify many operational problems when combined with a
thorough understanding of the analyzer’s theory of operation (see Chapter 10).
The acceptable ranges for these test functions are listed in the “Nominal Range” column of the
analyzer Final Test and Validation Data Sheet (p/n 04307) shipped with the instrument. Values
outside these acceptable ranges indicate a failure of one or more of the analyzer’s subsystems.
04584 Rev A1
186
Model GFC7000E Instruction Manual
TROUBLESHOOTING & REPAIR PROCEDURES
Functions whose values are still within the acceptable range but have significantly changed from
the measurement recorded on the factory data sheet may also indicate a failure. A worksheet has
been provided in Appendix C to assist in recording the value of these test functions.
The following table contains some of the more common causes for these values to be out of
range.
Table 11-2:
TEST
FUNCTIONS
Test Functions - Indicated Failures
INDICATED FAILURE(S)
(As Displayed)
TIME
RANGE
STABIL
CO2 MEAS
&
CO2 REF
MR RATIO
PRES
SAMPLE FL
SAMPLE
TEMP
BENCH
TEMP
WHEEL
TEMP
BOX TEMP
Time of day clock is too fast or slow
To adjust see Section 6.6.
Battery in clock chip on CPU board may be dead.
Incorrectly configured measurement range(s) could cause response problems with a
Datalogger or chart recorder attached to one of the analog output.
If the Range selected is too small, the recording device will over range.
If the Range is too big, the device will show minimal or no apparent change in readings.
Indicates noise level of instrument or CO2 concentration of sample gas (see Section 11.3.2
for causes).
If the value displayed is too high the IR Source has become brighter. Adjust the variable
gain potentiometer on the sync/demod board
If the value displayed is too low or constantly changing and the CO2 REF is OK:
Failed multiplexer on the mother board
Failed sync/demod board
Loose connector or wiring on sync/demod board
Flow of purge gas to the GFC wheel housing may have stopped
If the value displayed is too low or constantly changing and the CO2 REF is BAD:
GFC wheel stopped or rotation is too slow
Failed sync/demod board IR source
Failed IR source
Failed relay board
2
Failed I C buss
Failed IR photo-detector
When the analyzer is sampling zero air and the ratio is too low:
The reference cell of the GFC wheel is contaminated or leaking.
The alignment between the GFC wheel and the segment sensor, the M/R sensor or both
is incorrect.
Failed sync/demod board
Flow of purge gas to the GFC wheel housing may have stopped
When the analyzer is sampling zero air and the ratio is too high:
Zero air is contaminated
Failed IR photo-detector
See Table 11-1 for SAMPLE PRES WARN
Check for gas flow problems. see Section 11.1.6
SAMPLE TEMP should be close to BENCH TEMP. Temperatures outside of the specified
range or oscillating temperatures are cause for concern
Bench temp control improves instrument noise, stability and drift. Temperatures outside of
the specified range or oscillating temperatures are cause for concern. See Table 11-1 for
BENCH TEMP WARNING
Wheel temp control improves instrument noise, stability and drift. Outside of set point or
oscillating temperatures are cause for concern. See Table 11-1 for WHEEL TEMP
WARNING
If the box temperature is out of range, check fan in the power supply module. Areas to the
side and rear of instrument should allow adequate ventilation. See Table 11-1 for BOX
TEMP WARNING.
04584 Rev A1
187
Model GFC7000E Instruction Manual
Table 11-2:
TEST
FUNCTIONS
TROUBLESHOOTING & REPAIR PROCEDURES
Test Functions - Indicated Failures (cont.)
INDICATED FAILURE(S)
(As Displayed)
PHT DRIVE
SLOPE
OFFSET
If this drive voltage is out of range it may indicate one of several problems:
- A poor mechanical connection between the various components in inside the detector
housing
- An electronic failure of the IR Photo-Detector’s built-in cooling circuitry, or;
- A temperature problem inside the analyzer chassis. In this case other temperature
warnings would also be active such as BENCH TEMP WARNING or BOX TEMP
WARNING.
Values outside range indicate
Contamination of the zero air or span gas supply
Instrument is miss-calibrated
Blocked gas flow
Contaminated or leaking GFC wheel (either chamber)
Faulty IR photo-detector
Faulty sample faulty IR photo-detector pressure sensor (P1) or circuitry
Invalid M/R ratio (see above)
Bad/incorrect span gas concentration due.
Values outside range indicate
Contamination of the zero air supply
Contaminated or leaking GFC wheel (either chamber)
Faulty IR photo-detector
11.1.3. Using the Diagnostic Signal I/O Function
The Signal I/O parameters found under the DIAG Menu (see Section 6.9.2 and Appendix A)
combined with a thorough understanding of the instruments theory of operation (found in Chapter
10) are useful for troubleshooting in three ways:
•
The technician can view the raw, unprocessed signal level of the analyzer’s critical inputs
and outputs.
•
All of the components and functions that are normally under algorithmic control of the CPU
can be manually exercised.
•
The technician can directly control the signal level Analog and Digital Output signals.
This allows the technician to systematically observe the effect of directly controlling these signals
on the operation of the analyzer. Below in Figure 11-2 is an example of how to use the signal I/O
menu to view the raw voltage of an input signal or to control the state of an output voltage or
control signal. The specific parameter will vary depending on the situation.
04584 Rev A1
188
Model GFC7000E Instruction Manual
SAMPLE*
TROUBLESHOOTING & REPAIR PROCEDURES
RANGE = 500.000 PPM
CO2 =X.XXX
< TST TST > CAL
SAMPLE
SETUP
ENTER SETUP PASS : 818
8
1
8
ENTR EXIT
PRIMARY SETUP MENU
SETUP X.X
CFG DAS RNGE PASS CLK MORE
EXIT
SECONDARY SETUP MENU
SETUP X.X
COMM VARS DIAG
DIAG
EXIT
SIGNAL I/O
PREV
NEXT
DIAG I/O
ENTR
0 ) EXT_ZERO_CAL=ON
PREV NEXT JUMP
PRNT EXIT
If parameter is an
input signal
DIAG I/O
If parameter is an output
signal or control
DIAG I/O
28) SAMPLE_PRESSURE=2540 MV
PREV NEXT JUMP
EXIT
PRNT EXIT
22) WHEEL_HTR=ON
PREV NEXT JUMP
ON PRNT EXIT
Toggles parameter
ON/OFF
DIAG I/O
22 ) WHEEL_HTR=OFF
PREV NEXT JUMP
OFF PRNT EXIT
Exit returns to
DIAG display & all values
return to software control
Figure 11-2:
Example of Signal I/O Function
11.1.4. Internal Electronic Status LED’s
Several LED’s are located inside the instrument to assist in determining if the analyzer’s CPU, I2C
buss and relay board, GFC wheel and the sync/demodulator board are functioning properly.
11.1.4.1. CPU Status Indicator
DS5, a red LED, that is located on upper portion of the motherboard, just to the right of the CPU
board, flashes when the CPU is running the main program loop. After power-up, approximately
30 to 60 seconds, DS5 should flash on and off. If characters are written to the front panel display
but DS5 does not flash then the program files have become corrupted, contact customer service
04584 Rev A1
189
Model GFC7000E Instruction Manual
TROUBLESHOOTING & REPAIR PROCEDURES
because it may be possible to recover operation of the analyzer. If after 30 – 60 seconds neither
the DS5 is flashing or no characters have been written to the front panel display then the CPU is
bad and must be replaced.
Mother Board
P/N 04069
CPU Status LED
Figure 11-3:
CPU Status Indicator
11.1.4.2. Sync Demodulator Status LED’s
Two LED’s located on the Sync/Demod Board and are there to make it obvious that the GFC
Wheel is spinning and the synchronization signals are present:
Table 11-3:
LED
D1
D2
04584 Rev A1
Sync/Demod Board Status Failure Indications
Function
M/R Sensor
Status
Fault Status
LED is stuck
ON or OFF
Segment
Sensor Status
LED is stuck
ON or OFF
Indicated Failure(s)
GFC Wheel is not turning
M/R Sensor on Opto-Pickup Board failed
Sync/Demod Board failed
JP 4 Connector/Wiring faulty
Failed/Faulty +5 VDC Power Supply (PS1)
GFC Wheel is not turning
Segment Sensor on Opto-Pickup Board failed
Sync/Demod Board failed
JP 4 Connector/Wiring faulty
Failed/Faulty +5 VDC Power Supply (PS1)
190
Model GFC7000E Instruction Manual
TROUBLESHOOTING & REPAIR PROCEDURES
D1 – M/R Sensor Status
JP4 Connector to Opto-Pickup
Board
D2 – Segment Sensor Status
Figure 11-4:
Sync/Demod Board Status LED Locations
11.1.4.3. Relay Board Status LED’s
There are eight LED’s located on the Relay Board. The most important of which is D1, which
indicates the health of the I2C buss. If D1 is blinking the other faults following LED’s can be used
in conjunction with DIAG menu signal I/O to identify hardware failures of the relays and switches
on the relay (see Section 6.9.2 and Appendix D).
Table 11-4:
I2C Status LED Failure Indications
LED
FUNCTION
FAULT STATUS
D1
(Red)
I2C buss
Health
(Watchdog
Circuit)
Continuously ON
or
Continuously OFF
INDICATED FAILURE(S)
Failed/Halted CPU
Faulty Mother Board, Keyboard or Relay
Board
Faulty Connectors/Wiring between Mother
Board, Keyboard or Relay Board
Failed/Faulty +5 VDC Power Supply (PS1)
DC VOLTAGE TEST
POINTS
STATUS LED’s
RELAY PCA
PN 04135
Figure 11-5:
04584 Rev A1
Relay Board Status LEDs
191
Model GFC7000E Instruction Manual
Table 11-5:
LED
FUNCTION
TROUBLESHOOTING & REPAIR PROCEDURES
Relay Board Status LED Failure Indications
SIGNAL I/O PARAMETER
ACTIVATED BY
DIAGNOSTIC TECHNIQUE
VIEW RESULT
D2
Yellow
WHEEL
HEATER
WHEEL_HEATER
WHEEL_TEMP
D3
Yellow
BENCH
HEATER
BENCH_HEATER
BENCH_TEMP
D4
Yellow
SPARE
N/A
N/A
D5
Green
SAMPLE/CAL
GAS VALVE
OPTION
CAL_VALVE
N/A
D6
Green
ZERO/SPAN
GAS VALVE
OPTION
SPAN_VALVE
N/A
D7
Green
SHUTOFF
VALVE OPTION
SHUTOFF_VALVE
N/A
D8
Green
IR SOURCE
IR_SOURCE
CO2_MEASURE
Voltage displayed should change. If not:
Failed Heater
Faulty Temperature Sensor
Failed AC Relay
Faulty Connectors/Wiring
Voltage displayed should change. If not:
Failed Heater
Faulty Temperature Sensor
Failed AC Relay
Faulty Connectors/Wiring
N/A
Sample/Cal Valve should audibly change
states. If not:
Failed Valve
Failed Relay Drive IC on Relay Board
Failed Relay Board
Faulty +12 VDC Supply (PS2)
Faulty Connectors/Wiring
Zero/Span Valve should audibly change
states. If not:
Failed Valve
Failed Relay Drive IC on Relay Board
Failed Relay Board
Faulty +12 VDC Supply (PS2)
Faulty Connectors/Wiring
Shutoff Valve should audibly change
states. If not:
Failed Valve
Failed Relay Drive IC on Relay Board
Failed Relay Board
Faulty +12 VDC Supply (PS2)
Faulty Connectors/Wiring
Voltage displayed should change. If not:
Failed IR Source
Faulty +12 VDC Supply (PS2)
Failed Relay Board
Failed IR Photo-Detector
Failed Sync/Demod Board
Faulty Connectors/Wiring
11.1.5. Gas Flow Problems
In general, flow problems can be divided into three categories:
1. Flow is too high
2. Flow is greater than zero, but is too low, and/or unstable
3. Flow is zero (no flow)
When troubleshooting flow problems, it is a good idea to first confirm that the actual flow and not
the analyzer’s flow sensor and software are in error, or the flow meter is in error. Use an
04584 Rev A1
192
Model GFC7000E Instruction Manual
TROUBLESHOOTING & REPAIR PROCEDURES
independent flow meter to perform a flow check as described in Section 9.3.4. If this test shows
the flow to be correct, check the pressure sensors as described in Section 11.4.6.5.
11.1.6. Typical Sample Gas Flow Problems
11.1.6.1. Flow is Zero
The unit displays a SAMPLE FLOW warning message on the front panel display or the SAMPLE
FLOW test function reports a zero or very low flow rate.
Confirm that the sample pump is operating (turning). If not, use an AC voltmeter to make sure
that power is being supplied to the pump. If no power is present at the electrical leads of the
pump.
1. If AC power is being supplied to the pump, but it is not turning, replace the pump.
2. If the pump is operating but the unit reports no gas flow, perform a flow check as described in
Section 9.3.4.
3. If no independent flow meter is available:
•
Disconnect the gas lines from both the sample inlet and the exhaust outlet on the rear
panel of the instrument.
•
Make sure that the unit is in basic SAMPLE Mode.
•
Place a finger over an Exhaust outlet on the rear panel of the instrument.
•
If gas is flowing through the analyzer, you will feel pulses of air being expelled from the
Exhaust outlet.
4. If gas flows through the instrument when it is disconnected from its sources of zero air, span
gas or sample gas, the flow problem is most likely not internal to the analyzer. Check to make
sure that:
•
All calibrators/generators are turned on and working correctly.
•
Gas bottles are not empty or low.
•
Valves, regulators, and gas lines are not clogged or dirty.
11.1.6.2. Low Flow
1. Check if the pump diaphragm is in good condition. If not, rebuild the pump (see Section
9.3.2). Check the Spare Parts List for information of pump rebuild kits.
2. Check for leaks as described in Section 9.3.3. Repair the leaking fitting, line or valve and recheck.
3. Check for the sample filter and the orifice filter for dirt. Replace filters (see Sections 9.3.1 and
11.5.1 respectively).
4. Check for partially plugged pneumatic lines, orifices, or valves. Clean or replace them.
04584 Rev A1
193
Model GFC7000E Instruction Manual
TROUBLESHOOTING & REPAIR PROCEDURES
5. If an IZS option is installed in the instrument, press CALZ and CALS.
then suspect a bad sample/cal valve.
If the flow increases
11.1.6.3. High Flow
The most common cause of high flow is a leak in the sample flow control assembly or between
there and the pump. If no leaks or loose connections are found in the fittings or the gas line
between the orifice and the pump, rebuild/clean the sample flow control assembly as described in
Section 11.5.1.
11.1.6.4. Displayed Flow = “XXXX”
This warning means that there is inadequate gas flow. There are four conditions that might cause
this:
1. A leak upstream or downstream of the flow sensor
2. A flow obstruction upstream or downstream of the flow sensor
3. Bad Flow Sensor Board
4. Bad pump
To determine which is the case, view the sample pressure and sample flow functions on the front
panel. If the sample pressure is reading abnormally low, then the cause is likely a flow obstruction
upstream of the flow sensor. First, check the sample filter and make sure it is not plugged and
then systematically check all the other components upstream of the orifice to ensure that they are
not obstructed.
If the sample pressure is reading normal but the sample flow is reading low then it is likely that
the pump diaphragm is worn or there is an obstruction downstream of the flow sensor.
11.1.6.5. Actual Flow Does Not Match Displayed Flow
If the actual flow measured does not match the displayed flow, but is within the limits of 720-880
cc/min, adjust the calibration of the flow measurement as described in Section 6.9.8.
11.1.6.6. Sample Pump
The sample pump should start immediately after the front panel power switch is turned ON. With
the Sample Inlet plugged, the test function PRES should read about 10”-Hg for a pump in good
condition. Readings above 15”-Hg indicate that the pump needs rebuilding. If the test function
SAMP FL is greater than 10 cc the instrument’s there is a leak in the pneumatic lines.
11.1.7. Poor or Stopped Flow of Purge Gas
If sufficient purge gas is not supplied to the GFC wheel housing, cyclical fluctuations in readings
at zero or low CO2 concentrations, such as < 100 ppm, may occur. These fluctuations are the
result of changes in the CO2 concentration of the ambient atmosphere throughout the course of
the day and night. In isolated areas with relatively few people working nearby the ambient CO2
concentration will fall during the day and rise during the night as rate of photosynthesis of the
plants in the surrounding area decreases and increases. In a lab environment with a relatively
high human occupancy the ambient CO2 concentration will increase during those parts of the day
when the highest number of workers are present. If the GFC wheel housing is allowed to fill with
04584 Rev A1
194
Model GFC7000E Instruction Manual
TROUBLESHOOTING & REPAIR PROCEDURES
ambient air, these natural, diurnal fluctuations might be detected by the instrument and cause its
in its calculation of the CO2 concentration of the sample gas to drift.
Another possible symptom of poor or stopped purge gas flow would be the inability to measure
zero concentrations accurately at the end of a work day on a system that was calibrated at the
beginning of a workday. Again this could be due to local fluctuations in ambient CO2
concentration between the time of the day when the calibration was performed and other times
during the day.
11.2. Calibration Problems
11.2.1. Miss-Calibrated
There are several symptoms that can be caused by the analyzer being miss-calibrated. This
condition is indicated by out of range Slopes and Offsets as displayed through the test functions
and is frequently caused by the following:
1. BAD SPAN GAS. This can cause a large error in the slope and a small error in the offset.
Delivered from the factory, the MGFC7000E’s slope is within ±15% of nominal. Bad span gas
will cause the analyzer to be calibrated to the wrong value. If in doubt have the span gas
checked by and independent lab.
2. CONTAMINATED ZERO GAS. Excess H2O can cause a positive or negative offset and will
indirectly affect the slope.
3. Dilution calibrator not set up correctly or is malfunctioning. This will also cause the slope, but
not the zero to be incorrect. Again the analyzer is being calibrated to the wrong value.
4. Too many analyzers on the manifold. This can cause either a slope or offset error because
ambient gas with its pollutants will dilute the zero or span gas.
11.2.2. Non-Repeatable Zero and Span
As stated earlier, leaks both in the MGFC7000E and in the external system are a common source
of unstable and non-repeatable readings.
1. Check for leaks in the pneumatic systems as described in Section 9.3.3. Don’t forget to
consider pneumatic components in the gas delivery system outside the MGFC7000E. Such as:
•
A change in zero air source such as ambient air leaking into zero air line, or;
•
A change in the span gas concentration due to zero air or ambient air leaking into the
span gas line.
2. Once the instrument passes a leak check, do a flow check (see Section 9.3.4) to make sure
adequate sample is being delivered to the sensor assembly.
3. A failing IR photo-detector may be at fault. Check the CO2 MEAS and CO2 REF test
functions via the front panel display to make sure the signal levels are in the normal range
(See Appendix A) and are quiet.
04584 Rev A1
195
Model GFC7000E Instruction Manual
TROUBLESHOOTING & REPAIR PROCEDURES
4. Confirm the sample pressure, wheel temperature, bench temperature, and sample flow
readings are correct and have steady readings.
5. Disconnect the exhaust line from the optical bench near the rear of the instrument and plug
this line into the SAMPLE inlet creating a pneumatic loop. The CO2 concentration (either zero
or span) now must be constant. If readings become quiet, the problem is in the external
pneumatics supplies for sample gas, span gas or zero air.
6. If pressurized span gas is being used with a zero/span valve option, make sure that the
venting is adequate (See Section 3.1.2 and 5.4)
7. If it is the zero point that is non-repeatable, and if that non-repeatability seems to only occur
at a certain time of day, such as when worker occupancy is highest or lowest, make sure the
flow of purge gas to the GFC wheel housing has not stopped (see Sections 10.2.2 and 11.1.7.
for more information).
11.2.3. Inability to Span – No SPAN Key
1. Confirm that the carbon dioxide span gas source is accurate; this can be done by switching
between two span-gas tanks. If the CO2 concentration is different, there is a problem with
one of the tanks.
2. Check for leaks in the pneumatic systems as described in Section 9.3.3.
3. Make sure that the expected span gas concentration entered into the instrument during
calibration is the correct span gas concentration and not too different from expected span
value. This can be viewed via the RNG Menu (see Section 6.7).
4. Check to make sure that there is no ambient air or zero air leaking into span gas line.
11.2.4. Inability to Zero – No ZERO Key
1. Confirm that there is a good source of zero air. Dilute a tank of span gas with the same
amount of zero air from two different sources. If the CO2 Concentration of the two
measurements is different, there is a problem with one of the sources of zero air.
2. Check for leaks in the pneumatic systems as described in Section 9.3.3.
3. The Internal zero air scrubber may need maintenance. This device is only present if the
analyzer has had zero/span valve options 51 or 53 installed this.
4. Check to make sure that there is no ambient air leaking into zero air line.
11.3. Other Performance Problems
Dynamic problems (i.e. problems which only manifest themselves when the analyzer is monitoring
sample gas) can be the most difficult and time consuming to isolate and resolve. The following
section provides an itemized list of the most common dynamic problems with recommended
troubleshooting checks and corrective actions.
04584 Rev A1
196
Model GFC7000E Instruction Manual
TROUBLESHOOTING & REPAIR PROCEDURES
11.3.1. Temperature Problems
Individual control loops are used to maintain the set point of the absorption bench, filter wheel,
and IR photo-detector temperatures. If any of these temperatures are out of range or are poorly
controlled, the MGFC7000E will perform poorly.
11.3.1.1. Box or Sample Temperature
Box Temperature
The box temperature sensor is mounted to the motherboard and cannot be disconnected to check
its resistance. Rather check the BOX TEMP signal using the SIGNAL I/O function under the
DIAG Menu (see Section 11.1.3). This parameter will vary with ambient temperature, but at
~30oC (6-7° above room temperature) the signal should be ~1450 mV.
Sample Temperature
The Sample Temperature should closely track the bench temperature. If it does not, locate the
sensor, which is located at the midpoint of the optical bench in a brass fitting. Unplug the
connector labeled “Sample”, and measure the resistance of the thermistor; at room temperature
(25°C) it should be ~30K Ohms, at operating temperature, 48°C, it should be ~ 12K Ohms
11.3.1.2. Bench Temperature
There are three possible failures that could cause the Bench temperature to be incorrect.
1. The heater mounted to the bottom of the Absorption bench is electrically shorted or open.
Check the resistance of the two heater elements by measuring between pin 2 and 4 (~76
Ohms), and pin 3 and 4 (~330 Ohms), of the white five-pin connector just below the sample
temperature sensor on the Bench (pin 1 is the pointed end).
2. Assuming that the I2C buss is working and that there is no other failure with the relay board,
the solid-state relay (K2) on the relay board may have failed. Using the BENCH_HEATER
parameter under the signal I/O function, as described above, turn on and off K2 (D3 on the
relay board should illuminate as the heater is turned on). Check the AC voltage present
between pin 2 and 4, for a 100 or 115 VAC model, and pins 3 and 4, for a 220-240 VAC
model.
WARNING:
HAZARDOUS VOLTAGES ARE PRESENT DURING THIS TEST
3. If the relay has failed there should be no change in the voltage across pins 2 and 4 or 3 and 4.
Note, K2 is in a socket for easy replacement.
4. If K2 checks out OK, the thermistor temperature sensor located on the optical bench near the
front of the instrument could be at fault. Unplug the connector labeled “Bench”, and measure
the resistance of the thermistor. At room temperature it should have approximately 30K
Ohms resistance, near the 48oC set point it should have ~11K ohms.
04584 Rev A1
197
Model GFC7000E Instruction Manual
TROUBLESHOOTING & REPAIR PROCEDURES
11.3.1.3. GFC Wheel Temperature
Like the bench heater above there are three possible causes for the GFC wheel temperature to
have failed.
1. The wheel heater has failed. Check the resistance between pins 1 and 4 on the white five-pin
connector just below the sample temperature sensor on the bench (pin 1 is the pointed end).
It should be approximately 275 ohms.
2. Assuming that the I2C buss is working and that there is no other failure with the relay board,
the solid-state relay (K1) on the relay board may have failed. Using the WHEEL_HEATER
parameter under the signal I/O function, as described above, turn on and off K1 (D2 on the
relay board should illuminate as the heater is turned on). Check the AC voltage present
between pin 1 and 4.
WARNING:
HAZARDOUS VOLTAGES ARE PRESENT DURING THIS TEST
3. If the relay has failed there should be no change in the voltage across pins 1 and 4. Note, K1
is socketed for easy replacement.
4. If K1 checks out OK, the thermistor temperature sensor located at the front of the filter wheel
assembly may have failed. Unplug the connector labeled “Wheel”, and measure the resistance
of the thermistor. The resistance near the 68oC set point is ~5.7k ohms.
11.3.1.4. IR Photo-Detector TEC Temperature
If the PHT DRIVE test parameter described above in Table 11-2 is out of range there are two
four possible causes of failure.
1. The screws retaining the IR photo detector to the absorption bench have become loose.
Carefully tighten the screws, hand-tight and note whether, after the analyzer has come up to
operating temperature, whether the PHT DRIVE voltage has returned to an acceptable level.
2. The two large transistor-type devices mounted to the side of the Absorption Bench have come
loose from the bench. Tighten the retaining screws and note whether there is an improvement
in the PHT DRIVE voltage.
3. The photo-detector has failed. Contact the factory for instructions.
4. The sync demodulator circuit board has failed. Contact the factor for instructions.
11.3.2. Excessive Noise
Noise is continuously monitored in the TEST functions as the STABIL reading and only becomes
meaningful after sampling a constant gas concentration for at least 10 minutes. Compare the
current STABIL reading with that recorded at the time of manufacture (included in the
04584 Rev A1
198
Model GFC7000E Instruction Manual
TROUBLESHOOTING & REPAIR PROCEDURES
MGFC7000E Final Test And Validation Data Sheet-p/n 04271 shipped with the unit from Teledyne
Instruments).
1. The most common cause of excessive noise is leaks. Leak check and flow check the
instrument described in Section 9.3.
2. Detector failure – caused by failure of the hermetic seal or over-temperature due to poor heat
sinking of the detector can to the optical bench. In addition to increased noise due to poor
signal-to-noise ratio, another indicator of detector failure is a drop in the signal levels of the
CO2 MEASURE signal and CO2 REFERENCE signal.
3. Sync/Demod Board failure. There are many delicate, high impedance parts on this board.
Check the CO2 MEAS and CO2 REF Test Functions via the Front Panel Display.
4. The detector cooler control circuit can fail for reasons similar to the detector itself failing.
Symptoms would be a change in MR RATIO Test Function when zero air is being sampled.
Also check the SIGNAL I/O parameter PHT DRIVE. After warm-up, and at 25oC ambient, if
PHT DRIVE < 2500 mV, the cooler is working properly. If PHT DRIVE is > 2500 mV there is a
malfunction.
5. The +5 and ±15 VDC voltages in the MGFC7000E are provided by switching power supplies.
Switch mode supplies create DC outputs by switching the input AC waveform at high
frequencies. As the components in the switcher age and degrade, the main problem observed
is increased noise on the DC outputs. If a noisy switcher power supply is suspected, attach an
oscilloscope to the DC output test points located on the top right hand edge of the Relay
board. Look for short period spikes > 100 mV p-p on the DC output.
11.4. Subsystem Checkout
The preceding sections of this manual discussed a variety of methods for identifying possible
sources of failures or performance problems within the analyzer. In most cases this included a list
of possible causes. This section describes how to determine individually determine if a certain
component or subsystem is actually the cause of the problem being investigated.
11.4.1. AC Mains Configuration
The analyzer is correctly configured for the AC mains voltage in use if:
1. The Sample Pump is running.
2. The GFC wheel motor is spinning (a slight vibration should be apparent to the touch).
3. If incorrect power is suspected, check that the correct voltage and frequency is present at the
line input on the rear panel.
•
If the unit is set for 230 VAC and is plugged into 115VAC, or 100VAC the sample pump
will not start, and the heaters will not come up to temperature.
•
If the unit is set for 115 or 100 VAC and is plugged into a 230 VAC circuit, the circuit
breaker built into the ON/OFF Switch on the Front Panel will trip to the OFF position
immediately after power is switched on.
04584 Rev A1
199
Model GFC7000E Instruction Manual
TROUBLESHOOTING & REPAIR PROCEDURES
11.4.2. DC Power Supply
If you have determined that the analyzer’s AC mains power is working, but the unit is still not
operating properly, there may be a problem with one of the instrument’s switching power
supplies. The supplies can have two faults, namely no DC output, and noisy output.
To assist tracing DC Power Supply problems, the wiring used to connect the various printed circuit
assemblies and DC Powered components and the associated test points on the relay board follow
a standard color-coding scheme as defined in Table.
Table 11-6:
DC Power Test Point and Wiring Color Codes
NAME
TEST POINT#
TP AND WIRE COLOR
Dgnd
1
Black
+5V
2
Red
Agnd
3
Green
+15V
4
Blue
-15V
5
Yellow
+12V
6
Purple
+12R
7
Orange
A voltmeter should be used to verify that the DC voltages are correct per the values in Table
below, and an oscilloscope, in AC mode, with band limiting turned on, can be used to evaluate if
the supplies are producing excessive noise (> 100 mV p-p).
Table 11-7:
DC Power Supply Acceptable Levels
CHECK RELAY BOARD TEST POINTS
POWER
SUPPLY
ASSY
VOLTAG
E
PS1
FROM TEST
POINT
TO TEST POINT
MIN V
MAX V
NAME
#
NAME
#
+5
Dgnd
1
+5
2
4.8
5.25
PS1
+15
Agnd
3
+15
4
13.5
16V
PS1
-15
Agnd
3
-15V
5
-14V
-16V
PS1
Agnd
Agnd
3
Dgnd
1
-0.05
0.05
PS1
Chassis
Dgnd
1
Chassis
N/A
-0.05
0.05
PS2
+12
+12V Ret
6
+12V
7
11.75
12.5
PS2
Dgnd
+12V Ret
6
Dgnd
1
-0.05
0.05
11.4.3. I2C Bus
Operation of the I2C buss can be verified by observing the behavior of D1 on the Relay Board in
conjunction with the performance of the front panel display. Assuming that the DC power
supplies are operating properly and the wiring from the Motherboard to the Keyboard, and the
wiring from the keyboard to the Relay board, is intact, the I2C buss is operating properly if:
04584 Rev A1
200
Model GFC7000E Instruction Manual
TROUBLESHOOTING & REPAIR PROCEDURES
•
D1 on the relay board is flashing, or
•
D1 is not flashing but pressing a key on the front panel results in a change to the display.
11.4.4. Keyboard/Display Interface
The front panel keyboard, display and Keyboard Display Interface PCA (03975 or 04258) can be
verified by observing the operation of the display when power is applied to the instrument and
when a key is pressed on the front panel. Assuming that there are no wiring problems and that
the DC power supplies are operating properly:
1. The vacuum fluorescent display is good if on power-up a “-“ character is visible on the upper
left hand corner of the display.
2. The CPU Status LED, DS5, is flashing, see Section 11.1.4.1.
3. If there is a “-“ character on the display at power-up and D1 on the relay board is flashing
then the keyboard/display interface PCA is bad.
4. If the analyzer starts operation with a normal display but pressing a key on the front panel
does not change the display, then there are three possible problems:
•
One or more of the keys is bad,
•
The interrupt signal between the Keyboard Display interface and the motherboard is
broken, or
•
The Keyboard Display Interface PCA is bad.
11.4.5. Relay Board
The relay board PCA (04135) can be most easily checked by observing the condition of the its
status LEDs on the relay board, as described in Section 11.1.4.3, and the associated output when
toggled on and off through signal I/O function in the diagnostic menu, see Section 11.1.3.
1. If the front panel display responds to key presses and D1 on the relay board is NOT flashing
then either the wiring between the Keyboard and the relay board is bad, or the relay board is
bad.
2. If D1 on the relay board is flashing and the status indicator for the output in question (heater
power, valve drive, etc.) toggles properly using the signal I/O function, then the associated
control device on the relay board is bad. Several of the control devices are in sockets and can
be easily replaced. The table below lists the control device associated with a particular
function:
Table 11-8:
04584 Rev A1
Relay Board Control Devices
FUNCTION
CONTROL
DEVICE
IN SOCKET
Wheel Heater
K1
Yes
Bench Heater
K2
Yes
Spare AC Control
K3
Yes
IZS Valves
U4
Yes
201
Model GFC7000E Instruction Manual
TROUBLESHOOTING & REPAIR PROCEDURES
IR Source Drive
U5
No
The IR source drive output can be verified by measuring the voltage at J16 with the IR source
disconnected. It should be 11.5± 0.5 VDC.
11.4.6. Sensor Assembly
11.4.6.1. Sync/Demodulator Assembly
To verify that the Sync/Demodulator Assembly is working follow the procedure below:
1. Verify that D1 and D2 are flashing.
•
If not check the opto pickup assembly, Section 11.4.6.2 and the GFC wheel drive, Section
11.4.6.3
•
If the wheel drive and opto pickup are working properly then verify that there is 2.4 ±0.1
VAC and 2.5 ±0.15 VDC between digital ground and TP 5 on the sync demod board. If not
then check the wiring between the sync/demod and opto pickup assembly (see
interconnect drawing 04216). If good then the sync/demod board is bad.
2. Verify that the IR source is operating, Section 11.4.6.4.
3. With the analyzer connected to zero air, measure between TP11 (measure) and analog
ground, and TP12 (reference) and analog ground.
•
If they are similar to values recorded on the Factory Data sheet then there is likely a
problem with the wiring or the A/D converter.
•
If they are not then either the sync demodulator board or the IR-photodetector are bad.
See also section 11.3.1.4 for problems with the IR-Photodetector TEC drive.
11.4.6.2. Opto Pickup Assembly
Operation of the opto pickup PCA (04088) can be verified with a voltmeter. Measure the AC and
DC voltage between digital ground on the Relay board, or Keyboard and TP1 and TP2 on the sync
pickup PCA. For a working board, with the GFC motor spinning, they should read 2.4 ±0.1 VAC
and 2.5 ±0.15 VDC.
Further confirmation that the pickups and motor are operating properly can be obtained by
measuring the frequency at TP1 and TP2 using a frequency counter, a digital volt meter with a
frequency counter, or an oscilloscope per the table below.
Table 11-9:
Opto Pickup Board Nominal Output Frequencies
NOMINAL MEASURED FREQUENCY
04584 Rev A1
AC MAINS FREQ.
TP1
TP2
50 Hz
25
300
60 Hz
30
360
202
Model GFC7000E Instruction Manual
TROUBLESHOOTING & REPAIR PROCEDURES
11.4.6.3. GFC Wheel Drive
If the D1 and D2 on the sync demodulator board are not flashing then:
1. Check for power to the motor by measuring between pins 1 and 3 on the connector feeding
the motor. For instruments configured for 120 or 220-240VAC there should be approximately
88 VAC for instruments configured for 100VAC, it should be the voltage of the AC mains,
approximately 100VAC.
2. Verify that the frequency select jumper, JP4, is properly set on the Relay Board. For 50 Hz
operation it should be installed. For 60 Hz operation may either be missing or installed in a
vertical orientation.
3. If there is power to the motor and the frequency select jumper is properly set then the motor
is likely bad. See Section 11.5.2 for instructions on removing and replacing the GFC assembly
that the motor is bolted to.
11.4.6.4. IR Source
The IR source can be checked using the following procedure:
1. Disconnect the source and check its resistance when cold. When new, the source should have
a cold resistance of more than 1.5 Ohms but less than 3.5 Ohms. If not, then the source is
bad.
2. With the source disconnected, energize the analyzer and wait for it to start operating.
Measure the drive Voltage between pins 1 and 2 on the jack that the source is normally
connected to, it should be 11.5 ± 0.25 VDC. If not, then there is a problem with either the
wiring, the Relay Board, or the +12V power supply.
3. If the drive voltage is correct in step 2, then remove the source from the heat sink assembly
(2 screws on top) and connect to its mating connector. Observe the light being emitted from
the source. It should be centered at the bottom of the U-shaped element. If there is either
no emission or a badly centered emission then the source is bad.
11.4.6.5. Pressure/Flow Sensor Assembly
The pressure/flow sensor PCA, located on the top of the absorption bench, can be checked with a
Voltmeter using the following procedure which, assumes that the wiring is intact, and that the
Motherboard and the power supplies are operating properly:
1. For Pressure related problems:
•
Measure the voltage across C1 it should be 5 ± 0.25 VDC.
If not then the board is bad.
•
Measure the voltage across TP4 and TP1. With the sample pump disabled it should be
4500 mV ±250 mV. With the pump energized it should be approximately 200 mV less. If
not, then S1, the pressure transducer is bad, the board is bad, or there is a pneumatic
failure preventing the pressure transducer from sensing the absorption cell pressure
properly.
2. For flow related problems:
•
Measure the voltage across TP2 and TP1 it should be 10 ±0.25 VDC. If not then the board
is bad.
04584 Rev A1
203
Model GFC7000E Instruction Manual
•
TROUBLESHOOTING & REPAIR PROCEDURES
Measure the voltage across TP3 and TP1. With proper flow (800 sccm at the sample inlet)
this should be approximately 4.5V (this voltage will vary with altitude). With flow stopped
(sample inlet blocked) the voltage should be approximately 1V. If the voltage is incorrect,
the flow sensor is bad, the board is bad or there is a leak upstream of the sensor.
11.4.7. Motherboard
11.4.7.1. A/D Functions
The simplest method to check the operation of the A-to-D converter on the motherboard is to use
the Signal I/O function under the DIAG Menu to check the two A/D reference Voltages and input
signals that can be easily measured with a voltmeter.
1. Use the Signal I/O function (see Section 11.1.3 and Appendix A) to view the value of
REF_4096_MV and REF_GND. If both are within 3 mV of nominal (4096 and 0), and are
stable, ±0.5 mV then the basic A/D is functioning properly. If not then the Motherboard is
Bad
2. Choose a parameter in the Signal I/O function such as SAMPLE_PRESSURE,
SAMPLE_FLOW, CO2_MEASURE or CO2_REFERENCE. Compare these Voltages at their
origin (see Interconnect drawing 04215 and Interconnect list 04216) with the voltage
displayed through the Signal I/O function. If the wiring is intact but there is a large difference
between the measured and displayed voltage (±10 mV) then the Motherboard is bad.
11.4.7.2. Analog Outputs: Voltage
To verify that the analog outputs are working properly, connect a voltmeter to the output in
question and perform an analog output step test as described in Section 6.9.3.
For each of the steps, taking into account any offset that may have been programmed into
channel (see Section 6.9.4), the output should be within 1% of the nominal value listed in the
table below except for the 0% step, which should be within 2 to 3 mV. If one or more of the steps
fails to be within this range then it is likely that there has been a failure of the either or both of
the DACs and their associated circuitry on the Motherboard.
Table 11-10: Analog Output Test Function - Nominal Values Voltage Outputs
FULL SCALE OUTPUT VOLTAGE
100MV
1V
5V
10V
STEP
%
NOMINAL OUTPUT VOLTAGE
1
0
0
0
0
0
2
20
20 mV
0.2
1
2
3
40
40 mV
0.4
2
4
4
60
60 mV
0.6
3
6
5
80
80 mV
0.8
4
8
6
100
100 mV
1.0
5
10
11.4.7.3. Analog Outputs: Current Loop
To verify that the analog outputs with the optional current mode output are working properly,
connect a 250 ohm resistor across the outputs and use a voltmeter to measure the output as
04584 Rev A1
204
Model GFC7000E Instruction Manual
TROUBLESHOOTING & REPAIR PROCEDURES
described in Section 6.9.4.2 and then perform an Analog Output Step Test as described in Section
6.9.3.
For each step the output should be within 1% of the nominal value listed in the table below.
Table 11-11: Analog Output Test Function - Nominal Values Current Outputs
OUTPUT RANGE
2 -20
4 -20
NOMINAL OUTPUT VALUES
STEP
%
CURRENT
V(250 OHMS)
CURRENT
V(250 OHMS)
1
0
2 mA
0.5V
4
1
2
20
5.6
1.4
7.2
1.8
3
40
9.2
2.3
10.4
2.6
4
60
12.8
3.2
13.6
3.4
5
80
16.4
4.1
16.8
4.2
6
100
20
5
20
5
11.4.7.4. Status Outputs
The procedure below can be used to test the Status outputs:
Connect a jumper between the “D“ pin and the “V” pin on the status output connector.
Connect a 1000 ohm resistor between the “+” pin and the pin for the status output that is being
tested.
Connect a voltmeter between the “V” pin and the pin of the output being tested (see table
below).
Under the DIAGÆ SIGNAL I/O menu (see Section 11.1.3), scroll through the inputs and outputs
until you get to the output in question. Alternately turn on and off the output noting the voltage
on the Voltmeter, it should vary between 0 volts for ON and 5 volts for OFF.
Table 11-12: Status Outputs Check
PIN (LEFT TO RIGHT)
STATUS
1
SYSTEM OK
2
CONC VALID
3
HIGH RANGE
4
ZERO CAL
5
SPAN CAL
6
DIAG MODE
7
ALRM1
8
SALRM2
11.4.7.5. Control Inputs – Remote Zero, Span
The control input bits can be tested by the following procedure:
04584 Rev A1
205
Model GFC7000E Instruction Manual
TROUBLESHOOTING & REPAIR PROCEDURES
Connect a jumper from the +5 pin on the Status connector to the x5V on the Control In
connector.
Connect a second jumper from the ‘-‘ pin on the Status connector to the A pin on the Control In
connector. The instrument should switch from SAMPLE mode to ZERO CAL R mode.
Connect a second jumper from the ‘-‘ pin on the Status connector to the B pin on the Control In
connector. The instrument should switch from SAMPLE mode to SPAN CAL R mode.
In each case, the MGFC7000E should return to SAMPLE mode when the jumper is removed.
11.4.8. CPU
There are two major types of failures associated with the CPU board: complete failure and a
failure associated with the Disk On Chip on the CPU board. If either of these failures occur,
contact the factory.
1. For complete failures, assuming that the power supplies are operating properly and the wiring
is intact, the CPU is bad if on powering the instrument:
•
The vacuum fluorescent display shows a dash in the upper left hand corner.
•
The CPU Status LED, DS5, is not flashing. (see Section 11.1.4.1.)
•
There is no activity from the primary RS-232 port (COM-A) on the rear panel even if “?
<ret>” is pressed.
•
In some rare circumstances this failure may be caused by a bad IC on the Motherboard,
specifically U57 the large, 44 pin device on the lower right hand side of the board. If this
is true, removing U57 from its socket will allow the instrument to startup but the
measurements will be incorrect.
2. If the analyzer stops part way through initialization (there are words on the vacuum
fluorescent display) then it is likely that the DOC has been corrupted.
11.4.9. RS-232 Communications
11.4.9.1. General RS-232 Troubleshooting
Teledyne Instruments analyzers use the RS-232 communications protocol to allow the instrument
to be connected to a variety of computer-based equipment. RS-232 has been used for many
years and as equipment has become more advanced, connections between various types of
hardware have become increasingly difficult. Generally, every manufacturer observes the signal
and timing requirements of the protocol very carefully.
04584 Rev A1
206
Model GFC7000E Instruction Manual
TROUBLESHOOTING & REPAIR PROCEDURES
Problems with RS-232 connections usually center around 4 general areas:
1. Incorrect cabling and connectors. See Table 6-15 for connector and pin-out information.
2. The BAUD rate and protocol are incorrectly configured. See Section 6.10.7.
3. If a modem is being used, additional configuration and wiring rules must be observed. See
Section 6.13.2.6
4. Incorrect setting of the DTE – DCE Switch is set correctly See Section 6.10.5
5. Verify that cable (03596) that connects the serial COM ports of the CPU to J12 of the
Motherboard is properly seated
11.4.9.2. Troubleshooting Analyzer/Modem or Terminal Operation
These are the general steps for troubleshooting problems with a modem connected to a Teledyne
Instruments analyzer.
1. Check Cables for proper connection to the modem, terminal or computer.
2. Check to make sure the DTE-DCE is in the correct position as described in Section 6.10.5.
3. Check to make sure the set up command is correct (See Section 6.13.2.7)
4. Verify that the Ready to Send (RTS) signal is at logic high. The MGFC7000E sets pin 7 (RTS) to
greater than 3 volts to enable modem transmission.
5. Make sure the BAUD rate, word length, and stop bit settings between modem and analyzer
match, see Section 6.10.7.
6. Use the RS-232 test function to send “w” characters to the modem, terminal or computer; See
Section 6.10.8.
7. Get your terminal, modem or computer to transmit data to the analyzer (holding down the
space bar is one way); the green LED should flicker as the instrument is receiving data.
8. Make sure that the communications software or Terminal emulation software is functioning
properly.
Further help with serial communications is available in a separate manual “RS-232 Programming
Notes” Teledyne Instruments part number 013500000.
11.5. Repair Procedures
This section contains procedures that might need to be performed on rare occasions when a major
component of the analyzer requires repair or replacement.
11.5.1. Repairing Sample Flow Control Assembly
The Critical Flow Orifice is housed in the Flow Control Assembly (Teledyne Instruments part
number: 001760400) located on the top of the optical bench. A sintered filter protects the jewel
orifice so it is unusual for the orifice to need replacing, but if does, or the filter needs replacement
04584 Rev A1
207
Model GFC7000E Instruction Manual
TROUBLESHOOTING & REPAIR PROCEDURES
please use the following procedure (see the Spare Parts list in Appendix B for part numbers and
kits):
1. Turn off power to the analyzer.
2. Locate the assembly attached to the sample pump, see Figure 3–11.
3. Disconnect the pneumatic connection from the flow assembly and the assembly from the
pump.
4. Remove the fitting and the components as shown in the exploded view in Figure 11.6.
5. Replace the o-rings (p/n:OR_01) and the sintered filter (p/n:FL_01).
6. If replacing the critical flow orifice itself (p/n:00094100), make sure that the side with the
colored window (usually red) is facing upstream to the flow gas flow.
7. Re-assemble in reverse order.
8. After reconnecting the power and pneumatic lines, flow check the instrument as described in
the Section 9.3.4.
Pneumatic Connector, Male 1/8”
(P/N FT_70
Spring
(P/N HW_20)
Sintered Filter
(P/N FL_01)
Critical Flow Orifice
(P/N 00094100)
O-Ring
(P/N OR_01)
Purge Housing
(P/N 000850000)
Figure 11-6:
04584 Rev A1
Critical Flow Restrictor Assembly Disassembly
208
Model GFC7000E Instruction Manual
TROUBLESHOOTING & REPAIR PROCEDURES
11.5.2. Removing/Replacing the GFC Wheel
When Removing or replacing the GFC Wheel it is important to perform the disassembly in the
following order to avoid damaging the components:
1. Turn off the analyzer.
2. Remove the top cover as described in “Getting Started” Section 3.1.
3. Open the Instrument’s hinged front panel.
4. Locate the GFC wheel/motor assembly (see Figure 3-11).
5. unplug the following electronic components:
•
The GFC wheel housing temperature sensor;
•
GFC wheel heater
•
GFC wheel motor power supply
•
IR source
6. Unscrew the purge gas line hex nut and remove the 1/8 inch FEP purge gas line.
10
7
8
9
Figure 11-7:
Opening the GFC Wheel Housing
7. Remove the two (2) screws holding the opto-pickup printed circuit assembly to the GFC wheel
housing.
8. Carefully remove the opto-pickup printed circuit assembly.
9. Remove the four (4) screws holding the GFC wheel motor/heat sink assembly to the GFC
wheel housing.
10. Carefully remove the GFC Wheel motor/heat sink assembly from the GFC wheel housing.
04584 Rev A1
209
Model GFC7000E Instruction Manual
TROUBLESHOOTING & REPAIR PROCEDURES
11
12
Figure 11-8: Removing the GFC Wheel
11. Remove the ONE (1) screw fastening the GFC wheel/mask assembly to the gfc motor hub.
12. Remove the GFC wheel/mask assembly.
13. Follow the previous steps in reverse order to put the GFC wheel/motor assembly back
together.
11.5.3. Disk-On-Chip Replacement Procedure
Replacing the Disk-on-Chip, may be necessary in certain rare circumstances or to load new
instrument software. This will cause all of the instrument configuration parameters and iDAS data
to be lost. However a backup copy of the operating parameters are stored in a second nonvolatile memory and will be loaded into the new the Disk-on-Chip on power-up. To change the
Disk-on-Chip follow this procedure.
1. Turn off power to the instrument.
2. Fold down the rear panel by loosening the thumbscrews on each side
3. Locate the Disk-on-Chip in the rightmost socket near the right hand side of the CPU assembly.
Remove the IC by gently prying it up from the socket.
4. Reinstall the new Disk-on-Chip, making sure the notch in the end of the chip is facing upward.
5. Close the rear panel and turn on power to the machine.
04584 Rev A1
210
Model GFC7000E Instruction Manual
TROUBLESHOOTING & REPAIR PROCEDURES
User Notes
04584 Rev A1
211
Model GFC7000E Instruction Manual
A Primer on Electro-Static Discharge
12. A PRIMER ON ELECTRO-STATIC DISCHARGE
Teledyne Instruments considers the prevention of damage caused by the discharge of static
electricity to be extremely important part of making sure that your analyzer continues to provide
reliable service for a long time. This section describes how static electricity occurs, why it is so
dangerous to electronic components and assemblies as well as how to prevent that damage from
occurring.
12.1. How Static Charges are Created
Modern electronic devices such as the types used in the various electronic assemblies of your
analyzer, are very small, require very little power and operate very quickly. Unfortunately the
same characteristics that allow them to do these things also makes them very susceptible to
damage from the discharge of static electricity. Controlling electrostatic discharge begins with
understanding how electro-static charges occur in the first place.
Static electricity is the result of something called triboelectric charging which happens whenever
the atoms of the surface layers of two materials rub against each other. As the atoms of the two
surfaces move together and separate, some electrons from one surface are retained by the other.
Materials
Makes
Contact
+
+
Materials
Separate
+
+
+
+
PROTONS = 3
ELECTRONS = 3
PROTONS = 3
ELECTRONS = 3
NET CHARGE = 0
NET CHARGE = 0
Figure 12-1:
+
+
PROTONS = 3
ELECTRONS = 2
PROTONS = 3
ELECTRONS = 4
NET CHARGE = -1
NET CHARGE = +1
Triboelectric Charging
If one of the surfaces is a poor conductor or even a good conductor that is not grounded, the
resulting positive or negative charge can not bleed off and becomes trapped in place, or static.
The most common example of triboelectric charging happens when someone wearing leather or
rubber soled shoes walks across a nylon carpet or linoleum tiled floor. With each step electrons
change places and the resulting electro-static charge builds up, quickly reaching significant levels.
Pushing an epoxy printed circuit board across a workbench, using a plastic handled screwdriver or
even the constant jostling of Styrofoam pellets during shipment can also build hefty static charges
04584 Rev A1
213
Model GFC7000E Instruction Manual
Table 12-1:
A Primer on Electro-Static Discharge
Static Generation Voltages for Typical Activities
65-90%
RH
10-25%
RH
1,500V
35,000V
Walking across vinyl tile
250V
12,000V
Worker at bench
100V
6,000V
Poly bag picked up from
bench
1,200V
20,000V
Moving around in a chair
padded with urethane foam
1,500V
18,000V
MEANS OF GENERATION
Walking across nylon carpet
12.2. How Electro-Static Charges Cause Damage
Damage to components occurs when these static charges come in contact with an electronic
device. Current flows as the charge moves along the conductive circuitry of the device and the
typically very high voltage levels of the charge overheat the delicate traces of the integrated
circuits, melting them or even vaporizing parts of them. When examined by microscope the
damage caused by electro-static discharge looks a lot like tiny bomb craters littered across the
landscape of the component’s circuitry.
A quick comparison of the values in Table 12-1 with the those shown in the Table 12-2, listing
device susceptibility levels, shows why Semiconductor Reliability News estimates that
approximately 60% of device failures are the result of damage due to electro-static discharge.
Table 12-2:
Sensitivity of Electronic Devices to Damage by ESD
DEVICE
04584 Rev A1
DAMAGE SUSCEPTIBILITY
VOLTAGE RANGE
DAMAGE BEGINS
OCCURRING AT
CATASTROPHIC
DAMAGE AT
MOSFET
10
100
VMOS
30
1800
NMOS
60
100
GaAsFET
60
2000
EPROM
100
100
JFET
140
7000
SAW
150
500
Op-AMP
190
2500
CMOS
200
3000
Schottky Diodes
300
2500
Film Resistors
300
3000
This Film
Resistors
300
7000
ECL
500
500
SCR
500
1000
Schottky TTL
500
2500
214
Model GFC7000E Instruction Manual
A Primer on Electro-Static Discharge
Potentially damaging electro-static discharges can occur:
•
Any time a charged surface (including the human body) discharges to a device. Even
simple contact of a finger to the leads of an sensitive device or assembly can allow enough
discharge to cause damage. A similar discharge can occur from a charged conductive
object, such as a metallic tool or fixture.
•
When static charges accumulated on a sensitive device discharges from the device to
another surface such as packaging materials, work surfaces, machine surfaces or other
device. In some cases, charged device discharges can be the most destructive.
A typical example of this is the simple act of installing an electronic assembly into the
connector or wiring harness of the equipment in which it is to function. If the assembly is
carrying a static charge, as it is connected to ground a discharge will occur.
•
Whenever a sensitive device is moved into the field of an existing electro-static field, a
charge may be induced on the device in effect discharging the field onto the device. If the
device is then momentarily grounded while within the electrostatic field or removed from
the region of the electrostatic field and grounded somewhere else, a second discharge will
occur as the charge is transferred from the device to ground.
12.3. Common Myths About ESD Damage
•
I didn’t feel a shock so there was no electro-static discharge: The human nervous
system isn’t able to feel a static discharge of less than 3500 volts. Most devices are
damaged by discharge levels much lower than that.
•
I didn’t touch it so there was no electro-static discharge: Electro Static charges are
fields whose lines of force can extend several inches or sometimes even feet away from the
surface bearing the charge.
•
It still works so there was no damage: Sometimes the damaged caused by electrostatic discharge can completely sever a circuit trace causing the device to fail immediately.
More likely, the trace will be only partially occluded by the damage causing degraded
performance of the device or worse, weakening the trace. This weakened circuit may
seem to function fine for a short time, but even the very low voltage and current levels of
the device’s normal operating levels will eat away at the defect over time causing the
device to fail well before its designed lifetime is reached.
These latent failures are often the most costly since the failure of the equipment in which
the damaged device is installed causes down time, lost data, lost productivity, as well as
possible failure and damage to other pieces of equipment or property.
•
Static Charges can’t build up on a conductive surface: There are two errors in this
statement.
Conductive devices can build static charges if they are not grounded. The charge will be
equalized across the entire device, but without access to earth ground, they are still
trapped and can still build to high enough levels to cause damage when they are
discharged.
A charge can be induced onto the conductive surface and/or discharge triggered in the
presence of a charged field such as a large static charge clinging to the surface of a nylon
jacket of someone walking up to a workbench.
04584 Rev A1
215
Model GFC7000E Instruction Manual
•
A Primer on Electro-Static Discharge
As long as my analyzer is properly installed it is safe from damage caused by
static discharges: It is true that when properly installed the chassis ground of your
analyzer is tied to earth ground and its electronic components are prevented from building
static electric charges themselves. This does not, however, prevent discharges from static
fields built up on other things, like you and your clothing, from discharging through the
instrument and damaging it.
12.4. Basic Principles of Static Control
It is impossible to stop the creation of instantaneous static electric charges. It is not, however
difficult to prevent those charges from building to dangerous levels or prevent damage due to
electro-static discharge from occurring.
12.4.1. General Rules
Only handle or work on all electronic assemblies at a properly set up ESD station.
Setting up an ESD safe work station need not be complicated. A protective mat properly tied to
ground and a wrist strap are all that is needed to create a basic anti-ESD workstation (see figure
12-2).
Protective
Mat
Wrist Strap
Ground Point
Figure 12-2:
Basic anti-ESD Work Station
For technicians that work in the field, special lightweight and portable anti-ESD kits are available
from most suppliers of ESD protection gear. These include everything needed to create a
temporary anti-ESD work area anywhere.
•
Always wear an Anti-ESD wrist strap when working on the electronic assemblies
of your analyzer. An anti-ESD wrist strap keeps the person wearing it at or near the
same potential as other grounded objects in the work area and allows static charges to
dissipate before they can build to dangerous levels. Anti-ESD wrist straps terminated with
04584 Rev A1
216
Model GFC7000E Instruction Manual
A Primer on Electro-Static Discharge
alligator clips are available for use in work areas where there is no available grounded
plug.
Also, anti-ESD wrist straps include a current limiting resistor (usually around one megohm) that protects you should you accidentally short yourself to the instrument’s power
supply.
•
Simply touching a grounded piece of metal is insufficient. While this may
temporarily bleed off static charges present at the time, once you stop touching the
grounded metal new static charges will immediately begin to re-build. In some conditions
a charge large enough to damage a component can rebuild in just a few seconds.
•
Always store sensitive components and assemblies in anti-ESD storage bags or
bins: Even when you are not working on them, store all devices and assemblies in a
closed anti-Static bag or bin. This will prevent induced charges from building up on the
device or assembly and nearby static fields from discharging through the it.
•
Use metallic anti-ESD bags for storing and shipping ESD sensitive components
and assemblies rather than pink-poly bags. The famous, pink-poly bags are made of
a plastic that is impregnated with a liquid (similar to liquid laundry detergent) which very
slowly sweats onto the surface of the plastic creating a slightly conductive layer over the
surface of the bag.
While this layer may equalizes any charges that occur across the whole bag, it does not
prevent the build up of static charges. If laying on a conductive grounded surface, these
bags will allow charges to bleed away but the very charges that build up on the surface of
the bag itself can be transferred through the bag by induction onto the circuits of your ESD
sensitive device. Also, the liquid impregnating the plastic is eventually used up after which
the bag is as useless for preventing damage from ESD as any ordinary plastic bag.
Anti-Static bags made of plastic impregnated with metal (usually silvery in color) provide
all of the charge equalizing abilities of the pink-poly bags but also, when properly sealed,
create a Faraday cage that completely isolates the contents from discharges and the
inductive transfer of static charges.
Storage bins made of plastic impregnated with carbon (usually black in color) are also
excellent at dissipating static charges and isolating their contents from field effects and
discharges.
•
Never use ordinary plastic adhesive tape near an ESD sensitive device or to close
an anti-ESD bag. The act of pulling a piece of standard plastic adhesive tape, such as
Scotch® tape, from its roll will generate a static charge of several thousand or even tens of
thousands of volts on the tape itself and an associated field effect that can discharge
through or be induced upon items up to a foot away.
04584 Rev A1
217
Model GFC7000E Instruction Manual
A Primer on Electro-Static Discharge
12.4.2. Basic anti-ESD Procedures for Analyzer Repair and
Maintenance
12.4.2.1. Working at the Instrument Rack
When working on the analyzer while it is in the instrument rack and plugged into a properly
grounded power supply
1. Attach you anti-ESD wrist strap to ground before doing anything else.
•
Use a wrist strap terminated with an alligator clip and attach it to a bare metal portion of
the instrument chassis. This will safely connect you to the same ground level to which the
instrument and all of its components are connected.
2. Pause for a second or two to allow any static charges to bleed away.
3. Open the casing of the analyzer and begin work. Up to this point the closed metal casing of
your analyzer has isolated the components and assemblies inside from any conducted or
induces static charges.
4. If you must remove a component from the instrument, do not lay it down on a non-ESD
preventative surface where static charges may lie in wait.
5. Only disconnect your wrist strap after you have finished work and closed the case of the
analyzer.
12.4.2.2. Working at a Anti-ESD Work Bench.
When working on an instrument of an electronic assembly while it is resting on a anti-ESD work
bench
1. Plug you anti-ESD wrist strap into the grounded receptacle of the work station before touching
any items on the work station and while standing at least a foot or so away, This will allow
any charges you are carrying to bleed away through the ground connection of the work station
and prevent discharges due to field effects and induction from occurring.
2. Pause for a second or two to allow any static charges to bleed away.
3. Only open any anti-ESD storage bins or bags containing sensitive devices or assemblies after
you have plugged your wrist strap into the work station.
•
Lay the bag or bin on the workbench surface.
•
Before opening the container, wait several seconds for any static charges on the outside
surface of the container to be bled away by the work station’s grounded protective mat.
4. Do not pick up tools that may be carrying static charges while also touching or holding an ESD
Sensitive Device.
•
Only lay tools or ESD-sensitive devices and assemblies on the conductive surface of your
workstation. Never lay them down on a non-ESD preventative surfaces.
5. Place any static sensitive devices or assemblies in anti-static storage bags or bins and close
the bag or bin before unplugging your wrist strap.
04584 Rev A1
218
Model GFC7000E Instruction Manual
A Primer on Electro-Static Discharge
6. Disconnecting your wrist strap is always the last action taken before leaving the work bench.
12.4.2.3. Transferring Components from Rack To Bench and Back
When transferring a sensitive device from an installed Teledyne Instruments analyzer to a AntiESD workbench or back:
1. Follow the instructions listed above for working at the instrument rack and work station.
2. Never carry the component or assembly without placing it in a anti-ESD bag or bin.
3. Before using the bag or container allow any surface charges on it to dissipate:
•
If you are at the instrument rack hold the bag in one hand while your wrist strap is
connected to a ground point.
•
If you are at a anti-ESD work bench, lay the container down on the conductive work
surface.
•
In either case wait several seconds.
4. Place the item in the container.
5. Seal the container. If using a bag, fold the end over and fastening it with anti-ESD tape.
Never use standard plastic adhesive tape as a sealer.
•
Folding the open end over isolates the component(s) inside from the effects of static fields.
•
Leaving the bag open or simply stapling it shut without folding it closed prevents the bag
from forming a complete protective envelope around the device.
6. Once you have arrived at your destination, allow any surface charges that may have built up
on the bag or bin during travel to dissipate:
•
Connect your wrist strap to ground.
•
If you are at the instrument rack hold the bag in one hand while your wrist strap is
connected to a ground point.
•
If you are at a anti-ESD work bench, lay the container down on the conductive work
surface
•
In either case wait several seconds
7. Open the container.
12.4.2.4. Opening Shipments from and Packing Components for Return to
Teledyne Instruments Customer Service.
Packing materials such as bubble pack and Styrofoam pellets are extremely efficient generators of
static electric charges. To prevent damage from ESD, Teledyne Instruments ships all electronic
components and assemblies in properly sealed ant-ESD containers.
04584 Rev A1
219
Model GFC7000E Instruction Manual
A Primer on Electro-Static Discharge
Static charges will build up on the outer surface of the anti-ESD container during shipping as the
packing materials vibrate and rub against each other. To prevent these static charges from
damaging the components or assemblies being shipped make sure that you:
•
•
Always unpack shipments from Teledyne Instruments Customer Service by:
•
Opening the outer shipping box away from the anti-ESD work area
•
Carry the still sealed ant-ESD bag, tube or bin to the anti-ESD work area
•
Follow steps 6 and 7 of Section 12.4.2.3 above when opening the anti-ESD container at
the work station
•
Reserve the anti-ESD container or bag to use when packing electronic components or
assemblies to be returned to Teledyne Instruments
Always pack electronic components and assemblies to be sent to Teledyne Instruments
Customer Service in anti-ESD bins, tubes or bags.
•
Do not use pink-poly bags.
•
If you do not already have an adequate supply of anti-ESD bags or containers
available, Teledyne Instruments’ Customer Service department) will supply them (see
Section 11.7 for contact information.
•
Always follow steps 1 through 5 of Section 12.4.1.3
User Notes
04584 Rev A1
220
Model GFC7000E Instruction ManualAPPENDIX A - Version Specific Software Documentation
APPENDIX A - Version Specific Software Documentation
APPENDIX A-1: Model GFC7000E Software Menu Trees
APPENDIX A-2: Model GFC7000E Setup Variables Available Via Serial I/O
APPENDIX A-3: Model GFC7000E Warnings and Test Measurements Via Serial I/O
APPENDIX A-4: Model GFC7000E Signal I/O Definitions
APPENDIX A-5: Model GFC7000E iDAS Functions
045150110 Rev A1
221
Model GFC7000E Instruction Manual
APPENDIX A-1: MGFC7000E Software Menu Trees, Revision E.0
APPENDIX A-1: MGFC7000E Software Menu Trees, Revision E.0
SAMPLE
TEST1
<TST
MSG1,2
CAL
TST>
Only appear if
reporting range
is set for
AUTO range
mode.
CLR1,3
ENTER SETUP PASS: 818
LOW
HIGH
(Primary Setup Menu)
CFG
RANGE
STABIL
PRES
SAMP FL
PMT
NORM PMT
UV LAMP
LAMP RATIO
STR. LGT
DARK PMT
DARK LAMP
SLOPE
OFFSET
HVPS
RCELL TEMP
BOX TEMP
PMT TEMP
IZS TEMP1
TEST2
TIME
ZERO
SPAN
DAS
RANG
PASS
CLK
MORE
CONC
(Secondary Setup Menu)
COMM
TEST FUNCTIONS
Viewable by user while
instrument is in
SAMPLE Mode
(see Section 6.2.1)
Figure A-1:
045840110 Rev B.3
SETUP
1
2
3
VARS
DIAG
Only appears when warning messages are activated
(see Section 6.2.2)
Press this key to cycle through list of active warning
messages.
Press this key to clear/erase the warning message
currently displayed
Basic Sample Display Menu
223
Model GFC7000E Instruction Manual
APPENDIX A-1: MGFC7000E Software Menu Trees, Revision E.0
SAMPLE
TEST1
<TST
TST>
CALZ
CAL
Only appear if
reporting range
is set for
AUTO range
mode.
LOW
HIGH
LOW
HIGH
CALS
LOW
MSG1,2
CLR1,3
SETUP
HIGH
RANGE
RANGE1*
RANGE2*
ZERO
SPAN CONC
ZERO
SPAN CONC
ENTER SETUP PASS: 818
STABIL
CO2 MEAS
CO2 REF
MR RATIO
PRES
(Primary Setup Menu)
SAMP FL
SAMP TEMP
BENCH TEMP
WHEEL TEMP
CFG
DAS
RANG PASS
CLK
MORE
BOX TEMP
PHT DRIVE
SLOPE
OFFSET
(Secondary Setup Menu)
TEST FUNCTIONS
TEST
Viewable by user while
TIME
instrument is in SAMPLE Mode
(see Section 6.2.1)
1
Only appears when warning messages are activated
* Only appears instrument is set for
DUAL or AUTO reporting range
modes
Figure A-2:
045840110 Rev B.3
2
3
(see Section 6.2.2)
Press this key to cycle through list of active warning
messages.
Press this key to clear/erase the warning message
currently displayed
COMM
VARS
DIAG
Sample Display Menu - Units with Z/S Valve or IZS Option installed
224
Model GFC7000E Instruction Manual
APPENDIX A-1: MGFC7000E Software Menu Trees, Revision E.0
SETUP
ENTER SETUP PASS: 818
CFG
PREV
DAS
ACAL1
NEXT
NEXT
MODE
SET2
PREV
ENTR
2
3
MODE
SET
DUAL
AUTO
DATE
UNIT
NEXT
SNGL
DISABLED
ZERO
ZERO/SPAN
SPAN
TIMER ENABLE
STARTING DATE
STARTING TIME
DELTA DAYS
DELTA TIME
DURATION
CALIBRATE
PPB
PPM
UGM
MGM
%
ENTR
<SET
SET>
EDIT
LOW3
Go To
SECONDARY SETUP MENU
(Fig. A-4)
HIGH3
RANGE TO CAL3
Figure A-3:
045840110 Rev B.3
MORE
OFF
TIME
CONFIGURATION
SAVED
Only appears if a applicable
option/feature is installed
and activated.
Appears whenever the
currently displayed
sequence is not set for
DISABLED.
Only appears when
reporting range is set to
AUTO range mode.
CLK
ON
(Fig. A-5)
SEQ 1)
SEQ 2)
SEQ 3)
• DATE FACTORY
1
PASS
Go To iDAS
MENU TREE
PREV
• MODEL NAME
• SERIAL NUMBER
• SOFTWARE
REVISION
• LIBRARY REVISION
•
iCHIP SOFTWARE
REVISION1
•
HESSEN PROTOCOL
REVISION1
•
ACTIVE
SPECIAL SOFTWARE
OPTIONS1
•
CPU TYPE
RNGE
Primary Setup Menu (Except iDAS)
225
Model GFC7000E Instruction Manual
APPENDIX A-1: MGFC7000E Software Menu Trees, Revision E.0
SETUP
ENTER SETUP PASS: 818
CFG
DAS
ACAL1
RNGE
VIEW
PREV
CLK
MORE
EDIT
NEXT
CONC
PNUMTC
CALDAT
ZTBZRO
STBSPN
TEMP
<PRM
PASS
PRM>
Cycles through
lists of
parameters
chosen for this
iDAS channel
PREV
PREV
NEXT
NX10
Selects data point to view.
YES
PREV
INS
DEL
YES
CONC
PNUMTC
CALDAT
ZTBZRO
STBSPN
TEMP
VIEW
PV10
NEXT
EDIT
NO
<SET
SET>
EDIT
PRNT
Creates/changes name
NAME
EVENT
PARAMETERS
REPORT PERIOD
NUMBER OF RECORDS
RS-232 REPORT
CHANNEL ENABLE
CAL. HOLD
NO
PRNT
(see Section 6.12.2).
Sets the
amount of time
between each
report.
NEXT
PREV
NEXT
INS
DEL
Cycles through
available trigger
events
YES
EDIT
NO
ON
(see Section 6.12.3).
<SET
Cycles through
already active
parameters
(see Section 6.12.4).
PARAMETER
PREV
NEXT
SET>
EDIT
SAMPLE MODE
INST
OFF
AVG
PRECISION
MIN
YES
NO
Selects max
no. of records
for this channel
MAX
Cycles through available/active parameters
(see Section 6.12.4).
1
Figure A-4:
045840110 Rev B.3
Only appears if a valve option is installed.
Primary Setup Menu (iDAS)
226
Model GFC7000E Instruction Manual
APPENDIX A-1: MGFC7000E Software Menu Trees, Revision E.0
SETUP
ENTER SETUP PASS: 818
CFG
DAS
ACAL1
RNGE
COMM
ID
COM1
SET>
NEXT
QUIET
COMPUTER
SECURITY
HESSEN PROTOCOL
COMx E,7,1
RS-485
MULTIDROP
ENABLE MODEM
ENABLE INTERNET
IGNORE ERRORS
DISABLE XON/XOFF
COMMAND PROMPT
DIAG
BAUD RATE
PREV
ON
NEXT
JUMP
EDIT
PRINT
DAS_HOLD_OFF
CONC PRECISION
DYN_ZERO OFF
DYN_SPAN OFF
CLOCK_ADJ
EDIT
NEXT
TEST PORT
TEST
300
1200
2400
4800
9600
19200
38400
57760
115200
OFF
Figure A-5:
045840110 Rev B.3
MORE
COM2
MODE
PREV
CLK
VARS
PREV
<SET
PASS
Go To
DIAG MENU TREE
(Fig A-6)
1
Only appears if a valve is installed.
Secondary Setup Menu (COMM & VARS)
227
Model GFC7000E Instruction Manual
APPENDIX A-1: MGFC7000E Software Menu Trees, Revision E.0
SETUP
ENTER SETUP PASS: 818
CFG
DAS
ACAL1
RNGE
PASS
COMM
CLK
MORE
VARS
ID
DIAG
COM1
PREV
NEXT
JUMP
EDIT
PRINT
INET2
COMM - MENU TREE
<SET
SET>
EDIT
(Fig A-5)
DAS_HOLD_OFF
CONC PRECISION
DYN_ZERO OFF
DYN_SPAN OFF
CLOCK_ADJ
DHCP
INSTRUMENT IP
GATEWAY IP
SUBNET MASK
TCP PORT3
HOSTNAME4
Go To
DIAG MENU TREE
ON
OFF
1
2
3
4
5
(Fig A-6)
Only appears if a valve option is installed.
Only appears when the Ethernet card (option 63) is installed.
Although TCP PORT is editable regardless of the DHCP state, do not change the setting for this property unless
instructed to by Teledyne Instruments Customer Service personnel.
HOST NAME is only editable when DHCP is ON.
INSTRUMENT IP, GATEWAY IP & SUBNET MASK are only editable when DHCP is OFF.
Figure A-6:
045840110 Rev B.3
EDIT
INSTRUMENT IP5
GATEWAY IP5
SUBNET MASK5
TCP PORT3
Secondary Setup Menu (COMM Menu with Ethernet Card)
228
Model GFC7000E Instruction Manual
APPENDIX A-1: MGFC7000E Software Menu Trees, Revision E.0
SETUP
.
ENTER SETUP PASS: 818
CFG
DAS
ACAL1
RNGE
PASS
CLK
COMM
HESSEN2
ID
<SET
VARIATION
TYPE 1
TYPE 2
TEXT
VARS
DIAG
See
Fig A-5
See
Fig A-6
COM1 COM2
SET>
RESPONSE MODE
BCC
MORE
EDIT
GAS LIST
<SET
STATUS FLAGS
SET>
EDIT
CMD
MODE
BAUD RATE
TEST PORT
CO2, 310, REPORTED
PREV
PREV
NEXT
INS
1
Only appears if a valve is installed.
2
Only appears when the HESSEN
mode is enabled for either COM1
or COM2.
DEL
EDIT
NEXT
PREV
NEXT
TEST
PRNT
SAMPLE FLOW WARNING
BENCH TEMP WARNING
SOURCE WARNING
BOX TEMP WARNING
WHEEL TEMP WARNING
SAMPLE TEMP WARNING
SAMPLE PRESSURE WARNING
INVALID CONC
INSTRUMENT OFF
IN MANUAL CALIBRATION MODE
IN ZERO CALIBRATION MODE
IN SPAN CALIBRATION MODE
UGM
MGM
PPB
See Table 6-27 for
PPM
Flag Assignments
QUIET
COMPUTER
SECURITY
HESSEN PROTOCOL
COM[1,2] E,7,1
RS-485
MULTIDROP
ENABLE MODEM
ENABLE INTERNET
IGNORE ERRORS
DISABLE XON/XOFF
COMMAND PROMPT
300
1200
2400
4800
9600
19200
38400
57760
115200
ON
OFF
Figure A-7:
045840110 Rev B.3
Secondary Setup Menu (COMM Menu with HESSEN)
229
Model GFC7000E Instruction Manual
APPENDIX A-1: MGFC7000E Software Menu Trees, Revision E.0
SETUP
ENTER SETUP PASS: 818
ACAL1
CFG
COMM
DAS
RNGE
PASS
CLK
MORE
VARS
DIAG
PREV
SIGNAL
I/O
PREV
ANALOG
OUTPUT
NEXT
ANALOG I/O
CONFIGURATION
5)
6)
7)
8)
9)
10)
11)
12)
13)
14)
15)
16)
17)
18)
19)
20)
21)
22)
23)
24)
25)
DARK
CALIBRATION
ENTR
ENTR
ENTR
Start step Test
0)
1)
2)
3)
4)
ELECTRICAL
TEST
VIEW
26
↓
45
INTERNAL ANALOG
VOLTAGE SIGNALS
(see Appendix A)
46)
47)
48)
CONC OUT 1
CONC OUT 2
TEST OUTPUT
AOUTS CALIBRATED <SET
EDIT
ENTR
EXIT
CONC OUT 1
CONC OUT 2
TEST OUTPUT
SAMPLE
SAMPLE
SAMPLE
SAMPLE
TEST
CHANNEL
OUTPUT
Starts Test
SET>
LOW = XXX.X MV
LOW = X.X IN-HG-A
HIGH = XXX.X MV
HIGH = X.X IN-HG-A
NONE
CO2 MEASURE
CO2 REFERENCE
SAMPLE PRESSURE
SAMPLE FLOW
SAMPLE TEMP
BENCH TEMP
WHEEL TEMP2
CHASSIS TEMP
PHT DRIVE
EDIT
OFF
<SET
RANGE
0.1V
1V
SET>
REC OFFSET
5V
10V
AUTO CAL
ON
CURR
CALIBRATED
CAL
OFF
MV
1
2
Figure A-8:
045840110 Rev B.3
CAL
CAL
CAL
ON
FLOW
CALIBRATION
ENTR
Starts Test
EXT ZERO CAL
EXT SPAN CAL
SYNC OK
MAINT MODE
LANG2 SELECT
SAMPLE LED
CAL LED
FAULT LED
AUDIBLE BEEPER
ELEC TEST
DARK CAL
ST SYSTEM OK
ST CONC VALID
ST HIGH RANGE
ST ZERO CAL
ST SPAN CAL
ST DIAG MODE
ST SYSTEM OK2
ST CONC ALARM 1
ST CONC ALARM 2
RELAY WATCHDOG
WHEEL HEATER
BENCH HEATER
CAL VALVE
SPAN VALVE
SHUTOFF VALVE
PRESSURE
CALIBRATION
NEXT
Only relevant to on M200EH
Only relevant to analyzers with IZS options installed
Secondary Setup Menu (DIAG)
230
Model GFC7000E Instruction Manual
APPENDIX A-2: Setup Variables For Serial I/O, Revision
E.0APPENDIX A-3: Warnings and Test Functions, Revision E.0
APPENDIX A-2: Setup Variables For Serial I/O, Revision E.0
Table A-1:
MGFC7000E Setup Variables, Revision E.0
SETUP VARIABLE
NUMERIC
UNITS
DEFAULT VALUE
DAS_HOLD_OFF
Minutes
15
CONC_PRECISION
—
3
DYN_ZERO
—
DYN_SPAN
VALUE RANGE
DESCRIPTION
STANDARD SETUP VARIABLES
0.5–20
Duration of DAS hold off
period.
AUTO, 0, 1, 2, 3,
4
Number of digits to display to
the right of the decimal point
for concentrations on the
display.
OFF
ON, OFF
ON enables remote dynamic
zero calibration; OFF disables
it.
—
OFF
ON, OFF
ON enables remote dynamic
span calibration; OFF disables
it.
CLOCK_ADJ
Sec./Day
0
-60–60
Time-of-day clock speed
adjustment.
LANGUAGE_SELECT
—
MAINT_TIMEOUT
Hours
CONV_TIME
—
CO_DWELL
Seconds
0.2
CO_SAMPLE
Samples
1
FILT_SIZE
Samples
MEDIUM ACCESS LEVEL SETUP VARIABLES
2
33 MS
750, 200
Time until automatically
switching out of softwarecontrolled maintenance
mode.
33 MS, 66 MS,
133 MS,
266 MS,
533 MS, 1 SEC, 2
SEC
Conversion time for
measure/reference detector
channel.
0.1–30
Dwell time before taking
measure or reference sample.
1–30
Number of samples to take in
measure or reference mode.
Moving average filter size.
1–1000
Absolute change to trigger
adaptive filter.
10
1–100
Percent change to trigger
adaptive filter.
Seconds
90
0–180
Delay before leaving adaptive
filter mode.
—
ON
ON, OFF
ON enables adaptive filter;
OFF disables it.
—
ON
ON, OFF
ON enables CO2 adaptive
filter; OFF disables it.
Samples
5
1–300
CO2 moving average filter
size.
1–300
CO2 moving average filter
size in adaptive mode.
FILT_DELTA
PPM
4, 15
FILT_PCT
%
FILT_DELAY
FILT_ADAPT
10
0.1–100
Moving average filter size in
adaptive mode.
48, 20
CO2_FILT_SIZE
3, 8
Selects the language to use
for the user interface.
1–1000
Samples
10
0
ENGL,
SECD,
EXTN
1–1000
FILT_ASIZE
CO2_FILT_ADAPT
0
ENGL
3, 8
3, 8
CO2_FILT_ASIZE
10
Samples
1
CO2_FILT_DELTA
10
%
0.5
0.01–10
Absolute CO2 conc. change to
trigger adaptive filter.
%
5
0.1–100
Percent CO2 conc. change to
trigger adaptive filter.
Seconds
5
0–300
Delay before leaving CO2
adaptive filter mode.
CO2_FILT_PCT
10
CO2_FILT_DELAY
10
045840110 Rev B.3
231
Model GFC7000E Instruction Manual
APPENDIX A-2: Setup Variables For Serial I/O, Revision
E.0APPENDIX A-3: Warnings and Test Functions, Revision E.0
SETUP VARIABLE
NUMERIC
UNITS
DEFAULT VALUE
USER_UNITS
—
DIL_FACTOR
—
1
DARK_CAL_DURATION
Seconds
180,
60 4
DARK_MEAS_MV
mV
DARK_REF_MV
DESCRIPTION
PPB, PPM, 3, 8,
UGM, MGM 3, 8,
Concentration units for user
interface.
0.1–1000
Dilution factor. Used only if is
dilution enabled with
FACTORY_OPT variable.
10–600
Duration of dark cal. First
two-thirds is stabilization
period; final third is measure
period.
0
-1000–1000
Dark offset for measure
reading.
mV
0
-1000–1000
Dark offset for reference
reading.
LIN_TARGET_CONC1
Conc
300
1–10000
Target concentration during
linearity adjustment for range
1.
LIN_NORM_CONC1
PPM
300
0.01–10000
Target concentration during
linearity adjustment
normalized for T/P for range
1.
LIN_RATIO1
—
1
0.01–100
Measure/reference ratio
measured during linearity
adjustment for range 1.
LIN_CORRECT1
—
1
0.001–999.999
Linearity correction factor for
range 1.
LIN_TARGET_CONC2
Conc
300
1–10000
Target concentration during
linearity adjustment for range
2.
LIN_NORM_CONC2
PPM
300
0.01–10000
Target concentration during
linearity adjustment
normalized for T/P for range
2.
LIN_RATIO2
—
1
0.01–100
Measure/reference ratio
measured during linearity
adjustment for range 2.
LIN_CORRECT2
—
1
0.001–999.999
Linearity correction factor for
range 2.
LIN_TARGET_CONC
Conc
300
1–10000
Target concentration during
linearity adjustment.
LIN_NORM_CONC
PPM
300
0.01–10000
Target concentration during
linearity adjustment
normalized for T/P.
LIN_RATIO
—
1
0.01–100
Measure/reference ratio
measured during linearity
adjustment.
LIN_CORRECT
—
1
0.001–999.999
Linearity correction factor.
CO2_COMP_ENABLE
—
OFF
ON, OFF
ON enables CO2
compensation; OFF disables
it.
CO2_COMP_CONC
%
0
0–20
CO2 concentration to
compensate for.
CO_CONST1
—
PPM
0
VALUE RANGE
700, 500 4, 40000
3, 8
100–50000
CO calculation constant.
0–10
CO calculation constant.
1
0.0001–9.9999
Electrical test gain factor for
measure reading.
—
1
0.0001–9.9999
Electrical test gain factor for
reference reading.
mV
4375
0–5000
Target detector reading
during electrical test.
8
CO_CONST2
—
0.13, 0.198 1.448
4
,1.458 12, 0.187 3
ET_MEAS_GAIN
—
ET_REF_GAIN
ET_TARGET_DET
045840110 Rev B.3
232
Model GFC7000E Instruction Manual
APPENDIX A-2: Setup Variables For Serial I/O, Revision
E.0APPENDIX A-3: Warnings and Test Functions, Revision E.0
SETUP VARIABLE
NUMERIC
UNITS
ET_TARGET_CONC
PPM
40, 400
ET_CONC_RANGE
Conc.
50, 5000
STD_TEMP
ºK
STD_PRESS
"Hg
BENCH_SET
ºC
WHEEL_SET
ºC
3, 5, 8
ZERO_ENABLE
ZERO_FREQ
3, 5, 8
ZERO_DWELL
3, 5, 8
ZERO_SAMPLES
3, 5, 8
ZERO_FILT_SIZE
ZERO_LIMIT
ZERO_CAL
3, 5, 8
3, 5, 8
3, 5, 8
DEFAULT VALUE
3, 8
DESCRIPTION
1–10000
Target concentration during
electrical test.
0.1–50000
D/A concentration range
during electrical test.
1–500
Standard temperature for
temperature compensation.
1–50
Standard pressure for
pressure compensation.
48
Warnings: 43–53
0–100
Optical bench temperature
set point and warning limits.
68
Warnings: 63–73
0–100
Wheel temperature set point
and warning limits.
OFF, ON
ON enables auto-zero
calibration using scrubber;
OFF disables it.
0.1–1440
Auto-zero calibration
frequency.
3, 8
321
28.5, 28.7 8, 28.8
28.1 4
—
ON, OFF
Minutes
5, 20
Seconds,
Minutes 5
7, 5
Samples
15
Samples
5
Ratio
VALUE RANGE
12
8
5
5
1–60, 1–30
1.2, 1.15
Ratio
1.18
CO_SPAN1
Conc.
40, 400
,
3, 8
3, 8
5
Dwell time after closing or
opening zero scrubber valve.
1–1000
Number of zero samples to
average.
1–100
Auto-zero offset moving
average filter size.
0–5
Minimum auto-zero ratio
allowed; must be greater
than this value to be valid.
0.5–5
Calibrated auto-zero ratio.
1–10000,
1–20000 3, 8
Target CO concentration
during span calibration of
range 1.
CO_SLOPE1
—
1
0.001–999.999
CO slope for range 1.
CO_OFFSET1
—
0
-10–10
CO offset for range 1.
CO_SPAN2
Conc.
1–10000,
1–20000 3, 8
Target CO concentration
during span calibration of
range 2.
40, 400
3, 8
CO_SLOPE2
—
1
0.001–999.999
CO slope for range 2.
CO_OFFSET2
—
0
-10–10
CO offset for range 2.
RANGE_MODE
—
SNGL, DUAL,
AUTO
Range control mode.
3, 8
0.1–50000
D/A concentration range 1.
3, 8
0.1–50000
D/A concentration range 2.
1–15
D/A concentration range 3
(CO2).
CONC_RANGE1
CONC_RANGE2
CONC_RANGE3
Conc.
1
Conc.
10
%
045840110 Rev B.3
SNGL
0
50, 200 6, 500
6
50, 200 , 500
15
233
Model GFC7000E Instruction Manual
APPENDIX A-2: Setup Variables For Serial I/O, Revision
E.0APPENDIX A-3: Warnings and Test Functions, Revision E.0
SETUP VARIABLE
NUMERIC
UNITS
DEFAULT VALUE
RS232_MODE
BitFlag
0
VALUE RANGE
0–65535
DESCRIPTION
RS-232 COM1 mode flags.
Add values to combine flags.
1 = quiet mode
2 = computer mode
4 = enable security
8 = enable hardware
handshaking
16 = enable Hessen protocol
11
32 = enable multi-drop
64 = enable modem
128 = ignore RS-232 line
errors
256 = disable XON / XOFF
support
512 = disable hardware
FIFOs
1024 = enable RS-485 mode
2048 = even parity, 7 data
bits, 1 stop bit
4096 = enable command
prompt
0
BAUD_RATE
—
MODEM_INIT
—
“AT Y0 &D0 &H0 &I0
S0=2 &B0 &N6 &M0
E0 Q1 &W0” 0
RS232_MODE2
BitFlag
0
BAUD_RATE2
—
MODEM_INIT2
—
19200
19200
0
“AT Y0 &D0 &H0 &I0
S0=2 &B0 &N6 &M0
E0 Q1 &W0” 0
300, 1200, 2400,
4800,
9600, 19200,
38400, 57600,
115200
RS-232 COM1 baud rate.
Any character in
the allowed
character set. Up
to 100 characters
long.
RS-232 COM1 modem
initialization string. Sent
verbatim plus carriage return
to modem on power up or
manually.
0–65535
RS-232 COM2 mode flags.
(Same settings as
RS232_MODE.)
300, 1200, 2400,
4800, 9600,
19200, 38400,
57600, 115200
RS-232 COM2 baud rate.
Any character in
the allowed
character set. Up
to 100 characters
long.
RS-232 COM2 modem
initialization string. Sent
verbatim plus carriage return
to modem on power up or
manually.
RS232_PASS
Password
0–999999
RS-232 log on password.
MACHINE_ID
ID
300, 320
4
0–9999
Unique ID number for
instrument.
COMMAND_PROMPT
—
“Cmd> ”
0
Any character in
the allowed
character set. Up
to 100 characters
long.
RS-232 interface command
prompt. Displayed only if
enabled with RS232_MODE
variable.
045840110 Rev B.3
940331
234
Model GFC7000E Instruction Manual
APPENDIX A-2: Setup Variables For Serial I/O, Revision
E.0APPENDIX A-3: Warnings and Test Functions, Revision E.0
SETUP VARIABLE
NUMERIC
UNITS
DEFAULT VALUE
TEST_CHAN_ID
—
NONE
REMOTE_CAL_MODE
—
LOW
PASS_ENABLE
—
OFF
STABIL_GAS
—
CO
STABIL_FREQ
Seconds
STABIL_SAMPLES
0
VALUE RANGE
DESCRIPTION
NONE,
CO MEASURE,
CO REFERENCE,
VACUUM
PRESSURE,
SAMPLE
PRESSURE,
SAMPLE FLOW,
SAMPLE TEMP,
BENCH TEMP,
WHEEL TEMP,
CHASSIS TEMP,
PHT DRIVE
Diagnostic analog output ID.
LOW,
HIGH
Range to calibrate during
contact closure or Hessen
calibration.
ON, OFF
ON enables passwords; OFF
disables them.
CO,
CO2
Selects gas for stability
measurement.
10
1–300
Stability measurement
sampling frequency.
Samples
25
2–40
Number of samples in
concentration stability
reading.
PHOTO_TEMP_SET
mV
2000
Warnings: 500–3000
0–5000
Photometer temperature
warning limits. Set point is
not used.
SAMP_PRESS_SET
In-Hg
29.92
Warnings: 15–35
0–100
Sample pressure warning
limits. Set point is not used.
PURGE_PRESS_SET
PSIG
7.5
Warnings: 2.5–12.5
0–100
Purge pressure warning
limits. Set point is not used.
SAMP_FLOW_SET
cc/m
750, 800 3, 8, 3000 4,
2000 13
Warnings:
500–1000, 500–
12003,8,
1000–50004,
400–1000 8,9,
1500–2500 13
0–5000
Sample flow warning limits.
Set point is not used.
SAMP_FLOW_SLOPE
—
1
0.001–100
Slope term to correct sample
flow rate.
VAC_SAMP_RATIO
—
0.53,
0.61 13
0.1–2
Maximum vacuum pressure /
sample pressure ratio for
valid sample flow calculation.
SAMP_TEMP_SET
ºC
30
Warnings: 10.1–100
0–100
Sample temperature warning
limits. Set point is not used.
BOX_SET
ºC
30
Warnings: 5–48
0–100
Internal box temperature
warning limits. Set point is
not used.
BENCH_CYCLE
Seconds
2
0.5–30
Optical bench temperature
control cycle period.
BENCH_PROP
1/ºC
5
0–100
Optical bench temperature
PID proportional coefficient.
Proportional band is the
reciprocal of this setting.
BENCH_INTEG
—
0.5
0–100
Optical bench temperature
PID integral coefficient.
045840110 Rev B.3
0
0
235
Model GFC7000E Instruction Manual
APPENDIX A-2: Setup Variables For Serial I/O, Revision
E.0APPENDIX A-3: Warnings and Test Functions, Revision E.0
SETUP VARIABLE
NUMERIC
UNITS
DEFAULT VALUE
BENCH_DERIV
—
2
WHEEL_CYCLE
Seconds
WHEEL_PROP
1/ºC
WHEEL_INTEG
—
WHEEL_DERIV
—
2
TPC_ENABLE
—
CONC_LIN_ENABLE
—
SERIAL_NUMBER
—
“00000000 ”
DISP_INTENSITY
—
HIGH
I2C_RESET_ENABLE
—
ON
FACTORY_OPT
BitFlag
045840110 Rev B.3
VALUE RANGE
DESCRIPTION
0–100
Optical bench temperature
PID derivative coefficient.
0.5–30
Wheel temperature control
cycle period.
0–100
Wheel temperature PID
proportional coefficient.
Proportional band is the
reciprocal of this setting.
0–100
Wheel temperature PID
integral coefficient.
0–100
Wheel temperature PID
derivative coefficient.
ON
OFF, ON
ON enables temperature/
pressure compensation; OFF
disables it.
ON
OFF, ON
ON enables concentration
linearization; OFF disables it.
Any character in
the allowed
character set. Up
to 100 characters
long.
Unique serial number for
instrument.
HIGH,
MED,
LOW,
DIM
Front panel display intensity.
OFF, ON
ON enables automatic reset
of the I2C bus in the event of
communication failures; OFF
disables automatic reset.
0–65535
Factory option flags. Add
values to combine flags.
1 = enable dilution factor
2 = zero/span valves
installed
4 = conc. alarms routed to
relays
8 = enable linearity
adjustment factor
16 = display units in
concentration field
32 = enable softwarecontrolled maintenance mode
64 3, 5 = span valve installed
128 = enable switchcontrolled maintenance mode
2048 = enable Internet
option 7
4096 = use “old” style
numeric data entry menus
when editing conc. table
4, 2
4
1
0.135, 0.035
0, 4
0
9
4
0
236
Model GFC7000E Instruction Manual
APPENDIX A-2: Setup Variables For Serial I/O, Revision
E.0APPENDIX A-3: Warnings and Test Functions, Revision E.0
0
1
2
3
4
5
6
7
8
9
10
11
12
SETUP VARIABLE
NUMERIC
UNITS
DEFAULT VALUE
VALUE RANGE
DESCRIPTION
CLOCK_FORMAT
—
“TIME=%H:%M:%S”
Any character in
the allowed
character set. Up
to 100 characters
long.
Time-of-day clock format
flags. Enclose value in double
quotes (") when setting from
the RS-232 interface.
“%a” = Abbreviated weekday
name.
“%b” = Abbreviated month
name.
“%d” = Day of month as
decimal number (01 – 31).
“%H” = Hour in 24-hour
format (00 – 23).
“%I” = Hour in 12-hour
format (01 – 12).
“%j” = Day of year as
decimal number (001 – 366).
“%m” = Month as decimal
number (01 – 12).
“%M” = Minute as decimal
number (00 – 59).
“%p” = A.M./P.M. indicator
for 12-hour clock.
“%S” = Second as decimal
number (00 – 59).
“%w” = Weekday as decimal
number (0 – 6; Sunday is 0).
“%y” = Year without century,
as decimal number (00 – 99).
“%Y” = Year with century, as
decimal number.
“%%” = Percent sign.
ALARM_TRIGGER3,4
Cycles
10
1–100
Concentration alarm trigger
sensitivity adjustment.
REF_SDEV_LIMIT
mV
50
0.1–500
Reference detector standard
deviation must be below this
limit to switch out of startup
mode.
Enclose value in double quotes (") when setting from the RS-232 interface.
Multi-range modes.
Hessen protocol.
M300EH.
GFC7000E.
M300ES.
Fixed range special.
iCHIP option.
M300EM.
FC7000E.
M306E.
Must power-cycle instrument for these options to take effect.
GFC7000EU.
045840110 Rev B.3
237
Model GFC7000E Instruction Manual
APPENDIX A-3: Warnings and Test Functions, Revision
E.0APPENDIX A-3: Warnings and Test Functions, Revision E.0
APPENDIX A-3: Warnings and Test Functions, Revision E.0
Table A-2:
NAME
GFC7000E Warning Messages, Revision E.0
MESSAGE TEXT
WSYSRES
SYSTEM RESET
WDATAINIT
DATA INITIALIZED
WCONFIGINIT
DESCRIPTION
Instrument was power-cycled or the CPU was reset.
Data storage was erased.
CONFIG INITIALIZED
Configuration storage was reset to factory configuration
or erased.
SOURCE WARNING
Reference reading below 1250 mV (50 mV in N2O, CO2,
and high level instruments) or above 4950 mV in normal
sample mode.
AZERO WARN 1.001
Auto-reference ratio below limit specified by ZERO_LIMIT
variable.
WBENCHTEMP
BENCH TEMP
WARNING
Bench temperature outside of warning limits specified by
BENCH_SET variable.
WWHEELTEMP
WHEEL TEMP
WARNING
Wheel temperature outside of warning limits specified by
WHEEL_SET variable.
WSOURCE
WAUTOZERO
WSAMPFLOW
4, 5
6
SAMPLE FLOW WARN
Sample flow outside of warning limits specified by
SAMP_FLOW_SET variable.
WSAMPPRESS
SAMPLE PRESS WARN
Sample pressure outside of warning limits specified by
SAMP_PRESS_SET variable.
WSAMPTEMP
SAMPLE TEMP WARN
Sample temperature outside of warning limits specified
by SAMP_TEMP_SET variable.
PURGE PRESS WARN
Purge pressure outside of warning limits specified by
PURGE_PRESS_SET variable.
BOX TEMP WARNING
Chassis temperature outside of warning limits specified
by BOX_SET variable.
WPURGEPRESS
WBOXTEMP
9
WSYNC
SYNC WARNING
WPHOTOTEMP
PHOTO TEMP
WARNING
SYNC_OK digital input is off.
Photometer temperature outside of warning limits
specified by PHOTO_TEMP_SET variable.
WDYNZERO
CANNOT DYN ZERO
Contact closure zero calibration failed while DYN_ZERO
was set to ON.
WDYNSPAN
CANNOT DYN SPAN
Contact closure span calibration failed while DYN_SPAN
was set to ON.
WREARBOARD
REAR BOARD NOT DET
WRELAYBOARD
RELAY BOARD WARN
Firmware is unable to communicate with the relay board.
WFRONTPANEL
FRONT PANEL WARN
Firmware is unable to communicate with the front panel.
WANALOGCAL
ANALOG CAL WARNING
045840110 Rev B.3
Rear board was not detected during power up.
The A/D or at least one D/A channel has not been
calibrated.
238
Model GFC7000E Instruction Manual
Table A-3:
GFC7000E Test Functions, Revision
E.0APPENDIX A-3: Warnings and Test Functions, Revision E.0
Table A-3:
GFC7000E Test Functions, Revision E.0
TEST FUNCTION
NAME1
MESSAGE TEXT
RANGE
RANGE=50.0 PPM 3
CO RANGE=50.0 PPM 3, 7
RANGE1
RANGE1=50.0 PPM 3
CO RANGE1=50.0 PPM 3, 7
D/A #1 range in dual range mode.
RANGE2
RANGE2=50.0 PPM 3
CO RANGE2=50.0 PPM 3, 7
D/A #2 range in dual range mode.
RANGE3
CO2 RANGE=50.0 PPM 3, 7
D/A #3 range.
3
STABIL=0.0 PPM
CO/CO2 STB=0.0 PPM 3,7
RESPONSE 2
RSP=0.20(0.00) SEC
COMEAS
CO MEAS=4125.0 MV
Detector measure reading.
COREF
CO REF=3750.0 MV
Detector reference reading.
MRRATIO
MR RATIO=1.100
4, 5
SAMPPRESS
PURGEPRESS
VACUUM
9
8
SAMPFLOW
6
4
5
6
7
8
9
Instrument response. Length of each signal processing loop.
Time in parenthesis is standard deviation.
Measure/reference ratio.
AZERO RATIO=1.234
Measure/reference ratio during auto-reference.
PRES=29.9 IN-HG-A
Sample pressure.
PURGE=7.5 PSIG
Purge pressure
VAC=6.8 IN-HG-A
Vacuum pressure.
SAMP FL=751 CC/M
Sample flow rate.
SAMPTEMP
SAMPLE TEMP=26.8 C
Sample temperature.
BENCH TEMP=48.1 C
Bench temperature.
WHEELTEMP
WHEEL TEMP=68.1 C
Wheel temperature.
BOXTEMP
BOX TEMP=26.8 C
PHOTOTEMP
PHT DRIVE=2500.0 MV
COOFFSET
3
Concentration stability (standard deviation based on setting of
STABIL_FREQ and STABIL_SAMPLES).
BENCHTEMP
COSLOPE
2
D/A range in single or auto-range modes.
STABILITY
AUTOZERO
1
DESCRIPTION
SLOPE=1.000
CO SLOPE=1.000
Internal chassis temperature.
CO slope for current range, computed during zero/span
calibration.
7
OFFSET=0.000
CO OFFSET=0.000
CO2SLOPE
CO2 SLOPE=1.000
CO2OFFSET
CO2 OFFSET=0.000
Photometer temperature.
7
7
7
CO offset for current range, computed during zero/span
calibration.
CO2 slope for current range, computed during zero/span
calibration.
CO2 offset for current range, computed during zero/span
calibration.
CO
CO=17.7 PPM 3
CO concentration for current range.
CO2
CO2=15.0 % 7
CO2 concentration for current range.
TESTCHAN
TEST=1751.4 MV
CLOCKTIME
TIME=09:52:20
Value output to TEST_OUTPUT analog output, selected with
TEST_CHAN_ID variable.
Current instrument time of day clock.
The name is used to request a message via the RS-232 interface, as in “T BOXTEMP”.
Engineering software.
Current instrument units.
M300ES.
M300EH.
Except GFC7000EU (APR version).
M306E.
Sample pressure or differential pressure flow measurement option.
GFC7000E.
045840110 Rev B.3
239
Model 360E Instruction Manual
APPENDIX A-4: MGFC7000E Signal I/O Definitions, Revision E.0
APPENDIX A-4: MGFC7000E Signal I/O Definitions, Revision E.0
Table A-4:
GFC7000E Signal I/O Definitions, Revision E.0
SIGNAL NAME
BIT OR CHANNEL
NUMBER
SYNC_OK
DESCRIPTION
0
1–7
1 = sync. OK
0 = sync. error
Spare
Internal outputs, U8, J108, pins 1–8 = bits 0–7, default I/O
ELEC_TEST
0
1 = electrical test on
0 = off
DARK_CAL
1
1 = dark calibration on
0 = off
2–5
Spare
I2C_RESET
6
1 = reset I2C peripherals
0 = normal
I2C_DRV_RST
7
0 = hardware reset 8584 chip
1 = normal
Control inputs, U11, J1004, pins 1–6 = bits 0–5, default I/O address 321 hex
EXT_ZERO_CAL
0
0 = go into zero calibration
1 = exit zero calibration
EXT_SPAN_CAL
1
0 = go into span calibration
1 = exit span calibration
REMOTE_RANGE_HI
2
0 = remote select high range
1 = default range
3–5
Spare
6–7
Always 1
Control inputs, U14, J1006, pins 1–6 = bits 0–5, default I/O
0–5
Spare
6–7
Always 1
Control outputs, U17, J1008, pins 1–8 = bits 0–7, default I/
0–7
Spare
Control outputs, U21, J1008, pins 9–12 = bits 0–3, default I/
0–3
Spare
Alarm outputs, U21, J1009, pins 1–12 = bits 4–7, default I/O
ST_SYSTEM_OK2
4
1 = system OK
0 = any alarm condition or in diagnostics mo
ST_CONC_ALARM_1
5
1 = conc. limit 1 exceeded
0 = conc. OK
ST_CONC_ALARM_2
6
1 = conc. limit 2 exceeded
0 = conc. OK
7
Spare
2+8
2+8
A status outputs, U24, J1017, pins 1–8 = bits 0–7, default I/
045840110 Rev B.3
ST_SYSTEM_OK
0
0 = system OK
1 = any alarm condition
ST_CONC_VALID
1
0 = conc. valid
1 = hold off or other conditions
ST_HIGH_RANGE
2
0 = high auto-range in use
1 = low auto-range
ST_ZERO_CAL
3
0 = in zero calibration
1 = not in zero
240
Model 360E Instruction Manual
SIGNAL NAME
APPENDIX A-4: MGFC7000E Signal I/O Definitions, Revision E.0
BIT OR CHANNEL
NUMBER
DESCRIPTION
ST_SPAN_CAL
4
0 = in span calibration
1 = not in span
ST_DIAG_MODE
5
0 = in diagnostic mode
1 = not in diagnostic mode
ST_CONC_ALARM_1
6
0 = conc. limit 1 exceeded
1 = conc. OK
ST_CONC_ALARM_2
7
0 = conc. limit 2 exceeded
1 = conc. OK
2
2
B status outputs, U27, J1018, pins 1–8 = bits 0–7, default I/
ST_AUTO_REF
2, 3
0
0 = in auto-reference mode
1 = not in auto-reference mode
1–7
Spare
Front panel I2C keyboard, default I2C address 4
MAINT_MODE
5 (input)
0 = maintenance mode
1 = normal mode
LANG2_SELECT
6 (input)
0 = select second language
1 = select first language (English)
SAMPLE_LED
8 (output)
0 = sample LED on
1 = off
CAL_LED
9 (output)
0 = cal. LED on
1 = off
FAULT_LED
10 (output)
0 = fault LED on
1 = off
AUDIBLE_BEEPER
14 (output)
0 = beeper on (for diagnostic testing only)
1 = off
Relay board digital output (PCF8574), default I2C add
RELAY_WATCHDOG
0
Alternate between 0 and 1 at least every 5 se
relay board active
WHEEL_HTR
1
0 = wheel heater on
1 = off
BENCH_HTR
2
0 = optical bench heater on
1 = off
3
0 = O2 sensor cell heater on
1 = off
CAL_VALVE
4
0 = let cal. gas in
1 = let sample gas in
SPAN_VALVE
5
0 = let span gas in
1 = let zero gas in
ZERO_SCRUB_VALV
E2
6
0 = open zero scrubber valve
1 = close
SHUTOFF_VALVE
6
0 = energize shutoff valve
1 = de-energize
IR_SOURCE_ON
7
0 = IR source on
1 = off
O2_CELL_HEATER
5
Rear board primary MUX analog inputs
SAMPLE_PRESSURE
1
0
Sample pressure
Vacuum pressure
Purge pressure
1
045840110 Rev B.3
241
Model 360E Instruction Manual
SIGNAL NAME
APPENDIX A-4: MGFC7000E Signal I/O Definitions, Revision E.0
BIT OR CHANNEL
NUMBER
DESCRIPTION
CO_MEASURE
2
Detector measure reading
CO_REFERENCE
3
Detector reference reading
4
Temperature MUX
SAMPLE_FLOW
5
Sample flow
PHOTO_TEMP
6
Photometer detector temperature
TEST_INPUT_7
7
Diagnostic test input
TEST_INPUT_8
8
Diagnostic test input
REF_4096_MV
9
4.096V reference from MAX6241
O2_SENSOR
5
CO2_SENSOR
7
REF_GND
10
O2 concentration sensor
11
Spare
12
CO2 concentration sensor
13
Spare
14
DAC loopback MUX
15
Ground reference
Rear board temperature MUX analog input
BOX_TEMP
0
Internal box temperature
SAMPLE_TEMP
1
Sample temperature
BENCH_TEMP
2
Optical bench temperature
WHEEL_TEMP
3
Wheel temperature
TEMP_INPUT_4
4
Diagnostic temperature input
TEMP_INPUT_5
5
Diagnostic temperature input
O2_CELL_TEMP
6
O2 sensor cell temperature
7
Spare
Rear board DAC MUX analog inputs
DAC_CHAN_0
0
DAC channel 0 loopback
DAC_CHAN_1
1
DAC channel 1 loopback
DAC_CHAN_2
2
DAC channel 2 loopback
DAC_CHAN_3
3
DAC channel 3 loopback
Rear board analog outputs
CONC_OUT_1
0
Concentration output #1
CONC_OUT_2
1
Concentration output #2
TEST_OUTPUT
2
Test measurement output
CONC_OUT_3
1
2
3
4
5
6
7
8
9
10
045840110 Rev B.3
7
3
Concentration output #3 (CO2)
Hessen protocol.
M300EH.
M300ES.
M320E.
O2 option.
Sample pressure or differential pressure flow measurement option.
M306E.
Factory option enables concentration alarms on relay outputs.
GFC7000E.
GFC7000E.
242
Model 360E Instruction Manual
APPENDIX A-5: GFC7000E iDAS Functions, Revision E.0
APPENDIX A-5: GFC7000E iDAS Functions, Revision E.0
Table A-5:
MGFC7000E DAS Trigger Events, Revision E.0
NAME
DESCRIPTION
ATIMER
Automatic timer expired
EXITZR
Exit zero calibration mode
EXITSP
Exit span calibration mode
EXITMP
Exit multi-point calibration mode
EXITC2
5
Exit CO2 calibration mode
SLPCHG
Slope and offset recalculated
5
CO2SLP
EXITDG
Exit diagnostic mode
SOURCW
AZEROW
CO2 slope and offset recalculated
1, 2
Source warning
Auto-zero warning
CONCW1
1, 3, 4
Concentration limit 1 exceeded
CONCW2
1, 3, 4
Concentration limit 2 exceeded
SYNCW
Sync warning
BNTMPW
Bench temperature warning
WTEMPW
Wheel temperature warning
STEMPW
Sample temperature warning
6
SFLOWW
SPRESW
PPRESW
1
2
3
4
5
6
045840110 Rev B.3
4
Sample flow warning
Sample pressure warning
Purge pressure warning
BTEMPW
Box temperature warning
PTEMPW
Photometer detector temperature warning
M300EH.
M300ES.
M320E.
GFC7000E.
M306E.
Except GFC7000EU (APR version).
243
Model 360E Instruction Manual
Table A-6:
APPENDIX A-5: GFC7000E iDAS Functions, Revision E.0
MGFC7000E iDAS Functions, Revision E.0
NAME
DESCRIPTION
Detector measure reading
mV
DETREF
Detector reference reading
mV
RATIO
M/R ratio.
None
SLOPE1
Slope for range #1
None
SLOPE2
Slope for range #2
None
CO2 slope
None
Offset for range #1
None
Offset for range #2
None
CO2SLP
5
OFSET1
OFSET2
CO2OFS
AZERO
5
1,2
ZSCNC1
Concentration for range #1 during zero/span calibration, just before
computing new slope and offset
PPM
ZSCNC2
Concentration for range #2 during zero/span calibration, just before
computing new slope and offset
PPM
5
Concentration for range #1
PPM
Concentration for range #2
PPM
5
7
%
STABIL
Concentration stability
Bench temperature
°C
WTEMP
Wheel temperature
°C
SMPTMP
Sample temperature
°C
6
1, 3, 6
PRGPRS
6
CO2 concentration
BNTEMP
SMPPRS
5
%
CONC2
VACUUM
4
CO2 concentration during zero/span calibration, just before
computing new slope and offset
CONC1
SMPFLW
3
%
M/R
CO2CNC
2
CO2 offset
Auto-zero reading
CO2ZSC
1
UNITS
DETMES
4
Sample flow
PPM
cc/m
Sample pressure
"Hg
Vacuum pressure
"Hg
Purge pressure
PSIG
BOXTMP
Internal box temperature
°C
PHTDRV
Photometer detector temperature drive
mV
TEST7
Diagnostic test input (TEST_INPUT_7)
mV
TEST8
Diagnostic test input (TEST_INPUT_8)
mV
TEMP4
Diagnostic temperature input (TEMP_INPUT_4)
°C
TEMP5
Diagnostic temperature input (TEMP_INPUT_5)
°C
REFGND
Ground reference (REF_GND)
mV
RF4096
4096 mV reference (REF_4096_MV)
mV
BNCDTY
Bench temperature control duty cycle
Fraction
0 = off,
1 = on
WHLDTY
Wheel temperature control duty cycle
Fraction
M300EH.
M300ES.
M320E.
GFC7000E.
M306E.
Except GFC7000EU (APR version).
The units, including the concentration units, are always fixed, regardless of the current instrument
units.
045840110 Rev B.3
244
Model 360E Instruction Manual
APPENDIX A-6: Terminal Command Designators, Revision E.0
APPENDIX A-6: Terminal Command Designators, Revision E.0
Table A-7:
COMMAND
Terminal Command Designators, Revision E.0
ADDITIONAL COMMAND SYNTAX
? [ID]
LOGON [ID]
Display help screen and commands list
password
LOGOFF [ID]
T [ID]
W [ID]
C [ID]
D [ID]
V [ID]
DESCRIPTION
Establish connection to instrument
Terminate connection to instrument
SET ALL|name|hexmask
Display test(s)
LIST [ALL|name|hexmask] [NAMES|HEX]
Print test(s) to screen
name
Print single test
CLEAR ALL|name|hexmask
Disable test(s)
SET ALL|name|hexmask
Display warning(s)
LIST [ALL|name|hexmask] [NAMES|HEX]
Print warning(s)
name
Clear single warning
CLEAR ALL|name|hexmask
Clear warning(s)
ZERO|LOWSPAN|SPAN [1|2]
Enter calibration mode
ASEQ number
Execute automatic sequence
COMPUTE ZERO|SPAN
Compute new slope/offset
EXIT
Exit calibration mode
ABORT
Abort calibration sequence
LIST
Print all I/O signals
name[=value]
Examine or set I/O signal
LIST NAMES
Print names of all diagnostic tests
ENTER name
Execute diagnostic test
EXIT
Exit diagnostic test
RESET [DATA] [CONFIG] [exitcode]
Reset instrument
PRINT ["name"] [SCRIPT]
Print iDAS configuration
RECORDS ["name"]
Print number of iDAS records
REPORT ["name"] [RECORDS=number]
[FROM=<start date>][TO=<end
date>][VERBOSE|COMPACT|HEX] (Print DAS
records)(date format: MM/DD/YYYY(or YY)
[HH:MM:SS]
Print iDAS records
CANCEL
Halt printing iDAS records
LIST
Print setup variables
name[=value [warn_low [warn_high]]]
Modify variable
name="value"
Modify enumerated variable
CONFIG
Print instrument configuration
MAINT ON|OFF
Enter/exit maintenance mode
MODE
Print current instrument mode
DASBEGIN [<data channel definitions>] DASEND
Upload iDAS configuration
CHANNELBEGIN propertylist CHANNELEND
Upload single iDAS channel
CHANNELDELETE ["name"]
Delete iDAS channels
The command syntax follows the command type, separated by a space character. Strings in [brackets] are
optional designators. The following key assignments also apply.
045840110 Rev B.3
245
Model 360E Instruction Manual
Table A-8:
APPENDIX A-6: Terminal Command Designators, Revision E.0
Terminal Key Assignments, Revision E.0
TERMINAL KEY ASSIGNMENTS
ESC
Abort line
CR (ENTER)
Execute command
Ctrl-C
Switch to computer mode
COMPUTER MODE KEY ASSIGNMENTS
045840110 Rev B.3
LF (line feed)
Execute command
Ctrl-T
Switch to terminal mode
246
Model 360E Instruction Manual
045840110 Rev B.3
APPENDIX A-6: Terminal Command Designators, Revision E.0
247
Model GFC7000E Instruction Manual
APPENDIX B - GFC7000E Spare Parts List
APPENDIX B - GFC7000E Spare Parts List
NOTE
The spare parts list for the Model GFC7000E is currently being compiled.
For information is spare parts please contact Teledyne Analytical Instruments customer
service department at
16830 Chestnut St., City of Industry, Ca. 91748
Phone: +1 626 961-9221 or 1-626-934-1500.
Fax: +1 626-961-2538
Email: [email protected].
045840120 Rev B.3
249
Model GFC7000E Instruction Manual
Appendix C - Repair Questionnaire - GFC7000E
Appendix C - Repair Questionnaire - GFC7000E
Company: _________________________
Phone Number: ___________
Contact Name: _____________________________
Fax Number: _____________
Email: ____________________
Site Address: __________________________________________________________________
Can we connect to the instrument? If so, provide IP address or modem #:___________________
Model GFC7000E Serial Number:_________________
Firmware revision: _________________
The serial number can be found on the back of the instrument, the firmware revision is displayed in the upper left corner of the
display when pressing SETUP on the front panel (Example: C.3).
1. List all front panel error/warning messages:_________________________________________
______________________________________________________________________________
2. Please complete the following table: (Depending on options installed, not all test parameters
shown below may be available in your instrument)
PARAMETER
RECORDED
VALUE
ACCEPTABLE
VALUE
RANGE
ppb/ppm 50 ppb - 20 ppm
STABIL
ppb ≤ 1 ppb with zero
air
SAMP FL
cm³/min
PARAMETER
RECORDED
VALUE
ACCEPTABLE
VALUE
SLOPE
OFFSET
1.0 ± 0.3
mV
< 250
500 ± 50
HVPS
V
5500-900
-20 to 150
ETEST
mV
2000 ± 1000
PMT SIGNAL
WITH ZERO
AIR
mV
PMT SIGNAL
AT
SPAN GAS
CONC
mV
ppb/ppm
0-5000
0-20 000 ppb
OTEST
mV
2000 ± 1000
NORM PMT
AT
SPAN GAS
CONC
mV
ppb/ppm
0-5000
0-20 000 ppb
RCELL TEMP
°C
50 ± 1
2 000 to 4 000
BOX TEMP
°C
Ambient + ~5
PMT TEMP
°C
7±2
IZS TEMP
°C
50 ± 3
UV LAMP
STR. LGT
mV
ppm ≤ 100 ppb/ zero
air
DARK PMT
mV
-50 to 200
DARK LAMP
mV
-50 to 200
3. Has the analyzer been checked for leaks? Yes
No
For proper flows? Yes
No
4. What are the failure symptoms? _________________________________________________
______________________________________________________________________________
______________________________________________________ Continue on back if necessary
5. Which tests have you done trying to solve the problem? _______________________________
________________________________________________________ Continue on back if necessary
6. If possible, fax a portion of a strip chart or email a data file to customer service.
CUSTOMER SERVICE CONTACT INFORMATION: 16830 Chestnut St., City of Industry, Ca. 91748
PHONE: +1 626-961-9221 or 1-626-934-1500. FAX: +1 626-961-2538.
EMAIL: [email protected].
You can access and submit an online version of this form at http://www.teledyne-api.com/forms/csformGFC7000E.asp
048450130 Rev A1
251
Notes and further information: _____________________________________________________
______________________________________________________________________________
______________________________________________________________________________
______________________________________________________________________________
______________________________________________________________________________
______________________________________________________________________________
______________________________________________________________________________
______________________________________________________________________________
______________________________________________________________________________
______________________________________________________________________________
______________________________________________________________________________
______________________________________________________________________________
______________________________________________________________________________
______________________________________________________________________________
______________________________________________________________________________
______________________________________________________________________________
______________________________________________________________________________
______________________________________________________________________________
______________________________________________________________________________
______________________________________________________________________________
______________________________________________________________________________
______________________________________________________________________________
______________________________________________________________________________
______________________________________________________________________________
______________________________________________________________________________
______________________________________________________________________________
______________________________________________________________________________
______________________________________________________________________________
______________________________________________________________________________
______________________________________________________________________________
______________________________________________________________________________
______________________________________________________________________________
______________________________________________________________________________
______________________________________________________________________________
______________________________________________________________________________
______________________________________________________________________________
______________________________________________________________________________
045150130 Rev A1
252
Model GFC7000E Instruction Manual
APPENDIX D - ELECTRONIC SCHEMATICS
APPENDIX D - ELECTRONIC SCHEMATICS
Table D-1:
DOCUMENT #
04217
04216
04136
03297
04070
03632
03976
04259
04003
04089
04468
045840140 Rev A1
List of Included Electronic Schematics
DOCUMENT TITLE
Interconnect List - M300E SNs >=100
Interconnect Drawing - M300E SNs >=100
PCA, 04135 Rev A, M300E Relay
PCA, 03296, IR Photodetector Preamp and Sync Demodulator
PCA, 04069, Motherboard, E-series
PCA, 03631, 0-20mA driver
PCA, 03975, Keyboard & Display Driver
PCA, 04258, Keyboard & Display Driver
PCA, 04003, Pressure/Flow Transducer Interface
PCA, 04088, Opto Pickup Interface
PCA, 04467, Analog Output Series Res
253
Model GFC7000E Instruction Manual
User Notes
04584 Rev A1
254