1
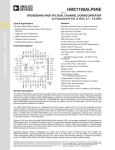
Model 90100
TRACKER™ System
Operators Manual
May 2006
Manual No. 37826 Rev. 9
©2006 Fluke Corporation, All rights reserved. Printed in U.S.A.
All product names are trademarks of their respective companies
Fluke Biomedical
Radiation Management Services
6045 Cochran Road
Cleveland, Ohio 44139
440.498.2564
www.flukebiomedical.com/rms
Table of Contents
Section 1: General Information ...................................................................................... 1-1
1.1
Introduction .................................................................................................. 1-1
1.2
Features....................................................................................................... 1-2
1.3
Before You Start - Safety Precautions ......................................................... 1-3
1.4
Safety Terms ............................................................................................... 1-3
1.5
Manual Addenda.......................................................................................... 1-3
1.6
Specifications............................................................................................... 1-3
1.6.1
Model 35300A Detector.......................................................................... 1-3
1.6.2
Model 35360A Tracker Display .............................................................. 1-5
1.6.3
Interface Cable – Detector To Display.................................................... 1-6
1.7
Unpacking And Inspection ........................................................................... 1-6
Section 2: Operation ....................................................................................................... 2-1
2.1
Introduction .................................................................................................. 2-1
2.2
Rear Panel Familiarization........................................................................... 2-2
2.2.1
Powering The System ............................................................................ 2-2
2.2.2
Detector Input ......................................................................................... 2-2
2.2.3
RS-232 Computer Interface.................................................................... 2-4
2.3
Positioning The Model 35300A Detector In The Beam ................................ 2-4
2.4
Operation Instructions.................................................................................. 2-6
2.4.1
Front Panel Controls............................................................................... 2-6
2.4.2
Powering Up The Model 35360A Tracker Display .................................. 2-8
2.4.3
Powering Down The Model 35360A Tracker Display ............................. 2-8
2.4.4
Using The Test/Detector Button ............................................................. 2-8
2.4.5
Using The Units Select Button................................................................ 2-9
2.4.6
Using The Air Density Button ............................................................... 2-10
2.4.7
Using The Gain Select Button .............................................................. 2-10
2.4.8
Using The Measure Select Button ........................................................ 2-11
2.4.8.1
Absolute Measurements ................................................................. 2-11
2.4.8.2
Percent-Of-Center Measurements .................................................. 2-12
2.4.8.3
Underranging And Overranging Conditions .................................... 2-13
2.4.9
Battery And Bias Annunciators............................................................. 2-13
2.4.10
Gain Setting Mode................................................................................ 2-14
2.4.10.1
Changing Front Panel Gain Factor’s From The Measurement ....... 2-15
2.4.10.2
Saving the FPGF Changes ............................................................. 2-15
2.4.10.3
Aborting the FPGF Changes ........................................................... 2-15
i
Section 3: Theory of Operation ...................................................................................... 3-1
3.1
Introduction .................................................................................................. 3-1
3.2
Overall Function Description Of The Model 35360A TRACKER Display ..... 3-1
3.2.1
Power Supply ......................................................................................... 3-2
3.2.2
300 Volt Electronic Bias Supply.............................................................. 3-3
3.2.3
Front Panel Switches.............................................................................. 3-3
3.2.4
Processor ............................................................................................... 3-3
3.2.5
VFD Display ........................................................................................... 3-3
3.2.6
Serial Communications Port ................................................................... 3-4
3.2.7
Electrometer ........................................................................................... 3-4
3.2.8
Multiplexer and A/D Converter ............................................................... 3-4
3.3
Model 35300A Ion Chamber Detectors........................................................ 3-5
3.4
Air Density Corrections ................................................................................ 3-5
3.5
Basic Operating Equations .......................................................................... 3-6
3.5.1
Charge.................................................................................................... 3-6
3.5.2
Current ................................................................................................... 3-6
3.5.3
Absolute Dose ........................................................................................ 3-6
3.5.4
Absolute Dose Rate................................................................................ 3-6
3.5.5
Percent-of-Center ................................................................................... 3-6
3.6
Basic Operating Quantities .......................................................................... 3-7
Section 4: Maintenance and Service ............................................................................. 4-1
4.1
Introduction .................................................................................................. 4-1
4.2
Troubleshooting ........................................................................................... 4-2
4.3
Line Fuse Replacement ............................................................................... 4-7
4.4
Interface Connector Cleaning ...................................................................... 4-9
4.5
Cleaning The Instrument.............................................................................. 4-9
4.6
Replaceable Parts Information..................................................................... 4-9
4.7
Recalibration & Repair Information/Technical Assistance.......................... 4-10
Section 5: Customization ............................................................................................... 5-1
5.1
Introduction .................................................................................................. 5-1
5.2
Make A Working Disk................................................................................... 5-2
5.3
Connection To The Computer...................................................................... 5-2
5.4
Starting The Customization Software........................................................... 5-2
5.5
Screen Formats ........................................................................................... 5-2
5.6
Definitions .................................................................................................... 5-5
5.7
Setting The Electrometer Gains And Offsets ............................................... 5-6
5.8
Usage Examples.......................................................................................... 5-8
5.9
Errors ......................................................................................................... 5-10
Appendix A: Using Build-Up ..........................................................................................A-1
A-1
Build-Up, Peg, And Retainer Kit Options ..................................................... A-1
ii
General Information
Introduction
1
Section 1
General Information
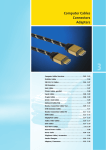
1.1 Introduction
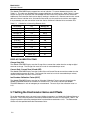
The Model 90100 TRACKER is a radiation measurement system intended for use in quality assurance
programs for high-energy accelerators and Co60 machines. While its ease of operation makes it ideal for
daily checks of beam constancy, symmetry, and flatness, its portability makes it a good choice for field
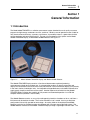
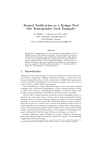
service engineers and consulting physicists. The two main components of the system are the Model
35360A TRACKER Display, and the Model 35300A Detector, see Figure 1-1.
Figure 1-1.
Model 35360A TRACKER Display and Model 35300A Detector
The 35360A TRACKER Display contains a five-channel electrometer capable of producing
measurements of both dose and dose rate. A microcontroller performs air density corrections and
displays the measurement results on the 4 line by 20 character vacuum fluorescent display (VFD) directly
in the user's choice of radiological units. An integrated rechargeable battery and a 300 V electronic bias
supply greatly simplify maintenance of the system. Another important feature built into the 35360A
TRACKER Display includes the capability for fully remote and automated operation via an RS-232
computer interface (software is not included).
The 35300A Detector contains an array of four orthogonally placed ion chambers on 10 cm radii from a
fifth isocentrally located ion chamber. The five ion chambers are of a vented, circular, parallel-plate
configuration and are fully guarded for low leakage. An overlay label on the outside of the 35300A
Detector marks the ion chamber locations for alignment with a therapy source light field system. The
35300A Detector connects to the 35360A TRACKER Display through a lightweight interface cable. This
1-1
Model 90100
Operators Manual
cable is of a design that provides a high degree of flexibility and allows it to flatten to fit under a treatment
room entrance door.
Included with each 90100 TRACKER System is an MS-DOS based Customization program that provides
a means of performing field customization and calibrations. Some of the items that may be field
customized include the measurement display units, temperature and pressure units, the ion chamber
calibration factors, and the number of minutes to power down. This program may also be used to
generate a printed report containing all of the customization and calibration settings.
A number of optional accessories including a carrying case for storage and transport, build-up plates of
various thickness/materials, and a build-up retaining hardware kit are available also.
1.2 Features
•
Measurement values from peripheral ion chambers may be displayed in either absolute dose
measurement units or as a percentage of the center ion chamber's measurement value.
•
A wide AC Line Input Range of 100 to 240 VAC and the use of an IEC 320/C13 style receptacle
provide worldwide operation by use of the proper line cord.
•
The levels of the internal 300 V electronic bias supply and the rechargeable battery supply are
continuously monitored. Annunciators appear on the display if an abnormal bias voltage or low
battery voltage level is detected.
•
All front panel settings are automatically stored at power down and restored at power up eliminating
the need to reconfigure the front panel settings upon each use.
•
Dose measurement values may be displayed in units of roentgens, rads, sieverts, grays, or monitor
units. Dose rate measurement values may be displayed in units of roentgens/min, rads/min,
sieverts/min, grays/min, or monitor units/min.
•
Front panel gain settings allow the user to easily match displayed measurement values to the linear
accelerator's monitor readout or to a precision calibration.
•
Precision five-channel electrometer provides ± 0.003% linearity and a long-term stability of better
than 0.25% of reading per year.
•
The system may be operated from either AC line power source or from its internal battery. The
batteries will be charged during use from AC line power.
•
A high performance rechargeable battery system provides 8 hours of continuous operation from a
3-hour charge. A low battery annunciator indicates when 30 minutes or less of operation remains.
1-2
General Information
Before You Start- Safety Precautions
1
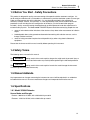
1.3 Before You Start - Safety Precautions
This product is designed for quality assurance testing of therapeutic radiation treatment machines. It is
not for machine calibration nor is it intended as a substitute for a precision dosimeter system (Farmer-type
Probe and Electrometer with official calibration). Its use should be restricted to the monitoring of
constancy of output, flatness, and symmetry. It is the responsibility of the user to establish the correct
procedure of uses including the initial configuration of the device, (via the Customization program
included). Quality assurance testing should be done by qualified personnel under the supervision of a
trained medical physicist. The Model 90100 TRACKER System should be used only by people who are:
•
aware of and understand the limitations of the device as they relate to the measurement of radiation
output;
•
knowledgeable about safety procedures observed when working with radiation sources, such as
therapy radiation machines;
•
aware of safety precautions required to avoid possible injury when using electrical/electronic
equipment.
Please take the time to read this manual carefully before operating this instrument.
1.4 Safety Terms
The following terms are used in this manual.
The WARNING heading used in this manual explains dangers that might result in personal injury or
death. Always read the associated information very carefully before performing the indicated procedure.
CAUTION heading used in this manual explains hazards that could damage the instrument.
The
Such damage may invalidate the warranty.
1.5 Manual Addenda
Any improvements or changes concerning the instrument or manual will be explained in an addendum
included with the manual. Be sure to note these changes and incorporate them into the manual.
1.6 Specifications
1.6.1 Model 35300A Detector
Source Modes and Energies
Photons: 300 keV to 25 MeV, with suitable build-up material
Electrons: 2 MeV to 25 MeV, with suitable build-up material
1-3
Model 90100
Operators Manual
Recommended Operation Conditions
Source Distance: 100 cm
Collimated Field Size: 25 × 25 cm
Source Dose Rate Range: 50 to 500 rads/min
Nominal Ion Chamber Characteristics
Wall and Window Material: Continental Polymers ACRYCAL-CP or equivalent
Window Area Density: 600 mg/sq cm (0.51 cm acrylic plastic)
Window Transmission: 95% for 662 keV photons; for electrons, transmission through window occurs
above 1.5 MeV.
Sensitivity: 3.52 R/nC at 22°C and 760 mm Hg
Active Volume: 0.93 cc ±5%
Active Diameter: 1.162 cm
Active Cross-Sectional Area: 1.06 sq cm
Collector-to-Bias Separation: 0.44 cm
Ion Transit Time: 0.418 ms @ bias voltage of 300V
Collection Efficiency: >99% at 500 rads/min pulsed; >99.9% at 500 rads/min continuous
Leakage: Less than 0.5 pA over the full operating temperature range
Ion Chamber Factory Calibration
Method: Each of the 5 ion chambers within the detector array is calibrated by comparison with a
reference standard ion chamber in a Co60 beam. The comparison is performed in free air and results
in an R/nC Calibration Factor for each of the five ion chambers.
Comparison Standard: 0.6 cc NE Farmer Probe with 3 MeV buildup cap.
Uncertainty: 2.5% using IEC/NIST guidelines.
Mechanical Specifications
Detector Configuration: The detector array consists of four orthogonally placed ion chambers on 10 cm
radii from a fifth centrally located ion chamber.
Dimensions: 33.7 cm wide x 43.8 cm deep x 2.2 cm high (13.25 in. x 17.25 in. x 0.875 in.). Depth
dimension assumes handle is fully extended; height dimension assumes no accessory pegs or build-up
added.
Weight: 4 kg (8.8 lbs)
1-4
General Information
Specifications
1
1.6.2 Model 35360A TRACKER Display
Measurements Mode
The measurement mode is user-selected from the front panel prior to the start of the exposure.
Dose (rad): Electrometer is operated in integrating mode with capacitive feedback.
Dose Rate (rad/min): Electrometer is operated in non-integrating mode with resistive feedback.
Display Mode
The display mode is user-selected from the front panel and may be selected before, during, or following
the exposure.
Absolute: All five ion chamber measurement values are displayed in absolute dose measurement units
(typically rads or rad/min) as defined by the dose measurement unit's description.
Percent-of-Center: Only the center ion chamber measurement value is displayed in absolute dose
measurement units (typically rad or rad/min) as defined by the dose measurement unit's description.
Four peripheral ion chamber measurement values (top, bottom, left, and right) are displayed as a
percentage of the center ion chamber measurement value.
Electrometer / A-D Converter
Nominal Full Scale Output: 3 volts.
A/D Converter Resolution: 16 bits unipolar.
Nominal Full Scale and Sensitivity in Electrical Units:
A-D Dose
Full Scale
1000.0 nC ± 2%
A-D Dose
Sensitivity
0.015 nC/count
A-D Rate
Full Scale
1000.0 nC/min ± 2%
A-D Rate
Sensitivity
0.015 (nC/min)/count
An overrange indication will be displayed when the input current or charge have exceeded the full-scale
values. The full-scale value of any unit is guaranteed not to differ from nominal values by more than ±
2%.
Long Term Stability: Expected to be less than 0.25% of reading per year.
Non-linearity: Less than ± 0.4% of range.
Display Resolution: 0.003% of range (4-3/4 digits) for both dose and dose rate. Display resolution is
limited by the following relationship for all display units;
1 A-D Count ≤ 1 Display Count < 10 A-D Counts.
This relationship insures that the resolution of the measurement display values is as high as possible
without exceeding the inherent resolving capability of the
A-D converter.
Gain Temperature Stability: Less than ± 0.4% of reading over operating range of 10°C to 35°C.
Measurement Noise: Charge and Current measurement noise are less than ± 1 count at the display
exclusive of source noise effects. Typical effects from a Co60 source are on the order of ± 0.2 rad/min
at 100 rad/min. Source noise effects during dose rate measurements on a linear accelerator may be
excessive.
Measurement Accuracy: Fluke Biomedical factory calibration will provide a basic Charge (Current)
measurement accuracy of ±1% of reading ± 0.3 nC (± 0.3 nC /min) exclusive of long-term drift and
temperature effects. Similar results may be obtained in the field using a suitable calibration source
such as the Keithley Instruments, Inc. Model 263 Calibrator/Source and the included Customization
software.
Current Leakage: Less than 1 pA (typically 1 rad in 5 minutes)
Zero Offset Voltage: Factory trimmed to 0 counts at the display.
1-5
Model 90100
Operators Manual
Offset Temperature Drift: The zero offset voltage will drift less than ± 1 count at the display over the
operating range of 10°C to 35°C.
High Performance Battery Charger
Battery Type and Capacity: 6V (3 cell) Lead Acid (5 AH) provide 8 hours of continuous operation.
Recharge Time: Fast recharge time on the order of 2 - 3 hours even during operation.
Battery Life Span: On the order of 8-10 years due to multiple level charging circuit (2000
charge/discharge cycles typically).
Low Battery Annunciator: Displayed when 30 minutes or less of operation remains.
Environment
Operating: 0°C to 35°C, up to 70% relative humidity.
Storage: -25°C to +65°C.
Mechanical
Dimensions: 21.6 cm wide x 8.9 cm high x 26 cm deep (10 in. x 9.4 in. x 4 in.)
Weight: 5 kg (11 lbs.)
1.6.3 Interface Cable - Detector to Display
Part Number: 37783-X where X denotes cable length in meters.
Standard Length: 15 m and 30 m.
Maximum Total Length: 60 m ( 197 ft.).
Ion Chamber Signal Cable Type: Five channels of RG-174 low noise coaxial.
Leakage: Less than 0.5 pA over the full operating temperature range.
Connector Type: Display interface end has five AMP male coaxial connectors and three AMP male
single conductor connectors housed in a single DB-37 type housing. Detector interface end has a five
AMP female coaxial connectors and three AMP female single conductor connectors housed in a single
DB-37 type housing. Multiple cables may be interconnected to form other lengths.
Minimum Conduit Diameter: 7.6 cm (3 in.) without disassembly. Cable may be run through smaller
opening by using special tool for disassembly. Consult factory for further details.
Weight: 2.25 kg (5 lbs.) at 15 m (weight is approximately proportional to cable length for other lengths).
* Specifications subject to change without notice.
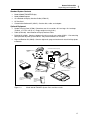
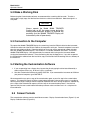
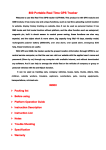
1.7 Unpacking and Inspection
The 90100 TRACKER System was carefully inspected before shipment. Upon receiving the 90100
TRACKER System, carefully unpack all items from the shipping carton and check for any obvious signs of
physical damage that might have occurred during shipment. Report any damage to the shipping agent at
once. Retain the original packing material in case reshipment becomes necessary. The items in Figure
1-3 are included with every 90100 TRACKER System.
1-6
General Information
Unpacking and Inspection
1
Standard System Contents
•
Model 35360A TRACKER Display
•
Model 35300A Detector
•
15 m Detector to Display Interface Cable (37783-15)
•
AC Line Cord
•
Customization Software Kit (37827): Contains disk, cable, and adapters.
Optional Equipment
•
System Carrying Case (37780): Dimensions are 41.9 cm wide x 45.2 cm long x 22.2 cm deep
(16.50 in. x 17.75 in. x 8.75 in.). Empty weight is 0.9 kg (2 lbs.).
•
Cable (37783-30): 30 m Detector to Display Interface Cable
•
Build-Up Kit (37825): Contains 10 pieces of 0.44 cm acrylic part number 37051-1. Kits containing
other quantities of plates, plate materials, and plate thicknesses are available.
•
Pegs and Retainer Kit (37825): Contains eight each, pegs and retainers for attach build-up plates
to detector.
Customization Software Kit (37827)
OPTIONAL:
Pegs and Retainer Kit
(37825)
OPTIONAL:
Build-Up Kit
(37825)
OPTIONAL:
System Carrying Case
(37780)
Model 35300A Detector
Model 35360A TRACKER Display
15m Detector to
Display Interface Cable
(37783-15)
Figure 1-3.
Model 90100
TRAKCER System
Instruction Manual
(37826)
Model 90100 TRACKER System Parts and Accessories
1-7
Model 90100
Operators Manual
(Blank page)
Operation
Introduction
2
Section 2
Operation
2.1 Introduction
This section contains set-up and connection procedures for the Model 90100 TRACKER System in order
to measure therapy beam characteristics.
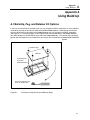
If you want to use build-up to simulate tissue, you can put plates of either "solid water" or acrylic (optional
accessories) securely on one or both sides of the Model 35300A Detector. Build-up pegs and retainer
rings for securing the plates to the 35300A Detector are optional with the 90100 TRACKER System. See
Appendix A for additional information.
It is recommended that the user customize his Model 35360A TRACKER Display prior to its first use as a
quality assurance tool. This customization may involve selecting the desired display units, display units
conversion factor, temperature units, and pressure units. Procedures for carrying out the customization is
covered in Section 5.
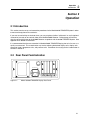
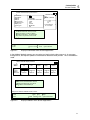
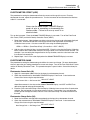
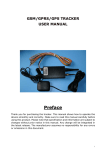
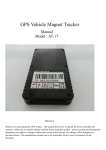
2.2 Rear Panel Familiarization
COMPUTER
INTERFACE
RS-232
100-240V 50/60 Hz 50VA
DETECTOR INPUT
Figure 2-1.
!
Model 35360A TRACKER Display Rear Panel
2-1
Model 90100
Operators Manual
2.2.1 Powering the System
The Model 35360A TRACKER Display may be operated from either line or battery power. The line
receptacle at the rear panel of the Model 35360A TRACKER Display mates with a 3-wire line cord to
provide a connection to line voltage (high, neutral and earth ground).
WARNING
When powering the 35360A TRACKER Display
from an AC line, always use a 3-wire grounding
type line cord such as the one supplied with the
90100 TRACKER System.
In addition, only
connect the 35360A TRACKER Display to an AC
power outlet employing a third wire safety ground.
Failure to ground the Model 35360A TRACKER
Display may result in personal injury or death in the
event of a short circuit or malfunction.
The 35360A TRACKER Display operates on battery power for eight hours after a full charge. The
35360A TRACKER Display can be recharged quickly, usually in two to three hours, even during
instrument operation. A low battery annunciator is displayed when 30 minutes or less of operation
remains. When the battery pack is fully discharged, the instrument automatically shuts off and will not
operate until AC line power is connected.
The Model 35360A TRACKER Display operates from line voltage ranging from 100 to 240 VAC without
operator switching. An IEC 320/C13 style receptacle provides worldwide operation by simply changing
line cords.
2.2.2 Detector Input
The Model 35360A TRACKER Display connects to the Model 35300A Detector through an interface
cable. The cable connects to an 8-pin D connector on the back of the 35360A TRACKER Display
housing (see Figure 2-1).
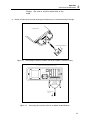
Before you attach the 35300A Detector to the 35360A TRACKER Display, you must perform the following
procedure (refer to Figure 2-2 and Figure 2-3).
1. Turn the 35360A TRACKER Display OFF.
WARNING
Always turn the Model 35360A TRACKER Display's
power off prior to connecting or disconnecting the
interface cable. Failure to do so may result in an
electrical shock.
2. Firmly press the 8-pin D connectors at either end of the interface cable into the 35360A TRACKER
Display and the 35300A Detector, see Figure 2-2 and Figure 2-3.
CAUTION
This interface cable has different mating pins for
both the 35300A Detector and 35360A TRACKER
2-2
Operation
Real Panel Familiarization
Display.
cable.
2
Be sure to use the correct end of the
3. Secure the cable at each end by twisting the thumbscrews in a clockwise direction until tight.
Model 35300A Detector
To Model 35360A TRAKCER Display
Figure 2-2. Connecting the Interface Cable to the Model 35360A TRACKER Display
R e a r p a n e l o f th e M o d e l 3 5 3 6 0 A T R A C K E R D is p la y
C O M P UT E R
INT E RF AC E
R S -23 2
1 0 0-2 40 V 5 0/6 0 H z 50 V A !
D ET E C T O R IN P UT
!
To
M odel 35300A
D e te c to r
Figure 2-3.
Connecting the Interface Cable to the Model 35300A Detector
2-3
Model 90100
Operators Manual
4. Power can now be applied to the system. Wait for the Test/Detector screen shown below before
pressing any keys.
Reverse the above procedure to disconnect the interface cable from the 35300A Detector.
WARNING
Always turn the Model 35360A TRACKER Display's
power off prior to connecting or disconnecting the
interface cable. Failure to do so may result in an
electrical shock.
2.2.3 RS-232 Computer Interface (RJ-45 Style)
The RS-232 Computer Interface provides a means for computer controlled factory test and calibration. It
is also used in conjunction with the Customization program during the user customization process.
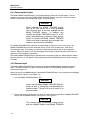
2.3 Positioning the Model 35300A Detector in the Beam
Proper and consistent positioning of the 35300A Detector is necessary for reliable measurement results.
The 35300A Detector has a printed overlay on both of its flat surfaces to indicate the location of the five
detectors inside the assembly. The overlays also include a black cross-hair to aid in centering the device
in the treatment beam.
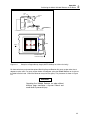
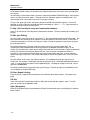
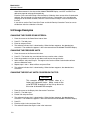
The 35300A Detector should be placed so that the center detector will be in the center of the treatment
beam. For a gantry angle of 0 degrees, place the 35300A Detector on the treatment table with the axis
label face up, and the connector facing away from the gantry. The "TOP" chamber should be the one
nearest the gantry. This placement is shown in Figure 2-4.
2-4
Operation
Positioning the Model 353300A Detector in the Beam
2
Gantry
arm
Treatment
head
Gantry
Model
35300A
Detector
Treatment
table
To Model 35360A
TRACKER Display
Treatment
table
Cable
Gantry
To Model 35360A
TRACKER Display
Figure 2-4.
Setup for 0-Degree Gantry Angle (NOTE: Build-up not shown for clarity)
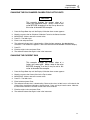
For those who have purchased the optional Build-Up Peg and Retainer Kit, gantry angles other than 0
degrees may be used. For gantry angles of 90 or 270 degrees, place the 35300A Detector on its side so
the label faces the head. Orient the connector away from the gantry. This placement is shown in Figure
2-5.
WARNING
Operating the 35300A Detector on edge without
build-up pegs constitutes a tip-over hazard and
could result in personal injury.
2-5
Model 90100
Operators Manual
Gantry arm
Gantry
Model
35300A
Detector
Treatment
head
Cable to
35360A TRACKER Display
Treatment
table
90 degrees
Cable
Gantry
Treatment table
To 35360A
TRACKER Display
270 degrees
Figure 2-5.
Setup for 90- and 270-Degree Angles (NOTE: Build-up not shown for clarity)
2.4 Operation Instructions
This section contains detailed instructions on the front panel operation of the Model 35360A TRACKER
Display. The 35360A TRACKER Display front panel keys and display are explained. Please note that
the display examples shown here correspond to a particular customization set-up. Other customization
set-ups will produce different results.
2.4.1 Front Panel Controls
Figure 2-6 shows the front panel of the 35360A TRACKER Display. The front panel consists of control
buttons and a display. The following paragraphs describe the operation of each control button and the
corresponding display screens.
2-6
Operation
Operation Instructions
Radiation Measurements
TRACKER DISPLAY
2
Model 35360A
TURN POWER OFF
PRIOR TO CONNECTING
AND DISCONNECTING
DETECTOR CABLE
Figure 2-6. The Model 35360A TRACKER Display Front Panel
Power
The POWER button toggles the system power on or off.
Test/Detector
The TEST/DETECTOR button displays and sequences the Test/Detector screens.
Units Select
The UNITS SELECT button displays the Units Select screen. Subsequent presses toggle the
measurement units between dose and dose rate units.
Air Density
The AIR DENSITY button displays the Air Density screen. Subsequent presses advance the cursor
through the temperature, pressure, and Air Density Correction Factor (ADCF) fields.
Gain Select
The GAIN SELECT button displays the Gain Select screen. Holding the GAIN SELECT key for three
seconds toggles the 35360A TRACKER Display between the Gain Setting and Normal Operation
modes. In the Gain Setting Mode, pressing the GAIN SELECT button advances the cursor through the
Front Panel Gain Factor (FPGF) fields.
Measure Select
The MEASURE SELECT button displays the Measurement screen. Subsequent presses toggle the
display mode between absolute and percentage presentations.
Reset
The RESET button zeroes all measurement readings when dose units are selected. This button
displays the Measurement screen if it is not already displayed.
Up
The UP button function depends on the displayed screen. It increments the temperature, pressure, or a
front panel gain. It toggles the state of the air density correction annunciator or the front panel gain
annunciator. For the Test/Detector screen or the Measurement screen, it displays the previously
displayed screen.
Down
The DOWN button function depends on the displayed screen. It decrements the temperature,
pressure, or a front panel gain. It toggles the state of the air density correction annunciator or the front
panel gain annunciator. For the Test/Detector screen or the Measurement screen, it displays the next
screen.
2-7
Model 90100
Operators Manual
2.4.2 Powering Up the Model 35360A TRACKER Display
Pressing the POWER button turns on the instrument. Initially, it runs self-tests, restores the temperature,
pressure, air density correction factor, front panel gain factors and measurement units to their previous
values, and waits for the bias supply to
stabilize.
NOTE
When attempting to turn the instrument on, firmly
press the power ON/OFF button and hold for
approximately one second. Always allow several
seconds between retries.
During this self-test period, the 35360A TRACKER Display displays a sequence of screens on its VFD.
The first screen to appear after pressing the POWER ON/OFF button is the Pixel Test screen shown in
Figure 2-7.
Figure 2-7. The Pixel Test Screen
This screen will remain visible for approximately two seconds and be followed by the General Information
Test Screen shown in Figure 2-8. After an additional two seconds, the display will change to the Bias and
Battery Voltage Test Screen shown in Figure 2-10. As soon as this screen is displayed, the 35360A
TRACKER Display is fully operational and ready to respond to further panel key presses.
2.4.3 Powering Down the Model 35360A TRACKER Display
Pressing the POWER ON/OFF button turns the instrument off. As part of the power down sequence, the
35360A TRACKER Display saves all of its front panel settings and is thus able to restore these settings
during the next power up sequence.
2.4.4 Using the TEST/DETECTOR Button
Press the TEST/DETECTOR button to display the first Test/Detector screen, see Figure 2-8. Use the
TEST/DETECTOR, UP, and DOWN buttons to cycle through the three Test/Detector screens. These
screens contain information about the instrument's calibration date, firmware revision date, serial number,
ion chamber calibration factors, current operating state, and an optional text line. The optional text line,
shown in Figure 2-10, can be customized using the Customization software.
Figure 2-8.
2-8
Test/Detector Screen 1 - General Information
Operation
Operation Instructions
Figure 2-9.
Test/Detector Screen 2 - Ion Chamber Calibration Factors
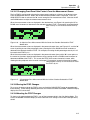
Figure 2-10.
Test/Detector Screen 3 - Bias and Battery Voltages Plus an Option Text Line
2
In Figure 2-10, the battery current, "+0.1 A", is displayed to the right of the battery voltage, "6.8 V". A
positive current value of up to 2.5 amperes indicates that the battery is being charged from the AC line.
As the battery approaches full charge, this current will decrease to near zero. A negative current value
will be shown when the instrument is operated from battery power, and indicates the actual current
consumption of the instrument.
The battery voltage number displayed is the terminal voltage of the battery. During a charging cycle, the
voltage can be anywhere from 5.5 volts to 8.5 volts. After the battery reaches its full charge, the charging
circuit switches to trickle charge mode with a corresponding terminal voltage of approximately 7 volts.
The unit will remain in this trickle charge mode as long as the instrument is attached to an AC line. When
the instrument is operated with battery power, the voltage will read between 6.5 volts (battery fully
charged) and 5.4 volts (low battery shutdown voltage).
2.4.5 Using the UNITS SELECT Button
Pressing the UNITS SELECT button displays the Units Select screen, see Figure 2-11. The "X" cursor
points to the currently selected measurement unit. Press the UNITS SELECT button to toggle the "X"
cursor between the dose and dose rate measurement units.
Figure 2-11.
The Units Select Screen with Dose Measurement Units Selected
The Display Units Conversion Factor (DUCF) is displayed at the bottom of the Units Select screen. The
35360A TRACKER Display uses the DUCF to convert from the detector calibration units to the display
units selected during the customization process (see Section 5).
2-9
Model 90100
Operators Manual
2.4.6 Using the AIR DENSITY Button
Pressing the AIR DENSITY button displays the Air Density screen, see Figures 2-12 and 2-13. This
screen contains the temperature value, pressure value, and Air Density Correction Factor (ADCF). Press
the AIR DENSITY button to advance the "X" cursor to the next field. To change the value or state of an
item at the "X" cursor, use the UP and DOWN arrows. The 35360A TRACKER Display displays the Air
Density Correction (ADC) annunciator in the upper left-hand corner of most screens if the air density
correction is enabled, see Figure2-12.
Figure 2-12.
The Air Density Screen With Air Density Corrections Enabled
To disable the air density correction, advance the "X" cursor to the ADC annunciator at the upper left of
the VFD. With the "X" cursor at this position, pressing the UP and DOWN keys will toggle the air density
correction on and off.
Figure 2-13.
The Air Density Screen With Air Density Corrections Disabled
2.4.7 Using the GAIN SELECT Button (Normal Mode)
Pressing the GAIN SELECT button displays the Gain Select screen, see Figures 2-14 and 2-15. This
screen displays the five Front Panel Gain Factors (FPGF) and the Front Panel Gain annunciator "FPG".
The "X" cursor points to the FPG annunciator.
Figure 2-14.
The Gain Select Screen With the Front Panel Gain Enabled
Figure 2-15.
The Gain Select Screen With the Front Panel Gain Disabled
2-10
Operation
Operation Instructions
2
NOTE
The FPGF for the center ion chamber is displayed
on the bottom line of the VFD.
Use the UP and DOWN buttons to toggle the FPG annunciator on or off. The FPG annunciator in the
upper right-hand corner of the display signifies that FPG corrections are enabled, see Figure 2-15. When
the FPG annunciator appears, the 35360A TRACKER Display multiplies each ion chamber's exposure
value by its FPGF before displaying the reading. See section 2.4.10 for information on how to set the
front panel gain factors.
2.4.8 Using the MEASURE SELECT Button (Normal Mode)
Press the MEASURE SELECT to display the Measurement screen. The 35360A TRACKER Display can
present the measurement data in an absolute form, or as a percentage of the center ion chamber. While
the Measurement screen is displayed, press the MEASURE SELECT button to toggle the display mode
between the percentage-of-center and absolute presentations.
2.4.8.1 Absolute Measurements
Figure 2-15 shows the ion chamber layout for the Measurement screen in the absolute display mode.
The 35360A TRACKER Display displays the four outside ion chamber readings in a diamond pattern
above the center channel. All five readings are in the selected units ("rads" in this case).
top
left
right
bottom
center units
Figure 2-16.
Measurement Screen Showing the Ion Chamber Layout
NOTE
The measurement value corresponding to the
central ion chamber is always displayed on the
bottom line of the VFD.
Figure 2-17. An Absolute Dose Measurement With Air Density Corrections and the Front Panel Gain
Factors Enabled
2-11
Model 90100
Operators Manual
Figure 2-18. An Absolute Rate Measurement With Air Density Corrections and the Front Panel Gain
Factors Disabled
Prior to making a dose measurement, press the RESET button to zero all ion chamber readings.
Pressing this button has no affect when performing dose rate measurements.
2.4.8.2 Percent-of-Center Measurements
The Percent-of-Center Measurement screen displays the central ion chamber's reading in absolute
measurement units and the four peripheral ion chamber's readings as a percentage of the center ion
chamber's reading.
top
x 100%
center
left
right
x 100%
x 100%
center
center
bottom
x 100%
center
center units
Figure 2-19.
A Percentage Measurement Showing How the Ratios are Calculated
Figure 2-20. A Percentage Dose Measurement With Air Density Corrections and the Front Panel Gain
Factors Enabled
Figure 2-21.
A percentage rate measurement with both air density corrections and the front panel
gain factor disabled
NOTE
Pressing the RESET button while performing a
dose measurement causes all percentages to
immediately change to "UNDER". This is normal
operation (see section 2.4.8.3 for more
information).
2-12
Operation
Operation Instructions
2
2.4.8.3 Underranging and Overranging Conditions
The 35360A TRACKER Display displays an underrange indicator when a preset threshold has not yet
been reached, and an overrange indicator when the electrometer’s maximum limit has been exceeded
(see Figures 2-22 and 2-23).
An underrange occurs in the percent-of-center measurement mode when the central exposure is too
small to precisely calculate percentages.
Figure 2-22.
Underranging the Electrometer
Figure 2-23.
Overranging the Top and Night Channels of the Electrometer
Table 2-1 summarizes the underrange and overrange conditions and results.
Table 2-1. Underrange and Overrange Conditions
Measurement Mode
Condition
Chamber Reading
Absolute
Overrange a chamber
Exposure at center chamber too small to
calculate percentages
A peripheral chamber overranges
while center chamber is within range limit
Center chamber overranges
OVER for chamber
Percent-of-Center
Percent-of-Center
Percent-of-Center
UNDER for all peripheral chambers
OVER for peripheral chamber
OVER for all chambers
2.4.9 Battery and Bias Annunciators
As already discussed, the 35360A TRACKER Display continuously monitors the ion chamber bias and
battery voltages. If either one of these values is outside the specified range, the 35360A TRACKER
displays an annunciator to indicate the error. Table 2-2 specifies these annunciators.
Table 2-2. Bias and Battery Annunciators
Condition
Annunciator
Low Bias voltage
LoBias
High Bias voltage
HiBias
Low Battery voltage
LoBat
2-13
Model 90100
Operators Manual
Figure 2-24 illustrates the locations of the annunciators on the VFD. The High Bias annunciator would
appear in place of the Low Bias annunciator should this condition be detected.
Figure 2-24.
Positions of the Battery and Bias Annunciators
See Section 4 for information on how to deal with the LoBat, HiBias, and LoBias conditions.
2.4.10 Gain Setting Mode
The 35360A TRACKER Display uses several variables to determine an exposure's value: the
electrometer reading in Coulombs and Coulombs/min, the Display Units Conversion Factor (DUCF), an
Ion Chamber Calibration Factor (ICCF), the Air Density Correction Factor (ADCF), and a Front Panel
Gain Factor (FPGF). The FPGF's provide a means of adjusting the measurement readings from the front
panel of the 35360A TRACKER Display.
The 35360A TRACKER Display must be in the Gain Setting Mode before an FPGF can be changed. To
enter or exit the Gain Setting Mode, press and hold the GAIN SELECT button for approximately three
seconds. Entry into the Gain Setting Mode is indicated by a movement of the "X" cursor from the FPG
annunciator to one of the five FPGF values as shown in Figure 2-25.
Figure 2-25.
The Gain Select Screen in the Gain Setting Mode
NOTE
The FPGF's are automatically enabled upon
entering the Gain Setting Mode. They cannot be
disabled while the instrument is in this mode.
Subsequent presses of the GAIN SELECT button advance the "X" cursor through the FPGF's. Press the
UP or DOWN button to increase or decrease an FPGF.
While in the Gain Setting Mode, all of the screens may be viewed and the measurement system will
function as it does in the Normal Mode. The FPGF's may be set either from the Gain Select screen, or
from one of the Measurement screens. Pressing the MEASURE SELECT button cycles the VFD through
a sequence consisting of the Absolute Measurement Screen, the Percent-of-Center Measurement
Screen, and back to the Gain Select Screen.
2-14
Operation
Operation Instructions
2
2.4.10.1 Changing Front Panel Gain Factor's From the Measurement Screen
The five FPGF's may be set by adjusting the measurement readings to achieve a set of desired values.
Press the MEASURE SELECT button until the desired Measurement screen is displayed. Press the
GAIN SELECT button to advance the "X" cursor among the five measurement values. Next use the UP
and DOWN buttons to adjust the selected measurement value.
When the measurement values are displayed in the absolute form, see Figure 2-26, pressing the UP or
DOWN arrow increments or decrements the selected chamber's FPGF. For example, increasing the left
dose value by 2% will increase the left FPGF by
2%.
Figure 2-26. An Absolute Dose Measurement With the Center Ion Chamber Selected for FPGF
Modification
When the measurement values are displayed in the percent-of-center form, see Figure 2-27, and the "X"
cursor is pointing at one of the percentage values, pressing the UP or DOWN arrow will increment or
decrement the selected chamber's FPGF. For example, increasing the left percentage value by 2% will
increase the left FPGF by 2%.
When the measurement values are displayed in the percent-of-center form and the "X" cursor points to
the center ion chamber's absolute measurement value, pressing the UP or DOWN arrow increments or
decrements all five of the FPGF's. This causes the FPGF of the center channel to increase, while
allowing the four peripheral ratios to remain unchanged. For example, increasing the center chamber's
absolute dose value by 2% will increase all five of
the FPGF's by 2%.
Figure 2-27. A Percentage Dose Measurement With the Left Ion Chamber Selected for FPGF
Modification
2.4.10.3 Saving the FPGF Changes
To save any changes made to the FPGF's, press and hold the GAIN SELECT button for approximately
three seconds. These settings become permanent and will be used when the 35360A TRACKER Display
displays the FPG annunciator.
2.4.10.4 Aborting the FPGF Changes
To abort any changes made to the FPGF's, turn off the instrument while in the Gain Setting Mode. This
causes the 35360A TRACKER Display to discard the new FPGF settings and use the values previously
stored.
2-15
Model 90100
Operators Manual
(Blank page)
Theory of Operation
Introduction
3
Section 3
Theory of Operation
3.1 Introduction
The Model 90100 TRACKER System is a radiation measurement system intended for use in quality
assurance programs for high-energy accelerators and Co60. The two main components of the system are
the Model 35300A Detector and the Model 35360A TRACKER Display. This section describes the basic
theory of operation of these devices. For more information regarding radiation dosimetry and ion
chamber measurement theory, the reader should refer to one of the standard radiology physics texts.
The section begins with a simplified hardware block diagram of the Model 35360A Display accompanied
by a short description of the most important blocks. Next follows a short description of the Model 35300A
Detector and a discussion of air density corrections. The section concludes with a description of the
system's basic operating parameters and equations.
3.2 Overall Functional Description of the Model 35360A
TRACKER Display
The 35360A TRACKER Display contains a five-channel electrometer capable of producing
measurements of dose and dose rate. Its 4 line by 20 character vacuum fluorescent display (VFD) can
display the measurement results directly in the user's choice of radiological units. These readings may
include air density corrections if desired. An integrated rechargeable battery and a 300 V electronic bias
supply greatly simplify maintenance of the system. The 35360A TRACKER Display includes an RS-232
serial communication port that allows complete computer control of the measurement system. This
communications port, in conjunction with internal non-volatile memory, also provides a means of
customization and calibration of the 35360A TRACKER Display.
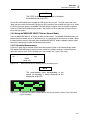
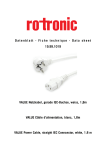
Figure 3-1 is a simplified hardware function block diagram for the 35360A TRACKER Display. While the
most important interblock connections have been shown, many interconnections have been omitted in
order to maintain clarity. Three external connections are illustrated. These are the AC Line, the RS-232
Computer Interface, and the Detector Input.
3-1
Model 90100
Operators Manual
BATTERY
STATUS
Figure 3-1.
Hardware Block Diagram of the Model 35360A TRACKER Display
3.2.1 Power Supply
The Power Supply converts AC line power in the range of 100 to 240 VAC, or 6 VDC from the internal
rechargeable battery pack, to the various DC voltage levels that are used to power all of the other blocks
of the system. These interconnections have been omitted from the diagram for clarity. The Power Supply
also includes a high performance charger for the internal Battery Pack. This Battery Pack will normally
provide a continuous operational life of approximately 8 hours on one charge. The batteries may be
charged in about 2 to 3 hours and charging will take place even when the instrument is in use. When the
batteries have reached their fully charged level, the charger automatically enters a trickle charge mode.
During trickle charging, the user need not be concerned about over charging the batteries. This mode will
maintain the Battery Pack at its fully charged condition indefinitely.
When operating from batteries, an automatic turn off feature may be used to power down the unit after a
user-defined period of inactivity. A low battery annunciator is displayed when less than 30 minutes of the
useful battery life remains, and an automatic power down will occur when the Battery Pack is completely
exhausted. All front panel settings are automatically stored at power down and restored at power up.
Thus, the need to reconfigure the front panel settings upon each use has been eliminated.
Although the Power Supply is under the control of the microcontroller during normal operation through the
Power Control connection shown, it is forced to turn on when the operator presses the front panel Power
On/Off button. The BATTERY STATUS connection between the Power Supply and the Processor blocks
provides the means by which the microcontroller can monitor the battery voltage and thus detect low and
exhausted batteries. This voltage is automatically displayed during the power up sequence and may be
viewed at any time on one of the test screens.
3-2
Theory of Operation
Overall Functional Description of the Model 35360A Tracker Display
3
3.2.2 300-VOLT Electronic Bias Supply
The 300 volt ionization potential is generated internally by an electronic bias supply circuit. The supply
eliminates the need for the 35360A TRACKER Display to contain high voltage batteries. As explained
below, the ion chamber collector and guard are maintained at the same potential as the chassis of the
35360A TRACKER Display, and the ion chamber bias plates are negatively biased at 300 VDC. A
readout of the bias potential is facilitated by a divided bias signal generated within the bias supply block
and connected to the A-D converter.
The output of the electronic bias supply is highly regulated and filtered. In addition, the output energy and
current have been limited should the operator make direct contact. Since the bias voltage at the detector
input connector is automatically discharged at power down, the operator should always turn the
instrument off before attempting to make or break a connection involving the detector interface cable.
During operation, the Bias Supply output level is continuously measured and verified. Any abnormal level
will be indicated by an annunciator on the VFD.
3.2.3 Front Panel Switches
The nine front panel switches are of the momentary contact type, and are continuously monitored by the
microcontroller for detection of contact closure. At the detection of any contact closure, the
microcontroller scans the switch set to determine which key has been pressed, and then takes the
appropriate action. The dedicated function of each key is described in Section 2.
3.2.4 Processor
The Processor block is based on the Motorola 68HC11 microcontroller and includes 256 KBytes of factory
programmed memory (EPROM) containing all of the executable code (firmware). The revision date
associated with this code is displayed during the power up sequence on the VFD. Also contained within
the Processor block is 32 KBytes of RAM memory which is used to hold all volatile variables (those
whose values are lost when the instrument is powered down).
A 512 byte block of nonvolatile memory (EEPROM) has also been provided. A portion of the EEPROM is
automatically reprogrammed during each power down sequence to hold all of the user's front panel
selections. Thus the units, front panel gain, temperature, and pressure settings in effect at power down
can be automatically restored at the next power up. The EEPROM is also used to hold all of the internal
electrical calibration factors for the unit, as well as all of the customization selections installed by the user
over the RS-232 via the Customization program.
Besides its role as a controller of the other hardware blocks, the Processor Block performs several
computational functions. It applies a number of correction factors to the displayed dose and dose rate
values including the air density correction factor, the ion chamber calibration factor, the display units
conversion factor, and the front panel gain settings. It also performs the ratio calculations necessary to
display the percentage-of-center measurement values for the peripheral ion chambers.
3.2.5 VFD Display
All display functions are handled by a 4 line by 20 character alpha-numeric VFD module. The module is
under the direct control of the microcontroller and is capable of displaying all of the user's front panel
selections as well as the numerical measurement results along with their appropriate units. Other
informational items including the battery and bias voltage, calibration date, and ion chamber calibration
factors may be displayed. The VFD has a distinct advantage over other display technologies, such as
LCD, in that it provides good visibility, and a wide viewing angle in all lighting conditions.
3-3
Model 90100
Operators Manual
3.2.6 Serial Communications Port
A computer interface has been provided in the form of a DCE configured RS-232 port. This port is
configured for operation at 9600 baud and uses a standard Xon/Xoff handshaking protocol. The
associated RJ-45 type connector is located on the 35360A TRACKER Display's rear panel. This interface
provides the means for production testing and calibration, field customization by the user, and fully
programmable operation using appropriate software.
3.2.7 Electrometer
This block contains a fully guarded, five channel, single range, dual measurement mode electrometer. It
is capable of providing both dose and dose rate measurements from the five detector channels. The
connection to the electrometer's inputs is made through five coaxial inserts in a D-style receptacle located
on the 35360A TRACKER Display's rear panel. Also located within this connector are three single
conductor outputs for safety ground, signal ground, and ion chamber bias.
The measurement mode is user-selected from the front panel prior to the start of the exposure. In the
dose mode, the electrometer is operated in integrating mode with capacitive feedback. Prior to each
exposure the user must manually reset the electrometer to zero by pressing the front panel "RESET"
button. During dose rate measurements, the electrometer is operated in a non-integrating mode with
resistive feedback.
3.2.8 Multiplexer and A/D Converter
This block consists of an six channel analog multiplexer and 16 bit A/D Converter which operates under
the direct control of the microcontroller. Its main function is to convert the five analog voltage signals
produced by the Electrometer Block into digital signals for use by the microcontroller. It is also used to
measure the output of the 300 Volt Electronic Bias Supply. Although the 16 bit A/D Converter operates in
a unipolar mode, its zero measurement point is offset slightly below the zero output level of the
electrometer. This configuration provides optimal matching between the A/D's input span and
electrometer's 3 Volt full scale output swing. It also provides the ability to read the small negative
voltages which might result from electrometer leakage and offset drift.
A second 8-bit A/D Converter (actually located within the microcontroller) is used for measuring noncritical internal parameters such as the battery voltage and current.
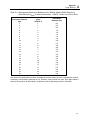
Full scale electrometer and A/D Converter values in electrical units are given in Table 3-1. The
corresponding values in radiological units are given in Table 3-2.
Table 3-1. Nominal Full Scale and Sensitivity in Electrical Units
Dose
Full Scale
1000.0 nC
Dose
Sensitivity
0.1
nC
Rate
Full Scale
1000.0 nC/min
Rate
Sensitivity
0.1
nC/min
Table 3-2. Nominal Dose and Rate Display Ranges in Radiological Units
3-4
Dose
Full Scale
3,520 R
Dose
Sensitivity
0.1 R
Rate
Full Scale
3,520 R/min
Rate
Sensitivity
0.1 R/min
3,093 rad
0.1 rad
3,093 rad/min
0.1 rad/min
30.93 Gy
1 mGy
30.93 Gy/min
1 mGy/min
30.93 Sv
1 mSv
30.93 Sv/min
1 mSv/min
Theory of Operation
Overall Functional Description of the Model 35360A Tracker Display
3
Above values assume nominal electrical and radiological sensitivity, air density correction and front panel
gain factors set to unity, and nominal value for the Display Units Conversion Factors. The following unity
conversion factors were used; 3.52 R/nC, 0.879 rad/R, 0.00879 Gy/R, and 0.00879 Sv/R. The sensitivity
values have been selected so the display resolution will not exceed the resolving capability of the A-D
converter.
3.3 Model 35300A Ion Chamber Detectors
The Model 35300A Detector contains an array of four orthogonal placed ion chambers on 10 cm radii
from a fifth centrally located ion chamber. The five ion chambers are of a vented, circular, parallel-plate
configuration and are fully guarded for low leakage. The 35300A Detector connects to the 35360A
TRACKER Display through a light weight interface cable.
Each of the 35300A Detector's five ion chambers may be depicted as containers of air, whose inside
surfaces (bias plates) have been given a conductive coating. Located centrally in the air volume is a
plastic disc (collector) which also has a conductive coating. The collector is electrically insulated from the
bias plates and connected to the electrometer input through the 37783-15 detector interface cable.
Photons or electrons from the linear accelerator or Co60 source pass through and are absorbed into the
chamber's materials and internal air volume. Absorption may also take place in external build-up
materials when they are present. The primary absorption takes place in the chamber's windows and
build-up materials when the incident photons or primary electrons interact with the atoms of these
materials. When absorption occurs, high speed electrons are emitted from the interacting atoms. The
high speed electrons spray into the ion chamber's air volume and produce many ionization tracks
consisting of lower velocity electrons and "air" ions. The 300 V bias voltage separates the secondary
electron cloud from the cloud of positive ions before recombination can occur. The sweeping of the
electron cloud onto the ion chamber's collector produces a charge (or current) whose magnitude may be
measured by the electrometer.
3.4 Air Density Corrections
For any vented ion chamber, the measurement of exposure (in roentgens) depends upon the mass of air
from which the ionization charge is collected. The ion chamber calibration factors (ICCF's) supplied by
Fluke Biomedical expresses this sensitivity in terms of R/nC. These ICCF's are specified for a
temperature of 22 °C and a pressure of 760 millimeters of mercury (mm Hg). Since the 90100
TRACKER System may be used under ambient conditions which significantly differ from these, the
corresponding changes in the sensitivity of the ion chamber must be accounted for. The air density
correction factor (ADCF) has been defined as follows:
ADCF = (760 mm Hg / P) * (T / 295.15 K)
where the pressure "P" is expressed in mm Hg and the temperature "T" is in Kelvin.
When the user has customized the 35360A TRACKER Display to use other temperature and pressure
units, the corresponding values entered by the user at the instrument's front panel are automatically
converted to mm Hg and K before use in the above equation. The equations used for these conversions
are listed in the following table.
3-5
Model 90100
Operators Manual
Pressure
Temperature
mm Hg = inch Hg ∗ 25.4
K = (5/9) ∗ (°F -32) - 273.15
mm Hg = 760 ∗ (54,041 - feet ASL) / (54,041 + feet ASL)
K = °C + 273.15
mm Hg = 760 ∗ (16,472 - meters ASL) / (16,472 + meters ASL)
mm Hg = mB ∗ 0.75006
mm Hg = hPa ∗ 0.75006
3.5 Basic Operating Equations
This section lists the basic operating equations used within the 35360A TRACKER Display to produce its
dose and dose rate measurement values for display on the VFD. These equations are expressed in
terms of a set of basic operating quantities which are described in Table 3-3.
3.5.1 Charge
Although charge is not a value which can be displayed directly by the 35360A TRACKER Display, it is an
intermediate result upon which the dose value directly depends.
Q [nC] = (ADC [counts] - ADZ [counts] ) × QG [nC/count]
3.5.2 Current
Although current is not a value which can be displayed directly by the 35360A TRACKER Display, it is an
intermediate result upon which the dose rate value directly depends.
I [nC/Min] = (ADC [counts] - ADZ [counts]) × IG [(nC/Min)/count]
3.5.3 Absolute Dose
AbsoluteDoseDisplay[DisplayUnits]=
Q [nC] × ICCF[Ion Chamber Cal Units/nC]
× DUCF[DisplayUnits/ Ion Chamber Cal Units]× ADCF× FPGF
3.5.4 Absolute Dose Rate
Absolute Rate Display [Display Units/Min] =
I [nC/Min] × ICCF [ Ion Chamber Cal Units/nC]
× DUCF [Display Units/ Ion Chamber Cal Units] × ADCF × FPGF
3.5.5 Percent-of-Center
Percentage Display for Perhiperal Channel [%] = 100 [%] ×
3-6
Absolute Rate Display for Perhiperal Channel
Absolute Rate Display for Center Channel
Theory of Operation
Basic Operating Quantities
3
3.6 Basic Operating Quantities
Table 3-3. Basic Operation Quantities
Quantity
Description
Units
I
Current
nC/Min
Q
Charge
nC
ADC
A-D Counts
Counts
ADZ
A-D Zero
Counts
QG
Charge Gain
nC / Count
IG
Current Gain
(nC/Min) / Count
ICCF
Ion Chamber
Calibration
Factor
Ion Chamber
Calibration Units
/ nC
Display Units
Conversion
Factor
Air Density
Correction
Factor
Front Panel
Gain Factor
Display Units
/ Radiation Calibration
Units
DUCF
ADCF
FPGF
None
None
Comments
Electrical current delivered to readout in
response to radiation incident upon
detector.
Electrical charge delivered to readout in
response to radiation incident upon
detector.
Electrometer output level returned by
A-D Converter during dose or dose rate
measurement.
Electrometer output level returned by
A-D Converter while operating in the
dose rate measurement mode and in
the absence of radiation. A-D Zero
levels are field programmable via
Customization Software.
Overall electrical charge gain of the
electrometer / A-D combination when
measuring in the dose mode. Charge
gain values are field programmable via
Customization Software.
Overall electrical current gain of the
electrometer and A-D combination
when measuring in the dose rate mode.
Current gain values are field
programmable via Customization
Software.
Specific R/nC values are supplied by
factory for each of the five ion chamber
channels. Values are field
programmable via Customization
Software.
Factory default of 0.879 rad/R is
supplied. Value is field programmable
via Customization Software.
Calculated by instrument and depends
on front panel Temperature and
Pressure settings.
User specified via front panel gain
setting.
3-7
Model 90100
Operators Manual
(Blank page)
Maintenance & Service
Introduction
4
Section 4
Maintenance & Service
WARNING
The Model 35360A TRACKER Display and 35300A
Detector contain no internal operator serviceable
parts. Disassembly of either unit could result in
electrical shock.
Always turn the 35360A TRACKER Display's power
off prior to connecting or disconnecting the
interface cable. Failure to do so may result in an
electrical shock.
When powering the 35360A TRACKER Display
from an AC line, always use a 3-wire grounding
type line cord such as the one supplied with the
90100 TRACKER System.
In addition, only
connect the 35360A TRACKER Display to an AC
power outlet employing a third wire safety ground.
4.1 Introduction
This section outlines steps that the operator may take to identify and correct problems. It also gives
instructions on how to order replacement parts or arrange for service if necessary.
For the purposes of troubleshooting, the system consists of three major components: detector, display,
and an interface cable. Even though these major components contain no internal operator serviceable
parts, a number of problems can be dealt with by the operator in the field environment.
4-1
Model 90100
Operators Manual
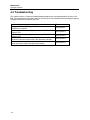
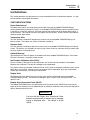
4.2 Troubleshooting
This system contains a number of troubleshooting procedures that may be executed by the user in the
field. Each procedure is illustrated in the form of a flow chart and is directed toward resolving the specific
symptom listed in the first block of the chart.
Problem
The 35360A TRACKER Display's VFD does not illuminate when
POWER key is pressed.
Low Battery annunciator is displayed on the 35360A TRACKER
Display's VFD.
Bias error annunciator is displayed on the 35360A TRACKER
Display's VFD
One or more dose measurement value(s) exhibits a drift rate of
greater than two counts per minute in the absence of radiation.
One or more dose rate measurement values does not return to
within one count of zero in the absence of radiation.
4-2
Figure
See Figure 4-1.
See Figure 4-2.
See Figure 4-3.
See Figure 4-4.
See Figure 4-5.
Maintenance & Service
Troubleshooting
4
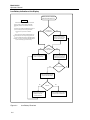
35360A TRACKER Display will not turn on (display will not light)
NOTE
35360A TRACKER Display's
VFD does not illuminate when
POWER key is pressed.
When attempting to turn the instrument on,
firmly press the POWER key and hold
for approximately one second. Always
allow several seconds between retries.
WARNING
No
The Model 35360A TRACKER Display and 35300A
Operating from AC power source?
Yes
Detector contain no internal operator serviceable
Disassembly of either unit could result in electrical
h k
Always turn the 35360A TRACKER Display's power off
prior to connecting or disconnecting the interface
blFailure to do so may result in an electrical
h
Connect 35360A TRACKER
Display to an AC power source
and press the POWER key.
k
When powering the 35360A TRACKER Display from
an AC line, always use a 3-wire grounding type line cord
has the one supplied with the 90100 TRACKER System.
In addition, only connect the 35360A TRACKER Display to
AC power outlet employing a third wire safety
d
Yes
No
35360A TRACKER Display
VFD illuminates?
Verify voltage present at AC line
receptical by connecting and
powering some other device.
Commence operation from AC line
power or charge batteries.
Yes
AC line voltage present?
No
Check AC line fuses at rear panel
of 35360A TRACKER Display.
No
Replace 35360A TRACKER
Display's AC line fuses.
Refer to Section 5.3.
Figure 4-1.
Fuses OK?
Yes
Return 35360A TRACKER Display
to Keithley for repair.
No Display Flowchart
4-3
Model 90100
Operators Manual
Low Battery Indication at the Display
Low Battery annuciator is displayed on
35360A TRACKER Display's VFD.
WARNING
The Model 35360A TRACKER Display and 35300A
Detector contain no internal operator serviceable
Disassembly of either unit could result in electrical
h k
Always turn the 35360A TRACKER Display's power off
prior to connecting or disconnecting the interface
blFailure to do so may result in an electrical
h
Yes
No
Operating from
AC power source?
k
When powering the 35360A TRACKER Display from
an AC line, always use a 3-wire grounding type line cord
h
as the one supplied with the 90100 TRACKER System.
Connect 35360A TRACKER
Display to an AC power source
and press the POWER key.
In addition, only connect the 35360A TRACKER Display to
AC power outlet employing a third wire safety
d
No
Low battery
annuciator displayed?
Yes
Verify voltage present at AC line
receptical by connecting and
powering some other device.
Commence operation from AC line
power or charge batteries.
Yes
AC line voltage present?
Check AC line fuses at rear panel
of 35360A TRACKER Display.
No
Replace 35360A TRACKER
Display's AC line fuses.
Refer to Section 5.3.
Figure 4-2
4-4
Low Battery Flowchart
Fuses OK?
Yes
35360A TRACKER Display is faulty and
will require repair or replacement.
No
Maintenance & Service
Troubleshooting
4
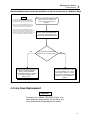
Bias Error (LoBias or HiBias) Indication at the Display
WARNING
Bias error annuciator is displayed on
35360A TRACKER Display's VFD.
The Model 35360A TRACKER Display and 35300A
Detector contain no internal operator serviceable parts.
Disassembly of either unit could result in electrical shock.
Always turn the 35360A TRACKER Display's power off
prior to connecting or disconnecting the interface cable.
Failure to do so may result in an electrical shock.
Disconnect interface cable from 35360A
TRACKER Display and recheck VFD
for bias error indication.
When powering the 35360A TRACKER Display from
an AC line, always use a 3-wire grounding type line cord such
as the one supplied with the 90100 TRACKER System.
In addition, only connect the 35360A TRACKER Display to an
AC power outlet employing a third wire safety ground.
No
Bias error annuciator displayed?
(35360A TRACKER
Display only)
Reconnect interface cable to the 35360A
TRACKER Display without the 35300A
Detector and recheck VFD for bias
error indication.
No
35360A TRACKER Display's electronic
bias circuit is faulty. 35360A TRACKER
Display will require repair or replacement
Bias error annuciator displayed?
(35360A TRACKER Display
and interface cable)
Connect the 35300A Detector to the interface
cable and recheck VFD for bias error indication.
Yes
Bias error
annuciator displayed?
(35360A TRACKER Display,
35300A Detector, and
interface cable)
The 35300A Detector is faulty and
will require repair or replacement.
Figure 4-3.
Yes
Yes
Interface cable is faulty and will require repair or
replacement.
No
The bias error has disappeared. Repeat the
troubleshooting procedure if the error indication
returns.
Bias Error Flowchart
4-5
Model 90100
Operators Manual
Dose Measurement Value Drifts Prior to (or following) the Exposure
One or more dose measurement values
exhibits a drift rate of greater than two
counts per minute in the absence of
radiation.
WARNING
The Model 35360A TRACKER Display and 35300A
Detector contain no internal operator serviceable parts.
Disassembly of either unit could result in electrical shock.
Disconnect interface cable from
35360A TRACKER Display
and recheck dose drift.
Always turn the 35360A TRACKER Display's power off
prior to connecting or disconnecting the interface cable.
Failure to do so may result in an electrical shock.
When powering the 35360A TRACKER Display from
an AC line, always use a 3-wire grounding type line cord such
as the one supplied with the 90100 TRACKER System.
In addition, only connect the 35360A TRACKER Display to an
AC power outlet employing a third wire safety ground.
No
Yes
Excessive dose drift?
(35360A TRACKER
Display only)
Reconnect interface cable to the 35360A
TRACKER Display without the 35300A
Detector and recheck the dose drift.
Excessive dose drift?
(35360A TRACKER Display
+ interface cable)
Yes
No
Clean 35360A TRACKER Display's
interface connector via procedure
given later in this section and
recheck dose drift.
Clean interface cable connectors via
procudure given later in this section
and recheck dose drift.
No
Yes
Excessive dose drift?
(35360A TRACKER Display
+ interface cable)
Attempt to clean interface cable
connectors was unsuccessful. Cable
will require repair or replacement.
No
Connect the 35300A Detector to the
interface cable and recheck complete
system leakage.
Yes
Excessive dose drift?
(35360A TRACKER Display,
35300A Detector, and
interface cable)
Clean 35300A Detector's interface
conncector via procedure given later in
this section and recheck dose drift.
Yes
4-6
Leakage Flowchart
No
The drift problem has been
eliminated and the system is ready
for use.
Excessive dose drift?
(35360A TRACKER Display,
35300A Detector and
interface cable)
Attempt to clean the 35300A Detectors's
interface connectors was unsuccessful.
35300A Detector will require
repair or replacement.
Figure 4-4.
Excessive dose drift?
(35360A TRACKER
Display only)
No
The drift problem has been
eliminated and the system is ready
for use.
Yes
Attempt to clean 35360A TRACKER
Display's interface connector was
unsuccessful. 35360A TRACKER
Display will require repair or replacement.
Maintenance & Service
Troubleshooting
4
Dose Rate Measurement Value Does Not Return to Zero in the Absence of a Radiation Beam
WARNING
The Model 35360A TRACKER Display and 35300A
Detector contain no internal operator serviceable parts.
Disassembly of either unit could result in electrical shock.
One or more dose rate measurement
values do not return to within one
count of zero in the absence of
radiation.
Always turn the 35360A TRACKER Display's power off
prior to connecting or disconnecting the interface cable.
Failure to do so may result in an electrical shock.
When powering the 35360A TRACKER Display from
an AC line, always use a 3-wire grounding type line cord such
as the one supplied with the 90100 TRACKER System.
In addition, only connect the 35360A TRACKER Display to an
AC power outlet employing a third wire safety ground.
No
Switch 35360A TRACKER Display
to the dose measurement mode
and check for excessive leakage drift.
Dose measurement leakage drift
greater than 2 counts per minute?
The problem appears to be caused by
one or more improper A-D Zero
setting. Use the TRACKER
Customization Software to readjust
the A-D Zero setting for each
drifting channel.
Figure 5-5
Yes
The problem appears to be caused
by current leakage in one or more
measurement channels. Use the
Dose Leakage Troubleshooting chart,
Figure 5-4, to further diagnose the
problem.
Dose Rate Measurement Zero Problem Flowchart
4.3 Line Fuse Replacement
WARNING
Disconnect the 35360A TRACKER Display from
other equipment along with the AC line power and
turn off power before continuing with this section.
4-7
Model 90100
Operators Manual
1. Position the instrument on its display face.
Model 35360A
TRACKER Display
Rear Panel
COMPUTER
INTERFACE
RS-232
100-240V 50/60 Hz 50VA
DETECTOR INPUT!
Fuses
Fuse Drawer
Fuse Drawer
Figure 4-6. Model 35360A TRACKER Display Fuse Replacement
2. Remove the fuse drawer. With your fingernails, squeeze together the two ends of the fuse drawer
and pull it out of its slot.
3. Replace the fuses with IEC 127 type FST5X20, 0.63 A, 250 V time-lag fuses.
WARNING
Use only the recommended fuse type. The use of
a higher current rating than specified above may
cause damage to the instrument, which will void
any or all warranties currently in effect.
4. Place the fuse drawer back into its slot. Press on the fuse drawer firmly until it snaps back into
place. Both sides of the fuse drawer should snap into place.
NOTE
If fuses continue to blow - return instrument for
repair.
4-8
Maintenance & Service
Interface Connector Cleaning
4
4.4 Interface Connector Cleaning
WARNING
Always turn the 35360A TRACKER Display's power
off prior to cleaning the interface connectors.
Failure to do so may result in an electrical shock.
The presence of dust or lint at the interface connectors can produce leakage currents which may have a
detrimental affect upon the accuracy of radiation measurements.
The ends of the interface cable typically pick up dust and lint as the cable touches the floor during
packing and unpacking. Dirt may later be transferred to the interface connectors located on the 35300A
Detector or on the 35360A TRACKER Display during mating with the interface cable.
In some cases, the offending foreign matter may be removed by gently blowing across the connector with
dry air. Air containing moisture or other contaminants should be avoided. A suitable source of dry air is
available where camera accessories are sold. They are intended for use in cleaning fine and delicate
camera equipment.
If this cleaning method fails to produce satisfactory results, then service by Fluke Biomedical will be
required.
A procedure for troubleshooting excessive leakage is given earlier in this section.
4.5 Cleaning the Instrument
To clean the exterior of the instrument, follow these steps:
1. Turn off the instrument and disconnect all input connectors.
2. Place the cap on the detector connector.
3. Moisten a soft cleaning cloth with a solution of three parts water and one part liquid dishwashing
detergent.
WARNING
Do not soak the cloth in the solution; you must not
let the solution drip inside the instrument.
4. Use the moistened cloth to wipe the instrument’s exterior cover.
5. Let the instrument dry completely before using.
4.6 Replaceable Parts Information
Fluke Biomedical maintains a complete inventory of all normal replaceable parts (see Table 4-1). To
place an order, or to obtain information concerning replaceable parts, contact Fluke Biomedical at
440.498.2564, or Fax 440.542.3682.
4-9
Model 90100
Operators Manual
Table 4-1. Replaceable Parts List
Description
Part Number
Therapy Beam Evaluator
35300A
Readout
35360A
System Carrying Case
37780
Fuse
38476
AC Line Cord (USA)
CO-19
AC Line Cord (Europe CEE 7/7)
86512060
AC Line Cord (UK & Ireland)
86583000
AC Line Cord (Denmark)
86536041
AC Line Cord (Italy)
86531031
AC Line Cord (Switzerland)
86515050
15 m Interface Cable
37783-15
30 m Interface Cable
37783-30
Customization Kit
37827
DB-9 Female Wiring
37616
7 Ft. RJ-45 Cable (L-COM)
105-260
Customization Software Disk
38330
Build-Up Plate
37051
Pegs and Retainer Kit
37825
Pegs
37081
Retainers
37082
Hex-key Wrench
LN-964
Fuse Drawer
018-304
4.7 Recalibration & Repair Information / Technical Assistance
If your instrument needs recalibration or repair, we request that you consult Fluke Biomedical at
440.498.2564, or Fax 440.542.3682.
More information concerning the operation, application, or service of your instrument may be obtained
from the applications engineer at the previously listed numbers.
4-10
Customization
Introduction
5
Section 5
Customization
5.1 Introduction
From the factory, the Model 35360A TRACKER Display arrives with valid settings allowing you to make
measurements immediately. Should the need arise to change or modify any of the Items described
below, the Customization software provides a friendly environment for customizing the 35360A
TRACKER Display to meet your needs. The Customization software allows you to modify the power
down interval, temperature and pressure units, an optional message, serial number of the detector you
are using with the 35360A TRACKER Display, units of calibration for the detector, and the 35360A
TRACKER Display's units and units conversion. Additionally, the electrometer gains and zeros, and the
ion chamber calibration factors may be changed.
The basic features of the Customization software are its ease of use, an on-line help facility, printer
support, and of course full customization capability for the 35360A TRACKER Display.
The Customization software has the following requirements:
•
IBM Personal Computer or compatible
•
EGA or VGA display
•
one floppy drive (5¼ or 3½ inch)
•
DOS version 3.0 or higher
•
512k memory
•
one serial port (COM1: or COM2:)
If you want to produce a record of the customized items, you must also have a printer and printer port
(LPT1:).
CAUTION
Do not use this software until you are fully familiar
with both the setup and operation of the Model
90100 TRACKER System.
A complete
understanding of the Basic Operating Equations
Quantities as contained in Sections 3.5 and 3.6 of
this manual is an important prerequisite for
adjusting the electrometer gains and offsets.
5-1
Model 90100
Operators Manual
5.2 Make a Working Disk
Before using the Customization software, we recommend that a working disk be made. To make a
working disk, simply copy all of the files from the disk to a blank, formatted disk. Store the original in a
safe place.
CAUTION
Always operate the Model 90100 TRACKER
System from an AC line power source during the
customization/calibration process to eliminate the
possibility that the 35360A TRACKER Display will
automatically shut off prematurely.
5.3 Connection to the Computer
To prepare the 35360A TRACKER Display for customizing, insert the RS-232 cable into the instrument.
Connect the other end of the RS-232 cable to the computer's serial port. Personal computers have serial
ports that are either 9 or 25-pin. Determine which you have and use the appropriate adapter included
with your 35360A TRACKER Display. Use COM1 if it is available, otherwise use COM2. Turn on the
35360A TRACKER Display. Wait approximately five seconds after turning on the instrument before
starting the Customization software. Place the working disk into the floppy drive. If you wish to operate
the Customization software from the hard drive, copy all of the files from the working disk to a directory on
the hard drive.
5.4 Starting the Customization Software
1. If you are operating from a floppy drive, log onto the drive by typing the drive letter followed by a
colon and press Enter (e.g., for drive A, type a: and Enter).
2. Start the Customization software by typing CUSTOM. If you connected the instrument to COM2 on
your personal computer, type CUSTOM /2.
We recommend that you print a copy of the customization report as your first step in the customization
process. This report will contain all of the customization/calibration values and thus serve as a guide for
returning to the original settings should an operator keyboard error occur during the process. Additionally,
print a copy of the customization report as the final step in the customization process. Use this final
report to verify the new customization/calibration parameter values and then save it in a safe place for
future reference.
5.5 Screen Formats
The customization software contains two different screens: Display Customization Items (Figure 5-1) and
Display Calibration Items (Figure 5-2).
5-2
Customization
Screen Formats
35360A TRACKER Display Customization
It
Power Down
√ 255
I t
Temperature
l
i t
U it
Pressure
F millimeters
h h it
U it
Optional
H *OPTIONAL TEXT LINE*
M
Detector Serial
12345
N Chamber
Ion
b
Cal
R/nC
U it
Display
Units
rad and
Display Units
8.790e-001
d/ i
C
i
d/R
5
TRACKER Display
S/N:
FW Rev: 13AUG92
00001
A
Date
4 Sep
92
Last Calibration
D t 8Jun92 A
The power down interval specifies the
minutes
b the
f Dosimeter remains powered
d i
periods
of inactivity. Enter 0 to disable
Automatic Power Down. The power down
th
i t bel set to any duration from 5 to 255
may
i t
Up
F1 Help
F2 Edit
F6 Print F10 Exit
It
Figure 5-1.
Down
PgDn Calibration
Display Customization Items Screen Appearance
In the middle of the both screens, you may select any Item by placing the cursor on it. As you move
through the list, the Help box updates its information to reflect the cursor position. This is the Selection
mode.
35360A TRACKER Display Calibration
It
Detector
Top
Left
S/N
12345
Charge
G i
Current
G i
Current
Z
IC Cal Fctr
√ 1.0000e+00
0
1.0000e+00
0
1
3.460e+00
0
1.0000e+00
0
1.0000e+00
0
1
3.460e+00
0
Center
1.0000e+00
0
1.0000e+00
0
1
3.460e+00
0
Right
1.0000e+00
0
1.0000e+00
0
1
3.460e+00
0
Bottom
1.0000e+00
0
1.0000e+00
0
1
3.460e+00
0
The Charge Gain provides conversion from
A D to nC for five electrometer channels
counts
operating
h
in the dose mode. The units of
th
Charge Gain is nanoCoulombs per
t
Specify the Ion Chamber Calibration Factor in units of
R/ C
Left
Up
F1 Help
F2 Edit
F6 Print F10 Exit Down
It
Figure 5-2.
Right
PgDn Customization
Display Calibration Items Screen Appearance
5-3
Model 90100
Operators Manual
At the bottom of both screens, the Customization software displays the active keys and a short definition
for each key.
On the Display Customization screen, the serial number of the 35360A TRACKER Display, the firmware's
version, and the current date appear. The date of the last calibration appears in the bottom box. This
date changes to the current date if you make a change to any item.
Finally, in the upper right corner, the status indicator for the RS-232 connection appears. For normal
operation, the status indicator should be two blocks connected by a line (Û⎯⎯⎯Û). If the connection is
severed, the status indicator will indicate so.
F1 Help (On-Line Help for using the Customization software)
Press F1 to view the On-Line Help for the Customization software. The text includes help on editing and
printing.
F2 Edit (Item Editing)
To edit any Item, place the cursor on it and press F2. The Customization software enters Edit mode. The
Item is blanked and a blinking cursor appears to show the position of the next character. Enter text or a
value from the keyboard. For Items that require a choice, use the up and down arrow keys or the space
bar to change the Item.
To exit Edit mode with the changes made to the Item, press Enter. After you press Enter, the
Customization software downloads the new information to the 35360A TRACKER Display. In this
manner, the Customization screens always reflects the information in the instrument. When the download
finishes, the Customization software displays the text, value, or choice it received back from the
instrument. If the returned information does not match the information sent down, an error message
appears indicating a mismatch. The Customization program retains the original text or value if this error
occurs.
To enter large or small values, use scientific notation. The accepted format for this type of entry is
x.xxxE+xxx. For example, 1.234E+001 would be equivalent to 12.34; 1.234E-001 would be equivalent to
.1234. It is not necessary to specify all three exponent digits. The program accepts an entry of "1e9" to
represent 1,000,000,000.
To exit Edit mode without change to the Item, press Escape. The Item will appear in the Selection area
as it did before you entered Edit mode.
F6 Print (Report Printing)
Press F6 to print a report of the customization and calibration items (both screens). The report is one
page.
F10 Exit
Press F10 to exit the Customization software. When the confirmation box appears, press "Y" to exit,
press "N" to return to the Selection mode.
PgDn (Navigation)
Press the Page Down key to move between the Display Customization Items and the Display Calibration
Items screens.
5-4
Customization
Definitions
5
5.6 Definitions
This section describes all of the Items that may be customized with the Customization software. It is split
into two sections matching the two screens.
CUSTOMIZATION ITEMS
Power Down Interval
The power down interval is used to specify the number of minutes the 35360A TRACKER Display
remains powered during periods of inactivity. If the 35360A TRACKER Display senses no operator input
in the form of a key press, exposure, or RS-232 command for the duration of the power down interval, it
will turn itself off. This interval must be in the range of 5 to 255 minutes. An entry of zero will disable the
automatic power down feature.
Temperature Units
This Item provides a selection of temperature scales for use on the 35360A TRACKER Display's Air
Density screen. The choices are: Celsius, Fahrenheit, and Kelvin.
Pressure Units
This Item provides a selection of pressure scales for use on the 35360A TRACKER Display's Air Density
screen. The choices are: millimeters of mercury (Hg), inches of mercury, feet from sea level, meters from
sea level, millibars, and hectoPascals.
Optional Message
Text entered for this Item will appear on the bottom line of the 35360A TRACKER Display's Test screen.
The Item is limited to a maximum of 20 characters.
Ion Chamber Calibration Units (ICCU)
The Ion Chamber Calibration Units Item defines the units in which the ion chambers in the 35300A
Detector were calibrated. The default is roentgens per nanocoulomb.
This means that the Ion Chamber Calibration Factor (ICCF) given on the Display Calibration Items screen
MUST be in units of R/nC. Choices for units are roentgens per nanocoulomb, grays per nanocoulomb,
sieverts per nanocoulomb, and rads per nanocoulomb.
Display Units
The Display Units Item defines the units in which measurements will be displayed on the 35360A
TRACKER Display screen. The choices are roentgens, grays, sieverts, rads, and monitor units. The
default is rads.
Display Units Conversion Factor (DUCF)
The 35360A TRACKER Display uses the Display Units Conversion Factor (DUCF) Item to convert the
output of the ion chambers (in units defined by the Ion Chamber Calibration Units) to the units required for
display (defined by Display Units).
IMPORTANT
You must set the Display Units Conversion Factor
correctly and accurately to convert the ion chamber
output to displayed units. The default is 0.879
rads/R.
5-5
Model 90100
Operators Manual
The 35360A TRACKER Display supports four units of radiation. To convert between these units, use
Table 5-1. This table was developed from accepted definitions of radiation units. While Table 5-1 shows
sieverts and grays as equivalent, we acknowledge that other factors may contribute to this conversion.
Additionally, the instrument allows you to display readings in monitor units. Because monitor units are not
defined in terms of radiation units, and monitor units could vary from machine to machine, we suggest
that you develop your own conversion factor from the Ion Chamber Calibration Units to monitor units.
Table 5-1. A Guideline to Converting Between Units
To Convert:
To:
Multiply By:
roentgen (R)
gray (Gy)
.00879
roentgen (R)
sievert (Sv)
.00879
roentgen (R)
rad
0.879
gray (Gy)
roentgen (R)
113.77
gray (Gy)
sievert (Sv)
1
gray (Gy)
rad
100
sievert (Sv)
roentgen (R)
113.77
sievert (Sv)
gray (Gy)
1
sievert (Sv)
rad
100
rad
roentgen (R)
1.1377
rad
gray (Gy)
.01
rad
sievert (Sv)
.01
DISPLAY CALIBRATION ITEMS
Charge Gain (QG)
The 35360A TRACKER Display uses the Charge Gain to convert the number from the analog-to-digital
converter to charge. The Charge Gain must be in units of nanocoulombs per count.
Current Gain, Current Zero (IG and ADZ)
The 35360A TRACKER Display uses the Current Gain and Current Zero to convert the number from the
analog-to-digital converter to current. The Current Gain must be in units of nanocoulombs per minute,
and the Current Zero must be in units of counts.
Ion Chamber Calibration Factor (ICCF)
The 35360A TRACKER Display uses the Ion Chamber Calibration Factor to convert charge from the
35300A TRACKER Detector ion chambers to radiation units. The factory calibrates the 35300A
TRACKER Detector in units of roentgens per nanocoulomb. The accuracy of the calibration factor is ±
2.5%.
5.7 Setting the Electrometer Gains and Offsets
To set the electrometer gains, you must have a Keithley Instruments, Inc. Model 263 Calibrator/Source or
equivalent. The current required for calibration procedure below must be 15 nanoamperes ± 0.07%; the
charge required for calibration procedure below must be 950 nanocoulombs ± 0.5%. The Electrometer
Offsets must be specified before the Electrometer Gains.
5-6
Customization
Setting the Electrometer Gains and Offsets
5
ELECTROMETER OFFSET (ADZ)
The procedure for setting the electrometer offsets for current and charge is the same. For every
electrometer channel, repeat this procedure once. Turn the instrument off and disconnect the interface
cable if it is connected.
WARNING
Always turn the Model 35360A TRACKER Display's
power off prior to connecting or disconnecting the
interface cable. Failure to do so may result in an
electrical shock.
Turn on the instrument. Place the 35360A TRACKER Display in rate mode. Turn off the Front Panel
Gain Factor (FPGF) and the Air Density Correction Factor (ADCF).
1. Reset the instrument. Note the dose rate offset value for the channel under adjustment displayed
on the VFD. Also note the old ADZ value for the channel under adjustment on the Display
Calibration Items screen. Calculate a new ADZ value using the following equation:
ADZNew = ADZOld + (Dose Rate Offset) / (Current Gain × ICCF × DUCF)
2. Add the value calculated in Step 1 to the original ADZ. Enter this value into the Display Calibration
Items screen of the Customization software. Be sure to enter it in the correct column and row. For
example, if you are setting the charge offset for the Top chamber, enter the calculated value in the
first column and second row.
3. Repeat Steps 1 and 2 if the value displayed on the 35360A TRACKER Display is not zero.
ELECTROMETER GAINS
The procedure for setting the electrometer gains differs for current and charge. For every electrometer
channel, repeat the gain setting procedure for current and charge. Turn off the Front Panel Gain Factors
and the Air Density Correction Factor. This procedure requires a special cable. Consult the factory for
details.
Electrometer Current Gain (IG)
1. Apply 15 nanoamperes (900 nC/min) to the input of an electrometer channel.
2. Check the measurement on the 35360A TRACKER Display's Front Panel. Calculate the new
Current Gain factor using the equation below.
New Current Gain = Old Current Gain
900 x ICCF x DUCF
Measuremen t
where Measurement is the value on the 35360A TRACKER Display, and ICCF and DUCF are
defined on page 60 and page 59 respectively.
3. Enter the value calculated in Step 2 into the Display Calibration Items screen of the Customization
software. Be sure to enter it in the correct column and row. For example, if you are setting the
current gain for the Right chamber, enter the value calculated in Step 1 in the fourth column and
third row.
Electrometer Charge Gains (QG)
1. Reset the instrument and apply 950 nanocoulombs to the input of an electrometer channel.
2. Check the measurement on the 35360A TRACKER Display's Front Panel. Calculate the new
Charge Gain factor using the equation below.
New Charge Gain = Old Charge Gain
950 x ICCF x DUCF
Measuremen t
5-7
Model 90100
Operators Manual
where Measurement is the value on the 35360A TRACKER Display, and ICCF and DUCF are
defined on page 60 and page 59 respectively.
Enter the value calculated in Step 2 into the Display Calibration Items screen of the Customization
software. Be sure to enter it in the correct column and row. For example, if you are setting the
charge gain for the Center chamber, enter the value calculated in Step 1 in the third column and
first row.
If you wish to use the Front Panel Gain Factor and the Air Density Correction Factor, be sure to
enable them after the calibration is finished.
5.8 Usage Examples
CHANGING THE POWER DOWN INTERVAL
1. Place the cursor on the Power Down Interval Item.
2. Press F2. The field clears.
3. Enter 10 and press Enter.
4. The software indicates that it is downloading. When the Item reappears, the download was
successful. The number that appears is the value returned from the 35360A TRACKER Display.
CHANGING THE PRESSURE UNITS
1. Place the cursor on the Pressure Units Item.
2. Press F2. The function key area indicates the keys used to make a choice.
3. Press the spacebar or use the up and down arrow keys to change the units.
4. Select millibars and press Escape. The original units remain and the Customization software
returns to Selection mode.
5. Repeat steps 2 and 3. Select millibars and press Enter.
6. The software indicates that it is downloading. When the Item reappears, the download was
successful.
CHANGING THE DISPLAY UNITS CONVERSION FACTOR
CAUTION
This example changes the current value of a
factory-set conversion factor. Make a note of the
value BEFORE changing it so that it may be set to
this value at the end of the example.
1. Place the cursor on the Display Units Conversion Factor Item.
2. Press F2. The field clears.
3. Enter 0.765 and press Enter.
4. The software indicates that it is downloading. When the Item reappears, the download was
successful. The number that appears is the value returned from the 35360A TRACKER Display.
5. Press F2.
6. Enter the original value and press Enter.
7. The software restores the original value in the instrument.
5-8
Customization
Usage Examples
5
CHANGING THE ION CHAMBER CALIBRATION FACTOR UNITS
CAUTION
This example changes the current value of a
factory-set calibration factor. Make a note of the
value BEFORE changing it so that it may be set to
this value at the end of the example.
1. Press the Page Down key until the Display Calibration Items screen appears.
2. Move the cursor to the Ion Chamber Calibration Factor for the Center chamber.
3. IMPORTANT: Make a note of the current value.
4. Press F2. The field clears.
5. Enter 1.234 and press Enter.
6. The software indicates that it is downloading. When the Item reappears, the download was
successful. The number that appears is the value returned from the 35360A TRACKER Display.
7. Press F2.
8. Enter the original value and press Enter.
9. The software restores the original value in the instrument.
CHANGING THE CURRENT GAIN
CAUTION
This example changes the current value of a
factory set current gain. Make a note of the value
BEFORE changing it so that it may be set to this
value at the end of the example.
1. Press the Page Down key until the Display Calibration Items screen appears.
2. Move the cursor to the Current Gain for the Top chamber.
3. IMPORTANT: Make a note of the current value.
4. Press F2. The field clears.
5. Enter 1e100 and press Enter.
6. The software indicates that it is downloading. Because the value, 1e100, is not a valid value for the
Current Gain, the software indicates a mismatch error. Press any key to clear the error. Note that
the instrument returned a value but not the one that was entered.
7. Enter the original value and press Enter.
8. The software restores the original value in the instrument.
5-9
Model 90100
Operators Manual
5.9 Errors
During program operations, errors may appear. The error messages are grouped into input errors, a
hardware error, and communication errors.
INPUT ERRORS
Input errors may appear while changing Item values. When these errors occur, press any key to clear the
error and enter a different value. After clearing the error, you may press Escape to end editing. The input
errors are:
•
Value must be greater than zero
•
Must specify at least one digit
•
Value must be less than 999.99
HARDWARE ERROR
A hardware error occurs when the program cannot perform a required hardware operation. The only
hardware error is a printer error. If the Customization software cannot send information to the printer, the
following message appears.
Printer Error
Press any key to clear the error. Correct the problem causing the error (for example, out of paper or the
printer is not on-line), and try printing again.
COMMUNICATION ERRORS
These errors indicate that the communications between the computer and the instrument is faulty.
Generally, the icon in the upper right corner indicates the status of the RS-232 connection. The following
errors indicate problems during actual communication. Press any key to clear the error.
Dosimeter is not connected
If the RS-232 connection becomes severed during communication, this error appears. Re-connect the
line and try the download again.
Upload/Download mismatch
If the information received from the 35360A does not match that sent by the Customization software, this
error appears. Generally, the downloaded information was out of the boundary given for the specific Item.
The Customization software retains the ORIGINAL text or value.
Finally, the Customization software checks the RS-232 connection at the beginning of the program. If it
detects that no instrument is connected, the program ends and an error message occurs. Check the
cable for breaks and confirm that the connections are solid. The program defaults to COM1: for the
communications port. If that port is in use, specify COM2: by placing /2 on the command line:
custom /2
Also, make sure that the instrument has been on for at least five seconds.
5-10
Appendix
Using Build-Up
A
Appendix A
Using Build-Up
A.1 Build-Up, Peg, and Retainer Kit Options
If you want to use build-up to simulate tissue, you can put plates of either "solid water" or acrylic (optional
accessories) securely on one or both sides of the Model 35300A Detector. Build-up pegs and retainer
rings for securing the acrylic plates to the 35300A Detector are also available as optional accessories
(see Figure A-1). The build-up pegs (a set of eight) screw into threaded holes in the 35300A Detector,
(four build-up pegs can be installed on each side of the 35300A Detector). The retainer rings are held in
position with set screws that are turned with a hex wrench also included with the Model 90100 TRACKER
System.
Retainer rings
Build-up
Threaded pegs
screw into
35300A Detector
Model 35300A Detector
Hex wrench tightens set
screw on retainer ring
Figure A-1.
Installation of Pegs, Build-up and Retainer Rings
A-1
Model 90100
Operators Manual
Recommended build-up for photons is given in Table A-1; recommended build-up for electrons is given in
Table A-2. Table A-2 takes into account the 0.56 cm water-equivalent inherent in the 35300A Detector.
Cobalt-60 radiation does not require any added build-up.
Table A-1. Recommended Amount of Build-up to Use With the Model 35300A Detector to
Attain Photons dmax for Linear Accelerators
Nominal
Accelerator Potential,
MeV
2
3
4
5
6
7
8
9
10
11
12
13
14
15
16
17
18
19
20
21
22
23
24
25
A-2
Number of build-up
plates
(37051C-1)
0
1
2
2
3
3
3
4
4
4
4
5
5
5
6
6
6
6
7
7
7
7
8
8
"Solid Water"
thickness (cm)
0
0.5
0.5
1.0
1.0
1.5
1.5
1.5
2.0
2.0
2.0
2.0
2.5
2.5
2.5
3.0
3.0
3.0
3.0
3.5
3.5
3.5
4.0
4.0
Appendix
Using Build-Up
A
Table A-2. Recommended Amount of Build-up to Use With the Model 35300A Detector to
Attain Electrons dmax for Linear Accelerators. 37051C-1 Plates are 0.44 cm Each
Nominal
Accelerator Potential,
MeV
2
3
4
5
6
7
8
9
10
11
12
13
14
15
16
17
18
19
20
21
22
23
24
25
Number of build-up
plates
(37051C-1)
1
1
1
2
2
3
3
4
5
5
6
6
7
7
8
8
9
10
10
11
11
12
12
13
"Solid Water"
thickness (cm)
0.5
0.5
0.5
1.0
1.0
1.5
1.5
2.0
2.0
2.5
3.0
3.0
3.5
3.5
4.0
4.0
4.5
4.5
5.0
5.5
5.5
6.0
6.0
6.0
The amount of underside build-up to be used depends on how closely you wish to approximate the backscattering of a water bath or other test set-up. Generally, several inches are used: about eight 37051C-1
plates (or about 4.0 cm of "Solid Water") regardless of the incident energy shown in the tables.
A-3
Fluke Biomedical
Radiation Management Services
6045 Cochran Road
Cleveland, Ohio 44139
440.498.2564
www.flukebiomedical.com/rms