1
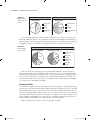
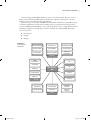
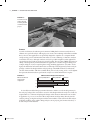
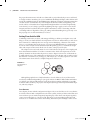
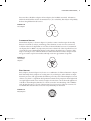
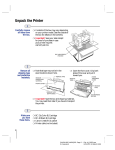
Part 1 RI AL Fundamentals MA TE Although this is a Mastering book, we recognize that not everyone will know how to find every tool or have a mastering of the Revit workflow. The chapters in Part 1 are devoted to rounding out that knowledge and helping to fill in any of those gaps in your knowledge of the toolbox, the UI, or the Revit workflow. CO PY RI GH TE D ◆ Chapter 1: Beyond Basic Documentation ◆ Chapter 2: Principles of Revit ◆ Chapter 3: The Basics of the Revit Toolbox 626962c01.indd 1 6/14/10 10:46:25 PM 626962c01.indd 2 6/14/10 10:46:25 PM Chapter 1 Beyond Basic Documentation In this chapter, we’ll cover some of the principles of a successful building information modeling (BIM) approach within your office environment and summarize some of the many tactics possible using BIM in today’s design workflow. We’ll explain the fundamental characteristics of maximizing your investment in BIM and moving beyond documentation with the BIM model. In this chapter, you’ll learn to •u Leverage the BIM model •u Know how BIM affects firm culture •u Focus your investment in BIM Leveraging the BIM Model Building Information Modeling or BIM is a parametric, 3D model that is used to generate plans, section, elevations, perspectives, details, schedules—all of the necessary components to document the design of a building. Drawings created using BIM are not a collection of 2D lines and shapes that represent a building, but a series of parametric, interactive elements that allow a model to become infinitely more data-rich. These elements can be changed by manipulation of their parametric data. This means creating one door or window can quickly be made into several simply by changing specific parameters associated with that object. Additionally, all of the elements within the model share a level of bidirectional associativity—if the elements are changed in one place within the model, those changes will be visible in all the other views. So, move a door in plan and that door will be moved in all of the elevations, sections, perspectives, and so on in which it is visible. We have all seen the growth in the use of BIM in the past few years within the design and construction industries. Firms have been moving from a two-dimensional (2D) documentation process to take advantage of the benefits of BIM and a model-based document set. According to a recent survey by McGraw-Hill (http://construction.ecnext.com/coms2/summary_0249-296182_ITM_ analytics), the adoption of building information modeling has taken quite a hold within the architecture, engineering, and construction (AEC) industry. By 2009, almost 50 percent of the industry had fully adopted BIM as a workflow, and many of those firms use BIM for their sustainable design and analysis. Figure 1.1 shows the impact of current BIM adoption and the levels of involvement in sustainable projects. 626962c01.indd 3 6/14/10 10:46:25 PM | Chapter 1 Beyond Basic Documentation Figure 1.1 Impact of BIM and use in green projects Level of Involvement in Green Projects Impact of BIM Adoption All Respondents All Respondents 7% 49% Most Positive (8–10) Neutral 44% 23% 50% 27% Most Negative (1–4) Low Involvement (1–4) Moderate High Involvement (8–10) Source: McGraw-Hill Construction, 2008 4 If you look at this growth in a bit more detail (see Figure 1.2), you’ll note an increase across the board of BIM use. Heavy users—firms that have been invested in BIM and are building on that investment—increased 10 percent in 2009 alone. Light users—typically those firms that are making their initial foray into BIM—have jumped 20 percent over the same time frame. Figure 1.2 Growth in BIM use on projects Growth in BIM Use on Projects Total % Projects 2008 Projected Total % 2009 18% 35% 10% 38% 17% 45% 20% 17% Very Heavy Users (>60%) Heavy Users (31–60%) Medium Users (16–30%) Light Users (1–15%) Source: McGraw-Hill Construction, 2008 Even in economically challenging times, it seems that the industry is looking for ways to get projects done better, faster, and greener. The same survey goes on to state that at the 2005 National American Institute of Architects (AIA) convention, out of a room of 4,000 people, there were only about 15 percent of the attendees who could identify with BIM as a workflow and documentation methodology. Four years later, in 2009, more than half the firms are using BIM on a regular basis to document their designs. Planning for BIM As architects or designers, we have accepted the challenge of changing our methodology to adapt to the nuances of documentation through modeling rather than drafting. We are now confronted with identifying the next step. Some firms look to create better and better documents, whereas others are leveraging BIM in building analysis. As we continue to be successful in visualization and documentation, industry leaders are looking to move BIM to the next plateau. Many of these new possibilities are, like BIM was a decade ago, new workflows and potential changes in our culture or habits, which require you to ask yourself a very critical question: What kind of firm do you want to be, and how do you plan to use BIM? 626962c01.indd 4 6/14/10 10:46:25 PM | Leveraging the BIM Model 5 As the technology behind BIM continues to grow, so does the potential. There are a host of things now possible using a BIM model; in fact, that list continues to expand year after year. Figure 1.3 shows some of the potential opportunities. When moving to the next step with BIM—be that better documentation, sustainable analysis, or facility management—it’s important to identify where you land in three primary goals for your use of BIM. Understanding these areas, and specifically how they overlap within your firm, will help you define how cutting edge your firm is willing to be regarding BIM. These three areas are as follows: •u Visualization •u Analysis •u Strategy Figure 1.3 The integrated BIM model Design Visualization/ Animation/Rendering Contractor Use Post Occupancy Eval Client Vision/Goals Constructability Life Cycle Analysis Documentation Direct to Fabrication Regulatory Requirements Materials LEED Documentation Site Sun Shading Daylighting Integrated Model (BIM) Energy Modeling FFE Acoustic Water Use Community Materials Programming Cost Estimating Consultant Integration Facility Management Specifications Interference Checking Materials 626962c01.indd 5 6/14/10 10:46:26 PM 6 | Chapter 1 Beyond Basic Documentation We’ll first define each of these areas individually and then discuss what it means to begin combining them in practice. Visualization Creating documentation using BIM has the added advantage of being able to graphically visualize the project in 3D. Although this was initially conceived as one of the “low-hanging fruits” of using BIM as a workflow, this has led to an explosion of graphics—3D perspectives, wireframes, renderings, and gaming engines—within the industry as a means to communicate design between stakeholders on a project. This digital creation of the project has given us a variety of tools to communicate aspects of the project. It becomes “architecture in miniature,” and we can take the model and create a seemingly unlimited number of interior and exterior visualizations. The same model can be imported directly into a gaming engine like an Xbox and be used to create realistic walk-throughs. Clients no longer need to rely on the designer’s preestablished paths in a fly-through—they can virtually “walk” through the building at their own pace, exploring an endless variety of directions. The same model again can then be turned into a physical manifestation either in part or in whole by the use of digital printers creating small, monochromatic vignettes of space. A variety of types of visualization are currently accessible through a BIM model; we’ll cover some of the different types and their relationships with BIM. The still image might be one of the easiest creations from the BIM model. Once the first shapes are established, you have created a still image, be it in plan, elevation, or perspective. The still images, however, have taken on a variety of uses beyond simple communication of design intent. These images are used to not only describe design intent but also to illustrate ideas about proportion, form, space, and functional relationships. The ease to which these kinds of views can be mass-produced makes the perspective more of a commodity. In some instances, as shown in Figure 1.4, materiality is intentionally removed to focus on the building form and element adjacencies. By adding materiality to the BIM elements, you can then begin to explore the space in color and light, creating photorealistic renderings of portions of the building design. These highly literal images, as shown in Figure 1.5, begin to convey information about both intent and content of the design. Iterations at this level are limited only by processing power. These images can also become analytical tools for the project stakeholders by demonstrating spatial and functional adjacencies and interactions. The photorealism allows for an almost lifelike exploration of color and light qualities within a built space even to the extent of allowing analytic footcandle calculations to reveal the exact levels of light within a space. Finally, the next logical step is taking these elements and adding movement. In Figure 1.6, you can see a still image taken from a photorealistic rendering of a project. These renderings not only can convey time and movement through space but also have the ability to be highly physically accurate in demonstrating how the building will react or perform under real lighting and atmospheric conditions. All of this creates a better idea of building predictability and performance before the built form is realized. 626962c01.indd 6 6/14/10 10:46:26 PM | Leveraging the BIM Model 7 Figure 1.4 Sectional rendering Figure 1.5 An analytic rendering 626962c01.indd 7 6/14/10 10:46:26 PM 8 | Chapter 1 Beyond Basic Documentation Figure 1.6 A still from an animation showing accurate physical conditions for the project Analyze As with visualization, the authoring environment of a BIM platform isn’t necessarily the most efficient one to perform analysis. Although you can create some rendering and animations within Revit, a host of other applications are specifically designed to capitalize on a computer’s RAM and processing power to minimize the time it takes to create a rendering or animation. Analysis is much the same way—although some basic analysis is possible using Revit, other applications are much more robust and can create more accurate results. The real value in BIM is the interoperability of model geometry and metadata between applications. Consider energy modeling as an example. In Figure 1.7, we’re comparing three energy modeling applications: A, B, and C. In the figure, the darkest bar reflects the time it takes to either import model geometry into the analysis package or redraw the design with the analysis package. The middle shaded color reflects the amount of time needed to add data not within Revit, such as loads, zoning, and so on. The lightest bar represents the time it takes to perform the analysis once all the information is in place. BIM Environmental Analysis Time Comparison Figure 1.7 BIM environmental analysis time comparison Geometry Manipulation Adding Load Data Simulation A B C In A and B, we modeled the project in Revit but were unable to use the model geometry in the analysis package. This caused the re-creation of the design within the analysis tool and also required time to coordinate and upkeep the design and its iterations between the two models. In application C, you can see we were able to import Revit model geometry directly into the analysis package, saving almost 50 percent of the time needed to create and run the full analysis. Using this workflow, it is possible to bring analysis to more projects, perform more iterations, or do the analysis in half the time. 626962c01.indd 8 6/14/10 10:46:26 PM | Leveraging the BIM Model 9 This same workflow is true for daylighting (Figure 1.8) and several other types of building performance and design analysis. By being able to repurpose the Revit model geometry, we are able to lose many of the “rules of thumb” we have created as designers along the way and begin to rely on calculated results. The Revit model also ensures consistency and accuracy of design through analysis by using the model as the sole point source for design geometry. Figure 1.8 Daylighting overlay from 3ds Max Design Building analysis can reach beyond just the design phase and into facility management. Once the building has been constructed, that doesn’t mean the use of the BIM model needs to end. More advanced facilities management systems allow us to track—and thereby trend—building use over time. Building use historically changes over a building’s life span. By trending building use, you can begin to then predict future use patterns and help anticipate future use. This can help you become more proactive with maintenance and equipment replacement because you will be able to “see” how equipment performance begins to degrade over time. Trending will also aid you in providing a more comfortable environment for the building occupants by understanding historic use patterns and allow you to keep the building tuned for optimized energy performance. Strategize To maximize your investment in a BIM-based workflow, it’s necessary to apply a bit of planning. As in design, a well-planned and flexible implementation is paramount to a project’s success. By identifying goals on a project early on in the process, it allows the BIM model to be created to efficiently reach those ideals. A good BIM strategy answers three key questions about a project: •u What processes do we need to employ to achieve our project goals? •u Which people and team members are key to those processes? •u What technology or applications do we need in place to support the people and process? Ask these questions to your firm as a whole so you can collectively work toward an expertise in a given area, be that sustainable design or construction, or something else. Ask the same questions of an individual project as well so you can begin building the model in the early stages for 626962c01.indd 9 6/14/10 10:46:26 PM 10 | Chapter 1 Beyond Basic Documentation the proper downstream use. In both cases (firm-wide or project-based), the processes will need to change in order to meet the goals you’ve established. Modeling techniques and workflows will need to be established. Analysis-based BIM requires different constraints and requirements than a model used for clash detection. If you’re taking the model into facilities management, you’ll need to add a lot of metadata about equipment but might need the level of detail significantly lower than if you are looking to perform daylighting. Having to apply a new level of model integrity after the fact (like halfway through documentation) can be a frustrating and timeconsuming endeavor. Regardless of the goal, setting and understanding those goals early on in the project process is almost mandatory for success. Setting Firm Goals for BIM Combining visualization, analysis, and strategy will help you define your adoption curve and help you locate your future direction. It’s important to note that no matter where you fall or how these elements are combined, there is no wrong answer. Identifying a direction is the critical piece so you can better plan for the success of your projects. BIM ultimately is a communication tool. It can aid in analysis and documentation, but the primary goal is to communicate design ideas and concepts to the team in all the various states of the project’s life cycle. The adoption curve isn’t really much of a curve. We’ll discuss the process of moving beyond basic documentation with the use of three concentric circles. Each circle represents one of the primary elements we discussed in the previous sections. Figure 1.9 shows two of the iterations possible with the curve. The combination on the left shows a late adopter and one where each of the elements—visualization (V), strategy (S), and analysis (A)—are fairly separate of each other. The other iteration shows almost a complete integration of these tools. Figure 1.9 Two extremes of adoption V VAS S A Although the graphic shows a fairly balanced use of each of these tools, any of them can be used in any combination depending on your goals and uses for BIM. To better understand where you fall into any of the possible iterations, we’ll discuss three examples and what those possible workflows will look like to your projects: late adopters (the image on the left), intermediate adopters, and early adopters. Late Adopters Late adopters, shown with the configuration in Figure 1.10, see each of these tools as very distinctive efforts. There is little overlap between each of the systems, and any of them can be taken and removed from a process without negatively impacting any of the others. Late adopters typically come to new technologies as a strong second. This means you’re not picking up the latest and newest tools or workflows that come to the industry, but instead you’re waiting for others to test 626962c01.indd 10 6/14/10 10:46:26 PM | Leveraging the BIM Model 11 these new ideas a bit before adoption. In late adoption, the I in BIM is not critical. Information within the model will be used for documentation (i.e., door schedules), but analysis will probably be done using different model sources. Figure 1.10 Late adoption V S A Intermediate Adoption Intermediate adopters, as shown in Figure 1.11, tend to assume a much stronger relationship between visualization, analysis, and strategy. These elements are seen in a more concurrent workflow and are more dependent on each other for their individual successes. For intermediate adopters, the I in BIM is very important, and a more robust level of data is pulled from various model resources. Intermediate adopters see the changes in technology as a means to help improve current processes and make them more efficient and effective. These changes in technology are used to explore new markets and help create new opportunities for growth. Figure 1.11 Intermediate adoption V S A Early Adoption Early adoption, shown in Figure 1.12, focuses on a combination of all these elements in a dependent relationship. Early adopters are creating new tools, technologies, and workflows to implement new processes and opportunities that did not previously exist in the marketplace. In each of these cases, there is a significant development investment and a perception where higher risk can equal higher reward. It is not nearly enough to have the best or most advanced applications available on the marketplace, but there is a need to create the “next best thing.” The I in BIM to early adopters becomes a core part of their strategy for project success. They do not wait to follow markets but instead work to create new ones, which they can then lead. Figure 1.12 Early adoption 626962c01.indd 11 VAS 6/14/10 10:46:27 PM 12 | Chapter 1 Beyond Basic Documentation How BIM Affects Firm Culture In understanding where you are and where you want to be in this adoption curve, it’s also important to understand that moving between any of the iterations of this curve requires a shift in your internal firm culture. As anyone who’s adopted BIM can tell you, the difficulties you might experience do not come from learning a new application but understanding how that application affects your workflow—and managing that change. That ability to adapt and accept that change within an organization will in some way determine where you fall on the adoption curve. Predictability vs. Innovation To understand the process of any change, think about it as a product of happiness over time, as shown in Figure 1.13. The process of any change, be it adoption of a new workflow or tool within your office to a more personal one, such as acquiring a new cell phone, can be described by this curve. Innovation Happiness Figure 1.13 Happiness vs. time in technological adoption Predictability Time Let’s use the simple example of a new cell phone. When you first get the new cell, there is an increase in your happiness. The new device might have a color screen, allow you to send or receive emails, play games, or find the nearest Starbucks. As you gain familiarity with these features, your happiness goes up. At some point in your adoption or process, there is an initial pinnacle to your happiness. You briefly plateau. This occurs when you are now asked to do something within a limited time frame or utilize a new feature that is outside your comfort zone—and things don’t proceed as planned. In our cell phone example, this could occur the first time you try to synchronize your phone with the office email server, and instead of performing correctly, it duplicates or shuffles your contacts. Now the names are no longer associated with the proper phone numbers or email addresses, and the system you’ve come to rely on is now unpredictable. In a BIM-based example, this could mean you have a schematic design deadline, or you need to create a wall section or model a set of ornate stairs in a limited amount of time. You might know that the task is technically possible, but you have yet to ever perform that task personally. There comes a point as your stress level goes up that your happiness begins to decline and you hit a point (shown as a dot on the graph in Figure 1.13). At this point, you perceive a crossroads: do you go back to the previous technology (the old phone) and choose a path of predictability, or do you muscle forward and push for mastering the change for the hopes of innovation? Any system, no matter how inefficient, if it is predictable, there is a certain amount of comfort associated with the existing system. As you try to find your way along the adoption curve, understand that part of 626962c01.indd 12 6/14/10 10:46:27 PM | Focusing Your Investment in BIM 13 what you are trying to manage—either personally or for your project team—is this predictability versus innovation while trying to maintain a level of happiness and morale. Evolution vs. Revolution While you’re in the process of trying to manage the amount of change you’re willing to endure, you also need to consider the rate that change will affect your project teams. Progress and innovation are iterative and can take several cycles to perfect a technique or workflow. That can become a real challenge if you’re working on a very large-scale design. The process of change and creating new methodologies using BIM is an evolution, not a revolution. Figure 1.14 shows two bicycles. The image on the left is the penny-farthing bicycle taken from Appleton’s Cyclopaedia of Applied Mechanics of 1892. Although not the first bicycle (which was invented in 1817 in Paris), it does demonstrate many of the rudimentary and defining features of what we think of a bicycle today: two wheels, a handlebar, and pedals to supply power. The image on the right is the 2006 thesis design of Australian University student Gavin Smith. The bike was designed to assist people with disabilities or those with impaired motor skills in riding a bike unaided. The basic concept is that the bike would supply its own balance at low speeds, and the wheels would remain canted. As the bike moves faster and wheel speed increases, the wheels become vertical and the rider is able to ride at faster speeds while balancing mostly on his or her own. As the bike slows, the wheels cant back in again, giving the rider the necessary balance needed at lower speeds. The bike on the right, still possessing all of the distinguishing characteristics of what we define as a bicycle, is an evolution of the bike over many, many iterations. A similar evolution will occur with your use of BIM—the more often you iterate the change, the better and more comfortable it will become. Figure 1.14 Understanding replication vs. innovation Replication Innovation Focusing Your Investment in BIM One of the common assumptions is that larger firms have a bigger investment than smaller firms in their capacity to become early adopters, take on new technologies, or innovate. Although larger firms might have a broader pool of resources, much of the investment is proportionally the same. We have been fortunate enough to help a number of firms implement Revit over the years, and each has looked to focus on different capabilities of the software that best express their individual direction. Although all of these firms have varied in size and individual desire to take on risk, their investments have all largely been relatively equal. From big firms to small, with very little variation, the investment ratio consistently equals about 1 percent the size of the firm. If you consider a 1,000-person firm, that equals about 10 full-time people; however, scale 626962c01.indd 13 6/14/10 10:46:27 PM 14 | Chapter 1 Beyond Basic Documentation that down to even a 10-person firm, and if you apply the same one percent, that becomes one person’s time for three full weeks. The key to optimizing this 1 percent investment is focusing the firm’s energy and resources. As the technologies behind BIM continue to expand, so do the opportunities for specialization, so you will need to pick and choose strategically to focus the efforts and direction of your firm. The following list highlights many of the expanded uses possible today based on a BIM model. Some of these things are core precepts of what BIM is and does, such as 3D visualization; some, like energy modeling, are more emerging technologies; and others, such as facility management, are truly cutting edge. •u Construction documentation •u Coordinated documentation •u Automated keynoting •u Consultant coordination (integrating multiple models) •u Design visualization •u Scheduling systems/materials/quantities •u Specifications •u Furniture, Finishes, and Equipment (FF&E): tracking/logging/procurement •u Spatial program validation •u Construction •u Constructability analysis •u Clash detection •u Quantity take-offs •u Cost analysis/estimating •u Direct to fabrication •u Traffic studies •u Building performance analysis •u Rainwater reclamation •u PV access •u Energy analysis •u Daylighting •u Solar studies •u Computational fluid dynamics analysis •u LEED documentation 626962c01.indd 14 6/14/10 10:46:27 PM | The Bottom Line 15 •u Programming •u Facilities management •u Asset tracking •u Trending If the investment (regardless of scale) is focused and planned, it can still leverage strong potential. Identifying the importance of visualization, analysis, and strategy to your firm and process will help guide you in selecting areas of focus within your own practice. When choosing the specialization or how much focus to give to visualization, analysis, or strategy within BIM, there are no wrong answers. Just choose a path that reflects the comfort level of your firm to take risks while focusing on selected areas of specialization. Throughout this book, we will elaborate on many of these elements and demonstrate, using real-world examples, how to use these techniques to visualize, analyze, and strategize with your use of Revit. The Bottom Line Leverage the BIM model. Understanding the level of risk your firm is willing to take in new technologies will help you establish goals for your future use of BIM. Master It Using the three areas of firm integration (visualization, analysis, and strategy), define how those areas overlap for your firm or project. Know how BIM affects firm culture. Not only is the transition to BIM from 2D CAD a change in applications, but it’s also a shift in workflow and firm culture. Understanding some of the key differences helps to ensure project and team success during the transition. Master It What are some of the ways that BIM differs from CAD, and how does this change the culture of an office or project team? Focus your investment in BIM. One of the key elements to understanding BIM beyond documentation is simply to have an awareness of the possibilities. This allows you to make an educated decision as to what direction your firm or project would like to go. Master It List some of the potential uses of a BIM model beyond documentation. 626962c01.indd 15 6/14/10 10:46:27 PM 626962c01.indd 16 6/14/10 10:46:27 PM