1
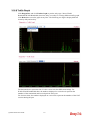
3.16.8 Traffic Graph
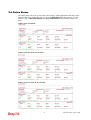
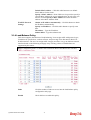
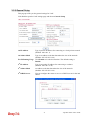
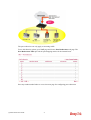
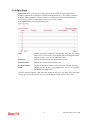
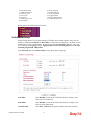
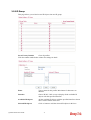
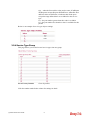
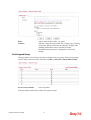
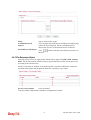
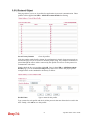
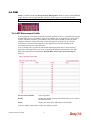
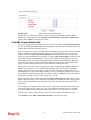
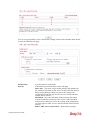
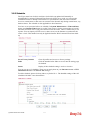
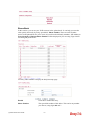
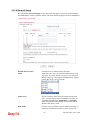
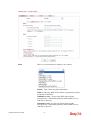
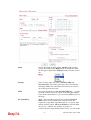
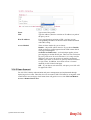
Click Diagnostics and click Traffic Graph to pen the web page. Choose WAN1
Bandwidth/WAN2 Bandwidth, Sessions, daily or weekly for viewing different traffic graph.
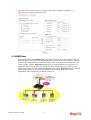
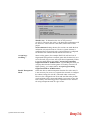
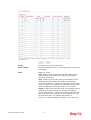
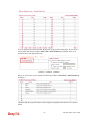
Click Refresh to renew the graph at any time. The following two figures display different
charts by daily and weekly.
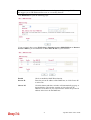
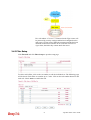
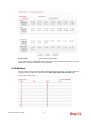
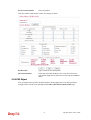
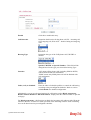
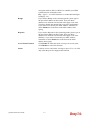
The horizontal axis represents time. Yet the vertical axis has different meanings. For
WAN1/WAN2 Bandwidth chart, the numbers displayed on vertical axis represent the
numbers of the transmitted and received packets in the past.
For Sessions chart, the numbers displayed on vertical axis represent the numbers of the NAT
sessions during the past.
igor2930 Series User’s Guide
243