1
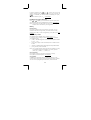
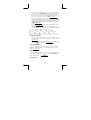
darker.
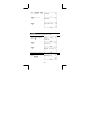
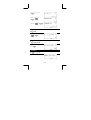
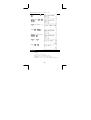
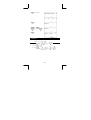
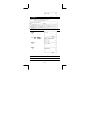
Display Features
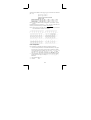
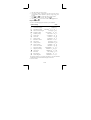
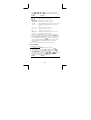
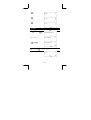
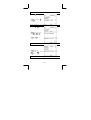
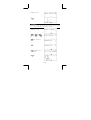
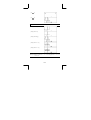
Graph display
Calculation display
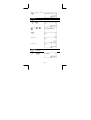
Entry line
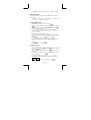
Displays an entry of up to 76 digits. Entries with more than 11
digits will scroll to the left. When you input the 69th digit of a
single entry, the cursor changes from
to
to let you
know that you are approaching the entry limit. If you need to
input more than 76 digits, you should divide your calculation
into two or more parts.
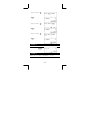
Result line
Displays the result of a calculation. 10 digits can be displayed,
together with a decimal point, a negative sign, the x10
indicator, and a 2-digit positive or negative exponent. Results
that exceed this limit are displayed in scientific notation.
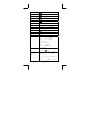
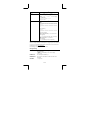
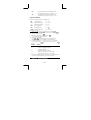
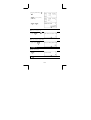
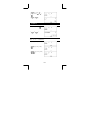
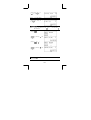
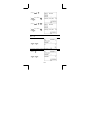
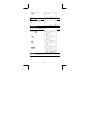
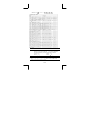
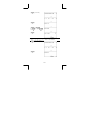
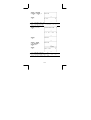
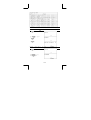
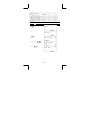
Indicators
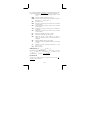
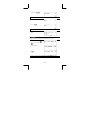
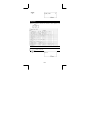
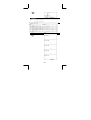
The following indicators appear on the display to indicate the
status of the calculator.
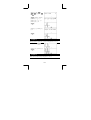
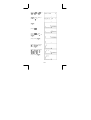
Indicator
Meaning
M
Values are stored in running memory
–
Result is negative
Invalid action
2nd
The next action will be a 2nd function
X=Y=
The x- and y-coordinates of the trace function pointer
Alphabetic keys are active
STAT
Statistics mode is active
PROG
Program mode is active
Angle mode: Degrees, Rads, or Grads
E-5