1
6-3-4
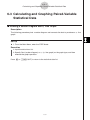
Calculating and Graphing Paired-Variable Statistical Data
○ ○ ○ ○ ○
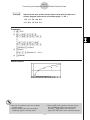
Example
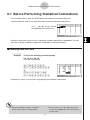
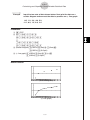
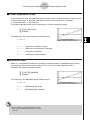
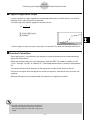
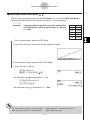
Input the two sets of data shown below and plot the data on a scatter
diagram. Next, perform logarithmic regression on the data to display
the regression parameters, and then draws the corresponding
regression graph.
0.5, 1.2, 2.4, 4.0, 5.2,
–2.1, 0.3, 1.5, 2.0, 2.4
Procedure
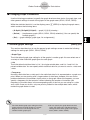
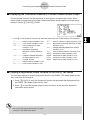
1 m STAT
2 a.fwb.cw
c.ewewf.cw
e
-c.bwa.dw
b.fwcwc.ew
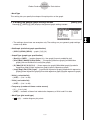
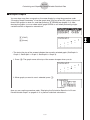
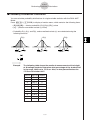
1(GRPH)f(Set)c1(Scat)i
1(GRPH)b(S-Gph1)
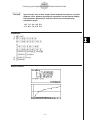
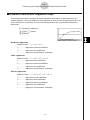
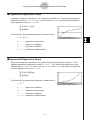
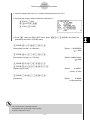
3 4(CALC)h(Log)
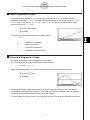
4 6(DRAW)
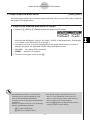
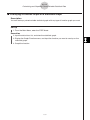
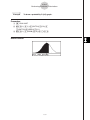
Result Screen
19990401