1
How to optmize the Detector
2
Signal A in the detector default method is set to sample 250,100, reference
360,100, that is, the average absorbance from 200 – 300 nm minus the average
absorbance from 300 – 400 nm. As all analytes show higher absorbance at
200 – 300 nm than at 300 – 400 nm, this signal will show you virtually every
compound which can be detected by UV absorbance.
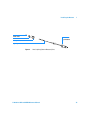
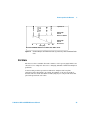
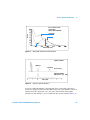
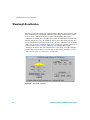
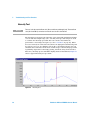
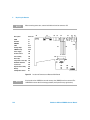
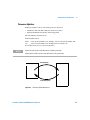
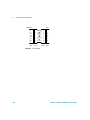
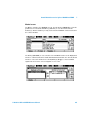
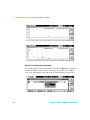
Many compounds show absorbance bands in the spectrum. Figure 10 shows
the spectrum of anisic acid as an example.
To optimize for lowest possible detectable concentrations of anisic acid, set
the sample wavelength to the peak of the absorbance band (that is, 252 nm)
and the sample bandwidth to the width of the absorbance band (that is,
30 nm). A reference of 360,100 is adequate. Anisic acid does not absorb in this
range.
If you work with high concentrations, you may get better linearity above
1.5 AU by setting the sample wavelength to a valley in the spectrum, like
225 nm for anisic acid.
Anisic acid
Absorbance (mAU)
sample wavelength 252 nm
Reference bandwidth 100 nm
30 nm
bandwidth
Reference wavelength 360
Wavelength (nm)
Figure 10
Optimization of Wavelength Setting
1100 Series DAD and MWD Reference Manual
37