1
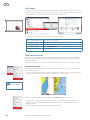
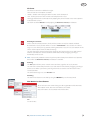
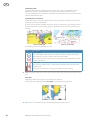
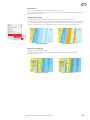
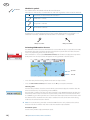
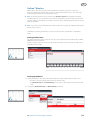
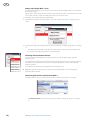
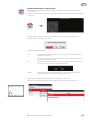
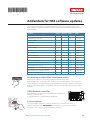
988-10490-001 simrad-yachting.com 1/5 Addendum for NSS software updates This addendum documents new features that are included in NSS RTM-2, RTM-2,5 and RTM-3 software upgrades, and that are not described in the NSS Operator manual or other documentation. Feature RTM-2 RTM-2,5 RTM-3 Positioning multiple Man Over Board marks page 2 page 2 page 6 GRIB weather page 10 page 11 GoFree™ Wireless page 13 FLIR camera control Fusion Link Support Mercury VesselView 7 Integration NMEA 0183 Data logging Damping Configuring the GS25 GPS Antenna OUT MOB AIS SART IN MOB page 1 New chart features BEP CZone Enhancement page 1 Screen capture StructureMap page 1 OP40 Remote controller pdf viewer Refer page 18 page 19 page 20 page 20 page 21 page 21 page 23 Positioning multiple Man Over Board marks The NSS RTM-3 allows for positioning multiple Man Over Board marks. Multiple MOB marks are positioned by repeated presses on the MOB keys. The vessel will always continue to navigate towards the initial MOB mark until the waypoint is reached, or until you stop the navigation. Navigation to subsequent MOB marks will need to be done manually. OP40 Remote controller PUS H STBY AUTO TO TE EN With NSS RTM-3 you can connect an OP40 to the network and remotely control the NSS. A separate manual is included with the OP40 unit. R MARK MENU GOTO PAGES IN MOB OUT MOB DISPLAY MOB 1 4 GHI 7 PQRS STBY AUTO 2 ABC 3 DEF IN OUT PLOT MARK GO TO VESSEL RADAR 6 MNO CHART 8 TUV 9 WXYZ ECHO NAV 0 PWR INFO PAGES 5 JKL MENU WIN Screen capture The screen capture function is no longer available as a selection in the menu. Simultaneously press the GOTO/Pages key and power key to take a screenshot. By default, screen captures are saved to internal memory. NSS | Addendum for RTM-2, RTM-2.5 and RTM-3 |1 EN pdf viewer The pdf viewer makes it possible to read the manuals and other pdf files on the NSS unit. The manuals can be read from an inserted Micro-SD card or copied to the unit’s internal memory. NSS manuals can be downloaded from www.simrad-yachting.com. Use the keys and softkeys to maneuver in the pdf file as below: Search, Page Up/Down Scroll pages Panning on page Zoom In/Out Exit the pdf viewer Tap the relevant softkeys Turn the rotary knob Drag finger on the screen in any direction Press the IN/OUT keys Press the X key New chart features The NSS is delivered with different cartography depending on region. All units will support Navionics Platinum Plus, TurboView and C-Map (by Jeppesen) via micro-SD card or via the Ethernet network. Charts can be shared over the Ethernet network, so only one chart card per boat is required. Selecting chart type Chart type is now selected from the chart options menu, and the selection is set individually for each chart panel. If you have different chart types available - embedded, in the SD card slot or on the Ethernet you can show two different chart types simultaneously in a split screen. See the Operator manual for how to customise pages. ¼¼ Note: To show C-Map charts, you need to select Insight chart type in the menu. If Insight chart is embedded and you have a C-MAP card in the slot or on the Ethernet network, the system will automatically select the chart with most chart details for your displayed region. The same applies if you have two Navionics charts available. 2| NSS | Addendum for RTM-2, RTM-2.5 and RTM-3 EN 3D charts 3D charts are now also available for Insight. There are two 3D view options available: • Rotate - default view keeping the boat in center on the chart panel • Pan - allows you to move the 3D chart view away from the vessel You toggle between these two options by tapping the pan and rotate icons. Active option is indicated with red icon. You return to default Rotate view by tapping the Return to vessel panel button. Rotating the 3D chart In this view the camera position is fixed, and the camera can only be rotated and tilted. Be default the vessel’s position will be in center if Look Ahead is not selected. The camera angle is as seen from your eye position, looking toward the vessel. The vessel’s rotation on the chart is defined by the chart orientation settings. You can change the camera’s tilt angle by dragging your finger on the screen with vertical motions. You rotate the camera around it’s own vertical axis by dragging your finger horizontally on the screen. ¼¼ Note: You can only rotate the camera if you have panned away from default vessel position, that is when the Return to vessel panel button is available. Panning The Pan option allows you to view the entire 3D chart, regardless of vessel position. You move the camera away from the vessel and around in the chart by dragging your finger on the screen. When you remove your finger from the screen the view will remain in the selected position. The camera’s tilt angle is as set in Rotate view. Zooming You zoom in and out on a 3D chart by using the IN/OUT keys or the rotary knob. New Navionics chart features There has been some minor changes to the organization of the Navionics chart option menu, and some new features are added. Only new features are described in this Addendum. 3D See “3D charts”. NSS | Addendum for RTM-2, RTM-2.5 and RTM-3 |3 EN Community edits Toggles on the chart layer including Navionics edits. These are user information or edits uploaded to Navionics Community by users, and made available in Navionics charts. For more information refer to Navionics information included with your chart, or to Navionics website: www.navionics.com. Dynamic tides and currents Shows tides and currents with a gauge and an arrow instead of the diamond icons used for static tides and current information. The tide and current data available in Navionics charts are related to a specific date and time. The NSS animates the arrows and/or gauges to show the tides and currents evolution over the time. Dynamic Tide information The following icons and symbology are used: Icons Dynamic Current information Description Current speed. The arrow length depend on the rate, and the symbol is rotated according to flow direction. Flow rate is shown inside the arrow symbol. Red symbol used when current speed is increasing,- blue symbol when current speed is decreasing. Tide height. The gauge has 8 labels and is set according to absolute max/min value of the evaluated day. Red arrow used when tide is rising,- blue arrow when tide is falling. ¼¼ Note: All numeric values are shown in the relevant system units (unit of measurement) set by user. Easy View Magnifying feature increasing the size of chart items and text. In the split screen image below the Easy View is turned ON in the right panel. ¼¼ Note: There is no indication on the chart showing that this feature is active. 4| NSS | Addendum for RTM-2, RTM-2.5 and RTM-3 EN Rock Filtering Hides rock identification on the chart beneath a given depth. This helps you to declutter charts in areas where there are many rocks located at depths well below your vessel draught. Depth highlight range Select a range of depths between which Navionics will fill with a different color. This allows you to highlight a specific range of depths for fishing purposes. The range will only be as accurate as the underlying chart data, meaning that if the chart only contains 5 meter intervals for contour lines, the shading will round to the nearest available contour line. No Depth Highlight Range Depth Highlight Range, 6 m – 12 m Shallow water highlight Highlights areas of shallow water. This allows you to highlight areas of water between 0 and the selected depth (up to 10 meters/30 feet). No Shallow water highlighted NSS | Addendum for RTM-2, RTM-2.5 and RTM-3 Shallow water highlight, 0 m – 3 m |5 EN StructureMap The StructureMap™ feature overlays SideScan images from a StructureScan on the map. This makes it easier to visualize the underwater environment in relation to your position, and aids in interpreting SideScan images. The example below shows a chart panel with Structure overlay, combined with a traditional SideScan panel. You move around in the chart as usual when you have a Structure overlay; -- zoom the chart and the scanned image by using the IN/OUT keys or the rotary knob -- move the chart to view scanned image by dragging your finger in the selected direction Pressing the X key will remove the cursor from the panel, and the chart center will be positioned at the vessel. Activating Structure overlay 1. Turn on Structure overlay from the chart menu -- The chart menu will be increased to show Structure options -- Structure data will start to appear on the chart screen as soon as Structure overlay is enabled 2. Select Structure source -- Live data is default ¼¼ Note: Structure overlay can also be activated by selecting a saved StructureMap file from the Files dialog. 6| NSS | Addendum for RTM-2, RTM-2.5 and RTM-3 EN StructureMap sources Two sources can be used to overlay Structure logs on the charts; -- Live data, used when StructureScan units are connected to the NSS system -- Saved files. These are recorded StructureScan (*.sl2) data that are converted to StructureMap (*smf) format. Saved *.smf files can be used on NSS units even if no StructureScan units are connected. Live source When live data is selected the SideScan imaging history is displayed as a trail behind the vessel icon. The length of this trail will vary depending on available memory in the unit and range settings. As the memory fills up the oldest data will automatically be deleted as new data is added. When increasing the search range the ping speed of the StructureScan transducer is reduced, but the width and the length of the image history will be increased. ¼¼ Note: Live mode does not save any data. If the unit is turned off, all recent data is lost. Saved files When Saved files are selected, the StructureMap file is overlaid on the map based on position information in the file. If the chart scale is large, the StructureMap area will be indicated with a boundary box until the scale is large enough to show Structure details. Saved mode is used to review and examine StructureMap files, and to position the vessel on specific points of interest on a previous scanned area. ¼¼ Note: When saved files are used as source, the NSS displays all StructureMap files found on the Micro-SD card and in the system’s internal memory. If there is more than one StructureMap of the same area, the images will overlap and clutter the chart. If several logs of the same area are required, the maps should be put on separate Micro-SD cards. StructureMap tips -- To get a picture of taller structure (a wreck, etc) — don’t drive over it. Steer the boat so the structure will be on the left or right side of your boat -- Don’t use Autorange when using SideScan. Set your structure range to a significantly greater level (two-to-three times) than the water depth to ensure a complete scan and to maximize conversion accuracy -- Don’t overlap history trails when conducting a side-by-side scan of an area NSS | Addendum for RTM-2, RTM-2.5 and RTM-3 |7 EN Recording StructureScan data StructureScan data can be recorded from a chart panel with Structure overlay enabled. StructureScan recordings can also be started from a StructureScan panel. Refer to the NSS Operation manual for more details. When StructureScan data is being recorded, there will be a flashing red symbol and a message will appear periodically at the bottom of the screen. ¼¼ Note: The message includes information about file size. Keep the size of your sonar logs to 100MB or less to allow for faster file conversion. The sounder recording is stopped by re-selecting the record function. Converting StructureScan data to StructureMap format A StructureScan log file (.sl2) is converted to StructureMap format (.smf ) after recording from the recording dialog, or from the Files dialog. You can create standard or high resolution files. High resolution .smf files capture more detail, but take longer to convert and are larger than standard resolution files. To save disc space it is recommended to remove the StructureScan (*.sl2) files after conversion. Using StructureMap with mapping cards StructureMap allows you to maintain full chart capability, and it can be used with embedded cartography as well as Navionics, Insight and other third-party charting cards compatible with the NSS systems. When using StructureMap with mapping cards, copy the StructureMap (.smf ) files to the unit’s internal memory. We recommend keeping copies of StructureMap files on external Micro-SD cards. 8| NSS | Addendum for RTM-2, RTM-2.5 and RTM-3 EN Structure options You adjust the StructureMap settings from the Structure options menu. The menu is available when Structure overlay is enabled. Not all options are available when saved StructureMap files are used as source. Unavailable options are greyed out. Structure Options, Live data Range Transparency Structure Options, Saved data Sets the search range Sets the opaqueness of the Structure overlay. With minimum transparency settings the chart details will be almost hidden by the StructureMap overlay Transparency: Max Transparency: Min Palette Selects Structure palette Color Adjusts the intensity of the Structure image. The more you increase the color the more echoes will be displayed Shows/hides the water column in Live mode. Turned OFF schools of bait fish might not be seen on the SideScan image. Water column Turned ON the accuracy of the SideScan image on the map might be affected by the water depth. Water column: OFF Frequency Water column: ON Sets the transducer frequency used by the unit. 800 kHz offers the best resolution, while 455 kHz has greater depth and range coverage Noise rejection Filters the signal interference and reduces the on-screen clutter Clear live history Clears existing live mode history trails from the screen and begins showing only the most current data Record data Records StructureScan data Source Selects StructureMap source NSS | Addendum for RTM-2, RTM-2.5 and RTM-3 |9 EN AIS SART When an AIS SART (Search And Rescue beacon) is activated, it starts transmitting its position and identification data. This data is received by your AIS device. If your AIS receiver is not compliant with AIS SART, it interprets the received AIS SART data as a signal from a standard AIS transmitter. An icon is positioned on the chart, but this icon is an AIS vessel icon. Refer icon description in the NSS Operator manual. If your AIS receiver is compliant with AIS SART, the following take place when AIS SART data is received: • An AIS SART icon is located on the chart in the position received from the AIS SART • An alarm message is displayed If you have enabled the siren, the alarm message will be followed by an audible alarm The following section describes the options available when an AIS SART message is received by a Navico NAIS-400 transponder. AIS SART alarm message When data is received from an AIS SART, an alarm message is displayed on the NSS . This message includes the AIS SART’s unique MMSI number, its position and its distance and bearing from your vessel. You have three options: 1. Ignore the alarm -- The alarm is muted and the message closed. The alarm will not reappear ¼¼ Note: If you ignore the alarm, the AIS SART icon remains visible on your chart, and the AIS SART remains in the Vessels list. If the AIS stops receiving the AIS SART message, the AIS SART remains in the Vessels list for 10 minutes after it receives the last signal. 2. Save the waypoint -- The waypoint is saved to your waypoint list. This waypoint name will be prefixed with MOB AIS SART - followed by the unique MMSI number of the SART. e.g. MOB AIS SART 12345678. 3. Activate the MOB function -- The display switches to a zoomed chart panel, centered on the AIS SART position -- The NSS creates an active route to the AIS SART position ¼¼ Note: If the MOB function is already active, this will be terminated and replaced by the new route towards the AIS SART position! If you select the AIS SART icon on the chart you will see the AIS MOB details. 10 | NSS | Addendum for RTM-2, RTM-2.5 and RTM-3 EN GRIB weather The NSS includes a GRIB data viewer. You can import GRIB files via a Micro-SD card inserted into the card reader, and overlay the information onto your charts. The GRIB data is available for download from www.grib.us. Importing GRIB data GRIB data must be imported into memory before it can be used. The file can be imported directly from a Micro-SD card, or from the NSS if you have previously copied the file to the device. ¼¼ Note: GRIB data that is imported from a Micro-SD will not be saved in the NSS. The data will be lost when new GRIB data is imported. Select the GRIB file on the Micro-SD card or on the device to import the data. The GRIB weather display Imported GRIB weather data can be displayed as an overlay on your chart panel. Pressure contours Wind barbs GRIB information window When the GRIB weather overlay is selected, the chart menu will increase to show GRIB weather options. From this menu you can select which weather symbols you want to display, set the distance between the barbs, and you can adjust the opaqueness of the weather symbols. From this menu you can also animate the weather forecast as described later in this chapter. NSS | Addendum for RTM-2, RTM-2.5 and RTM-3 | 11 EN Direction Wind barb symbols The rotation of the wind barbs indicate the wind direction. Wind speed is indicated by a combination of small and large barbs at the end of the wind tail. Zero knots / Indeterminate wind direction Small barb = 5 knots Large barb = 10 knots Arrow barb = 50 knots If a combination of 5 and 10 knot barbs are shown on a tail then these will need to be added together to give you the total wind speed. The example below shows 3 x large barb + 1 x small barb = 35 knots, and 60 knots indicated with 1 x arrow barb + 1 x large barb. Wind speed: 35 knots Wind speed: 60 knots Animating GRIB weather forecast The GRIB data contains forecast information for a set number of days. It is possible to animate the weather data and to show the predicted forecast for a specific time and date. The time scales vary depending on the file you are using. Once animation is selected, the Clear time control panel button is displayed on top of the chart panel. Time and speed dials will appear on the right hand side of the panel. Speed dial Time dial • Press the rotary knob to change between the time and speed dials • Press the Clear time control panel button or the X key to stop the animation Selecting time Turn the rotary knob to select the time for which you want to display the weather data. The time increments may vary depending on the GRIB file. The time shift is shown in the time dial and in brackets in the GRIB information window. The time will be relative to the current time as provided by a GPS device connected to the NSS. As a GRIB file ages it will be possible to see the historic data represented in minus hours until the data becomes outdated. Once the data is outdated it reverts to the time frame being relative to the earliest forecast in the file. ¼¼ Note: If no current time is provided via GPS the GRIB file time is only relative to the earliest forecast in the file. It will then not show a real time weather representation. Animation speed Use the rotary knob to adjust animation speed. 12 | NSS | Addendum for RTM-2, RTM-2.5 and RTM-3 EN GoFree™ Wireless With a WIFI-1 unit connected to an NSS with RTM-2.5 software, you can use a wireless device to remotely control the NSS. The NSS is controlled from the wireless device by Apps downloaded from their relevant Application store. ¼¼ Note: In this document we have used the term wireless devices, and graphics from iPad and App Store are used as examples. The wireless functionality is however, provided for other vendors’ tablets or smartphones, and those can be used for controlling the NSS when relevant Apps are available. ¼¼ Note: For security reasons Autopilot and CZone control are currently not supported for control from a wireless device. Installation and wiring for the WIFI-1 unit are described in the separate WIFI-1 Installation Guide. Setting the NSS name The name of the NSS can be set by the user. The entered name will be broadcasted on NMEA 2000 and IP based networks. Choose a unique name for each NSS to allow you to identify each unit on the Simrad GoFree Controller & Viewer App. Setting up the WIFI-1 1. Connect the WIFI-1 unit to the NSS with the Ethernet cable supplied with the WIFI-1 unit -- The WIFI-1 access point will now be listed in the NSS menu -- The Network name and Network key are the same as found on the sticker on the WIFI1 unit 2. Change the Network name and Network key if required NSS | Addendum for RTM-2, RTM-2.5 and RTM-3 | 13 EN Setting up multiple WIFI-1 units On large or metal hulled vessels it may be necessary to connect multiple WIFI-1 access points to extend the range. Up to 2 WIFI-1 units can be connected to one NSS, but only the WIFI-1 unit defined as primary access point can be used for connecting the wireless device to the NSS. 1. Open the access points dialog as shown above 2. Activate the line for the connected WIFI-1 unit, and re-define this to be a secondary access point 3. Connect and define the additional WIFI-1 unit as described in “Setting up the WIFI-1” on page 13. -- The latest connected WIFI-1 unit will now be the primary access point, and only this can be used for connecting the wireless device to the NSS. Selecting communication channel The WIFI-1 unit will automatically select the channel used for communication with the wireless devices. You might need to change the channel if other transmitting devices cause conflicts (multiple networks, wireless phones etc), or if you are using the equipment in areas with restricted channel selection. The channels can be manually changed from the drop down list. ¼¼ Note: Only technically skilled persons should set up multiple WIFI-1 units or change the communication channel! Connecting the wireless device to the WIFI-1 Set up the wireless device’s network to be the WIFI-1 defined as primary access point. -- The Network name is found in the NSS menu. Refer to “Setting up the WIFI-1” on page 13. 14 | NSS | Addendum for RTM-2, RTM-2.5 and RTM-3 EN Enable/disable wireless control of NSS 1. Download the Simrad GoFree Controller & Viewer App from the application store to the wireless device. 2. Start the App, and tap the NSS icon in the GoFree Controller page to request remote control of the NSS. The first time you request control from the wireless device, the NSS will prompt you to confirm remote control from this device. You have the following options: Yes Allows control from the wireless device as long as the device is connected to the WIFI-1 network. You will have to request remote control again if the wireless device later reconnects to the WIFI-1 network. No Allows no control from the wireless device. The NSS display can be viewed on the wireless device, but no operation is allowed. Always Allows control of the NSS from this wireless device until you choose to disable the control. See description later in this section. When control is confirmed, the connection is immediately established. All wireless devices that are allowed to control the NSS are listed in the Wifi device list. NSS | Addendum for RTM-2, RTM-2.5 and RTM-3 | 15 EN Disabling wireless control You disable wireless control from a remote device as follows: 1. In the device list, select the wireless device you want to disable 2. Uncheck the always allow option 3. Press and hold on the selected line in the list or press the MENU key to show the menu 4. Select Disconnect 5. On the wireless device, select the view only option You can now view the NSS display on the wireless devise, but no operation is allowed. Wireless control of the NSS is re-established by re-starting the App and confirming remote control. Operating the NSS with the wireless device When remote control is accepted, the NSS page will be mirrored to the wireless device. The NSS image includes softkeys. Tapping these keys works as operating the similar hard keys on the NSS front panel. Lets you select which NSS to control if more than one is connected to the active WIFI-1 unit Returns to the GoFree Controller page. 16 | NSS | Addendum for RTM-2, RTM-2.5 and RTM-3 EN Using the WIFI-1 for data bridging The WIFI-1 can be used for bridging data from the NSS to other applications running on a wireless remote device. The graphics below is an example only, showing setup for the iNavX application run on an iPhone. IP address and port information is found in the NSS as shown below. NSS | Addendum for RTM-2, RTM-2.5 and RTM-3 | 17 EN FLIR camera control If a FLIR camera is available on the Ethernet network, you can display the video and control the camera from the NSS. A video panel can be set up as a single panel, or as one of the panels on a multiple panel page. Refer to the NSS Operator manual for more information about how to set up the panels. Establishing connection with the FLIR video camera When a video panel is active, the NSS will automatically recognize a Flir camera if this is available on the network. ¼¼ Note: When there is DHCP server present on the Ethernet network, FLIR camera will need to be configured and set to have Static IP Address before the connection can be established. For instructions on how to configure your specific FLIR camera model please refer to FLIR documentation. ¼¼ Note: Only one FLIR camera can be connected to the Ethernet network at a time. When you activate a video panel, the system will start searching the network for a FLIR camera. If the connection later is lost, this will be indicated by a panel key. Tap this key to re-establish the connection. When the connection is established the menu will change to include access to FLIR camera control. ¼¼ Note: You can take over camera control from any NSS unit connected to the Ethernet network. 18 | NSS | Addendum for RTM-2, RTM-2.5 and RTM-3 EN Panning and tilting the camera When the connection to the FLIR camera is established, pan and tilt panel buttons appear on the video panel. The left and right arrows control the camera’s pan, while the up and down arrows tilt the camera. Press one of the arrow buttons on the panel to control the camera. The camera will move as long as you press the button. Zooming the video image IN MOB OUT MOB You zoom the video image by using the IN/OUT keys. There are two different zoom options available, depending on selected FLIR camera source option. Refer The FLIR camera source options below. Digital zoom Only available when the camera is in Infrared mode. In this mode the zoom is represented in levels (0, 2 and 4 times zoom). Each press on one of the IN/OUT keys will increment or decrement the zoom level. Optical zoom Available in daylight mode. In this mode the camera will zoom as long as you press the IN/OUT keys. The FLIR camera source options The FLIR camera includes both daylight and infrared video sources. When the infrared source is selected, the following options are available: Toggle color scheme Cycles through FLIR’s video output color scheme. Each of these schemes maps a different color to a different temperature Toggle polarity Inverts the color scheme. For example, instead of: White = Hot and Black = Cold, it will become Black = Hot and White = Cold The camera’s home position You can set the current pan and tilt position as the camera’s home position. You can later quickly return to this camera position. Fusion Link Support FUSION-Link devices connected to the NMEA 2000 network can be controlled from the NSS. The integration is currently limited and not supporting the following features: • Multiple FUSION-Link device connectivity • VHF channel and Sirius weather controls via FUNSION-Link devices • DVD controls through the NSS ¼¼ Note: You must enable audio to control audio on your NSS. Refer to the Audio section in the NSS Operator for information about audio control from the NSS. A Fusion Link device connected to the NMEA 2000 network should automatically be identified by the NSS. If not, enable the feature from the advanced option in the system settings menu. NSS | Addendum for RTM-2, RTM-2.5 and RTM-3 | 19 EN Mercury VesselView 7 Integration Mercury VesselView 7 SmartCraft data display and interaction are enabled through the NSS when a VesselView 7 gateway device is present on the NMEA 2000 network. A Mercury icon will automatically appear on the Pages panel when the device is available. • • • • • You access Mercury VesselView 7 settings from the menu bar in the bottom of the VesselView 7 screen. For more details on VesselView 7 engine monitoring and control refer to Mercury VesselView 7 documentation. The following VesselView interactions are not fully supported from the NSS : Smart Tow is not available Descriptive fault text is not shown Maintenance information at startup will not be shown No Zeus Axius AutoPilot control No J1939 support A Mercury VesselView 7 device connected to the NMEA 2000 network should automatically be identified by the NSS. If not, enable the feature from the advanced option in the system settings menu. NMEA 0183 Data logging All serial output sentences sent over the NMEA 0183 TCP connection are logged to an internal file. You can export and review this file for service and fault finding purposes. The maximum file size is predefined. If you have added several other files to the system (sonar and/or StructureMap recordings, music, pictures, pdf files), this may reduce the allowed file size for the log file. The system logs as much data as possible within the file size limitation, then it starts overwriting the oldest data. Exporting the log file The log file can be exported from the Files dialog. When you select the Log database you are prompted to select a destination folder and filename. Once accepted the log file is written to the chosen location. 20 | NSS | Addendum for RTM-2, RTM-2.5 and RTM-3 EN Damping This feature is used for achieving a more stable reading on the display if there are fluctuations in the data received from the sensors. The effect is accomplished by averaging the received data. A high value will cause delayed update of the data on the display. ¼¼ Note: This is an internal damping on the display only. It will not change the data on the network or on the NMEA 0183 output. It should be used when the sensor has no internal damping function. ¼¼ Note: If damping for Heading is high when using the autopilot, the captured heading might differ from the heading read on the display (heading capture function). Configuring the GS25 GPS Antenna The GS25 includes built-in sensors for both heading and position. When a GS25 is connected to the system, this device will appear in the device list as both GS25 Antenna and as GS25 Compass. Both the antenna and the compass devices should be configured from the NSS. GPS Antenna configuration 1. Tap the GS25 Antenna line in the device list to display the GS25 Antenna device information dialog 2. Select the Configure button in the device information dialog to get access to the following settings Enable WAAS/MSAS/EGNOS Activates the satellite based augmentation system (SBAS), which can further increase accuracy of a GPS fix to within approximately 1 m. Coverage is not worldwide, as currently WAAS covers North America, MSAS covers East Asia (primarily JAPAN), and EGNOS covers Europe. If you are outside these regions, this function may be turned off in case the SBAS signal is still received but actually worsens fix data. NSS | Addendum for RTM-2, RTM-2.5 and RTM-3 | 21 EN Position update rate Adjusted to suit the type of vessel the GPS receiver is fitted to, and to minimise unnecessary NMEA 2000 data traffic. For high speed vessels and performance sail boats, the maximum update rate will be desired for measuring performance to the highest possible accuracy. On slower vessels and large networks with a lot of network traffic, high update rates may be of little value. High update rate may be preferable to reduce the network load, as well as reduce the visual distraction of constantly changing values. COG/SOG Filter This filtering smoothens the output data with averaging. The best setting will depend of type of vessel and user preference. Instance If more than one device of the same type exists in the network, the instance number may be changed to a unique number to allow easier identification. GNSS 1. Return to the GS25 Antenna device information dialog 2. Select the GNSS panel button to access the GNSS setting The GPS and GLONASS options may be enabled simultaneously, or one at a time. Generally GPS offers the highest accuracy, but in certain circumstances a better fix may be achieved with both or GLONASS only enabled. A basic indication of performance can be seen on the Satellites page. Once a fix is acquired, EPE and HDOP should be noted and compared - lowest values for each indicate the best position fix. Compass calibration Prior to configuring, the GS25 compass must be calibrated. This is done as described in the GPS Antenna installation guide, or as described below. Before the calibration is started, ensure that the compass is mounted securely in its’ permanent location. The calibration should be done in calm sea conditions and with minimal wind to obtain good results. Follow the on-screen instruction, and use about 60-90 seconds to make a full circle. 1. Start the calibration by selecting the Calibrate button in the device information dialog 2. Follow the online instructions During the calibration, the compass will measure the magnitude and direction of the local magnetic field. • If the local magnetic field is stronger than the earth’s magnetic field (the local field is reading more than 100%), the compass calibration will fail • If the local field is reading more than 30%, you should look for any interfering magnetic objects and remove them, or you should move the compass to a different location. The (local) field angle will guide you to the local interfering magnetic object. Compass configuration 1. Tap the GS25 Compass line in the device list to display the GS25 Compass device information dialog. Compass offset The difference between the compass lubber line and the boat’s center line should be compensated for. 2. Find the bearing from the boat position to a visible object. Use a chart or a chart plotter 3. Steer the boat so that the center line of the boat is aligned with the bearing line pointing towards the object 4. Change the offset parameter so that the bearing to the object and the compass readout becomes equal ¼¼ Note: Make sure that both the compass heading and the bearing to the object have the same unit (Magnetic or True). 22 | NSS | Addendum for RTM-2, RTM-2.5 and RTM-3 EN BEP CZone Enhancement Quick access to CZone panel from Pages When the CZone system is connected and configured, the CZone icon will be available on the Pages overview panel (Home). This icon gives access to CZone panel, providing icons for CZone modes. Intuitive CZone modes status icon The CZone modes provide a one press functionality that allows multiple circuits to be controlled efficiently. The modes are typically configured during installation. Up to 6 commonly used modes can be displayed on the CZone panel. If more than 6 modes are configured, the rest are accessible under More Modes... option. Mode is active Mode is inactive CZone AC Main Control Interface (AMCI) and AC Output Interface (ACOI) support AMCI allows you to select which mains power device will supply power to the vessel. ACOI provides on/off control and power distribution protection for AC devices on the vessel. AC controls are configurable under Control and Monitor panel. NSS | Addendum for RTM-2, RTM-2.5 and RTM-3 | 23