1
Data Sheet
all channels and an optional record length of up to 250M points on two
channels.
With Wave Inspector® controls for rapid waveform navigation, and more
than 10 optional software and analysis packages for common technologies
and in-depth analysis tasks, the MSO/DPO5000 Series from Tektronix
provides the feature-rich tools you need to simplify and speed debug of
your complex design.
Comprehensive Features Speed Every Stage
of Debug
The MSO/DPO5000 Series offers a robust set of features to speed every
stage of debugging your design – from quickly discovering an anomaly and
capturing it, to searching your waveform record for the event and analyzing
its characteristics and your device's behavior.
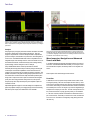
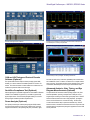
Discover – Fast waveform capture rate - over 250,000 wfm/s - maximizes the probability
of capturing elusive glitches and other infrequent events.
Feature-rich Tools for Debugging Mixed
Signal Designs
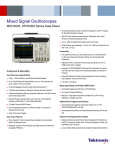
With the MSO/DPO5000 Mixed Signal Oscilloscope Series, you can
analyze up to 20 analog and digital signals with a single instrument to
quickly find and diagnose problems in complex designs. Bandwidths up to
2 GHz and sample rates up to 10 GS/s ensure you have the performance
you need to see fast-changing signal details. To capture long windows of
signal activity while maintaining fine timing resolution, the MSO/DPO5000
Series offers a deep record length of up to 12.5M points standard on
2
www.tektronix.com
Discover
To debug a design problem, first you must know it exists. Every
design engineer spends time looking for problems in their design, a
time-consuming and frustrating task without the right debug tools.
The MSO/DPO5000 Series offers the industry's most complete visualization
of signals, providing fast insight into the real operation of your device.
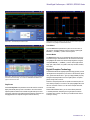
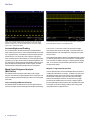
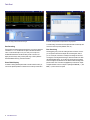
Tektronix proprietary FastAcq™ technology delivers a fast waveform
capture – greater than 250,000 waveforms per second – that enables you to
see glitches and other infrequent transients within seconds, revealing the
true nature of device faults. A digital phosphor display with color intensity
grading shows the history of a signal's activity by using color to identify
areas of the signal that occur more frequently, providing a visual display
of just how often anomalies occur.