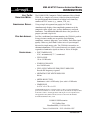
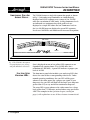
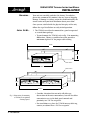
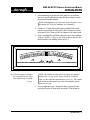
1
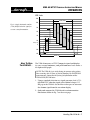
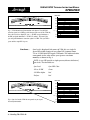
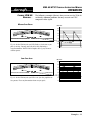
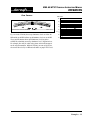
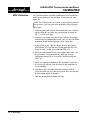
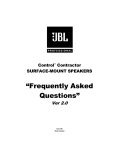
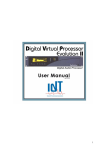
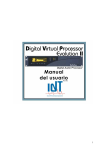
IR E U N IT S
-40
-32 0
20
-48
40
60
80
100
120
LUMINANCE
SYNC
SYNC
COMPOSITE VIDEO LUMINANCE METER
SETUP
© 1990
MODEL VLM-40
COMPOSITE VIDEO LUMINANCE METER
MODEL VLM-40 NTSC
TECHNICAL INSTRUCTION MANUAL
VLM-40 NTSC TECHNICAL INSTRUCTION MANUAL
INTRODUCTION
EASY-TO-USE
VIDEO LEVEL METER...
SIMULTANEOUS DISPLAY...
PEAK AND AVERAGE...
SPECIFICATIONS...
The DORROUGH Composite Video Luminance Meter, Model
VLM-40, is a simple, easy-to-use, video level meter designed
for quick dynamic measurements of video levels from any
connected NTSC source (e.g., camera, VTR, etc.).
Using a single 40-segment bar graph, the VLM-40
simultaneously displays three amplitude parameters of the
composite video signal: sync, average luminance, and peak
luminance. Two additional indicators detect the presence of
proper sync and setup levels.
Just like a traditional waveform monitor, the VLM-40’s peak-toaverage features enable you to quickly check lighting
conditions, contrast, drop-outs, sync stability, and video signal
quality. However, you’ll find it easier to use as you interpret
data on the single meter scale. The VLM-40 is insensitive to
chroma information, VITS (vertical interval test signals), and it
responds to luminance signals as short as 200 ns in length.
• INPUT IMPEDANCE
25 kΩ unterminated, 75 Ω terminated
• SYNC RANGE
-50 to -32 IRE units
• LUMINANCE RANGE
0 to 120 IRE units
• SYNC AND LUMINANCE FREQUENCY RESPONSE
Exceeds IRE frequency response
• MINIMUM PULSE WIDTH RESPONSE
200 ns
• METER RESOLUTION
Luminance scale is 4 IRE units; Sync scale is 2 IRE units
• DIMENSIONS
8 1 ⁄ 4"W x 2 7⁄ 8"H x 6 1 ⁄ 2" D
DORROUGH Electronics constantly strives to meet or exceed the highest
professional standards. As a result of these efforts, modifications may be made
from time to time to existing products without prior notice. Specifications
and appearance may differ from those listed or shown in this manual.
© DORROUGH Electronics, 1994
DORROUGH Electronics
5221 Collier Place
Woodland Hills, CA 91364 USA
Voice: 818•998•2824 – FAX: 818•998•1507
Introduction – 1
VLM-40 NTSC TECHNICAL INSTRUCTION MANUAL
DESCRIPTION
SIMULTANEOUS PEAK AND
AVERAGE DISPLAY...
The VLM-40 features a single 40-segment bar graph, as shown
in Fig. 1. Peak and average luminance are simultaneously
displayed on 30 LED segments over a range of 0 to 120 IRE
units (for a resolution of 4 IRE units). Average luminance levels
are indicated as a continuous bar, while peak levels are
displayed as a single LED above the bar. Luminance levels in
the 0 to 100 IRE range are displayed as green LED segments.
Levels over 100 IRE use red indicators for increased recognition.
IR E U NIT S
-40
-32 0
20
40
60
80
100
-48
120
LUMINANCE
SYNC
SYNC
SETUP
COMPOSITE VIDEO LUMINANCE METER
Fig. 1. The VLM-40’s 40-segment
bar graph displays sync, average,
and peak luminance video levels.
SYNC AND SETUP
VIOLATION LEDS...
© 1990
MODEL VLM-40
Sync is displayed on one of ten yellow LED segments on an
expanded scale ranging from -52 to -30 IRE units (for a
resolution of 2 IRE units). A green LED indicates a proper sync
level of -40 IRE.
The front meter panel also includes sync and setup LEDs that
detect the status of these corresponding video levels. Under
normal operating conditions, the sync LED will be green
whenever the video source has a proper sync signal. If sync
drops out, the sync LED will flash red for single sync drop-outs
greater than 2 H, or stay on full for continuous drop-outs.
The setup LED is green whenever the video source has a Setup
level greater than 7.5 IRE units, and red when setup goes below
4 IRE. The examples in the Operation chapter (starting on
page 6) will explain how to use all these features in more detail.
2 – Description
VLM-40 NTSC TECHNICAL INSTRUCTION MANUAL
DESCRIPTION
REAR PANEL CONNECTIONS..
As shown in Fig. 2, the VLM-40’s rear panel is equipped with
BNC connectors for video and loop, and a switch for 75-ohm
termination or loop connection. An ac power cord provides
power to the unit from a standard 115 V ac receptacle.
DORROUGH ELECTRONICS
WOODLAND HILLS, CA 91364
Loop Through
Fig. 2. The VLM-40’s rear panel
provides video connections and a
termination switch for 75 ohms or
loop connection (Hi-Z).
ABOUT THIS MANUAL...
Term. Gain
Hi-Z
AC Cord
The VLM-40 weighs less than two pounds, can be easily read
from a distance of 20 feet, and may be installed in an optional
panel mount (e.g., DORROUGH Rack Mount Kit, 40-S for a
single meter or 40-D for dual meters) or operated as a standalone package.
The remainder of this Technical Instruction Manual is divided
into the following sections: Installation, Operation, Calibration,
and Circuit Schematics. Before you install the unit, take a
moment to read through the Operation chapter to fully
understand the capabilities of the VLM-40. After you have
determined how best to use the unit for your purposes, follow
the instructions listed in the Installation chapter.
Description – 3
VLM-40 NTSC TECHNICAL INSTRUCTION MANUAL
INSTALLATION
UNPACKING...
Your unit was carefully packed at the factory. Nevertheless,
please take a moment to examine it for any signs of shipping
damage. If damage is evident, retain the carton and notify the
transit carrier and your local distributor about your claim.
Once you are satisfied with the physical integrity of the unit,
follow the steps listed below to verify initial operation.
INITIAL SET-UP...
1. The VLM-40 can either be mounted in a panel or operated
as a stand-alone package.
• To panel-mount the VLM-40, refer to Fig. 3 for mounting
dimensions. Choose a ventilated area that provides a
minimum depth of 10" for proper cable routing.
19.00 "
3.50 "
IR E U N IT S
40
20
-32 0
-40
60
80
100
-48
120
LUMINANCE
SYNC
SYNC
SETUP
© 1990
COMPOSITE VIDEO LUMINANCE METER
MODEL VLM-40
PANEL #40A-S
8.125 "
PANEL #40A-D
IR E U NIT S
-40
-32 0
20
40
-48
3.00 "
IR E U NIT S
60
80
100
-40
120
LUMINANCE
-32 0
20
-48
SYNC
40
60
80
100
120
LUMINANCE
SYNC
SYNC
COMPOSITE VIDEO LUMINANCE METER
SETUP
© 1990
SYNC
MODEL VLM-40
COMPOSITE VIDEO LUMINANCE METER
SETUP
© 1990
MODEL VLM-40
6.50 "
16.250 "
Fig. 3. Dimensions for mounting
a VLM-40 in an optional
Dorrough panel.
• Consider a location that not only will offer easy
observation of the meter movements, but will also allow
convenient access to the back panel controls and
proximity to a 120 Vac receptacle.
• For stand-alone use, place the VLM-40 on any table top,
counter, or cabinet near a 120 Vac receptacle.
4 – Installation
VLM-40 NTSC TECHNICAL INSTRUCTION MANUAL
INSTALLATION
2. After mounting or placing the unit, plug the ac cord into
the ac receptacle and observe that the meter display on the
front panel becomes backlit.
NOTE: If backlighting is off, check your ac line for power, or test
the internal 0.5 A fuse for continuity (see Schematics).
3. Connect a 75-ohm video cable from a standard television
signal test generator to either video (BNC) connector on the
back panel. Select Term. or Hi-Z to terminate the connection.
4. Feed a standard EIA split-field color bar signal with standard
setup at 140 IRE (1 V p-p) to the VLM-40 and verify that the
meter matches the reading shown in Fig. 4.
IR E U NIT S
-40
-32 0
20
40
60
80
100
-48
120
LUMINANCE
SYNC
SYNC
SETUP
COMPOSITE VIDEO LUMINANCE METER
Fig. 4.VLM-40 display for standard
EIA (split-field) color bar signal
with standard setup at 140 IRE
(1 V p-p).
© 1990
MODEL VLM-40
NOTE: The VLM-40 is calibrated at the factory for standard
video level of 1 V p-p. If your “house standard” is different
value, use the video Gain potentiometer (see Fig. 2). This control
will provide an adjustment range that accommodates signals
down to 0.5 V p-p.
5. After completing steps 1 through 4 above, proceed to the
Operation chapter to learn how to read the VLM-40 meter.
Installation – 5
VLM-40 NTSC TECHNICAL INSTRUCTION MANUAL
OPERATION
In this section, you will learn how to interpret the readings on
your VLM-40. As a study aid, a corresponding waveform
monitor drawing accompanies each example illustration.
COMPONENTS OF THE
NTSC COMPOSITE
VIDEO SIGNAL...
The NTSC Composite Video Signal is a complex analog signal
that contains luminance, color, and synchronizing signals.
When we watch a picture on a television set, we are actually
watching a variable-intensity electron beam tracing out a series
of pictures on the light sensitive portion of a picture tube, as
shown in Fig. 5.
Fig. 5. The NTSC Composite Video
signal contains two interlaced
fields of 262.5 lines, for a total of
525 horizontal scan lines.
The synchronization signals embedded in the television signal
precisely instruct the electron beam to move across and down
the picture tube to build a complete picture (using two fields)
in 1 ⁄ 30 of a second. As the process repeats, our eyes do not see
individual pictures or frames, but instead they blend the frames
together so we perceive a moving picture.
Examining a horizontal scan line in detail (as shown in Fig. 6
on the next page), we can see several important components of
the ideal NTSC Composite Video Signal. A single horizontal
scan line (1 H) has a duration of 63.5 µs. Horizontal sync is 4.7
µs long and extends from -40 to 0 IRE. Setup level for reference
black is at 7.5 IRE, which provides a margin of safety for sync
level. Peak white is at 100 IRE. Color burst is 2.5 µs long to
provide color synchronization, and extends from -20 to +20 IRE
on the front porch of the horizontal scan line.
6 – NTSC Composite Video Signal
VLM-40 NTSC TECHNICAL INSTRUCTION MANUAL
OPERATION
IRE Units
120
color bars
100
Fig.6. A single horizontal scan line
(75% full-field color bar signal) as
seen on a waveform monitor.
80
luminance
60
40
2.5 µs
20
setup =7.5
color
burst
0
-20
-40
sync
63.5 µs
HOW TO READ
THE VLM-40...
The VLM-40 measures a NTSC Composite signal and displays
its sync, average luminance, and peak luminance levels across a
40-segment bar graph.
NOTE: The VLM-40 is set at the factory to measure active picture
lines occurring after 21 lines of vertical blanking. For PAL/SECAM
measurements, contact the the factory for information on the
VLM-40 PAL/SECAM meter.
1. Using a standard television test signal generator, feed a 75%
full-field NTSC color bar signal with standard setup at 115
IRE p-p to the VLM-40. Set the filter to low-pass to attenuate
the chroma signal from the waveform display.
2. Study and compare the VLM-40 and waveform monitor
illustrations shown in Fig. 7 on the next page.
Reading The VLM-40 – 7
VLM-40 NTSC TECHNICAL INSTRUCTION MANUAL
OPERATION
IRE Units
IR E U N IT S
-40
20
-32 0
40
60
80
100
100
-48
120
LUMINANCE
80
SYNC
SYNC
60
SETUP
© 1990
COMPOSITE VIDEO LUMINANCE METER
MODEL VLM-40
40
20
Fig. 7. VLM-40 and waveform monitor each show a 75% full-field
color bar signal at 115 IRE p-p with low-pass filter on. On the VLM-40,
three video levels are displayed: sync = - 40 IRE, average luminance =
40 IRE, and peak luminance = 76 IRE (75 actual). The total of the
sync and peak luminance excursions equals 115 IRE. The sync LED is
green and the setup LED is green.
SYNC LEVELS...
setup = 7.5
0
-20
-40
Sync level is displayed (left corner of VLM-40) as a single lit
green LED within a range of ten yellow LED segments from
-52 to -32 IRE. Each LED equals 2 IRE units. The indicated value
corresponds to the value of the sync tip on a waveform
monitor, as shown in Fig. 8.
NOTE: A sync LED provides a simple presence/absence indicator of
sync levels. The thresholds are:
Sync Level
Sync LED Color
-52 to -32 IRE
Green
-32 IRE or higher
Red
No Sync
Red
IRE Units
IR E U N IT S
-40
-32 0
20
-48
40
60
80
100
100
120
LUMINANCE
80
SYNC
SYNC
COMPOSITE VIDEO LUMINANCE METER
60
SETUP
© 1990
MODEL VLM-40
40
20
setup = 7.5
0
Fig. 8. Sync level on the VLM-40 corresponds to sync tip on
the waveform monitor.
8 – Reading The VLM-40
-20
-40
VLM-40 NTSC TECHNICAL INSTRUCTION MANUAL
OPERATION
AVERAGE LUMINANCE...
Average luminance is displayed as a continuously-lit green bar on
the VLM-40. Each LED equals 4 IRE units. Average luminance is
equal to the largest valued LED on the right end of the bar, as
shown in Fig. 9. The indicated value corresponds to the average
(calculated) luminance level on a waveform monitor.
IRE Units
IR E U N IT S
-32 0
-40
20
40
60
80
100
100
-48
120
LUMINANCE
80
SYNC
SYNC
60
SETUP
© 1990
COMPOSITE VIDEO LUMINANCE METER
MODEL VLM-40
40
20
average
luminance =
area under curve
setup = 7.5
0
Fig. 9. The average luminance level on the VLM-40 corresponds to the
average (calculated) luminance level on a waveform monitor.
PEAK LUMINANCE...
-20
-40
Peak luminance below 100 IRE is displayed as a single lit green
LED to the right of the continuously-lit bar on the VLM-40.
Values above 100 IRE are red. The indicated value corresponds
to the value of peak luminance on a waveform monitor, as
shown in Fig. 10.
NOTE: The VLM-40 is very sensitive to measuring noise in the
luminance signal and will respond to short impulses that may be
undetected on a standard waveform monitor.
IRE Units
IR E U N IT S
-40
-32 0
20
-48
40
60
80
100
100
120
LUMINANCE
80
SYNC
SYNC
COMPOSITE VIDEO LUMINANCE METER
60
SETUP
© 1990
MODEL VLM-40
40
20
setup = 7.5
0
Fig. 10. The peak luminance level on the VLM-40 corresponds to the
peak luminance level on a waveform monitor.
-20
-40
Reading The VLM-40 – 9
VLM-40 NTSC TECHNICAL INSTRUCTION MANUAL
OPERATION
SETUP LEVEL...
The setup LED is a two-way indicator of setup levels, as shown
in Fig.12. The thresholds are:
Setup Level
Setup LED
Above 7.5 IRE
Green
7.5 to 4.0 IRE
Green
Below 4.0 IRE
Red
IRE Units
IR E U N IT S
-40
-32 0
20
-48
40
60
80
100
100
120
LUMINANCE
80
SYNC
SYNC
COMPOSITE VIDEO LUMINANCE METER
60
SETUP
© 1990
MODEL VLM-40
40
20
setup = 7.5
0
Fig. 11. The SETUP LED on the VLM-40 corresponds to the setup
level on a waveform monitor.
10 – How To Read The VLM-40/Examples
-20
-40
VLM-40 NTSC TECHNICAL INSTRUCTION MANUAL
OPERATION
The following examples illustrate how you can use the VLM-40
to identify common problems that may occur in an NTSC
composite video signal.
EXAMPLE VLM-40
READINGS...
MISSING SYNC PULSES
IRE Units
100
IR E U N IT S
-40
-32 0
20
40
60
80
80
100
-48
120
LUMINANCE
60
SYNC
40
SYNC
SETUP
© 1990
COMPOSITE VIDEO LUMINANCE METER
MODEL VLM-40
20
setup = 7.5
0
Fig. 12. On the VLM-40, the sync LED flashes red each time a sync
pulse is missing. You may not easily detect this fault using a
waveform monitor. NOTE: With a complete loss of sync, the meter
will not operate.
LOW SYNC LEVEL
-20
-40
IRE Units
100
IR E U N IT S
-40
-32 0
20
-48
40
60
80
80
100
120
LUMINANCE
60
SYNC
40
SYNC
COMPOSITE VIDEO LUMINANCE METER
SETUP
© 1990
MODEL VLM-40
20
setup = 7.5
0
Fig. 13. On the VLM-40, the sync LED is red. Sync bar graph has no
lit segments. The waveform monitor shows no sync pulse.
-20
-40
Examples – 11
VLM-40 NTSC TECHNICAL INSTRUCTION MANUAL
OPERATION
SETUP LEVEL VIOLATION
IRE Units
100
IR E U N IT S
-40
-32 0
20
40
60
80
80
100
-48
120
LUMINANCE
60
SYNC
40
SYNC
SETUP
© 1990
COMPOSITE VIDEO LUMINANCE METER
MODEL VLM-40
20
setup = 7.5
0
Fig. 14. On the VLM-40, the setup LED is red. On the waveform
monitor, the setup level is less than 4 IRE.
EXCESSIVE PEAK LUMINANCE
-20
-40
IRE Units
100
IR E U N IT S
-40
-32 0
20
-48
40
60
80
80
100
120
LUMINANCE
60
SYNC
40
SYNC
COMPOSITE VIDEO LUMINANCE METER
SETUP
© 1990
MODEL VLM-40
20
setup = 7.5
0
Fig. 15. On the VLM-40, average luminance levels are at acceptable
levels, but the red peak LED indicates peak luminance levels are above
100 IRE. This condition frequently occurs in a scene when light is
reflected (e.g., jewelry) or there is external noise. Depending on the
duration of the peak signal, you may not easily see these waveform
excursions on a waveform monitor.
12 – Examples
-20
-40
VLM-40 NTSC TECHNICAL INSTRUCTION MANUAL
OPERATION
POOR CONTRAST
IRE Units
100
IR E U N IT S
-40
-32 0
20
-48
40
60
80
80
100
120
LUMINANCE
60
SYNC
40
SYNC
COMPOSITE VIDEO LUMINANCE METER
SETUP
© 1990
MODEL VLM-40
20
setup = 7.5
0
Fig. 16. On the VLM-40, the average luminance levels are below 40
IRE and the peak LED indicates peak luminance levels are at 60 IRE.
The waveform monitor shows peak luminance levels just above
60 IRE, but calculating an average luminance level is difficult at best.
For example, there may be white in the picture which will not appear
on the waveform monitor. With the VLM-40, you can safely increase
the overall video level by 10 IRE and still adhere to proper NTSC levels.
-20
-40
Examples – 13
VLM-40 NTSC TECHNICAL INSTRUCTION MANUAL
CALIBRATION
NTSC CALIBRATION...
The VLM-40 has been carefully calibrated for NTSC operation
at the factory. However, the procedure is listed here for your
future use.
NOTE: The VLM-40 is only as accurate as the waveform generator
you are using. Check sync and raster amplitudes before beginning
calibration.
1. With the power off, remove the bottom four screws and lift
off the enclosure to expose the circuit board, as shown in
Fig. 17 (on the next page).
2. Connect a waveform generator to the VLM-40 video input
and turn on the termination switch, SW1. Set the waveform
generator to split-field bar pattern (100% white flag).
3. Apply power to the VLM-40. Adjust the rear panel input
level control VR 13 so that the 100 IRE peak dot LED is lit.
Verify that the -40 IRE sync amplitude LED is lit.
4. Select the full-field white raster waveform (100% white) on
the generator. On the main board, adjust the average
calibration control VR 36 so that the 100 IRE average bar
LED is lit.
5. Select the stairstep waveform on the generator. Verify that
the set-up LED on the VLM-40 is now lit red, indicating a
set-up violation.
6. Disconnect the waveform generator from the VLM-40.
Verify that both the sync and set-up error LEDs are red, and
that the main display is blanked.
7. Turn off power and reassemble the unit.
14 – Calibration
VLM-40 NTSC TECHNICAL INSTRUCTION MANUAL
CALIBRATION
U7
VR36
TRANSFORMER
U3
J2
J1
SW1
VR13
Fig. 17. This simplified circuit
board diagram shows key
components used to calibrate the
VLM-40 for NTSC operation.
Calibration – 15