1
Dell PowerEdge FTOS
Command Line Reference
Guide for the
M I/O Aggregator
Publication Date: October 2012
Notes, Cautions, and Warnings
NOTE: A NOTE indicates important information that helps you make better use of your computer.
CAUTION: A CAUTION indicates either potential damage to hardware or loss of data and tells you how to
avoid the problem.
WARNING: A WARNING indicates a potential for property damage, personal injury, or death.
Information in this publication is subject to change without notice.
© 2012 Dell Force10. All rights reserved.
Reproduction of these materials in any manner whatsoever without the written permission of Dell Inc. is
strictly forbidden.
Trademarks used in this text: Dell(TM), the Dell logo, Dell Boomi(TM), Dell Precision(TM) ,
OptiPlex(TM), Latitude(TM), PowerEdge(TM), PowerVault(TM), PowerConnect(TM), OpenManage(TM),
EqualLogic(TM), Compellent(TM), KACE(TM), FlexAddress(TM), Force10(TM) and Vostro(TM) are
trademarks of Dell Inc. Intel(R), Pentium(R), Xeon(R), Core(R) and Celeron(R) are registered trademarks of
Intel Corporation in the U.S. and other countries. AMD(R) is a registered trademark and AMD
Opteron(TM), AMD Phenom(TM) and AMD Sempron(TM) are trademarks of Advanced Micro Devices,
Inc. Microsoft(R), Windows(R), Windows Server(R), Internet Explorer(R), MS-DOS(R), Windows
Vista(R) and Active Directory(R) are either trademarks or registered trademarks of Microsoft Corporation in
the United States and/or other countries. Red Hat(R) and Red Hat(R)Enterprise Linux(R) are registered
trademarks of Red Hat, Inc. in the United States and/or other countries. Novell(R) and SUSE(R) are
registered trademarks of Novell Inc. in the United States and other countries. Oracle(R) is a registered
trademark of Oracle Corporation and/or its affiliates. Citrix(R), Xen(R), XenServer(R) and XenMotion(R)
are either registered trademarks or trademarks of Citrix Systems, Inc. in the United States and/or other
countries. VMware(R), Virtual SMP(R), vMotion(R), vCenter(R) and vSphere(R) are registered trademarks
or trademarks of VMware, Inc. in the United States or other countries. IBM(R) is a registered trademark of
International Business Machines Corporation. .
Other trademarks and trade names may be used in this publication to refer to either the entities claiming the
marks and names or their products. Dell Inc. disclaims any proprietary interest in trademarks and trade
names other than its own.
October 2012
1 About this Guide . . . . . . . . . . . . . . . . . . . . . . . . . . . . . . . . . . . . . . . . . . . . . . . . . . . 5
Objectives . . . . . . . . . . . . . . . . . . . . . . . . . . . . . . . . . . . . . . . . . . . . . . . . . . . . . . . . . . . . . 5
Audience . . . . . . . . . . . . . . . . . . . . . . . . . . . . . . . . . . . . . . . . . . . . . . . . . . . . . . . . . . . . . . 5
Conventions . . . . . . . . . . . . . . . . . . . . . . . . . . . . . . . . . . . . . . . . . . . . . . . . . . . . . . . . . . . . 5
Related Documents . . . . . . . . . . . . . . . . . . . . . . . . . . . . . . . . . . . . . . . . . . . . . . . . . . . . . .6
2 Before You Start . . . . . . . . . . . . . . . . . . . . . . . . . . . . . . . . . . . . . . . . . . . . . . . . . . . 7
Default Settings . . . . . . . . . . . . . . . . . . . . . . . . . . . . . . . . . . . . . . . . . . . . . . . . . . . . . . . . . 7
Other Auto-Configured Settings . . . . . . . . . . . . . . . . . . . . . . . . . . . . . . . . . . . . . . . . . . . .7
DCB Support . . . . . . . . . . . . . . . . . . . . . . . . . . . . . . . . . . . . . . . . . . . . . . . . . . . . . . . . 8
FCoE Connectivity . . . . . . . . . . . . . . . . . . . . . . . . . . . . . . . . . . . . . . . . . . . . . . . . . . .8
iSCSI Operation . . . . . . . . . . . . . . . . . . . . . . . . . . . . . . . . . . . . . . . . . . . . . . . . . . . . .8
Link Aggregation . . . . . . . . . . . . . . . . . . . . . . . . . . . . . . . . . . . . . . . . . . . . . . . . . . . . .9
Link Tracking . . . . . . . . . . . . . . . . . . . . . . . . . . . . . . . . . . . . . . . . . . . . . . . . . . . . . . . . 9
VLANs . . . . . . . . . . . . . . . . . . . . . . . . . . . . . . . . . . . . . . . . . . . . . . . . . . . . . . . . . . . . .9
Uplink LAG . . . . . . . . . . . . . . . . . . . . . . . . . . . . . . . . . . . . . . . . . . . . . . . . . . . . . . 9
Server-Facing LAGs . . . . . . . . . . . . . . . . . . . . . . . . . . . . . . . . . . . . . . . . . . . . . .10
Stacking Mode . . . . . . . . . . . . . . . . . . . . . . . . . . . . . . . . . . . . . . . . . . . . . . . . . .10
Where to Go From Here . . . . . . . . . . . . . . . . . . . . . . . . . . . . . . . . . . . . . . . . . . . . . . . . .10
3 CLI Basics . . . . . . . . . . . . . . . . . . . . . . . . . . . . . . . . . . . . . . . . . . . . . . . . . . . . . . . 13
Accessing the Command Line . . . . . . . . . . . . . . . . . . . . . . . . . . . . . . . . . . . . . . . . . . . . .13
Multiple Configuration Users . . . . . . . . . . . . . . . . . . . . . . . . . . . . . . . . . . . . . . . . . . . . . .14
Navigating the Command Line Interface . . . . . . . . . . . . . . . . . . . . . . . . . . . . . . . . . . . . .14
Obtaining Help . . . . . . . . . . . . . . . . . . . . . . . . . . . . . . . . . . . . . . . . . . . . . . . . . . . . . . . . . 15
Using the Keyword no . . . . . . . . . . . . . . . . . . . . . . . . . . . . . . . . . . . . . . . . . . . . . . . . . . .17
Filtering show Commands . . . . . . . . . . . . . . . . . . . . . . . . . . . . . . . . . . . . . . . . . . . . . . . .17
Displaying All Output . . . . . . . . . . . . . . . . . . . . . . . . . . . . . . . . . . . . . . . . . . . . . . . . .18
Filtering Command Output Multiple Times . . . . . . . . . . . . . . . . . . . . . . . . . . . . . . . .18
Command Modes . . . . . . . . . . . . . . . . . . . . . . . . . . . . . . . . . . . . . . . . . . . . . . . . . . . . . . 18
EXEC Mode . . . . . . . . . . . . . . . . . . . . . . . . . . . . . . . . . . . . . . . . . . . . . . . . . . . . . . . 18
EXEC Privilege Mode . . . . . . . . . . . . . . . . . . . . . . . . . . . . . . . . . . . . . . . . . . . . . . . .18
CONFIGURATION Mode . . . . . . . . . . . . . . . . . . . . . . . . . . . . . . . . . . . . . . . . . . . . .18
INTERFACE Mode . . . . . . . . . . . . . . . . . . . . . . . . . . . . . . . . . . . . . . . . . . . . . . . . . .19
LINE Mode . . . . . . . . . . . . . . . . . . . . . . . . . . . . . . . . . . . . . . . . . . . . . . . . . . . . . . . . 19
MONITOR SESSION Mode . . . . . . . . . . . . . . . . . . . . . . . . . . . . . . . . . . . . . . . . . . .19
PROTOCOL LLDP Mode . . . . . . . . . . . . . . . . . . . . . . . . . . . . . . . . . . . . . . . . . . . . .20
4 File Management. . . . . . . . . . . . . . . . . . . . . . . . . . . . . . . . . . . . . . . . . . . . . . . . . . 21
Overview . . . . . . . . . . . . . . . . . . . . . . . . . . . . . . . . . . . . . . . . . . . . . . . . . . . . . . . . . . . . . 21
Basic File Management Commands . . . . . . . . . . . . . . . . . . . . . . . . . . . . . . . . . . . . . . . .21
| 1
www.dell.com | support.dell.com
5 Control and Monitoring . . . . . . . . . . . . . . . . . . . . . . . . . . . . . . . . . . . . . . . . . . . . . 37
Commands . . . . . . . . . . . . . . . . . . . . . . . . . . . . . . . . . . . . . . . . . . . . . . . . . . . . . . . . . . .37
Important Points to Remember . . . . . . . . . . . . . . . . . . . . . . . . . . . . . . . . . . . . . .60
6 u-Boot . . . . . . . . . . . . . . . . . . . . . . . . . . . . . . . . . . . . . . . . . . . . . . . . . . . . . . . . . . 77
Overview . . . . . . . . . . . . . . . . . . . . . . . . . . . . . . . . . . . . . . . . . . . . . . . . . . . . . . . . . . . . . 77
Commands . . . . . . . . . . . . . . . . . . . . . . . . . . . . . . . . . . . . . . . . . . . . . . . . . . . . . . . . . . .77
7 Data Center Bridging . . . . . . . . . . . . . . . . . . . . . . . . . . . . . . . . . . . . . . . . . . . . . . . 87
Overview . . . . . . . . . . . . . . . . . . . . . . . . . . . . . . . . . . . . . . . . . . . . . . . . . . . . . . . . . . . . . 87
DCB Command . . . . . . . . . . . . . . . . . . . . . . . . . . . . . . . . . . . . . . . . . . . . . . . . . . . . .87
PFC Commands . . . . . . . . . . . . . . . . . . . . . . . . . . . . . . . . . . . . . . . . . . . . . . . . . . . .87
ETS Commands . . . . . . . . . . . . . . . . . . . . . . . . . . . . . . . . . . . . . . . . . . . . . . . . . . . .87
DCBX Commands . . . . . . . . . . . . . . . . . . . . . . . . . . . . . . . . . . . . . . . . . . . . . . . . . . .87
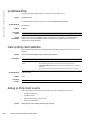
8 Dynamic Host Configuration Protocol (DHCP) . . . . . . . . . . . . . . . . . . . . . . . . . . 105
Overview . . . . . . . . . . . . . . . . . . . . . . . . . . . . . . . . . . . . . . . . . . . . . . . . . . . . . . . . . . . . 105
DHCP Client Commands . . . . . . . . . . . . . . . . . . . . . . . . . . . . . . . . . . . . . . . . . . . . . . . .105
Other Commands supported by DHCP Client . . . . . . . . . . . . . . . . . . . . . . . . . . . . . . . .105
9 FIP Snooping. . . . . . . . . . . . . . . . . . . . . . . . . . . . . . . . . . . . . . . . . . . . . . . . . . . . 111
Overview . . . . . . . . . . . . . . . . . . . . . . . . . . . . . . . . . . . . . . . . . . . . . . . . . . . . . . . . . . . . 111
FIP Snooping Commands . . . . . . . . . . . . . . . . . . . . . . . . . . . . . . . . . . . . . . . . . . . . . . .111
10 Internet Group Management Protocol (IGMP). . . . . . . . . . . . . . . . . . . . . . . . . . . 119
IGMP Commands . . . . . . . . . . . . . . . . . . . . . . . . . . . . . . . . . . . . . . . . . . . . . . . . . . . . . 119
Important Points to Remember . . . . . . . . . . . . . . . . . . . . . . . . . . . . . . . . . . . . . . . .119
11 Interfaces. . . . . . . . . . . . . . . . . . . . . . . . . . . . . . . . . . . . . . . . . . . . . . . . . . . . . . . 125
Overview . . . . . . . . . . . . . . . . . . . . . . . . . . . . . . . . . . . . . . . . . . . . . . . . . . . . . . . . . . . . 125
Port Interface Commands . . . . . . . . . . . . . . . . . . . . . . . . . . . . . . . . . . . . . . . . . . . . . . .125
Port Channel Commands . . . . . . . . . . . . . . . . . . . . . . . . . . . . . . . . . . . . . . . . . . . . . . .126
Time Domain Reflectometer (TDR) Commands . . . . . . . . . . . . . . . . . . . . . . . . . . . . . .126
Important Points to Remember . . . . . . . . . . . . . . . . . . . . . . . . . . . . . . . . . . . . . . . .126
Virtual LAN (VLAN) Commands . . . . . . . . . . . . . . . . . . . . . . . . . . . . . . . . . . . . . . . . . .127
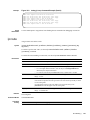
12 IPv4 Routing . . . . . . . . . . . . . . . . . . . . . . . . . . . . . . . . . . . . . . . . . . . . . . . . . . . . 159
IP Commands . . . . . . . . . . . . . . . . . . . . . . . . . . . . . . . . . . . . . . . . . . . . . . . . . . . . . . . . 159
13 iSCSI Optimization . . . . . . . . . . . . . . . . . . . . . . . . . . . . . . . . . . . . . . . . . . . . . . . 175
Overview . . . . . . . . . . . . . . . . . . . . . . . . . . . . . . . . . . . . . . . . . . . . . . . . . . . . . . . . . . . . 175
2
|
iSCSI Commands . . . . . . . . . . . . . . . . . . . . . . . . . . . . . . . . . . . . . . . . . . . . . . . . . . . . .175
14 Link Aggregation Control Protocol (LACP) . . . . . . . . . . . . . . . . . . . . . . . . . . . . . 179
Overview . . . . . . . . . . . . . . . . . . . . . . . . . . . . . . . . . . . . . . . . . . . . . . . . . . . . . . . . . . . . 179
LACP Commands . . . . . . . . . . . . . . . . . . . . . . . . . . . . . . . . . . . . . . . . . . . . . . . . . . . . .179
15 Layer 2. . . . . . . . . . . . . . . . . . . . . . . . . . . . . . . . . . . . . . . . . . . . . . . . . . . . . . . . . 183
Overview . . . . . . . . . . . . . . . . . . . . . . . . . . . . . . . . . . . . . . . . . . . . . . . . . . . . . . . . . . . . 183
MAC Addressing Commands . . . . . . . . . . . . . . . . . . . . . . . . . . . . . . . . . . . . . . . . . . . .183
Virtual LAN (VLAN) Commands . . . . . . . . . . . . . . . . . . . . . . . . . . . . . . . . . . . . . . . . . .183
16 Link Layer Discovery Protocol (LLDP). . . . . . . . . . . . . . . . . . . . . . . . . . . . . . . . . 187
Overview . . . . . . . . . . . . . . . . . . . . . . . . . . . . . . . . . . . . . . . . . . . . . . . . . . . . . . . . . . . . 187
LLDP Commands . . . . . . . . . . . . . . . . . . . . . . . . . . . . . . . . . . . . . . . . . . . . . . . . . . . . .187
17 Port Monitoring . . . . . . . . . . . . . . . . . . . . . . . . . . . . . . . . . . . . . . . . . . . . . . . . . . 191
Overview . . . . . . . . . . . . . . . . . . . . . . . . . . . . . . . . . . . . . . . . . . . . . . . . . . . . . . . . . . . . 191
Monitoring Commands . . . . . . . . . . . . . . . . . . . . . . . . . . . . . . . . . . . . . . . . . . . . . . . . .191
Important Points to Remember . . . . . . . . . . . . . . . . . . . . . . . . . . . . . . . . . . . . . . . .191
18 Quality of Service (QoS) . . . . . . . . . . . . . . . . . . . . . . . . . . . . . . . . . . . . . . . . . . . 197
Overview . . . . . . . . . . . . . . . . . . . . . . . . . . . . . . . . . . . . . . . . . . . . . . . . . . . . . . . . . . . . 197
Policy-Based QoS Commands . . . . . . . . . . . . . . . . . . . . . . . . . . . . . . . . . . . . . . . . . . .197
19 Security . . . . . . . . . . . . . . . . . . . . . . . . . . . . . . . . . . . . . . . . . . . . . . . . . . . . . . . . 199
Commands . . . . . . . . . . . . . . . . . . . . . . . . . . . . . . . . . . . . . . . . . . . . . . . . . . . . . . . . . . 199
Authentication and Password Commands . . . . . . . . . . . . . . . . . . . . . . . . . . . . . . . . . . .199
SSH Server and SCP Commands . . . . . . . . . . . . . . . . . . . . . . . . . . . . . . . . . . . . . . . . .199
20 Simple Network Management Protocol (SNMP) and Syslog. . . . . . . . . . . . . . . . 207
Overview . . . . . . . . . . . . . . . . . . . . . . . . . . . . . . . . . . . . . . . . . . . . . . . . . . . . . . . . . . . . 207
SNMP Commands . . . . . . . . . . . . . . . . . . . . . . . . . . . . . . . . . . . . . . . . . . . . . . . . . . . . .207
Important Points to Remember . . . . . . . . . . . . . . . . . . . . . . . . . . . . . . . . . . . . . . . .207
Syslog Commands . . . . . . . . . . . . . . . . . . . . . . . . . . . . . . . . . . . . . . . . . . . . . . . . . . . .207
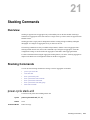
21 Stacking Commands . . . . . . . . . . . . . . . . . . . . . . . . . . . . . . . . . . . . . . . . . . . . . . 219
Overview . . . . . . . . . . . . . . . . . . . . . . . . . . . . . . . . . . . . . . . . . . . . . . . . . . . . . . . . . . . . 219
Stacking Commands . . . . . . . . . . . . . . . . . . . . . . . . . . . . . . . . . . . . . . . . . . . . . . . . . . .219
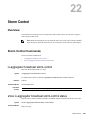
22 Storm Control . . . . . . . . . . . . . . . . . . . . . . . . . . . . . . . . . . . . . . . . . . . . . . . . . . . 225
Overview . . . . . . . . . . . . . . . . . . . . . . . . . . . . . . . . . . . . . . . . . . . . . . . . . . . . . . . . . . . . 225
| 3
www.dell.com | support.dell.com
Storm Control Commands . . . . . . . . . . . . . . . . . . . . . . . . . . . . . . . . . . . . . . . . . . . . . . .225
23 System Time . . . . . . . . . . . . . . . . . . . . . . . . . . . . . . . . . . . . . . . . . . . . . . . . . . . . 227
Overview . . . . . . . . . . . . . . . . . . . . . . . . . . . . . . . . . . . . . . . . . . . . . . . . . . . . . . . . . . . . 227
Time Commands . . . . . . . . . . . . . . . . . . . . . . . . . . . . . . . . . . . . . . . . . . . . . . . . . . . . . .227
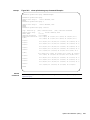
24 Uplink Failure Detection (UFD) . . . . . . . . . . . . . . . . . . . . . . . . . . . . . . . . . . . . . . 235
Overview . . . . . . . . . . . . . . . . . . . . . . . . . . . . . . . . . . . . . . . . . . . . . . . . . . . . . . . . . . . . 235
UFD Commands . . . . . . . . . . . . . . . . . . . . . . . . . . . . . . . . . . . . . . . . . . . . . . . . . . . . . . 235
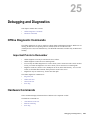
25 Debugging and Diagnostics. . . . . . . . . . . . . . . . . . . . . . . . . . . . . . . . . . . . . . . . . 239
Offline Diagnostic Commands . . . . . . . . . . . . . . . . . . . . . . . . . . . . . . . . . . . . . . . . . . . .239
Important Points to Remember . . . . . . . . . . . . . . . . . . . . . . . . . . . . . . . . . . . . . . . .239
Hardware Commands . . . . . . . . . . . . . . . . . . . . . . . . . . . . . . . . . . . . . . . . . . . . . . . . . .239
26 Internet Control Message Protocol (ICMP) Message Types . . . . . . . . . . . . . . . . 255
4
|
1
About this Guide
This book provides information about the Dell Force10 operating software (FTOS) command line
interface (CLI) on the Dell PowerEdge M I/O Aggregator. It includes some information about the
protocols and features found in FTOS and on the Dell Force10 systems supported by FTOS.
This chapter includes:
•
•
•
•
•
Objectives
Audience
Conventions
Information Symbols
Related Documents
Objectives
This document is intended as a reference guide for the FTOS CLI commands, with detailed syntax
statements, usage information, and sample output examples.
For details about when to use the commands, refer to the FTOS Configuration Guide. This guide
contains an Appendix with a list of the request for comment (RFCs) and management information base
files (MIBs) supported.
Audience
This document is intended for system administrators who are responsible for configuring or
maintaining networks. This document assumes you are knowledgeable in Layer 2 and Layer 3
networking technologies.
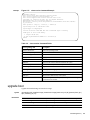
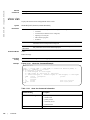
Conventions
This document uses the following conventions to describe command syntax:
Convention
Description
keyword
Keywords are in bold and must be entered in the CLI as listed.
parameter
Parameters are in italics and require a number or word to be entered in the CLI.
{X}
Keywords and parameters within braces must be entered in the CLI.
[X]
Keywords and parameters within brackets are optional.
About this Guide | 5
www.dell.com | support.dell.com
6
x|y
Keywords and parameters separated by bar require you to choose one.
x || y
Keywords and parameters separated by a double bar enables you to choose any or all of them.
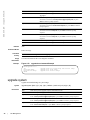
Related Documents
For more information about the system, refer to the following documents:
•
•
•
|
About this Guide
Dell PowerEdge Configuration Guide for the M I/O Aggregator
Dell PowerEdge M I/O Aggregator Getting Started Guide
Release Notes for the M I/O Aggregator (FTOS version 8.3.17.0)
2
Before You Start
By following the instructions in the Dell PowerEdge M I/O Aggregator Getting Started Guide that is
shipped with the product, you install the Aggregator in a Dell PowerEdge M1000e Enclosure.
The Aggregator installs with zero-touch configuration. After you power it on, an Aggregator boots up
with default settings and auto-configures with software features enabled. This chapter describes the
default settings and software features that are automatically configured at startup. Use the tasks
described in the other chapters to reconfigure the Aggregator for customized network operation.
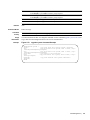
Default Settings
The I/O Aggregator provides zero-touch configuration with the following default configuration
settings:
•
•
•
•
•
•
•
•
•
Default user name (root)
Password (calvin)
VLAN (vlan1) and IP address for in-band management (DHCP-assigned)
IP address for out-of-band (OOB) management (DHCP-assigned)
Read-only SNMP community name (public)
Broadcast storm control (enabled)
Unregistered Multicast Packets flooding (enabled)
IGMP snooping in all VLANs except the default VLAN (enabled)
VLAN configuration (all ports belong to all VLANs)
You can change any of these default settings using the CLI. Refer to the appropriate chapter for details.
Note: You can also change many of the default settings using the chassis management
controller (CMC) interface. For information about how to access the CMC to configure an
Aggregator, refer to the Dell PowerEdge M1000e Enclosure Hardware Owner's Manual or
Dell Chassis Management Controller (CMC) User’s Guide on the Dell Support website at
http://support.dell.com/support/edocs/systems/pem/en/index.htm.
Other Auto-Configured Settings
After the Aggregator powers on, it auto-configures and is operational with software features enabled,
including:
•
•
VLANs: All ports are configured as members of all (4094) VLANs. All VLANs are up and can
send or receive layer 2 traffic. For more information, refer to VLANs.
Data Center Bridging Capability Exchange Protocol (DCBX)
Before You Start | 7
www.dell.com | support.dell.com
•
•
•
•
•
•
•
•
•
•
Fibre Channel over Ethernet (FCoE) connectivity
FCoE Initiation Protocol (FIP) snooping
Hybrid ports: Ports are administratively up and auto-configured to operate as hybrid ports to
transmit tagged and untagged VLAN traffic.
iSCSI optimization
IGMP snooping
Jumbo frames: Ports are set to a maximum MTU of 12,000 bytes by default.
Link aggregation: All uplink ports are configured in a single LAG (LAG 128).
Link Layer Discovery Protocol (LLDP): Enabled on all ports.
Link tracking: Enables server-facing links to be brought up only if the uplink port-channel (LAG
128) is up.
Stacking: Stacking is supported only on the 40GbE ports on the base module. A single stack is
limited to two Aggregators in the same chassis. Up to three stacks are supported in an M1000e
chassis. To configure a switch stack, you must use the CLI. For more information, refer to
Chapter 21, Stacking Commands.
DCB Support
DCB enhancements for data center networks are supported to eliminate packet loss and provision links
with required bandwidth.
The Aggregator provides zero-touch configuration for DCB. The Aggregator auto-configures DCBX
port roles to match the DCBX configuration in the ToR switches to which it connects through its
uplink ports.
The Aggregator supports DCB only in standalone mode and not in the stacking mode.
FCoE Connectivity
Many data centers use Fibre Channel (FC) in storage area networks (SANs). Fibre Channel over
Ethernet (FCoE) encapsulates Fibre Channel frames over Ethernet networks.
On an Aggregator, the internal ports support FCoE connectivity and connect to the converged network
adapter (CNA) in blade servers. FCoE allows Fibre Channel to use 10-Gigabit Ethernet networks while
preserving the Fibre Channel protocol.
The Aggregator also provides zero-touch configuration for FCoE configuration. The Aggregator
auto-configures to match the FCoE settings used in the ToR switches to which it connects through its
uplink ports.
iSCSI Operation
Support for iSCSI traffic is turned on by default when the Aggregator powers up. No configuration is
required.
When the Aggregator powers up, it monitors known TCP ports for iSCSI storage devices on all
interfaces. When a session is detected, an entry is created and monitored as long as the session is
active.
8
|
Before You Start
The Aggregator also detects iSCSI storage devices on all interfaces and auto-configures to optimize
performance. Performance optimization operations, such as Jumbo frame size support, STP port-state
fast, and disabling of storm control on interfaces connected to an iSCSI storage device, are applied
automatically.
CLI configuration is necessary only when the configuration includes iSCSI storage devices that cannot
be automatically detected and when non-default QoS handling is required.
Link Aggregation
All uplink ports are configured in a single LAG (LAG 128). Server-facing ports are auto-configured as
part of link aggregation groups if the corresponding server is configured for LACP-based NIC teaming.
Static LAGs are not supported.
Tip: The recommended LACP timeout is long-timeout mode.
Link Tracking
By default, all server-facing ports are tracked by the operational status of the uplink LAG. If the uplink
LAG goes down, the Aggregator loses its connectivity and is no longer operational; all server-facing
ports are brought down.
Tip: If installed servers do not have connectivity to a ToR switch, check the Link Status LED of uplink
ports on the Aggregator. If all LEDs are ON, check the LACP configuration on the ToR switch that is
connected to the Aggregator to ensure the LACP is correctly configured.
VLANs
By default, all Aggregator ports belong to all 4094 VLANs and are members of untagged VLAN 1.
You can use the CLI or CMC interface to configure only the required VLANs on a port.
When you configure VLANs on server-facing interfaces (ports 1 to 32), you can assign VLANs to a
port or a range of ports by entering the vlan tagged or vlan untagged commands in interface
configuration mode; for example:
FTOS(conf)# interface tengigabitethernet 0/2 - 4
FTOS(conf-if-range-te-0/2-4)# vlan tagged 5,7,10-12
FTOS(conf-if-range-te-0/2-4)# vlan untagged 3
Note: You can also use the CMC interface to configure VLANs.
Uplink LAG
The tagged VLAN membership of the uplink LAG is automatically configured based on the VLAN
configuration of all server-facing ports (ports 1 to 32).
Before You Start | 9
www.dell.com | support.dell.com
The untagged VLAN used for the uplink LAG is always the default VLAN.
Server-Facing LAGs
The tagged VLAN membership of a server-facing LAG is automatically configured based on the
server-facing ports that are members of the LAG.
The untagged VLAN of a server-facing LAG is configured based on the untagged VLAN to which the
lowest numbered server-facing port in the LAG belongs.
Tip: Dell Force10 recommends that you configure the same VLAN membership on all LAG member
ports.
Stacking Mode
When you configure an Aggregator to operate in stacking mode (See “Configuring and Bringing Up a
Stack” in the Dell Force10 Configuration Guide for the M I/O Aggregator), VLANs are reconfigured
as follows:
If an Aggregator port belonged to all 4094 VLANs in standalone mode (default), all VLAN
membership is removed and the port is assigned only to default VLAN 1. You must configure
additional VLAN membership as necessary.
If you had manually configured an Aggregator port to belong to one or more VLANs (non-default) in
standalone mode, the VLAN configuration is retained in stacking mode only on the master switch.
When you reconfigure an Aggregator from stacking to standalone mode:
Aggregator ports that you manually configured for VLAN membership in stacking mode retain their
VLAN configuration in standalone mode.
To restore the default auto-VLAN mode of operation (in which all ports are members of all 4094
VLANs) on a port, enter the auto vlan command; for example:
FTOS(conf)# interface tengigabitethernet 0/2
FTOS(conf-if-te-0/2)# auto vlan
Where to Go From Here
You can customize the Aggregator for use in your data center network as necessary. To perform
additional switch configuration, do one of the following:
•
•
•
For remote out-of-band management, enter the OOB management interface IP address into a
Telnet or SSH client and log in to the switch using the user ID and password to access the CLI.
For local management using the CLI, use the attached console connection.
For remote in-band management from a network management station, enter the VLAN IP address
of the management port and log in to the switch to access the CLI.
If you installed the Aggregator in a stack, you can configure additional settings for switch stacking.
10
|
Before You Start
In case of an FTOS upgrade, you can check to see that an Aggregator is running the latest FTOS
version by entering the show version command. To download an FTOS version, go to http://
support.dell.com.
Refer to the appropriate chapter for detailed information on how to configure specific software
settings.
Before You Start | 11
12
|
Before You Start
www.dell.com | support.dell.com
3
CLI Basics
This chapter describes the command structure and command modes. The Dell Force10 operating
software (FTOS) commands are in a text-based interface that allows you to use launch commands,
change the command modes, and configure interfaces and protocols.
This chapter includes the following sections:
•
•
•
•
•
•
•
Accessing the Command Line
Multiple Configuration Users
Navigating the Command Line Interface
Obtaining Help
Using the Keyword no
Filtering show Commands
Command Modes
Accessing the Command Line
When the system boots successfully, you are positioned on the command line in EXEC mode and not
prompted to log in. You can access the commands through a serial console port or a Telnet session.
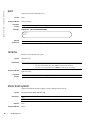
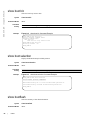
When you Telnet into the switch, you are prompted to enter a login name and password.
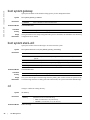
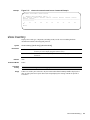
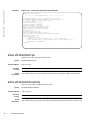
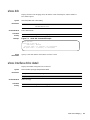
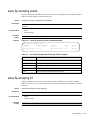
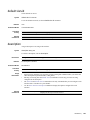
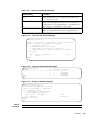
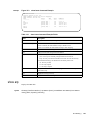
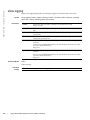
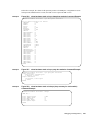
Figure 3-1 is an example of a successful Telnet login session.
Figure 3-1.
Login Example
telnet 172.31.1.53
Trying 172.31.1.53...
Connected to 172.31.1.53.
Escape character is '^]'.
Login: username
Password:
FTOS>
After you log into the switch, the prompt provides you with current command-level information
(Table 3-1).
CLI Basics | 13
www.dell.com | support.dell.com
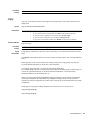
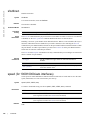
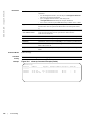
Multiple Configuration Users
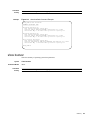
When a user enters CONFIGURATION mode and another user(s) is already in that configuration
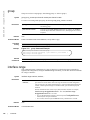
mode, FTOS generates an alert warning message similar to Figure 3-2:
Figure 3-2.
Configuration Mode User Alert
FTOS#conf
% Warning: The following users are currently configuring the system:
User
User
User
User
"" on line
"admin" on
"admin" on
"Irene" on
console0
line vty0 ( 123.12.1.123 )
line vty1 ( 123.12.1.123 )
line vty3 ( 123.12.1.321 )
FTOS#conf
When another user enters CONFIGURATION mode, FTOS sends a message similar to the following,
(the user in this case is “admin” on vty2):
% Warning: User “admin” on line vty2 “172.16.1.210” is in configuration
Navigating the Command Line Interface
The command line interface (CLI) prompt displayed by FTOS is comprised of:
•
•
“hostname”— the initial part of the prompt, “FTOS” by default. You can change it with the
hostname command, as described in hostname.
The second part of the prompt, reflecting the current CLI mode, is shown in Table 3-1.
The CLI prompt changes as you move up and down the levels of the command structure.
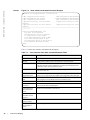
Table 3-1 lists the prompts and their corresponding command levels, called modes. Starting with
CONFIGURATION mode, the command prompt adds modifiers to further identify the mode. The
command modes are explained in Command Modes.
Table 3-1.
14
|
CLI Basics
Command Prompt and Corresponding Command Mode
Prompt
CLI Command Mode
FTOS>
EXEC
FTOS#
EXEC Privilege
FTOS(conf)#
CONFIGURATION
FTOS(conf-if-te-0/0)#
FTOS(conf-if-vl-1)#
FTOS(conf-if-ma-0/0)#
FTOS(conf-if-range)#
INTERFACE
FTOS(conf-line-console)#
FTOS(conf-line-vty)#
LINE
FTOS(conf-mon-sess)#
MONITOR SESSION
Obtaining Help
As soon as you are in a command mode, there are several ways to access help.
•
•
•
•
To obtain a list of keywords at any command mode, do the following:
— Enter a ? at the prompt or after a keyword. There must always be a space before the ?.
To obtain a list of keywords with a brief functional description, do the following:
— Enter help at the prompt.
To obtain a list of available options, do the following:
— Type a keyword followed by a space and a ?
Type a partial keyword followed by a ?
— A display of keywords beginning with the partial keyword is listed.
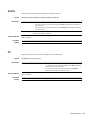
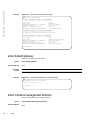
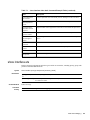
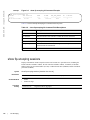
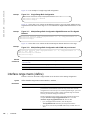
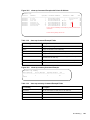
Figure 3-3 shows the results of entering ip ? at the prompt.
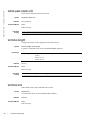
Figure 3-3.
Partial Keyword Example
FTOS(conf)#ip ?
igmp
route
telnet
Internet Group Management Protocol
Establish static routes
Specify telnet options
When entering commands, you can take advantage of the following time saving features:
•
•
•
•
•
The commands are not case sensitive.
You can enter partial (truncated) command keywords. For example, you can enter int tengig
interface for the interface tengigabitethernet interface command.
Use the TAB key to complete keywords in commands.
Use the up arrow key to display the last enabled command.
Use either the Backspace key or the Delete key to erase the previous character.
Use the left and right arrow keys to navigate left or right in the FTOS command line. Table 3-2
defines the key combinations valid at the FTOS command line.
Table 3-2.
Short-cut Keys and their Actions
Key
Combination
Action
CNTL-A
Moves the cursor to the beginning of the command line.
CNTL-B
Moves the cursor back one character.
CNTL-D
Deletes character at cursor.
CNTL-E
Moves the cursor to the end of the line.
CNTL-F
Moves the cursor forward one character.
CNTL-I
Completes a keyword.
CNTL-K
Deletes all characters from the cursor to the end of the command line.
CNTL-N
Return to more recent commands in the history buffer after recalling commands with Ctrl-P
or the up arrow key.
CNTL-P
Recalls commands, beginning with the last command.
CNTL-U
Deletes the line.
CNTL-W
Deletes the previous word.
CLI Basics | 15
www.dell.com | support.dell.com
Table 3-2.
16
|
CLI Basics
Short-cut Keys and their Actions
Key
Combination
Action
CNTL-X
Deletes the line.
CNTL-Z
Comes back to EXEC mode from any CONFIGURATION mode.
Esc B
Moves the cursor back one word.
Esc F
Moves the cursor forward one word.
Esc D
Deletes all characters from the cursor to the end of the word.
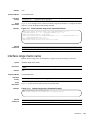
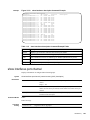
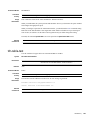
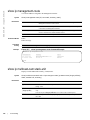
Using the Keyword no
To disable, delete, or return to default values, use the no form of the commands. For most commands,
if you type the keyword no in front of the command, you will disable that command or delete it from
the running configuration. In this document, the no form of the command is described in the “Syntax”
portion of the command description.
Syntax
Defaults
Command Modes
no {boot | default | enable | ftp-server | hardware | hostname | ip | line | logging | monitor | service
| io-aggregator broadcast storm-control | snmp-server | username}
None
CONFIGURATION
Command
History
Version 8.3.17.0
Supported on M I/O Aggregator
Filtering show Commands
You can filter the display output of a show command to find specific information, to display certain
information only, or to begin the command output at the first instance of a regular expression or phrase.
When you execute a show command, followed by a pipe ( | ) and one of the parameters listed below
and a regular expression, the resulting output either excludes or includes those parameters, as defined
by the parameter:
•
•
•
•
•
except— display only text that does not match the pattern (or regular expression)
find — search for the first occurrence of a pattern
grep — display text that matches a pattern
no-more — do not paginate the display output
save — copy output to a file for future use
Note: FTOS accepts a space before or after the pipe, no space before or after the pipe, or any
combination. For example:
FTOS#command | grep tengigabit |except regular-expression | find
regular-expression
The grep command option has an ignore-case sub-option that makes the search case-insensitive. For
example, the commands:
•
•
•
show run | grep Ethernet returns a search result with instances containing a capitalized
“Ethernet,” such as interface TenGigabitEthernet 0/0.
show run | grep ethernet does not return the search result above because it only searches for
instances containing a non-capitalized “ethernet”.
show run | grep Ethernet ignore-case returns instances containing both “Ethernet” and
“ethernet”.
CLI Basics | 17
www.dell.com | support.dell.com
Displaying All Output
To display the output all at once (not one screen at a time), use the no-more command after the pipe.
This is similar to the terminal length screen-length command except that the no-more option affects
the output of just the specified command. For example:
FTOS#show running-config | no-more
Filtering Command Output Multiple Times
You can filter a single command output multiple times. To do this, place the save option as the last
filter. For example:
FTOS# command | grep regular-expression | except regular-expression | grep
other-regular-expression | find regular-expression | no-more | save
Command Modes
To navigate to various CLI modes, use specific commands to launch each mode. Navigation to these
modes is described in the following sections.
EXEC Mode
When you initially log in to the switch, by default you are logged into EXEC mode. This mode allows
you to view settings and to enter EXEC Privilege mode to configure the device. While you are in
EXEC mode, the > prompt is displayed following the “hostname” prompt (which is “FTOS” by
default). You can change this using the hostname command. For more information, refer to the
hostname command. Each mode prompt is preceded by the hostname.
EXEC Privilege Mode
The enable command accesses EXEC Privilege mode. If an administrator has configured an Enable
password, you are prompted to enter the password here.
EXEC Privilege mode allows you to access all commands accessible in EXEC mode, plus other
commands, such as to clear ARP entries and IP addresses. In addition, you can access
CONFIGURATION mode to configure interfaces, routes, and protocols on the switch. While you are
logged in to EXEC Privilege mode, the # prompt displays.
CONFIGURATION Mode
In EXEC Privilege mode, use the configure command to enter CONFIGURATION mode and
configure routing protocols and access interfaces.
To enter CONFIGURATION mode:
1.
2.
18
|
CLI Basics
Verify that you are logged in to EXEC Privilege mode.
Enter the configure command. The prompt changes to include (conf).
From this mode, you can enter INTERFACE mode using the interface command.
INTERFACE Mode
Use INTERFACE mode to configure interfaces or IP services on those interfaces. An interface can be
physical (for example, a TenGigabit Ethernet port) or virtual (for example, the Null interface).
To enter INTERFACE mode:
1.
2.
3.
Verify that you are logged into CONFIGURATION mode.
Enter the interface command followed by an interface type and interface number that is available
on the switch.
The prompt changes to include the designated interface and slot/port number (Table 3-3).
Table 3-3.
Interface prompts
Prompt
Interface Type
FTOS(conf-if-te-0/0)#
Ten Gigabit Ethernet interface followed by slot/port information
FTOS(conf-if-vl-1)#
VLAN Interface followed by VLAN number (range 1 to 4094)
FTOS(conf-if-ma-0/0)#
Management Ethernet interface followed by slot/port information
FTOS(conf-if-range)#
Designated interface range (used for bulk configuration; refer to group).
LINE Mode
Use LINE mode to configure console or virtual terminal parameters.
To enter LINE mode:
1.
2.
Verify that you are logged in to CONFIGURATION mode.
Enter the line command. You must include the keywords console or vty and their line number
available on the switch.The prompt changes to include (config-line-console) or (config-line-vty).
You can exit this mode using the exit command.
MONITOR SESSION Mode
While in CONFIGURATION mode, use the monitor session command to enter MONITOR SESSION
mode. Use this mode to configure port monitoring.
To enter MONITOR SESSION mode:
1.
2.
Verify that you are logged in to CONFIGURATION mode.
Use the monitor session command. You must enter the monitor session id. The prompt changes to
include (conf-mon-sess).
You can return to CONFIGURATION mode using the exit command.
CLI Basics | 19
www.dell.com | support.dell.com
PROTOCOL LLDP Mode
20
While in CONFIGURATION mode, use the protocol lldp command to enter PROTOCOL LLDP
mode. Use this mode to configure the LLDP protocol.
To enter MONITOR SESSION mode:
1.
2.
Verify that you are logged in to CONFIGURATION mode.
Use the protocol lldp command. You must enter the monitor session id. The prompt changes to
include (conf-lldp).
You can return to CONFIGURATION mode using the exit command.
|
CLI Basics
4
File Management
Overview
This chapter contains commands needed to manage the configuration files and includes other file
management commands found in the Dell Force10 operating software (FTOS).
Basic File Management Commands
The commands included in this chapter are:
•
•
•
•
•
•
•
•
•
•
•
•
•
•
•
•
•
•
•
•
boot system gateway
boot system stack-unit
cd
copy
copy running-config startup-config
delete
dir
format flash
logging coredump server
logging coredump stack-unit
pwd
rename
show boot system
show file
show file-systems
show os-version
show running-config
show version
upgrade boot
upgrade system
File Management | 21
www.dell.com | support.dell.com
boot system gateway
Specify the IP address of the default next-hop gateway for the management subnet.
Syntax
Parameters
Command Modes
Command
History
Usage
Information
boot system gateway ip-address
ip-address
Enter an IP address in dotted decimal format.
CONFIGURATION
Version 8.3.17.0
Supported on M I/O Aggregator
Saving the address to the startup configuration file preserves the address in NVRAM in case the startup
configuration file is deleted.
boot system stack-unit
Specify the location of the FTOS image to be used to boot the system.
Syntax
Parameters
Command Modes
Command
History
Usage
Information
boot system stack-unit <0-5 | all> {default | primary | secondary}
0-5
Enter the stack member unit identifier of the stack member.
all
Enter this keyword to set the primary, secondary, and default images for the
system.
default
Enter this keyword to set the default image path for the system.
primary
Enter this keyword to set the primary image path for the system.
secondary
Enter this keyword to set the secondary image path for the system.
CONFIGURATION
Version 8.3.17.0
Supported on M I/O Aggregator
The system first attempts to load the image from the primary path. If it fails to boot, the system will try
to load the image from the secondary path and if that too fails, the system will load the default image.
cd
Change to a different working directory.
Syntax
Parameters
cd directory
directory
(OPTONAL) Enter one of the following:
•
•
Command Modes
22
|
File Management
EXEC Privilege
flash: (internal Flash) or any sub-directory
usbflash: (external Flash) or any sub-directory
Command
History
Version 8.3.17.0
Supported on M I/O Aggregator
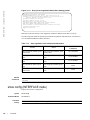
copy
Copy one file to another location. FTOS supports IPv4 addressing for FTP, TFTP, and SCP (in the
hostip field).
Syntax
Parameters
copy source-file-url destination-file-url
file-url
Enter the following location keywords and information:
•
•
•
•
Command Modes
EXEC Privilege
Command
History
Version 8.3.17.0
Usage
Information
To copy a file from the internal FLASH, enter flash:// followed by the filename.
To copy the running configuration, enter the keyword running-config.
To copy the startup configuration, enter the keyword startup-config.
To copy a file on the external FLASH, enter usbflash:// followed by the filename.
Supported on M I/O Aggregator
FTOS supports a maximum of 100 files, at the root directory level, on both the internal and external
Flash.
The usbflash commands are supported. For a list of approved USB vendors, refer to the FTOS Release
Notes.
When copying a file to a remote location (for example, using Secure Copy [SCP]), enter only the
keywords and FTOS prompts you for the rest of the information.
For example, when using SCP, you can enter copy running-config scp:
The running-config is the source, and the target is specified in the ensuing prompts. FTOS prompts you
to enter any required information, as needed for the named destination—remote destination,
destination filename, user ID and password, etc.
When you use the copy running-config startup-config command to copy the running configuration
(the startup configuration file amended by any configuration changes made since the system was
started) to the startup configuration file, FTOS creates a backup file on the internal flash of the startup
configuration.
FTOS supports copying the running-configuration to a TFTP server or to an FTP server:
copy running-config tftp:
copy running-config ftp:
File Management | 23
www.dell.com | support.dell.com
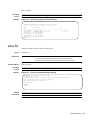
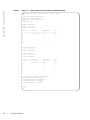
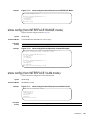
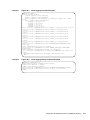
Example
Figure 4-1.
copy running-config scp: Command Example
FTOS#copy running-config scp:
Address or name of remote host []: 10.10.10.1
Port number of the server [22]: 99
Destination file name [startup-config]: old_running
User name to login remote host: sburgess
Password to login remote host:
Password to login remote host? dilling
In this example — copy scp: flash: — specifying SCP in the first position indicates that the target is to
be specified in the ensuing prompts. Entering flash: in the second position means that the target is the
internal Flash. In this example the source is on a secure server running SSH, so the user is prompted for
the UDP port of the SSH server on the remote host.
Example
Figure 4-2.
Using scp to copy from an SSH Server
FTOS#copy scp: flash:
Address or name of remote host []: 10.11.199.134
Port number of the server [22]: 99
Source file name []: test.cfg
User name to login remote host: admin
Password to login remote host:
Destination file name [test.cfg]: test1.cfg
Related
Commands
cd
Changes the working directory.
copy running-config startup-config
Copy running configuration to the startup configuration.
Syntax
Command Modes
EXEC Privilege
Command
History
Version 8.3.17.0
Usage
Information
24
copy running-config startup-config {duplicate}
|
File Management
Supported on M I/O Aggregator
This command is useful for quickly making a changed configuration on one chassis available on
external flash in order to move it to another chassis.
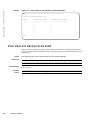
delete
Delete a file from the flash. Once deleted, files cannot be restored.
Syntax
Parameters
delete flash: ([flash://]filepath) usbflash ([usbflash://] filepath)
flash-url
Enter the following location and keywords:
•
•
no-confirm
Command Modes
EXEC Privilege
Command
History
Version 8.3.17.0
For a file or directory on the internal Flash, enter flash:// followed by the filename or
directory name.
For a file or directory on the external Flash, enter usbflash:// followed by the filename
or directory name.
(OPTIONAL) Enter the keyword no-confirm to specify that FTOS does not require user
input for each file prior to deletion.
Supported on M I/O Aggregator
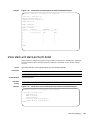
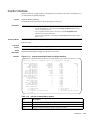
dir
Displays the files in a file system. The default is the current directory.
Syntax
Parameters
dir [filename | directory name:]
filename | directory name:
(OPTIONAL) Enter one of the following:
•
•
Command Modes
EXEC Privilege
Command
History
Version 8.3.17.0
For a file or directory on the internal Flash, enter flash:// followed
by the filename or directory name.
For a file or directory on the external Flash, enter usbflash://
followed by the filename or directory name:
Supported on M I/O Aggregator
File Management | 25
www.dell.com | support.dell.com
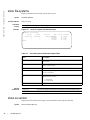
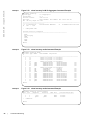
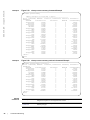
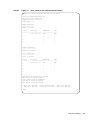
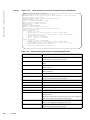
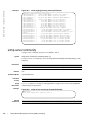
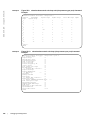
Example
Figure 4-3.
dir for the Internal Flash Command Example
FTOS#dir
Directory of flash:
1 drwx
4096
2 drwx
2048
3 drwx
4096
4 drwx
4096
5 d--4096
6 -rwx 506724352
7 -rwx 715651180
8 -rwx
30670080
FTOS-nav_ascii.bin
9 -rwx
76
10 -rwx
1
11 -rwx
56839
12 -rwx
150227
13 -rwx
150227
14 -rwx
561
15 -rwx
149553
startup-config.bak
16 -rwx
4835
17 -rwx
8373
Jan
Jul
Apr
Apr
Apr
Apr
Apr
May
01
19
03
03
03
19
17
18
1980
2012
2012
2012
2012
2012
2012
2012
00:00:00
10:36:07
20:25:02
20:25:02
20:25:02
23:32:02
23:17:30
04:42:06
+00:00
+00:00
+00:00
+00:00
+00:00
+00:00
+00:00
+00:00
.
..
TRACE_LOG_DIR
CORE_DUMP_DIR
ADMIN_DIR
out3
out1
May
Jul
May
Jun
Jun
Jun
Jul
02
06
17
07
07
26
04
2012
2012
2012
2012
2012
2012
2012
05:37:42
07:30:44
01:05:24
16:57:24
17:31:52
06:36:46
04:27:48
+00:00
+00:00
+00:00
+00:00
+00:00
+00:00
+00:00
dhcpBindConflict
testhttp
writefru
aaa
bbb
jumpstartcfg
Jul 19 2012 10:34:28 +00:00 startup-config
Jul 19 2012 06:44:34 +00:00 startup-config-1
flash: 2143281152 bytes total (836874240 bytes free)
FTOS#
Related
Commands
cd
Changes the working directory.
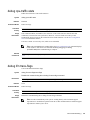
format flash
Erase all existing files and reformat the filesystem in the internal flash memory. After the filesystem is
formatted, files cannot be restored.
Syntax
format {flash: | usbflash:}
Default
flash memory
Command Modes
EXEC Privilege
Command
History
Version 8.3.17.0
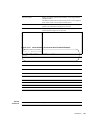
Usage
Information
Supported on M I/O Aggregator
You must include the colon (:) when entering this command.
Caution: This command deletes all files, including the startup configuration file. So, after
executing this command, consider saving the running config as the startup config (use the
write memory command or the copy run start command).
Related
Commands
26
|
File Management
copy
Copies the current configuration to either the startup-configuration file or the
terminal.
show file
Displays the contents of a text file in the local filesystem.
show file-systems
Displays information about the file systems on the system.
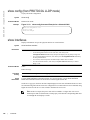
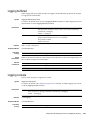
logging coredump server
Designate a server to upload core dumps.
Syntax
Parameters
logging coredump server {ipv4-address} username name password [type] password
{ipv4-address}
Enter the server IPv4 address (A.B.C.D)
name
Enter a username to access the target server.
type
Enter the password type:
•
•
password
Defaults
Command Modes
Command
History
Usage
Information
Enter 0 to enter an unencrypted password.
Enter 7 to enter a password that has already been encrypted using a Type
7 hashing algorithm.
Enter a password to access the target server.
Crash kernel files are uploaded to flash by default.
CONFIGURATION
Version 8.3.17.0
Supported on M I/O Aggregator
Because flash space may be limited, using this command ensures your entire crash kernel files are
uploaded successfully and completely. Only a single coredump server can be configured.
Configuration of a new coredump server over-writes any previously configured server.
Note: You must disable logging coredump stack-unit before you designate a new server
destination for your core dumps.
Related
Commands
logging coredump stack-unit
Enable the kernel coredump
logging coredump stack-unit
Enable the coredump.
Syntax
Command Modes
Command
History
Usage
Information
Related
Commands
logging coredump stack-unit all
CONFIGURATION
Version 8.3.17.0
Supported on M I/O Aggregator
The Kernel core dump can be large and may take up to five to 30 minutes to upload. FTOS does not
overwrite application core dumps so delete them as necessary to conserve space on the flash; if the
flash is out of memory, the coredump is aborted. FTOS completes the coredump process and waits
until the upload is complete before rebooting the system.
logging coredump server
Designates a sever to upload kernel core-dumps.
File Management | 27
www.dell.com | support.dell.com
pwd
Displays the current working directory.
Syntax
pwd
Command Modes
EXEC Privilege
Command
History
Version 8.3.17.0
Example
Figure 4-4.
Supported on M I/O Aggregator
pwd Command Example
FTOS#pwd
flash:
FTOS#
Related
Commands
cd
Changes the working directory.
rename
Rename a file in the local file system.
Syntax
Parameters
rename url url
url
Enter the following keywords and a filename:
•
•
Command Modes
EXEC Privilege
Command
History
Version 8.3.17.0
For a file on the internal Flash, enter flash:// followed by the filename.
For a file on the external Flash, enter usbflash:// followed by the filename.
Supported on M I/O Aggregator
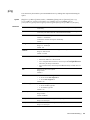
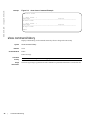
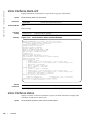
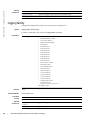
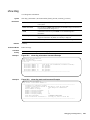
show boot system
Displays information about boot images currently configured on the system.
Syntax
Parameters
Defaults
Command Modes
28
|
File Management
show boot system stack-unit {0-5 | all}
0-5
Enter this information to display the boot image information of only the entered stack-unit
all
Enter this keyword to display the boot image information of all the stack-units in the stack
none
EXEC
EXEC Privilege
Command
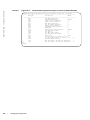
History
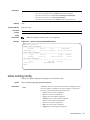
Example
Version 8.3.17.0
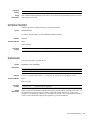
Figure 4-5.
Supported on M I/O Aggregator
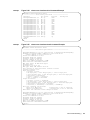
show boot system Command Example
FTOS#show boot system stack-unit all
Current system image information in the system:
=============================================
Type
Boot Type
A
B
---------------------------------------------------------------Stack-unit 0 is not present.
Stack-unit 1 DOWNLOAD BOOT 9-1-0-218
9-1-0-202
Stack-unit 2 is not present.
Stack-unit 3 is not present.
Stack-unit 4 is not present.
Stack-unit 5 is not present.
FTOS#
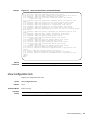
show file
Displays contents of a text file in the local filesystem.
Syntax
Parameters
show file url
url
Enter one of the following:
• For a file on the internal Flash, enter flash:// followed by the filename.
• For a file on the external Flash, enter usbflash:// followed by the filename.
Command Modes
EXEC Privilege
Command
History
Version 8.3.17.0
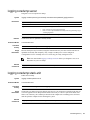
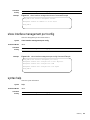
Example
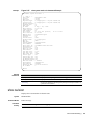
Figure 4-6.
Supported on M I/O Aggregator
show file Command Example (Partial)
FTOS#show file flash://startup-config
! Version E8-3-17-38
boot system stack-unit 1 primary tftp://10.11.9.21/dv-m1000e-2-b2
boot system stack-unit 1 default system: A:
boot system gateway 10.11.209.62
!
hostname FTOS
--More-FTOS#
Related
Commands
format flash
Erases all existing files and reformats the filesystem in the internal flash memory.
show file-systems
Displays information about the file systems on the system.
File Management | 29
www.dell.com | support.dell.com
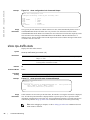
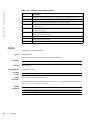
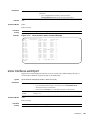
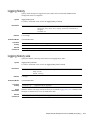
show file-systems
Displays information about the file systems on the system.
Syntax
show file-systems
Command Modes
EXEC Privilege
Command
History
Version 8.3.17.0
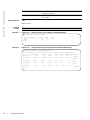
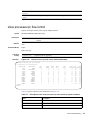
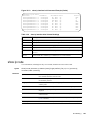
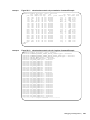
Example
Figure 4-7.
Supported on M I/O Aggregator
show file-system Command Example
FTOS#show file-systems
Size(b)
2143281152
FTOS#
Table 4-1.
Free(b)
836874240
-
Feature
Type
FAT32 USERFLASH
network
network
network
Flags
rw
rw
rw
rw
Prefixes
flash:
ftp:
tftp:
scp:
show file-systems Command Output Fields
Field
Description
Size(b)
Lists the size in bytes of the storage location. If the location is remote, no
size is listed.
Free(b)
Lists the available size in bytes of the storage location. If the location is
remote, no size is listed.
Feature
Displays the formatted DOS version of the device.
Type
Displays the type of storage. If the location is remote, the word
network is listed.
Flags
Displays the access available to the storage location. The following letters
indicate the level of access:
•
•
Prefixes
Related
Commands
r = read access
w = write access
Displays the name of the storage location.
format flash
Erases all existing files and reformats the filesystem in the internal flash memory.
show file
Displays the contents of a text file in the local filesystem.
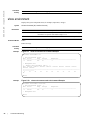
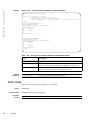
show os-version
Displays the release and software image version information of the image file specified.
Syntax
30
|
File Management
show os-version [file-url]
Parameters
file-url
(OPTIONAL) Enter the following location keywords and information:
•
•
•
•
Defaults
none
Command Modes
EXEC Privilege
Command
History
Version 8.3.17.0
Usage
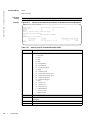
Information
Example
For a file on the internal Flash, enter flash:// followed by the filename.
For a file on an FTP server, enter ftp://user:password@hostip/filepath
For a file on a TFTP server, enter tftp://hostip/filepath
For a file on the external Flash, enter usbflash:// followed by the filename.
Supported on M I/O Aggregator
Note: A filepath that contains a dot (.) is not supported.
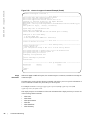
Figure 4-8.
show os-version Command Example
FTOS#show os-version
RELEASE IMAGE INFORMATION :
--------------------------------------------------------------------Platform
Version
Size
ReleaseTime
IOM-Series: XL
8-3-17-38
31603078
Jul 19 2012 06:02:28
TARGET IMAGE INFORMATION :
--------------------------------------------------------------------Type
Version
Target
checksum
runtime
8-3-17-38
Control Processor
passed
CPLD IMAGE INFORMATION :
--------------------------------------------------------------------Card
CPLD Name
Version
Stack-unit 1
IOM SYSTEM CPLD
6
FTOS#
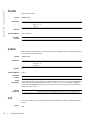
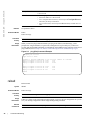
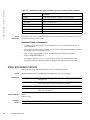
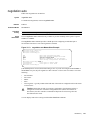
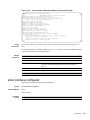
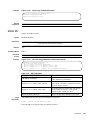
show running-config
Displays the current configuration and changes from the default values.
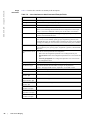
Syntax
Parameters
show running-config [entity] [configured] [status]
entity
(OPTIONAL) Enter one of the keywords listed below to display that entity’s
current (non-default) configuration. Note that, if nothing is configured for
that entity, nothing is displayed and the prompt returns:
•
boot for the current boot configuration
•
•
•
•
•
•
•
ftp for the current FTP configuration
igmp for the current IGMP configuration
interface for the current interface configuration
iscsi for the current ISCSI configuration
line for the current line configuration
lldp for the current LLDP configuration
logging for the current logging configuration
File Management | 31
www.dell.com | support.dell.com
•
•
•
•
•
status
(OPTIONAL) Enter the keyword status to display the checksum for the
running configuration and the start-up configuration.
Command Modes
EXEC Privilege
Command
History
Version 8.3.17.0
Example
Figure 4-9.
management-route for the current Management port forwarding
configuration
monitor for the current Monitor configuration
snmp for the current SNMP configuration
uplink-state-group for the uplink state group configuration
users for the current users configuration
Supported on M I/O Aggregator
show running-config Command Example (Partial)
FTOS#show running-config
Current Configuration ...
! Version E8-3-17-38
! Last configuration change at Mon Jul 23 14:34:31 2012 by default
!
boot system stack-unit 1 primary tftp://10.11.9.21/dv-m1000e-2-b2
boot system stack-unit 1 default system: A:
boot system gateway 10.11.209.62
!
redundancy auto-synchronize full
!
service timestamps log datetime
!
hostname FTOS
...
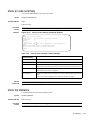
Example
Figure 4-10.
show running-config Command Example
FTOS#show running-config status
running-config bytes 5063, checksum 0xF6F801AC
startup-config bytes 4835, checksum 0x764D3787
FTOS#
Usage
Information
The status option allows you to display the size and checksum of the running configuration and the
startup configuration
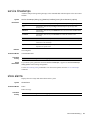
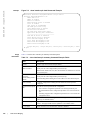
show version
Displays the current FTOS version information on the system.
Syntax
32
show version
Command Modes
EXEC Privilege
Command
History
Version 8.3.17.0
|
File Management
Supported on M I/O Aggregator
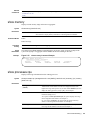
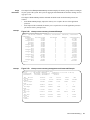
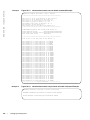
Example
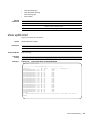
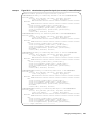
Figure 4-11. show version Command Example
FTOS#show version
Dell Force10 Real Time Operating System Software
Dell Force10 Operating System Version: 1.0
Dell Force10 Application Software Version: E8-3-17-38
Copyright (c) 1999-2012 by Dell Inc. All Rights Reserved.
Build Time: Thu Jul 19 05:59:59 PDT 2012
Build Path: /sites/sjc/work/swsystems01-2/ravisubramani/ravis-8317/SW/SRC/
Cp_src/Tacacs
FTOS uptime is 4 day(s), 4 hour(s), 3 minute(s)
System image file is "dv-m1000e-2-b2"
System Type: I/O-Aggregator
Control Processor: MIPS RMI XLP with 2147483648 bytes of memory.
256M bytes of boot flash memory.
1 34-port GE/TE (XL)
56 Ten GigabitEthernet/IEEE 802.3 interface(s)
FTOS#
Table 4-2.
show version Command Fields
Lines beginning with
Description
Dell Force10 Network...
Name of the operating system
Dell Force10 Operating...
OS version number
Dell Force10 Application...
Software version
Copyright (c)...
Copyright information
Build Time...
Software build’s date stamp
Build Path...
Location of the software build files loaded on the system
Dell Force10 uptime is...
Amount of time the system has been up
System image...
Image file name
Chassis Type:
System type (M I/O Aggregator)
Control Processor:...
Control processor information and amount of memory on processor.
256M bytes...
Amount of boot flash memory on the system.
1 34-Port...
Hardware configuration of the system, including the number and type of
physical interfaces available.
upgrade boot
Upgrade the bootflash image or bootselector image.
Syntax
Parameters
upgrade boot {all | bootflash-image | bootselector-image} stack-unit {0-5 | all} {booted | flash: |ftp: |
tftp: | usbflash:} (A: | B:}
all
Enter this keyword to change both the bootflash and bootselecter images.
bootflash-image
Enter this keyword to change the bootflash image.
bootselector-image
Enter this keyword to change the bootselector image
0-5
Enter this keyword to upgrade only the mentioned stack-unit
File Management | 33
www.dell.com | support.dell.com
Defaults
all
Enter this keyword to upgrade all the member stack-units
booted
Enter this keyword to upgrade from the current image in the M I/O
Aggregator.
ftp
After entering this keyword you can either follow it with the location of the
source file in this form: //userid:password@hostip/filepath, or press
Enter to launch a prompt sequence.
tftp
After entering this keyword you can either follow it with the location of the
source file in this form: //hostlocation/filepath, or press Enter to launch a
prompt sequence.
flash
After entering this keyword you can either follow it with the location of the
source file in this form://filepath, or press Enter to launch a prompt
sequence.
usbflash
After entering this keyword you can either follow it with the location of the
source file in this form://filepath, or press Enter to launch a prompt
sequence..
A
Enter this keyword to upgrade the bootflash partition A
B
Enter this keyword to upgrade the bootflash partition B
none
Command Modes
EXEC Privilege
Command
History
Version 8.3.17.0
Usage
Information
Example
Supported on M I/O Aggregator
You must reload FTOS after executing this command.
Figure 4-12.
upgrade boot Command Example
FTOS#upgrade boot ?
all
bootflash-image
bootselector-image
FTOS#
Upgrade both boot flash image and selector image
Upgrade boot flash image
Upgrade boot selector image
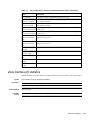
upgrade system
Upgrade the bootflash image or system image.
Syntax
Parameters
34
|
File Management
upgrade system {flash: | ftp: | scp: | tftp: | usbflash: | stack-unit {0-5 | all} {A: | B:}
0-5
Enter this keyword to upgrade only the mentioned stack-unit
all
Enter this keyword to upgrade all the member units of the stack
ftp
After entering this keyword you can either follow it with the location of the source file in this
form: //userid:password@hostip/filepath, or press Enter to launch a prompt sequence.
scp
After entering this keyword you can either follow it with the location of the source file in this
form: //userid:password@hostip/filepath, or press Enter to launch a prompt sequence.
tftp
After entering this keyword you can either follow it with the location of the source file in this
form: //hostlocation/filepath, or press Enter to launch a prompt sequence.
Defaults
flash
After entering this keyword you can either follow it with the location of the source file in this
form://filepath, or press Enter to launch a prompt sequence.
usbflash
After entering this keyword you can either follow it with the location of the source file in this
form://filepath, or press Enter to launch a prompt sequence..
A
Enter this keyword to upgrade the bootflash partition A
B
Enter this keyword to upgrade the bootflash partition B
none
Command Modes
EXEC Privilege
Command
History
Version 8.3.17.0
Usage
Information
Example
Supported on M I/O Aggregator
You must reload FTOS after executing this command. Use the command upgrade system stack-unit to
copy FTOS from the management unit to one or more stack members.
Figure 4-13.
upgrade system Command Example
FTOS#upgrade system ?
flash:
Copy from flash file system (flash://filepath)
ftp:
Copy from remote file system, IPv4 or IPv6, (ftp:/
/userid:password@hostip/filepath)
scp:
Copy from remote file system, IPv4 or IPv6, (scp:/
/userid:password@hostip/filepath)
stack-unit
Sync image to the stack-unit
tftp:
Copy from remote file system, IPv4 or IPv6, (tftp:/
/hostip/filepath)
usbflash:
Copy from usbflash file system (usbflash://
filepath)
FTOS#
File Management | 35
36
|
File Management
www.dell.com | support.dell.com
5
Control and Monitoring
This chapter describes control and monitoring for the M I/O Aggregator.
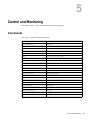
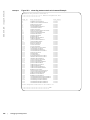
Commands
This chapter includes the following commands:
clear alarms
show debugging
clear command history
show diag
configure
show environment
debug cpu-traffic-stats
show inventory
debug ifm trace-flags
show memory
disable
show processes cpu
enable
show processes ipc flow-control
end
show processes memory
exit
show server-interfaces
ftp-server enable
show system
ftp-server topdir
show revision
ftp-server username
show tech-support
hostname
show uplink brief
ip telnet server enable
show util-threshold cpu
ip telnet source-interface
show util-threshold memory
line
ssh-peer-stack-unit
ping
telnet-peer-stack-unit
reload
terminal length
service timestamps
terminal xml
show alarms
terminal monitor
show command-history
traceroute
show configuration lock
undebug all
show cpu-traffic-stats
write
Control and Monitoring | 37
www.dell.com | support.dell.com
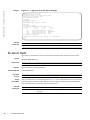
clear alarms
Clear the alarms on the system.
Syntax
clear alarms
Command Modes
EXEC Privilege
Command
History
Version 8.3.17.0
Usage
Information
Supported on M I/O Aggregator
This command clears alarms that are no longer active. If an alarm situation is still active, it is seen in
the system output.
clear command history
Clear the command history log.
Syntax
clear command history
Command Modes
EXEC Privilege
Command
History
Version 8.3.17.0
Related
Commands
Supported on M I/O Aggregator
show command-history
Displays a buffered log of all commands entered by all users along with a
time stamp.
configure
Enter the CONFIGURATION mode from EXEC Privilege mode.
Syntax
Parameters
configure [terminal]
terminal
(OPTIONAL) Enter the keyword terminal to specify that you are configuring from the
terminal.
Command Modes
EXEC Privilege
Command
History
Version 8.3.17.0
Example
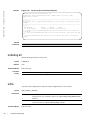
Figure 5-1.
configure Command Example
FTOS#configure
FTOS(conf)#
38
|
Control and Monitoring
Supported on M I/O Aggregator
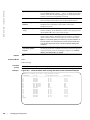
debug cpu-traffic-stats
Enable the collection of CPU traffic statistics.
Syntax
Defaults
debug cpu-traffic-stats
Disabled
Command Modes
EXEC Privilege
Command
History
Version 8.3.17.0
Usage
Information
Supported on M I/O Aggregator
This command enables (and disables) the collection of CPU traffic statistics from the time this
command is executed (not from system boot). However, excessive traffic received by a CPU
automatically triggers (turns on) the collection of CPU traffic statistics. Use the show configuration
lock to view the traffic statistics.
If excessive traffic is received by CPU, traffic is rate controlled
Note: This command must be enabled before the show configuration lock command displays
traffic statistics. Dell Force10 recommends disabling debugging (no debug
cpu-traffic-stats) after troubleshooting is complete.
Related
Commands
show configuration
lock
Displays the cpu traffic statistics
debug ifm trace-flags
Turn on the IFM internal trace-flags.
Syntax
debug ifm trace-flags trace-flags
Disable this command using the no debug ifm trace-flags command.
Parameters
Defaults
trace-flag
None
Command Modes
EXEC Privilege
Command
History
Version 8.3.17.0
Usage
Information
Enter a hexadecimal number representing the trace-flag.
Supported on M I/O Aggregator
Disable this command using the no debug ifm trace-flags command.
Note: Use this command only when you are working directly with a technical support
representative to troubleshoot a problem. Do not use this command unless a technical support
representative instructs you to do so.
Control and Monitoring | 39
www.dell.com | support.dell.com
disable
Return to EXEC mode.
Syntax
disable [level]
Parameters
Defaults
level
(OPTIONAL) Enter a number for a privilege level of the FTOS.
Range: 0 to 15.
Default: 1
1
Command Modes
EXEC Privilege
Command
History
Version 8.3.17.0
Supported on M I/O Aggregator
enable
Enter the EXEC Privilege mode or any other privilege level configured. After entering this command,
you may need to enter a password.
Syntax
Parameters
Defaults
Command Modes
Command
History
Usage
Information
Related
Commands
enable [level]
level
(OPTIONAL) Enter a number for a privilege level of FTOS.
Range: 0 to 15.
Default: 15
15
EXEC
Version 8.3.17.0
Supported on M I/O Aggregator
Users entering EXEC Privilege mode or any other configured privilege level can access configuration
commands. To protect against unauthorized access, use the enable password command to configure a
password for the enable command at a specific privilege level. If no privilege level is specified, the
default is privilege level 15.
enable password
Configures a password for the enable command and to access a privilege level.
end
Return to the EXEC Privilege mode from other command modes (for example, CONFIGURATION
mode).
Syntax
40
|
end
Control and Monitoring
Command Modes
•
•
•
•
•
Command
History
CONFIGURATION
LINE
INTERFACE
MONITOR SESSION
PROTOCOL LLDP
Version 8.3.17.0
Related
Commands
exit
Supported on M I/O Aggregator
Returns to the lower command mode.
exit
Return to the lower command mode.
Syntax
Command Modes
Command
History
Related
Commands
exit
•
•
•
•
•
EXEC Privilege
CONFIGURATION
LINE
INTERFACE
PROTOCOL LLDP
Version 8.3.17.0
end
Supported on M I/O Aggregator
Returns to EXEC Privilege command mode.
ftp-server enable
Enable the FTP server functions on the system.
Syntax
Defaults
Command Modes
Command
History
ftp-server enable
Disabled.
CONFIGURATION
Version 8.3.17.0
Supported on M I/O Aggregator
Control and Monitoring | 41
www.dell.com | support.dell.com
Example
Figure 5-2.
Logging on to an FTP Server Example
morpheus% ftp 10.31.1.111
Connected to 10.31.1.111.
220 Dell Force10 (1.0) FTP server ready
Name (10.31.1.111:dch): dch
331 Password required
Password:
230 User logged in
ftp> pwd
257 Current directory is "flash:"
ftp> dir
200 Port set okay
150 Opening ASCII mode data connection
size
date
time
name
------------------------512
Jul-20-2004 18:15:00
tgtimg
512
Jul-20-2004 18:15:00
diagnostic
512
Jul-20-2004 18:15:00
other
512
Jul-20-2004 18:15:00
tgt
226 Transfer complete
329 bytes received in 0.018 seconds (17.95 Kbytes/s)
ftp>
Related
Commands
ftp-server topdir
Sets the directory to be used for incoming FTP connections.
ftp-server username
Sets a username and password for incoming FTP connections.
ftp-server topdir
Specify the top-level directory to be accessed when an incoming FTP connection request is made.
Syntax
Parameters
Defaults
Command Modes
Command
History
Usage
Information
Related
Commands
42
|
ftp-server topdir directory
directory
Enter the directory path.
The internal flash is the default directory.
CONFIGURATION
Version 8.3.17.0
Supported on M I/O Aggregator
After you enable FTP server functions with the ftp-server enable command, Dell Force10 recommends
specifying a top-level directory path. Without a top-level directory path specified, the FTOS directs
users to the flash directory when they log in to the FTP server.
ftp-server enable
Enables FTP server functions on the M I/O Aggregator.
ftp-server username
Sets a username and password for incoming FTP connections to the M I/O
Aggregator.
Control and Monitoring
ftp-server username
Create a user name and associated password for incoming FTP server sessions.
Syntax
Parameters
ftp-server username username password [encryption-type] password
username
Enter a text string up to 40 characters long as the user name.
password password
Enter the keyword password followed by a string up to 40 characters long as
the password.
Without specifying an encryption type, the password is unencrypted.
encryption-type
(OPTIONAL) After the keyword password enter one of the following
numbers:
•
•
Defaults
Command Modes
Command
History
0 (zero) for an unecrypted (clear text) password
7 (seven) for hidden text password.
Not enabled.
CONFIGURATION
Version 8.3.17.0
Supported on M I/O Aggregator
hostname
Set the host name of the system.
Syntax
Parameters
Defaults
Command Modes
Command
History
hostname name
name
Enter a text string, up to 32 characters long.
FTOS
CONFIGURATION
Version 8.3.17.0
Supported on M I/O Aggregator
ip telnet server enable
Enable the Telnet server on the switch.
Syntax
ip telnet server enable
To disable the Telnet server, use the no ip telnet server enable command.
Defaults
Command Modes
Command
History
Enabled
CONFIGURATION
Version 8.3.17.0
Supported on M I/O Aggregator
Control and Monitoring | 43
www.dell.com | support.dell.com
ip telnet source-interface
Set an interface’s IP address as the source address in outgoing packets for Telnet sessions.
Syntax
Parameters
ip telnet source-interface interface
interface
Enter the following keywords and slot/port or number information:
•
•
Defaults
Command Modes
Command
History
Related
Commands
For a 10-Gigabit Ethernet interface, enter the keyword TenGigabitEthernet followed by
the slot/port information.
For VLAN interface, enter the keyword vlan followed by a number from 1 to 4094.
The IP address on the system that is closest to the Telnet address is used in the outgoing packets.
CONFIGURATION
Version 8.3.17.0
telnet
Supported on M I/O Aggregator
Telnets to another device.
line
Enable and configure console and virtual terminal lines to the system. This command accesses LINE
mode, where you can set the access conditions for the designated line.
Syntax
Parameters
Defaults
Command Modes
Command
History
Usage
Information
Related
Commands
44
|
line {console 0 | vty number [end-number]}
console 0
Enter the keyword console 0 to configure the console port.
The console option is <0-0>.
vty number
Enter the keyword vty followed by a number from 0 to 9 to configure a virtual terminal
line for Telnet sessions.
The system supports 10 Telnet sessions.
end-number
(OPTIONAL) Enter a number from 1 to 9 as the last virtual terminal line to configure.
You can configure multiple lines at one time.
Not configured
CONFIGURATION
Version 8.3.17.0
Supported on M I/O Aggregator
You cannot delete a terminal connection.
show memory
Control and Monitoring
View current memory usage on the M I/O Aggregator..
ping
Test connectivity between the system and another device by sending echo requests and waiting for
replies.
Syntax
Parameter
ping [host | ip-address] [count {number | continuous}] [datagram-size] [timeout] [source (ip
src-ipv4-address) | interface] [tos] [df-bit (y|n)] [validate-reply(y|n)] [pattern pattern]
[sweep-min-size] [sweep-max-size] [sweep-interval] [ointerface (ip src-ipv4-address) | interface]
host
(OPTIONAL) Enter the host name of the devices to which you are testing
connectivity.
ip-address
(OPTIONAL) Enter the IPv4 address of the device to which you are testing
connectivity. The address must be in the dotted decimal format.
count
Enter the number of echo packets to be sent.
number: 1- 2147483647
Continuous: transmit echo request continuously
Default: 5
datagram size
Enter the ICMP datagram size.
Range: 36 - 15360 bytes
Default: 100
timeout
Enter the interval to wait for an echo reply before timing out.
Range: 0 -3600 seconds
Default: 2 seconds
source
Enter the IPv4 source ip address or the source interface.
•
•
•
Enter the IP address in A.B.C.D format
For a 10-Gigabit Ethernet interface, enter the keyword TenGigabitEthernet
followed by the slot/port information.
For a VLAN interface, enter the keyword vlan followed by a number from 1 to
4094.
tos
Enter the type of service required.
Range: 0-255
Default: 0
df-bit
Enter Y or N for the don't fragment bit in IPv4 header
• N: Do not set the don't fragment bit
• Y: Do set don't fragment bit
Default is No.
validate-reply
Enter Y or N for reply validation.
• N: Do not validate reply data
• Y: Do validate reply data
Default is No.
pattern pattern
Enter the IPv4 data pattern.
Range: 0-FFFF
Default: 0xABCD
sweep-min-size
Enter the minimum size of datagram in sweep range.
Range: 52-15359 bytes
sweep-max-size
Enter the maximum size of datagram in sweep range.
Range: 53-15359 bytes
Control and Monitoring | 45
www.dell.com | support.dell.com
sweep-interval
Enter the incremental value for sweep size.
1-15308 seconds
ointerface
Enter the outgoing interface for multicast packets.
•
•
•
Defaults
Command Modes
Enter the IP address in A.B.C.D format
For a 10-Gigabit Ethernet interface, enter the keyword TenGigabitEthernet
followed by the slot/port information.
For a VLAN interface, enter the keyword vlan followed by a number from 1 to
4094.
See parameters above.
EXEC
EXEC Privilege
Command
History
Usage
Information
Version 8.3.17.0
Supported on M I/O Aggregator
When you enter the ping command without specifying an IP address (Extended Ping), you are
prompted for a target IP address, a repeat count, a datagram size (up to 1500 bytes), a timeout in
seconds, and for Extended Commands. For information on the ICMP message codes that return from a
ping command, refer to Chapter 26, Internet Control Message Protocol (ICMP) Message Types.
Figure 5-3.
ping (IPv4) Command Example
FTOS#ping 172.31.1.255
Type Ctrl-C to abort.
Sending 5, 100-byte ICMP Echos to 172.31.1.255, timeout is 2 seconds:
Reply to request 1 from 172.31.1.208
0 ms
Reply to request 1 from 172.31.1.216
0 ms
Reply to request 1 from 172.31.1.205
16 ms
:
:
Reply to request 5 from 172.31.1.209
0 ms
Reply to request 5 from 172.31.1.66
0 ms
Reply to request 5 from 172.31.1.87
0 ms
FTOS#
reload
Reboot FTOS.
Syntax
46
reload
Command Modes
EXEC Privilege
Command
History
Version 8.3.17.0
|
Supported on M I/O Aggregator
Usage
Information
If there is a change in the configuration, FTOS prompts you to save the new configuration. Or you can
save your running configuration with the copy running-config command.
Related
Commands
s
reset stack-unit
Control and Monitoring
Resets any designated stack member except the management unit.
service timestamps
Add time stamps to debug and log messages. This command adds either the uptime or the current time
and date.
Syntax
Parameters
Defaults
Command Modes
Command
History
Usage
Information
service timestamps [debug | log] [datetime [localtime] [msec] [show-timezone] | uptime]
debug
(OPTIONAL) Enter the keyword debug to add timestamps to debug messages.
log
(OPTIONAL) Enter the keyword log to add timestamps to log messages with
severity 0 to 6.
datetime
(OPTIONAL) Enter the keyword datetime to have the current time and date added
to the message.
localtime
(OPTIONAL) Enter the keyword localtime to include the localtime in the
timestamp.
msec
(OPTIONAL) Enter the keyword msec to include milliseconds in the timestamp.
show-timezone
(OPTIONAL) Enter the keyword show-timezone to include the time zone
information in the timestamp.
uptime
(OPTIONAL) Enter the keyword uptime to have the timestamp based on time
elapsed since system reboot.
Not configured.
CONFIGURATION
Version 8.3.17.0
Supported on M I/O Aggregator
If you do not specify parameters and enter service timestamps, it appears as service timestamps
debug uptime in the running-configuration.
Use the show running-config command to view the current options set for the service timestamps
command.
show alarms
Displays the active major and minor alarms on the system.
Syntax
Command Modes
show alarms
EXEC
EXEC Privilege
Command
History
Version 8.3.17.0
Supported on M I/O Aggregator
Control and Monitoring | 47
www.dell.com | support.dell.com
Example
Figure 5-4.
show alarms Command Example
FTOS# show alarms
-- Minor Alarms -Alarm Type
Duration
--------------------------------------------------------------------------No minor alarms
-- Major Alarms -Alarm Type
Duration
--------------------------------------------------------------------------No major alarms
FTOS#
show command-history
Displays a buffered log of all commands entered by all users along with a time stamp.
Syntax
show command-history
Defaults
None.
Command Mode
EXEC
EXEC Privilege
Command
History
Usage
Information
48
|
Version 8.3.17.0
Supported on M I/O Aggregator
One trace log message is generated for each command. No password information is saved to this file.
Control and Monitoring
Example
Figure 5-5.
show command-history Command Example
FTOS#show command-history
[7/19 10:37:51]: CMD-(CLI):[enable]by default from console
[7/19 10:37:54]: CMD-(CLI):[show running-config snmp]by default from console
[7/19 14:44:39]: CMD-(CLI):[enable]by default from console
[7/19 14:44:40]: CMD-(CLI):[configure terminal]by default from console
- Repeated 1 time.
[7/19 14:44:41]: CMD-(CLI):[snmp-server community public ro]by default from
console
[7/19 14:44:41]: CMD-(CLI):[logging 172.16.1.162]by default from console
[7/19 14:44:41]: CMD-(CLI):[logging 10.10.10.4]by default from console
[7/19 14:44:41]: CMD-(CLI):[logging 10.1.2.4]by default from console
[7/19 14:44:42]: CMD-(CLI):[logging 172.31.1.4]by default from console
[7/19 14:44:42]: CMD-(CLI):[logging 133.33.33.4]by default from console
[7/19 14:44:42]: CMD-(CLI):[management route 172.16.1.0 /24 10.11.209.4]by default
from console
[7/19 14:44:43]: CMD-(CLI):[service timestamps log datetime]by default from
console
[7/19 14:44:43]: CMD-(CLI):[line console 0]by default from console
[7/19 14:44:43]: CMD-(CLI):[exec-timeout 0]by default from console
[7/19 14:44:44]: CMD-(CLI):[exit]by default from console
[7/19 14:45:35]: CMD-(CLI):[configure]by default from console
- Repeated 1 time.
[7/19 14:45:43]: CMD-(CLI):[protocol lldp]by default from console
[7/19 14:54:19]: CMD-(CLI):[exit]by default from console
[7/19 14:54:29]: CMD-(CLI):[show version]by default from console
[7/19 14:54:36]: CMD-(CLI):[configure]by default from console
- Repeated 1 time.
[7/19 14:54:42]: CMD-(CLI):[protocol lldp]by default from console
[7/19 14:55:24]: CMD-(CLI):[exit]by default from console
[7/19 15:1:57]: CMD-(CLI):[interface tengigabitethernet 1/1]by default from
console
[7/19 15:4:7]: CMD-(CLI):[exit]by default from console
[7/19 15:8:12]: CMD-(CLI):[interface vlan 2]by default from console
[7/19 15:8:28]: CMD-(CLI):[interface managementethernet 0/0]by default from
console
--More-FTOS#
Related
Commands
Clears the command history log.
clear command history
show configuration lock
Displays the configuration lock status.
Syntax
Defaults
show configuration lock
None
Command Modes
EXEC Privilege
Command
History
Version 8.3.17.0
Supported on M I/O Aggregator
Control and Monitoring | 49
www.dell.com | support.dell.com
Example
Figure 5-6.
show configuration lock Command Output
FTOS# show configuration lock
Configure exclusively locked by the following line:
Line
Line number
User
Type
State
Ip address
Usage
Information
:
:
:
:
:
:
vty 0
2
admin
AUTO
LOCKED
10.11.9.97
The type may be auto, manual, or rollback. When set to auto, FTOS automatically denies access to
CONFIGURATION mode to all other users every time the user on the listed VTY line enters
CONFIGURATION mode. When set to manual, the user on the listed VTY line must explicitly set the
lock each time before entering CONFIGURATION mode. Rollback indicates that FTOS is in a
rollback process. The line number shown in the output can be used to send the messages to that session
or release a lock on a VTY line.
show cpu-traffic-stats
Displays the CPU traffic statistics.
Syntax
Parameters
Defaults
Command Modes
Command
History
Example
show cpu-traffic-stats [port number | all]
port number
(OPTIONAL) Enter the port number to display traffic statistics on that port only.
Range: 1 to 1568
all
(OPTIONAL) Enter the keyword all to display traffic statistics on all the interfaces
receiving traffic, sorted based on traffic.
all
EXEC
Version 8.3.17.0
Figure 5-7.
Supported on M I/O Aggregator
show cpu-traffic-stats Command Example
FTOS#show cpu-traffic-stats
Processor : CP
-------------Received 100% traffic on TenGigabitEthernet 8/2
LLC:0, SNAP:0, IP:100, ARP:0, other:0
Unicast:100, Multicast:0, Broadcast:0
Total packets:100
FTOS#
Usage
Information
Traffic statistics are sorted on a per-interface basis; the interface receiving the most traffic is displayed
first. All CPU and port information is displayed unless a specific port or CPU is specified. Traffic
information is displayed for router ports only; not for management interfaces. The traffic statistics are
collected only after the debug cpu-traffic-stats command is executed; not from the system bootup.
Note: After debugging is complete, use the no debug cpu-traffic-stats command to shut off
traffic statistics collection.
50
|
Control and Monitoring
Related
Commands
debug cpu-traffic-stats
Enables CPU traffic statistics for debugging.
show debugging
Displays a list of all enabled debugging processes.
Syntax
show debugging
Command Mode
EXEC Privilege
Command
History
Version 8.3.17.0
Example
Figure 5-8.
Supported on M I/O Aggregator
show debugging Command Example
FTOS#show debug
Generic IP: (Access List: test)
IP packet debugging is on for (Access List: test)
TenGigabitEthernet 0/16
ICMP packet debugging is on for
TenGigabitEthernet 0/16
OSPF:1
OSPF packet debugging is on
DHCP:
DHCP debugging is on
FTOS#
show diag
Displays the diagnostics information.
Syntax
Parameters
Defaults
Command Modes
show diag {information | stack-unit number [detail | summary]] | testcase}
information
Enter the keyword information to view current diagnostics information
in the system.
stack-unit unit-id
(OPTIONAL) Enter the keyword stack-unit followed by the unit-id to display
information on a specific stack member. Range: 0 to 5.
detail
(OPTIONAL) Enter the keyword detail to view detailed diagnostics
information.
summary
(OPTIONAL) Enter the keyword summary to view a summary of the
diagnostics information.
testcase
Enter the keyword testcase to view current diagnostics testcases available
in the system.
Summary
EXEC Privilege
Control and Monitoring | 51
www.dell.com | support.dell.com
Command
History
Version 8.3.17.0
Supported on M I/O Aggregator
show environment
Displays the system component status (for example, temperature, voltage).
Syntax
Parameters
Command Modes
show environment [all | stack-unit unit-id]
all
(OPTIONAL) Enter the keyword all to view all components.
stack-unit unit-id
(OPTIONAL) Enter the keyword stack-unit followed by the unit-id to display
information on a specific stack member. Range: 0 to 5.
thermal sensor
(OPTIONAL) Enter the keyword thermal-sensor to view all components.
EXEC
EXEC Privilege
Command
History
Example
Version 8.3.17.0
Figure 5-9.
Supported on M I/O Aggregator
show environment all Command Example
FTOS#show environment all
-- Unit Environment Status -Unit Status
Temp
Voltage
TempStatus
--------------------------------------------------------------------------* 1
online
66C
ok
2
* Management Unit
-- Thermal Sensor Readings (deg C) -Unit Sensor0 Sensor1 Sensor2 Sensor3 Sensor4 Sensor5 Sensor6 Sensor7
Sensor8 Sensor9
----------------------------------------------------------------------------------------------1
51
51
63
61
61
61
67
61
64
66
FTOS#
Example
Figure 5-10.
show environment stack-unit Command Example
FTOS#show environment stack-unit
-- Unit Environment Status -Unit Status
Temp
Voltage
TempStatus
--------------------------------------------------------------------------* 1
online
66C
ok
2
* Management Unit
FTOS#
52
|
Control and Monitoring
Example
Figure 5-11. show environment thermal-sensor Command Example
FTOS#show environment thermal-sensor
-- Thermal Sensor Readings (deg C) -Unit Sensor0 Sensor1 Sensor2 Sensor3 Sensor4 Sensor5 Sensor6 Sensor7
Sensor8 Sensor9
----------------------------------------------------------------------------------------------1
51
51
64
61
61
61
67
61
64
66
FTOS#
show inventory
Displays the switch type, components (including media), FTOS version including hardware
identification numbers and configured protocols.
Syntax
Parameters
Defaults
Command Modes
Command
History
Usage
show inventory {[media slot] | [optional-module]}
media slot
(OPTIONAL) Enter the keyword media followed by the stack ID of the stack member
for which you want to display pluggable media inventory.
optional-module
(OPTIONAL) Enter the keyword optional-module to display optional module
information.
none
EXEC
Version 8.3.17.0
Supported on M I/O Aggregator
If there are no fibre ports in the unit, only the header under show inventory media is displayed. If
there are fibre ports but no optics inserted, the output displays the message “Media not present or
accessible.”
Control and Monitoring | 53
www.dell.com | support.dell.com
Example 1
Figure 5-12.
show inventory for M I/O Aggregator Command Example
FTOS#show inventory
System Type
System Mode
Software Version
: I/O-Aggregator
: 1.0
: E8-3-17-38
Unit Type
Serial Number Part Number Rev Piece Part ID
Rev Svc Tag Exprs Svc Code
------------------------------------------------------------------------------------------------------------* 1 I/O-Aggregator
00000000000000 NVH81X01
01
00-NVH81X-00000-000-0000
01
N/A
N/A
* - Management Unit
Software Protocol Configured
-------------------------------------------------------------DCBX
Fip Snooping
IGMP
iSCSI
LLDP
SNMP
FTOS#
Example 2
Figure 5-13.
show inventory media Command Example
FTOS#show inventory media
Slot Port Type Media
Serial Number F10Qualifie
d
-----------------------------------------------------------------------------1
33
Media not present or accessible
1
34
Media not present or accessible
1
35
Media not present or accessible
1
36
Media not present or accessible
1
37
QSFP
40GBASE-CR4-1M
APF11380018VDU
Yes
1
38
QSFP
40GBASE-CR4-1M
APF11380018VDU
Yes
1
39
QSFP
40GBASE-CR4-1M
APF11380018VDU
Yes
1
40
QSFP
40GBASE-CR4-1M
APF11380018VDU
Yes
1
41
Media not present or accessible
1
42
SFP
1000BASE-SX
P741L1X
Yes
1
43
SFP
100BASE-FX
PCK17RH
Yes
1
44
SFP
1000BASE-SX
PLP37JE
Yes
1
49
QSFP
40GBASE-CR4-1M
APF11380018VJ6
Yes
1
50
QSFP
40GBASE-CR4-1M
APF11380018VJ6
Yes
1
51
QSFP
40GBASE-CR4-1M
APF11380018VJ6
Yes
1
52
QSFP
40GBASE-CR4-1M
APF11380018VJ6
Yes
1
53
QSFP
40GBASE-CR4-1M
APF11380018VMP
Yes
1
54
QSFP
40GBASE-CR4-1M
APF11380018VMP
Yes
1
55
QSFP
40GBASE-CR4-1M
APF11380018VMP
Yes
1
56
QSFP
40GBASE-CR4-1M
APF11380018VMP
Yes
FTOS#
Example 3
Figure 5-14.
show inventory media Command Example
FTOS#show inventory optional-module
Unit Slot
Expected
Inserted
Next Boot
Status/Power(On/Off)
-----------------------------------------------------------------------1
0
SFP+
SFP+
AUTO
Good/On
1
1
QSFP+
QSFP+
AUTO
Good/On
* - Mismatch
FTOS#
54
|
Control and Monitoring
Related
Commands
show config (from
INTERFACE VLAN
mode)
Displays information on a specific physical interface or virtual interface.
show memory
Displays current memory usage on the M I/O Aggregator.
Syntax
Parameters
Command Modes
show memory [stack-unit 0-5]
stack-unit 0-5
(OPTIONAL) Enter the keyword stack-unit followed by the stack unit ID of the
stack member to display memory information on the designated stack member.
EXEC
EXEC Privilege
Command
History
Usage
Information
Example
Version 8.3.17.0
Supported on M I/O Aggregator
The output for the show memory command displays the memory usage of LP part (sysdlp) of the
system. The Sysdlp is an aggregate task that handles all the tasks running on the CPU.
Figure 5-15.
show memory Command Example
FTOS#show memory stack-unit 0
Statistics On Unit 0 Processor
===========================
Total(b)
Used(b)
Free(b)
268435456
4010354
264425102
Lowest(b)
264375410
Largest(b)
264425102
show processes cpu
Displays CPU usage information based on running processes.
Syntax
show processes cpu [management-unit 1-99 [details] | stack-unit 0-5 | summary | ipc | memory
[stack-unit 0-5]]
Parameters
management-unit 1-99
[details]
(OPTIONAL) Displays processes running in the control processor. The
1-99 variable sets the number of tasks to be displayed in order of the
highest CPU usage in the past five (5) seconds. Add the details keyword to
display all running processes (except sysdlp). See Example 3.
stack-unit 0-5
(OPTIONAL) Enter the keyword stack-unit followed by the stack
member ID (Range 0 to 5).
As an option of show processes cpu, this option displays CPU usage
for the designated stack member. See Example 2.
Or, as an option of memory, this option limits the output of memory
statistics to the designated stack member. See Example 5.
summary
(OPTIONAL) Enter the keyword summary to view a summary view of
CPU usage for all members of the stack. See Example 1.
Control and Monitoring | 55
www.dell.com | support.dell.com
Command Modes
ipc
(OPTIONAL) Enter the keyword ipc to display inter-process
communication statistics.
memory
(OPTIONAL) Enter the keyword memory to display memory statistics.
See Example 4.
EXEC
EXEC Privilege
Command
History
Example 1
Version 8.3.17.0
Figure 5-16.
Supported on M I/O Aggregator
show processes cpu summary Command Example
FTOS#show processes cpu summary
CPU utilization
5Sec
1Min
5Min
------------------------------------------UNIT1
4%
3%
2%
FTOS#
Example 2
Figure 5-17.
show processes cpu management-unit Command Example
FTOS#show processes cpu management-unit 5
CPU utilization for five seconds: 4%/0%; one minute: 4%; five minutes: 4%
PID
Runtime(ms)
Invoked
uSecs
5Sec
1Min
5Min TTY Process
0x00000000
2120
212
10000
3.77%
3.77%
3.77%
0
system
0x00000112
2472940
247294
10000
0.79%
0.61%
0.65%
0
sysdlp
0x000000e4
495560
49556
10000
0.20%
0.25%
0.24% 0
sysd
0x0000013d
34310
3431
10000
0.00% 0.02%
0.00% 0
lacp
0x00000121
4190
419
10000
0.00%
0.02% 0.00%
0
iscsiOpt
FTOS#
56
|
Control and Monitoring
Example 3
Figure 5-18.
show processes cpu stack-unit Command Example
FTOS#show process cpu stack-unit 1
PID
Runtime(ms) Invoked
uSecs
5Sec
1Min
5Min
0x763a3000 17981680
1798168
10000
3.00% 2.67% 2.67%
0x762ba000 0
0
0
0.00% 0.00% 0.00%
0x762d9000 0
0
0
0.00% 0.00% 0.00%
0x762f8000 214590
21459
10000
0.00% 0.00% 0.00%
0x76319000 7890
789
10000 0.00% 0.00% 0.00%
0x76344000 155770
15577
10000 0.00% 0.00% 0.02%
0x76363000 583230
58323
10000 0.00% 0.00% 0.02%
0x76381000 658850
65885
10000 0.00% 0.17% 0.08%
0x76299000 80110
8011
10000 0.00% 0.00% 0.00%
0x763c3000 0
0
0
0.00%
0.00% 0.00%
--More--
TTY Process
0
KP
0 debugagt
0 F10StkMgr
0 lcMgr
0 dla
0 sysAdmTsk
0 timerMgr
0 PM
0 diagagt
0 evagt
Control and Monitoring | 57
www.dell.com | support.dell.com
Example 4
Figure 5-19.
show processes memory Command Example
FTOS#show process memory
Memory Statistics Of Stack Unit 1 (bytes)
===========================================================
Total: 2147483648, MaxUsed:
499019776, CurrentUsed: 499019776, CurrentFree:
1648463872
TaskName
TotalAllocated
TotalFreed
MaxHeld
CurrentHolding
f10appioserv
225280
0
0
192512
fcoecntrl
270336
0
0
9277440
f10appioserv
225280
0
0
192512
iscsiOpt
114688
0
0
7380992
dhclient
552960
0
0
1626112
f10appioserv
225280
0
0
192512
ndpm
618496
0
0
7389184
f10appioserv
225280
0
0
192512
vrrp
335872
0
0
7712768
f10appioserv
225280
0
0
192512
frrp
180224
0
0
7192576
f10appioserv
225280
0
0
192512
xstp
2740224
0
0
9445376
f10appioserv
225280
0
0
192512
pim
1007616
0
0
7585792
f10appioserv
225280
0
0
192512
igmp
417792
0
0
14774272
f10appioserv
225280
0
0
192512
mrtm
5496832
0
0
12636160
f10appioserv
225280
0
0
192512
l2mgr
1040384
0
0
42471424
f10appioserv
225280
0
0
192512
l2pm
176128
0
0
24166400
f10appioserv
225280
0
0
192512
arpm
192512
0
0
6955008
f10appioserv
225280
0
0
192512
otm
184320
0
0
7127040
--More-FTOS#
Example 5
Figure 5-20.
show processes memory stack-unit Command Example
FTOS#show process memory stack-unit 1
Total: 2147483648, MaxUsed:
499040256, CurrentUsed:
1648443392
TaskName
TotalAllocated
TotalFreed
f10appioserv
225280
0
fcoecntrl
270336
0
f10appioserv
225280
0
iscsiOpt
114688
0
dhclient
552960
0
f10appioserv
225280
0
ndpm
618496
0
f10appioserv
225280
0
vrrp
335872
0
f10appioserv
225280
0
frrp
180224
0
f10appioserv
225280
0
xstp
2740224
0
f10appioserv
225280
0
pim
1007616
0
f10appioserv
225280
0
igmp
417792
0
f10appioserv
225280
0
mrtm
5496832
0
--More-FTOS#
Related
Commands
58
|
499040256, CurrentFree:
MaxHeld
0
0
0
0
0
0
0
0
0
0
0
0
0
0
0
0
0
0
0
CurrentHolding
192512
9277440
192512
7380992
1626112
192512
7389184
192512
7712768
192512
7192576
192512
9445376
192512
7585792
192512
14774272
192512
12636160
show diag
Displays the data plane or management plane input and output statistics of the
designated component of the designated stack member.
show hardware
system-flow
Displays Layer 3 ACL or QoS data for the selected stack member and stack
member port-pipe.
Control and Monitoring
show interfaces
stack-unit
Displays information on all interfaces on a specific stack member.
show processes
memory
Displays CPU usage information based on running processes
show processes ipc flow-control
Displays the Single window protocol queue (SWPQ) statistics.
Syntax
Parameters
Defaults
Command Modes
show processes ipc flow-control [cp]
cp
(OPTIONAL) Enter the keyword cp to view the Control Processor’s SWPQ
statistics.
none
EXEC
EXEC Privilege
Command
History
Example 1
Version 8.3.17.0
Figure 5-21.
Supported on M I/O Aggregator
show processes ipc flow-control Command Example
FTOS#show process ipc flow-control
Q Statistics on CP Processor
TxProcess
RxProcess
ACL0
ACL0
ACL0
ACL0
LACP0
STP0
L2PM0
FRRP0
DHCP0
DHCP0
DHCP0
SMUX0
SMUX0
--More-FTOS#
RTM0
DIFFSERV0
IGMP0
PIM0
IFMGR0
L2PM0
STP0
L2PM0
ACL0
IPMGR0
IFMGR0
IFMGR0
LACP0
Cur
Len
0
0
0
0
0
0
0
0
0
0
0
0
0
High
Mark
0
0
0
0
24
0
1
0
0
0
0
38
1
Time
Out
0
0
0
0
0
0
0
0
0
0
0
0
0
Retr
ies
0
0
0
0
0
0
0
0
0
0
0
0
0
Msg
Sent
0
0
0
0
34
0
2
0
0
0
0
47
3
Ack Aval
Max
Rcvd Retra Retra
0
10
10
0
10
10
0
10
10
0
10
10
34
25
25
0
25
25
2
25
25
0
25
25
0
25
25
0
25
25
0
25
25
47
60
60
3
60
60
Table 5-1 lists the definitions of the fields shown in Figure 5-21.
Table 5-1.
Description of the show processes ipc flow-control cp output Command
Field
Description
Source QID /Tx Process
Source Service Identifier
Destination QID/Rx Process
Destination Service Identifier
Cur Len
Current number of messages enqueued
Control and Monitoring | 59
www.dell.com | support.dell.com
Table 5-1.
Usage
Information
Description of the show processes ipc flow-control cp output Command
Field
Description
High Mark
Highest number of packets in the queue at any point of time
#of to / Timeout
Timeout count
#of Retr /Retries
Number of retransmissions
#msg Sent/Msg Sent/
Number of messages sent
#msg Ackd/Ack Rcvd
Number of messages acknowledged
Retr /Available Retra
Number of retries left
Total/ Max Retra
Number of retries allowed
The Single window protocol (SWP) provides flow control-based reliable communication between the
sending and receiving software tasks.
Important Points to Remember
•
A sending task enqueues messages into the SWP queue3 for a receiving task and waits for an
acknowledgement.
If no response is received within a defined period of time, the SWP timeout mechanism resubmits
the message at the head of the FIFO queue.
After retrying a defined number of times, the following timeout message is generated:
•
•
SWP-2-NOMORETIMEOUT
•
In the display output in Figure 5-21, a retry (Retries) value of zero indicates that the SWP
mechanism reached the maximum number of retransmissions without an acknowledgement.
show processes memory
Displays memory usage information based on processes running in the system.
Syntax
Parameters
Command Modes
show processes memory {management-unit | stack unit {0–5 | all | summary}}
management-unit
Enter the keyword management-unit for CPU memory usage of the stack
management unit.
stack unit 0–5
Enter the keyword stack unit followed by a stack unit ID of the member unit for
which to display memory usage on the forwarding processor.
all
Enter the keyword all for detailed memory usage on all stack members.
summary
Enter the keyword summary for a brief summary of memory availability and
usage on all stack members.
EXEC
EXEC Privilege
Command
History
60
|
Version 8.3.17.0
Control and Monitoring
Supported on M I/O Aggregator
Usage
Information
The output for the show process memory command displays the memory usage statistics running on
CP part (sysd) of the system. The Sysd is an aggregate task that handles all the tasks running on M I/O
Aggregator’s CP.
The output of show memory and this command will differ based on which FTOS processes are
counted.
•
•
Example
In the show memory display output, the memory size is equal to the size of the application
processes.
In the output of this command, the memory size is equal to the size of the application processes
plus the size of the system processes.
Figure 5-22.
show processes memory Command Example
FTOS#show process memory stack-unit 1
Total: 2147483648, MaxUsed:
499040256, CurrentUsed:
1648443392
TaskName
TotalAllocated
TotalFreed
f10appioserv
225280
0
fcoecntrl
270336
0
f10appioserv
225280
0
iscsiOpt
114688
0
dhclient
552960
0
f10appioserv
225280
0
ndpm
618496
0
f10appioserv
225280
0
vrrp
335872
0
f10appioserv
225280
0
frrp
180224
0
f10appioserv
225280
0
xstp
2740224
0
f10appioserv
225280
0
pim
1007616
0
f10appioserv
225280
0
igmp
417792
0
f10appioserv
225280
0
mrtm
5496832
0
--More--
Example
Figure 5-23.
499040256, CurrentFree:
MaxHeld
0
0
0
0
0
0
0
0
0
0
0
0
0
0
0
0
0
0
0
CurrentHolding
192512
9277440
192512
7380992
1626112
192512
7389184
192512
7712768
192512
7192576
192512
9445376
192512
7585792
192512
14774272
192512
12636160
show processes memory management-unit Command Example
FTOS#show processes memory management-unit
Total
: 2147483648, MaxUsed
:
499093504 [07/23/2012 17:42:16]
CurrentUsed:
499093504, CurrentFree: 1648390144
SharedUsed :
18470440, SharedFree :
2501104
PID
Process
Current
633 fcoecntrl
1248016
289 iscsiOpt
6698
476 dhclient
0
521 ndpm
4848
160 vrrp
880
318 frrp
4830
218 xstp
21858
277 pim
62168
--More--
ResSize
Size
Allocs
Frees
Max
9277440
270336
1380528
132512
1281144
7380992
114688
23262
1626112
552960
7389184
618496
4848
7712768
335872
880
7192576
180224
71086
9445376
2740224
21858
0
21858
7585792
1007616
62168
0
62168
0
16564
23262
0
0
0
0
4848
880
66256
21394
Control and Monitoring | 61
www.dell.com | support.dell.com
Table 5-2 defines the fields that appear in the show processes memory output.
Table 5-2.
Descriptions of show processes memory output
Field
Description
Total:
Total system memory available
MaxUsed:
Total maximum memory used ever (history indicated with time stamp)
CurrentUsed:
Total memory currently in use
CurrentFree:
Total system memory available
SharedUsed:
Total used shared memory
SharedFree:
Total free shared memory
PID
Process ID
Process
Process Name
ResSize
Actual resident size of the process in memory
Size
Process test, stack, and data size
Allocs
Total dynamic memory allocated
Frees
Total dynamic memory freed
Max
Maximum dynamic memory allocated
Current
Current dynamic memory in use
show server-interfaces
Displays server port information.
Syntax
62
show server-interfaces {brief | detail}
Command Modes
EXEC Privilege
Command
History
Version 8.3.17.0
|
.:
Control and Monitoring
Supported on M I/O Aggregator
Example
Figure 5-24.
show server-interfaces brief Command Example
FTOS#show server-interfaces brief
---------------- show server ports brief --------------------Interface
TenGigabitEthernet
TenGigabitEthernet
TenGigabitEthernet
TenGigabitEthernet
TenGigabitEthernet
TenGigabitEthernet
TenGigabitEthernet
TenGigabitEthernet
TenGigabitEthernet
TenGigabitEthernet
TenGigabitEthernet
TenGigabitEthernet
TenGigabitEthernet
TenGigabitEthernet
TenGigabitEthernet
TenGigabitEthernet
--More-FTOS#
Example
Figure 5-25.
1/1
1/2
1/3
1/4
1/5
1/6
1/7
1/8
1/9
1/10
1/11
1/12
1/13
1/14
1/15
1/16
OK
NO
NO
NO
NO
YES
NO
NO
NO
NO
NO
NO
NO
YES
NO
NO
YES
Status
up
up
up
up
up
up
up
up
up
up
up
up
up
up
up
up
Protocol
down
down
down
down
up
down
down
down
down
down
down
down
up
down
down
up
Description
show server-interfaces detail Command Example
FTOS#show server-interfaces detail
---------------- show server ports detail --------------------TenGigabitEthernet 0/1 is up, line protocol is down(error-disabled[UFD])
Hardware is DellForce10Eth, address is 00:1e:c9:f1:00:99
Current address is 00:1e:c9:f1:00:99
Server Port AdminState is N/A
Pluggable media not present
Interface index is 34149121
Internet address is not set
Mode of IP Address Assignment : NONE
DHCP Client-ID :tenG130001ec9f10099
MTU 12000 bytes, IP MTU 11982 bytes
LineSpeed auto
Flowcontrol rx on tx off
ARP type: ARPA, ARP Timeout 04:00:00
Last clearing of "show interface" counters 00:59:19
Queueing strategy: fifo
Input Statistics:
0 packets, 0 bytes
0 64-byte pkts, 0 over 64-byte pkts, 0 over 127-byte pkts
0 over 255-byte pkts, 0 over 511-byte pkts, 0 over 1023-byte pkts
0 Multicasts, 0 Broadcasts
0 runts, 0 giants, 0 throttles
0 CRC, 0 overrun, 0 discarded
Output Statistics:
0 packets, 0 bytes, 0 underruns
0 64-byte pkts, 0 over 64-byte pkts, 0 over 127-byte pkts
0 over 255-byte pkts, 0 over 511-byte pkts, 0 over 1023-byte pkts
0 Multicasts, 0 Broadcasts, 0 Unicasts
0 throttles, 0 discarded, 0 collisions, 0 wreddrops
Rate info (interval 299 seconds):
Input 00.00 Mbits/sec,
0 packets/sec, 0.00% of line-rate
Output 00.00 Mbits/sec,
0 packets/sec, 0.00% of line-rate
Time since last interface status change: 00:58:08
TenGigabitEthernet 0/2 is up, line protocol is down(error-disabled[UFD])
Hardware is DellForce10Eth, address is 00:1e:c9:f1:00:99
Current address is 00:1e:c9:f1:00:99
Server Port AdminState is N/A
Pluggable media not present
Interface index is 34411265
Internet address is not set
Mode of IP Address Assignment : NONE
DHCP Client-ID :tenG131001ec9f10099
--More--
Control and Monitoring | 63
www.dell.com | support.dell.com
show system
Displays the current status of all stack members or a specific stack member.
Syntax
Parameters
Command Modes
show system [brief | stack-unit unit-id]
brief
(OPTIONAL) Enter the keyword brief to view an abbreviated list of system
information.
stack-unit unit-id
(OPTIONAL) Enter the keyword stack-unit followed by the stack member
ID for information on that stack member. Range: 0 to 5.
EXEC
EXEC Privilege
Command
History
Usage
Example
Version 8.3.17.0
Supported on M I/O Aggregator
Figure 5-26 shows the output from the show system brief command.
Figure 5-27 shows the output from the show system stack-unit command.
Figure 5-26.
show system brief Command Example
FTOS#show system brief
Stack MAC : 00:01:e8:00:ab:03
-- Stack Info -Unit UnitType
Status
ReqTyp
CurTyp
Version
Ports
----------------------------------------------------------------------------------0
Member
not present
1
Management
online
I/O-Aggregator I/O-Aggregator 8-3-17-38
56
2
Member
not present
3
Member
not present
4
Member
not present
5
Member
not present
FTOS#
64
|
Control and Monitoring
Example
Figure 5-27.
show system stack-unit Command Example
FTOS#show system stack-unit 1
-- Unit 1 -Unit Type
:
Status
:
Next Boot
:
Required Type
:
Current Type
:
Master priority :
Hardware Rev
:
Num Ports
:
Up Time
:
FTOS Version
:
Jumbo Capable
:
POE Capable
:
Boot Flash
:
Boot Selector
:
Memory Size
:
Temperature
:
Voltage
:
Switch Power
:
Product Name
:
Mfg By
:
Mfg Date
:
Serial Number
:
Part Number
:
Piece Part ID
:
PPID Revision
:
Service Tag
:
Expr Svc Code
:
PSOC FW Rev
:
ICT Test Date
:
ICT Test Info
:
Max Power Req
:
Fabric Type
:
Fabric Maj Ver :
Fabric Min Ver :
SW Manageability:
HW Manageability:
Max Boot Time
:
Link Tuning
:
Auto Reboot
:
Burned In MAC
:
No Of MACs
:
Management Unit
online
online
I/O-Aggregator - 34-port GE/TE (XL)
I/O-Aggregator - 34-port GE/TE (XL)
0
01
56
4 day, 7 hr, 9 min
8-3-17-38
yes
no
A: 4.0.1.0bt [booted]
B: 4.0.1.0bt1
4.0.0.0bt
2147483648 bytes
67C
ok
GOOD
I/O Aggregator
DELL
00000000000000
NVH81X01
00-NVH81X-00000-000-0000
01
N/A
N/A
0xb
0-0-0
0x0
31488
0x3
0x1
0x0
0x4
0x1
3 minutes
unsupported
enabled
00:01:e8:00:ab:03
3
FTOS#
Related
Commands
show version
Displays the FTOS version.
show processes memory
Displays the memory usage based on the running processes.
show system stack-ports
Displays information about the stack ports on all switches in the stack.
show diag
Displays the data plane and management plane input and output statistics of
a particular stack member.
show revision
Displays the revision numbers of all stack-units.
Syntax
show revision
Command Modes
EXEC Privilege
Command
History
Version 8.3.17.0
Supported on M I/O Aggregator
Control and Monitoring | 65
www.dell.com | support.dell.com
Example
Figure 5-28.
show alarms Command Example
FTOS#show revision
-- Stack unit 1 -IOM SYSTEM CPLD
: 1
FTOS#
show tech-support
Displays a collection of data from other show commands, necessary for Dell Force10 technical support
to perform troubleshooting on M I/O Aggregators.
Syntax
Parameters
show tech-support [stack-unit unit-id | page]
stack-unit
(OPTIONAL) Enter the keyword stack-unit to view CPU memory usage for the stack
member designated by unit-id. Range: 0 to 5
page
(OPTIONAL) Enter the keyword page to view 24 lines of text at a time.
Press the SPACE BAR to view the next 24 lines.
Press the ENTER key to view the next line of text.
When using the pipe command ( | ), enter one of these keywords to filter command output.
Refer to Chapter 3, CLI Basics for details on filtering commands.
save
Enter the save keyword to save the command output.
flash: Save to local flash drive (flash://filename (max 20 chars))
66
Command Modes
EXEC Privilege
Command
History
Version 8.3.17.0
|
Control and Monitoring
Supported on M I/O Aggregator
Examples
Figure 5-29.
show tech-support save Command Example (Partial)
FTOS#show tech-support ?
page
Page through output
stack-unit
Unit Number
|
Pipe through a command
<cr>
FTOS#show tech-support stack-unit 1 ?
page
Page through output
|
Pipe through a command
<cr>
FTOS#show tech-support stack-unit 1 | ?
except
Show only text that does not match a pattern
find
Search for the first occurrence of a pattern
grep
Show only text that matches a pattern
no-more
Don't paginate output
save
Save output to a file
FTOS#show tech-support stack-unit 1 | save ?
flash:
Save to local file system (flash://filename (max 20 chars) )
usbflash:
Save to local file system (usbflash://filename (max 20
chars) )
FTOS#show tech-support stack-unit 1 | save flash://LauraSave
Start saving show command report .......
FTOS#
FTOS#dir
Directory of flash:
Directory of flash:
1
2
3
4
5
6
7
8
9
10
11
drwx
drwx
drwx
drwx
d---rwx
-rwx
-rwx
-rwx
drwx
-rwx
4096
2048
4096
4096
4096
10303
7366
4
12829
4096
7689
Jan
May
Jan
Jan
Jan
Mar
Apr
Feb
Feb
Mar
Feb
01
16
24
24
24
15
20
19
18
08
21
1980
2012
2012
2012
2012
2012
2012
2012
2012
2012
2012
01:00:00
10:49:01
19:38:32
19:38:32
19:38:34
18:37:20
10:57:02
07:05:02
02:24:14
22:58:54
04:45:40
+01:00
+01:00
+01:00
+01:00
+01:00
+01:00
+01:00
+01:00
+01:00
+01:00
+01:00
.
..
TRACE_LOG_DIR
CORE_DUMP_DIR
ADMIN_DIR
startup-config.bak
startup-config
dhcpBindConflict
startup-config.backup
WJ_running-config
stbkup
flash: 2143281152 bytes total (2131476480 bytes free)
FTOS#
Control and Monitoring | 67
www.dell.com | support.dell.com
Figure 5-30.
show tech-support Command Example (Partial)
FTOS#show tech-support stack-unit 1
----------------------------------- show version ------------------------------Dell Force10 Real Time Operating System Software
Dell Force10 Operating System Version: 1.0
Dell Force10 Application Software Version: E8-3-17-38
Copyright (c) 1999-2012 by Dell Inc. All Rights Reserved.
Build Time: Thu Jul 19 05:59:59 PDT 2012
Build Path: /sites/sjc/work/swsystems01-2/ravisubramani/ravis-8317/SW/SRC/Cp_src/
Tacacs
FTOS uptime is 4 day(s), 7 hour(s), 14 minute(s)
System image file is "dv-m1000e-2-b2"
System Type: I/O-Aggregator
Control Processor: MIPS RMI XLP with 2147483648 bytes of memory.
256M bytes of boot flash memory.
1 34-port GE/TE (XL)
56 Ten GigabitEthernet/IEEE 802.3 interface(s)
------------------------------------ show clock ------------------------------17:49:37.2 UTC Mon Jul 23 2012
----------------------------------- show running-config -----------------------Current Configuration ...
! Version E8-3-17-38
! Last configuration change at Mon Jul 23 17:10:18 2012 by default
!
boot system stack-unit 1 primary tftp://10.11.9.21/dv-m1000e-2-b2
boot system stack-unit 1 default system: A:
boot system gateway 10.11.209.62
!
redundancy auto-synchronize full
!
service timestamps log datetime
!
hostname FTOS
----------------------------------- show ip management route ------------------Destination
----------1
--More-FTOS#
Usage
Information
Gateway
-------
State
-----
Without the page or stack-unit option, the command output is continuous, use Ctrl-z to interrupt the
command output.
The save option works with other filtering commands. This allows you to save specific information of
a show command. The save entry must always be the last option.
For example: FTOS#show tech-support |grep regular-expression |except regular-expression | find
regular-expression | save flash://result
This display output is an accumulation of the same information that is displayed when you execute one
of the following show commands:
•
•
•
•
•
•
68
|
Control and Monitoring
show cam
show clock
show environment
show file
show interfaces
show inventory
•
•
•
•
Related
Commands
show processes cpu
show processes memory
show running-conf
show version
show version
Displays the FTOS version.
show system
Displays the current switch status.
show environment
Displays system component status.
show processes memory
Displays memory usage based on the running processes.
show uplink brief
Displays the uplink port information.
Syntax
show uplink {brief | detail}
Parameters
brief
Enter the keyword brief to display a brief summary of the uplink port information.
detail
Enter the keyword detail to display uplink port information with description.
Command Modes
EXEC Privilege
Command
History
Version 8.3.17.0
Example 1
Figure 5-31.
Supported on M I/O Aggregator
show uplink brief Command Example
FTOS#show uplink brief
---------------- show uplink brief --------------------Interface
OK Status
Protocol
Description
TenGigabitEthernet 0/41 NO up
down
TenGigabitEthernet 0/42 NO up
down
TenGigabitEthernet 0/43 NO up
down
TenGigabitEthernet 0/44 NO up
down
TenGigabitEthernet 0/45 NO up
down
TenGigabitEthernet 0/46 NO up
down
TenGigabitEthernet 0/47 NO up
down
TenGigabitEthernet 0/48 NO up
down
TenGigabitEthernet 0/49 NO up
down
TenGigabitEthernet 0/50 NO up
down
TenGigabitEthernet 0/51 NO up
down
TenGigabitEthernet 0/52 NO up
down
TenGigabitEthernet 0/53 NO up
down
TenGigabitEthernet 0/54 NO up
down
TenGigabitEthernet 0/55 NO up
down
TenGigabitEthernet 0/56 NO up
down
TenGigabitEthernet 1/41 NO up
down
TenGigabitEthernet 1/42 NO up
down
TenGigabitEthernet 1/43 NO up
down
--More-4 www.force10networks.com (10.11.84.18) 000.000 ms 000.000 ms
FTOS#
000.000 ms
Control and Monitoring | 69
www.dell.com | support.dell.com
Example 2
Figure 5-32.
show uplink detail Command Example
FTOS#show uplink detail
---------------- show uplink detail --------------------TenGigabitEthernet 0/41 is up, line protocol is down
Hardware is DellForce10Eth, address is 00:1e:c9:f1:00:99
Current address is 00:1e:c9:f1:00:99
Port is not prsent
Pluggable media not present
Interface index is 44634881
Internet address is not set
Mode of IP Address Assignment : NONE
DHCP Client-ID :tenG170001ec9f10099
MTU 12000 bytes, IP MTU 11982 bytes
LineSpeed auto
Flowcontrol rx on tx off
ARP type: ARPA, ARP Timeout 04:00:00
Last clearing of "show interface" counters 2d19h53m
Queueing strategy: fifo
Input Statistics:
0 packets, 0 bytes
0 64-byte pkts, 0 over 64-byte pkts, 0 over 127-byte pkts
0 over 255-byte pkts, 0 over 511-byte pkts, 0 over 1023-byte pkts
0 Multicasts, 0 Broadcasts
--More--
show util-threshold cpu
Displays the set CPU utilization threshold values.
Syntax
show util-threshold cpu
Command Modes
EXEC Privilege
Command
History
Version 8.3.17.0
Usage
Information
Supported on M I/O Aggregator
This command displays all CPU utilization thresholds of the management, standby, and stack-units.
show util-threshold memory
Displays the set memory utilization threshold values.
Syntax
Command Modes
EXEC Privilege
Command
History
Version 8.3.17.0
Usage
Information
70
show util-threshold memory
|
Supported on M I/O Aggregator
This command displays all memory utilization thresholds of the management, standby, and stack-units.
Control and Monitoring
ssh-peer-stack-unit
Open an SSH connection to the peer stack-unit.
Syntax
ssh-peer-stack-unit [-l username]
Parameters
-l username
Defaults
Not configured.
Command Modes
EXEC Privilege
Command
History
Version 8.3.17.0
(OPTIONAL) Enter the keyword -l followed by your username.
Default: The username associated with the terminal.
Supported on M I/O Aggregator
telnet
Connect through Telnet to a server. The Telnet client and server in FTOS supports IPv4 connections.
You can establish a Telnet session directly to the router, or a connection can be initiated from the
router.
Syntax
telnet {host | ip-address} [/source-interface]
Parameters
host
Enter the name of a server.
ip-address
Enter the IPv4 address in dotted decimal format of the server.
/source-interface
(OPTIONAL) Enter the keywords /source-interface followed by the interface
information to include the interface’s IP address.
Enter the following keywords and slot/port or number information:
•
•
Defaults
Command Modes
For a 10-Gigabit Ethernet interface, enter the keyword TenGigabitEthernet
followed by the slot/port information.
For a VLAN interface, enter the keyword vlan followed by a number from 1
to 4094.
Not configured.
EXEC
EXEC Privilege
Command
History
Usage
Information
Version 8.3.17.0
Supported on M I/O Aggregator
Telnet to link-local addresses is not supported.
Control and Monitoring | 71
www.dell.com | support.dell.com
telnet-peer-stack-unit
Open a telnet connection to the peer stack-unit.
Syntax
Defaults
Command Modes
telnet-peer-stack-unit
Not Configured
EXEC
EXEC Privilege
Command
History
Version 8.3.17.0
Supported on M I/O Aggregator
terminal length
Configure the number of lines displayed on the terminal screen.
Syntax
terminal length screen-length
To return to the default values, use the no terminal length command.
Parameters
screen-length
Defaults
Command Modes
Enter a number of lines. Entering zero will cause the terminal to display without
pausing.
Range: 0 to 512.
Default: 24 lines.
24 lines
EXEC
EXEC Privilege
Command
History
Version 8.3.17.0
Supported on M I/O Aggregator
terminal xml
Enable XML mode in Telnet and SSH client sessions.
Syntax
terminal xml
To exit the XML mode, use the no terminal xml command.
Defaults
Command Modes
Disabled
EXEC
EXEC Privilege
72
|
Control and Monitoring
Command
History
Usage
Information
Version 8.3.17.0
Supported on M I/O Aggregator
This command enables XML input mode where you can either cut and paste XML requests or enter the
XML requests line-by-line.
terminal monitor
Configure the FTOS to display messages on the monitor/terminal.
Syntax
terminal monitor
To return to default settings, use the no terminal monitor command.
Defaults
Command Modes
Disabled.
EXEC
EXEC Privilege
Command
History
Version 8.3.17.0
Supported on M I/O Aggregator
traceroute
View the packet path to a specific device.
Syntax
traceroute {host | ip-address}
Parameters
Defaults
Command Modes
host
Enter the name of device.
ip-address
Enter the IP address of the device in dotted decimal format.
Timeout = 5 seconds; Probe count = 3; 30 hops max; 40 byte packet size; UDP port = 33434
EXEC
EXEC Privilege
Command
History
Usage
Information
Version 8.3.17.0
Supported on M I/O Aggregator
When you enter the traceroute command without specifying an IP address (Extended Traceroute), you
are prompted for a target and source IP address, timeout in seconds (default is 5), a probe count
(default is 3), minimum TTL (default is 1), maximum TTL (default is 30), and port number (default is
33434). To keep the default setting for those parameters, press the ENTER key.
Control and Monitoring | 73
www.dell.com | support.dell.com
Example
Figure 5-33.
traceroute (IPv4) Command Example
FTOS#traceroute www.force10networks.com
Translating "www.force10networks.com"...domain server (10.11.0.1) [OK]
Type Ctrl-C to abort.
----------------------------------------------------------------------------------------Tracing the route to www.force10networks.com (10.11.84.18), 30 hops max, 40 byte
packets
----------------------------------------------------------------------------------------TTL Hostname
Probe1
Probe2
Probe3
1 10.11.199.190
001.000 ms 001.000 ms 002.000 ms
2 gwegress-sjc-02.force10networks.com (10.11.30.126) 005.000 ms 001.000 ms
001.000 ms
3 fw-sjc-01.force10networks.com (10.11.127.254) 000.000 ms 000.000 ms 000.000
ms
4 www.force10networks.com (10.11.84.18) 000.000 ms 000.000 ms 000.000 ms
FTOS#
Related
Commands
ping
Tests the connectivity to a device.
undebug all
Disable all debug operations on the system.
Syntax
Defaults
undebug all
none
Command Modes
EXEC Privilege
Command
History
Version 8.3.17.0
Supported on M I/O Aggregator
write
Copy the current configuration to either the startup-configuration file or the terminal.
Syntax
Parameters
Command Modes
74
|
write {memory | terminal}
memory
Enter the keyword memory to copy the current running configuration to the startup
configuration file. This command is similar to the copy running-config startup-config
command.
terminal
Enter the keyword terminal to copy the current running configuration to the terminal. This
command is similar to the show running-config command.
EXEC Privilege
Control and Monitoring
Command
History
Usage
Information
Version 8.3.17.0
Supported on M I/O Aggregator
The write memory command saves the running-configuration to the file labeled startup-configuration.
When using a LOCAL CONFIG FILE other than the startup-config not named “startup-configuration”,
the running-config is not saved to that file; use the copy command to save any running-configuration
changes to that local file.
Control and Monitoring | 75
76
|
Control and Monitoring
www.dell.com | support.dell.com
6
u-Boot
Overview
All commands in this chapter are in u-Boot mode. These commands are supported on the Dell Force10
Aggregator only.
To access this mode, hit any key when the following line appears on the console during a system boot:
Hit any key to stop autoboot:
You enter u-Boot immediately, as indicated by the BOOT_USER# prompt.
Note: Only the most frequently used commands available in uBoot mode are described in
this chapter.
In uBoot mode, you cannot use the Tab key for command completion.
Commands
•
•
•
•
•
•
•
•
•
•
•
•
•
•
•
•
•
•
•
•
boot change
boot selection
boot show net config retries
boot write net config retries
boot zero
default gateway
enable
help
ignore enable password
ignore startup-config
interface management ethernet ip address
no default gateway
no interface management ethernet ip address
reload
show boot blc
show boot selection
show bootflash
show bootvar
show default gateway
show interface management ethernet
u-Boot | 77
www.dell.com | support.dell.com
•
•
show interface management port config
syntax help
Note: You cannot use the Tab key to complete commands in this mode.
boot change
Change the operating system boot parameters.
Syntax
Command Modes
boot change [primary | secondary | default]
uBoot
Command
History
Version 8.3.17.0
Supported on M I/O Aggregator
boot selection
Change the ROM bootstrap bootflash partition.
Syntax
Command Modes
boot selection [a | b]
uBoot
Command
History
Version 8.3.17.0
Supported on M I/O Aggregator
boot show net config retries
Show the number of retries for network boot configuration failure.
Syntax
Command Modes
boot show net config retries
uBoot
Command
History
Version 8.3.17.0
Supported on M I/O Aggregator
u
Example
Figure 6-1.
boot show net config retries Command Example
BOOT_USER# boot show net config retries
Number of Network Boot Config Retries is : 0
BOOT_USER #
78
|
u-Boot
boot write net config retries
Set the number of retries for network boot configuration failure.
Syntax
Command Modes
boot write net config retries <int>
uBoot
Command
History
Version 8.3.17.0
Supported on M I/O Aggregator
u
Example
Figure 6-2.
boot write net config retries Command Example
BOOT_USER # boot write net config retries 2
Updated number of Network Boot Config retries to 2.
BOOT_USER #
boot zero
Clears the primary, secondary, or default boot parameters.
Syntax
Command Modes
boot zero [primary | secondary | default]
uBoot
Command
History
Version 8.3.17.0
Supported on M I/O Aggregator
u
default gateway
Set the default gateway IP address.
Syntax
Command Modes
default-gateway <ip-address>
uBoot
Command
History
Version 8.3.17.0
Supported on M I/O Aggregator
u
enable
Change the access privilege level.
Syntax
Command Modes
enable [user | admin]
uBoot
Command
History
Version 8.3.17.0
Supported on M I/O Aggregator
u
u-Boot | 79
www.dell.com | support.dell.com
help
Displays the help menu.
Syntax
Command Modes
help
uBoot
Command
History
Version 8.3.17.0
Supported on M I/O Aggregator
u
Example
Figure 6-3.
help Command Example
BOOT_USER # help
***** Dell Force10 Boot Interface Help Information *****
Current access level: USER LEVEL
Use "syntax help" for more information on syntax.
Available command list (22 commands total):
boot change [primary|secondary|default]
change operating system boot parameters
boot selection [a|b]
change the rom bootstrap bootflash partition
boot show net config retries
show number of retries for network boot config failure
boot write net config retries <int>
write number of retries for network boot config failure
boot zero [primary|secondary|default]
zero operating system boot parameters
default-gateway <ip-address>
default-gateway - set the default gateway ip address
enable [user|admin]
change access privilege level
help
display help menu
-(36%)-Use <CR> to continue, q to stop:
BOOT_USER #
ignore enable password
Ignore the enabled password.
Syntax
Command Modes
ignore enable-password
uBoot
Command
History
Version 8.3.17.0
Supported on M I/O Aggregator
u
ignore startup-config
Ignore the system startup configuration.
Syntax
Command Modes
80
|
u-Boot
ignore startup-config
uBoot
Command
History
Version 8.3.17.0
Supported on M I/O Aggregator
interface management ethernet ip address
Set the management port IP address and mask.
Syntax
Command Modes
interface management ethernet ip address <ip/mask>
uBoot
Command
History
Version 8.3.17.0
Supported on M I/O Aggregator
u
no default gateway
Clear the default gateway IP address.
Syntax
Command Modes
no default-gateway
uBoot
Command
History
Version 8.3.17.0
Supported on M I/O Aggregator
u
no interface management ethernet ip address
Clear the management port IP address and mask.
Syntax
Command Modes
no interface management ethernet ip address
uBoot
Command
History
Version 8.3.17.0
Supported on M I/O Aggregator
u
reload
Reload the M I/O Aggregator.
Syntax
Command Modes
reload
uBoot
Command
History
Version 8.3.17.0
Supported on M I/O Aggregator
u
u-Boot | 81
www.dell.com | support.dell.com
show boot blc
Show the boot loop counter value.
Syntax
Command Modes
show boot blc
uBoot
Command
History
Version 8.3.17.0
Supported on M I/O Aggregator
u
Example
Figure 6-4.
show boot blc Command Example
BOOT_USER # show boot blc ?
Total 1 possible command found.
Possible command list:
show boot blc
show the boot loop counter value
BOOT_USER # show boot blc
Boot Loop Counter : 10
BOOT_USER #
show boot selection
Displays the ROM bootstrap bootflash partition.
Syntax
Command Modes
show boot selection
uBoot
Command
History
Version 8.3.17.0
Supported on M I/O Aggregator
u
Example
Figure 6-5.
show boot selection Command Example
BOOT_USER # show boot selection
ROM BOOTSTRAP SELECTOR PARMETERS:
================================
Next ROM bootstrap set to occur from Bootflash partition A.
Last ROM bootstrap occurred from Bootflash partition B.
BOOT_USER #
show bootflash
Show the summary of boot flash information.
Syntax
Command Modes
82
|
u-Boot
show bootflash
uBoot
Command
History
Example
Version 8.3.17.0
Figure 6-6.
Supported on M I/O Aggregator
show bootflash Command Example
BOOT_USER # show bootflash
GENERAL BOOTFLASH INFO
======================
Bootflash Partition A:
Dell Force10 Networks System Boot
Official IOM_LP_IMG_BOOT_LOADER, BSP Release 4.0.1.0bt1
Created Tue May 1 10:56:16 2012 by build on login-sjc-01
Bootflash Partition B:
Dell Force10 Networks System Boot
Official IOM_LP_IMG_BOOT_LOADER, BSP Release 4.0.1.0bt1
Created Tue May 1 10:56:16 2012 by build on login-sjc-01
Boot Selector Partition:
Dell Force10 Networks System Boot
Official IOM_XLOAD_LP_IMG_BOOT_SELECTOR, BSP Release 4.0.0.0bt1
Created Tue May 1 10:56:34 2012 by build on login-sjc-01
BOOT_USER #
show bootvar
Show the summary of operating system boot parameters.
Syntax
Command Modes
Command
History
show bootvar
uBoot
Version 8.3.17.0
Supported on M I/O Aggregator
u-Boot | 83
www.dell.com | support.dell.com
Example
Figure 6-7.
show bootvar Command Example
BOOT_USER # show bootvar
PRIMARY OPERATING SYSTEM BOOT PARAMETERS:
========================================
boot device
: tftp
file name
: premnath
Management Etherenet IP address
: 10.16.130.134/16
Server IP address
: 10.16.127.35
Default Gateway IP address
: 15.0.0.1
Management Etherenet MAC address
: 00:01:E8:43:DE:DF
SECONDARY OPERATING SYSTEM BOOT PARAMETERS:
========================================
No Operating System boot parameters specified!
DEFAULT OPERATING SYSTEM BOOT PARAMETERS:
========================================
boot device
: tftp
file name
: FTOS-XL-8-3-16-99.bin
Management Etherenet IP address
: 10.16.130.134/16
Server IP address
: 10.16.127.53
Default Gateway IP address
: 15.0.0.1
Management Etherenet MAC address
: 00:01:E8:43:DE:DF
BOOT_USER #
show default gateway
Displays the default gateway IP address.
Syntax
Command Modes
show default-gateway
uBoot
Command
History
Version 8.3.17.0
Supported on M I/O Aggregator
u
Example
Figure 6-8.
show default-gateway Command Example
BOOT_USER # show default-gateway
Gateway IP address: 15.0.0.1
BOOT_USER #
show interface management ethernet
Show the management port IP address and mask.
Syntax
Command Modes
84
|
u-Boot
show interface management ethernet
uBoot
Command
History
Version 8.3.17.0
Supported on M I/O Aggregator
u
Example
Figure 6-9.
show interface management ethernet Command Example
BOOT_USER # show interface management ethernet
Management ethernet IP address: 10.16.130.134/16
BOOT_USER #
show interface management port config
Show the management port boot characteristics.
Syntax
Command Modes
show interface management port config
uBoot
Command
History
Version 8.3.17.0
Supported on M I/O Aggregator
u
Example
Figure 6-10.
show interface management port config Command Example
BOOT_USER # show interface management port config
Management ethernet Port Configuration: no Auto Negotiate
Management ethernet Port Configuration: 100M
Management ethernet Port Configuration: full duplex
BOOT_USER #
syntax help
Show the syntax information.
Syntax
Command Modes
help
uBoot
Command
History
Version 8.3.17.0
Supported on M I/O Aggregator
u
u-Boot | 85
86
|
u-Boot
www.dell.com | support.dell.com
7
Data Center Bridging
Overview
Data center bridging (DCB) refers to a set of IEEE Ethernet enhancements that provide data centers
with a single, robust, converged network to support multiple traffic types, including LAN, server, and
storage traffic.
The Dell Force10 operating software (FTOS) commands for data center bridging features include
802.1Qbb priority-based flow control (PFC), 802.1Qaz enhanced transmission selection (ETS), and the
Data Center Bridging Exchange (DCBX) protocol. CLI commands for individual DCB features are as
follows:
DCB Command
•
•
dcb enable
dcb enable on-next-reload
PFC Commands
•
•
•
•
clear pfc counters
show interface pfc
show interface pfc statistics
show stack-unit stack-ports pfc detail
ETS Commands
•
•
•
clear ets counters
show interface ets
show stack-unit stack-ports ets detail
DCBX Commands
•
•
show dcb
show interface dcbx detail
Data Center Bridging | 87
www.dell.com | support.dell.com
clear ets counters
Clear ETS TLV counters.
Syntax
Parameters
Defaults
clear ets counters [tengigabitethernet slot/port]
slot/port
Enter the slot/port number.
None
Command Modes
EXEC Privilege
Command
History
Version 8.3.17.0
Supported on M I/O Aggregator
clear pfc counters
Clear PFC TLV counters.
Syntax
Parameters
Defaults
clear pfc counters [stack-unit unit-number | tengigabitethernet slot/port]
unit number
<0-5>
Number of the member stack unit. Valid values: 0 to 5. Default: 0
slot/port
Enter the slot/port number.
None
Command Modes
EXEC Privilege
Command
History
Version 8.3.17.0
Supported on M I/O Aggregator
dcb enable
Re-enable DCB.
Syntax
dcb enable
To disable DCB, use the no dcb enable command.
Defaults
Command Modes
Command
History
Usage
Information
88
|
None
CONFIGURATION
Version 8.3.17.0
Supported on M I/O Aggregator
The Aggregator is autoconfigured to use DCB. In some network topologies, you may want to disable
DCB and allow link-level flow control to control data transmission between the Aggregator and other
network devices.
Data Center Bridging
dcb enable on-next-reload
Enables global DCB on a subsequent reload. This command also internally configures PFC buffers
based on DCB enable/disable. Save and reload is mandatory for the configurations to take effect.
Syntax
dcb enable on-next-reload
To disable global DCB on a subsequent reload, use the no dcb enable on-next-reload command.
Defaults
Command Modes
Command
History
None
CONFIGURATION
Version 8.3.17.0
Supported on M I/O Aggregator
Data Center Bridging | 89
www.dell.com | support.dell.com
Example 1
Figure 7-1.
dcb enable on-next-reload Command Example
FTOS#
FTOS#show dcb stack-unit 0 port-set 0
stack-unit 0 port-set 0
DCB Status : Disabled
PFC Port Count : 0 (current), 0 (configured)
PFC Queue Count : 0 (current), 0 (configured)
FTOS#
FTOS#
FTOS#conf t
FTOS(conf)#dcb enable on-next-reload
FTOS(conf)#00:02:35: %STKUNIT0-M:CP %DIFFSERV-6-DCB_ENABLE_CFG_ON_RELOAD:
Global DCB will be enabled on subsequent reload, PFC buffers will be reserved
for all pfc ports and max loss less queues supported for each stack unit. For
the pfc-buffering change to take effect, please save the config and reload the
system.
FTOS(conf)#end
FTOS#00:02:38: %STKUNIT0-M:CP %SYS-5-CONFIG_I: Configured from
console
FTOS#write memory
00:02:41: %STKUNIT0-M:CP %FILEMGR-5-FILESAVED: Copied running-config to
startup-config in flash by default
FTOS#reload
Proceed with reload [confirm yes/no]: yes
syncing disks... done
unmounting file systems...
unmounting /f10/flash (/dev/ld0e)...
unmounting /usr (mfs:31)...
unmounting /lib (mfs:23)...
unmounting /f10 (mfs:20)...
unmounting /tmp (mfs:15)...
unmounting /kern (kernfs)...
unmounting / (/dev/md0a)... done
rebooting...
FTOS#show dcb stack-unit 0 port-set 0
stack-unit 0 port-set 0
DCB Status : Enabled
PFC Port Count : 56 (current), 56 (configured)
PFC Queue Count : 2 (current), 2 (configured)
FTOS#
90
|
Data Center Bridging
Example 2
Figure 7-2.
no dcb enable on-next-reload Command Example
FTOS#show dcb stack-unit 0 port-set 0
stack-unit 0 port-set 0
DCB Status : Enabled
PFC Port Count : 56 (current), 0 (configured)
PFC Queue Count : 2 (current), 0 (configured)
FTOS#
FTOS#conf t
FTOS(conf)#dcb enable ?
on-next-reload
Apply DCB configs on subsequent reload
FTOS(conf)#no dcb enable on-next-reload
FTOS(conf)#00:03:11: %STKUNIT0-M:CP %DIFFSERV-6-DCB_DISABLE_CFG_ON_RELOAD:
Global DCB will be disabled on subsequent reload, All reserved PFC buffers will
be deleted from each stack unit. For the pfc-buffering change to take effect,
please save the config and reload the system.
FTOS(conf)#end
FTOS#00:03:23: %STKUNIT0-M:CP %SYS-5-CONFIG_I: Configured from
console
FTOS#write memory
00:03:28: %STKUNIT0-M:CP %FILEMGR-5-FILESAVED: Copied running-config to
startup-config in flash by default
FTOS#reload
Proceed with reload [confirm yes/no]: yes
00:04:13: %STKUNIT0-M:CP %CHMGR-5-RELOAD: User request to reload the chassis
syncing disks... done
unmounting file systems...
unmounting /f10/flash (/dev/ld0e)...
unmounting /usr (mfs:31)...
unmounting /lib (mfs:23)...
unmounting /f10 (mfs:20)...
unmounting /tmp (mfs:15)...
unmounting /kern (kernfs)...
unmounting / (/dev/md0a)... done
rebooting...
FTOS#
FTOS#show dcb stack-unit 0 port-set 0
stack-unit 0 port-set 0
DCB Status : Disabled
PFC Port Count : 0 (current), 0 (configured)
PFC Queue Count : 0 (current), 0 (configured)
FTOS#
PFC Queue Count :
FTOS#
2
(current), 2
(configured)
Data Center Bridging | 91
www.dell.com | support.dell.com
dcbx version
Configure the DCBX version used on the interface.
Syntax
dcbx version {auto | cee | cin | ieee-v2.5}
To remove the DCBX version, use the no dcbx version {auto | cee | cin | ieee-v2.5} command.
Parameters
auto | cee | cin |
ieee-v2.5
Enter the DCBX version type used on the interface, where:
•
auto: configures the port to operate using the DCBX version received from a
•
•
•
cee: configures the port to use CEE (Intel 1.01).
cin: configures the port to use Cisco-Intel-Nuova (DCBX 1.0).
ieee-v2.5: configures the port to use IEEE 802.1az (Draft 2.5).
peer.
Defaults
Command Modes
Command
History
Usage
Information
Auto
PROTOCOL LLDP
Version 8.3.17.0
Supported on M I/O Aggregator
DCBX requires that you enable LLDP to advertise DCBX TLVs to peers.
Configure DCBX operation at the INTERFACE level on a switch or globally on the switch.To verify
the DCBX configuration on a port, use the show interface dcbx detail command.
92
|
Data Center Bridging
show dcb
Displays the data center bridging status, the number of PFC-enabled ports, and the number of
PFC-enabled queues.
Syntax
Parameters
Command Mode
Command
History
Example
show dcb [stack-unit unit-number]
unit number
Enter the DCB unit number.
The valid values are 0 to 5.
EXEC PRIVILEGE
Version 8.3.17.0
Figure 7-3.
Supported on M I/O Aggregator
show dcb Command Example
FTOS# show dcb
stack-unit 0 port-set 0
DCB Status : Enabled
PFC Port Count : 56 (current), 56 (configured)
PFC Queue Count : 2 (current), 2 (configured)
Usage
Information
Specify a stack-unit number on the Master switch in a stack.
show interface dcbx detail
Displays the DCBX configuration on an interface.
Syntax
Parameters
show interface port-type slot/port dcbx detail
port-type
Enter the port type.
slot/port
Enter the slot/port number.
Command Mode
EXEC Privilege
Command
History
Version 8.3.17.0
Supported on M I/O Aggregator
Data Center Bridging | 93
www.dell.com | support.dell.com
Example
Figure 7-4.
show interface dcbx detail Command Example
FTOS#show int tengigabitethernet 1/49 dcbx detail
E-ETS Configuration TLV enabled
e-ETS Configuration TLV disabled
R-ETS Recommendation TLV enabled
r-ETS Recommendation TLV disabled
P-PFC Configuration TLV enabled
p-PFC Configuration TLV disabled
F-Application priority for FCOE enabled
f-Application Priority for FCOE
disabled
I-Application priority for iSCSI enabled
i-Application Priority for iSCSI
disabled
----------------------------------------------------------------------------------------Interface TenGigabitEthernet 1/49
Port Role is Auto-Upstream
DCBX Operational Status is Disabled
Is Configuration Source? FALSE
Local DCBX Compatibility mode is AUTO
Local DCBX Configured mode is AUTO
Peer Operating version is Not Detected
Local DCBX TLVs Transmitted: ErPfi
FTOS#
Table 7-1 lists the show interface dcbx detail field descriptions.
Table 7-1.
show interface dcbx detail Command Example Fields
Field
Description
Interface
Interface type with chassis slot and port number.
Port-Role
Configured the DCBX port role: auto-upstream or auto-downstream.
DCBX Operational Status Operational status (enabled or disabled) used to elect a configuration source and
internally propagate a DCB configuration. The DCBX operational status is the
combination of PFC and ETS operational status.
94
|
Configuration Source
Specifies whether the port serves as the DCBX configuration source on the switch:
true (yes) or false (no).
Local DCBX
Compatibility mode
DCBX version accepted in a DCB configuration as compatible. In auto-detection
mode, a port can only operate on a DCBX version supported on the remote peer.
Local DCBX Configured
mode
DCBX version configured on the port: CEE, CIN, IEEE v2.5, or Auto (port
auto-configures to use the DCBX version received from a peer).
Peer Operating version
DCBX version that the peer uses to exchange DCB parameters.
Local DCBX TLVs
Transmitted
Transmission status (enabled or disabled) of advertised DCB TLVs (see TLV code
at the top of the show command output).
Local DCBX Status:
DCBX Operational
Version
DCBX version advertised in Control TLVs.
Local DCBX Status:
DCBX Max Version
Supported
Highest DCBX version supported in Control TLVs.
Local DCBX Status:
Sequence Number
Sequence number transmitted in Control TLVs.
Local DCBX Status:
Acknowledgment
Number
Acknowledgement number transmitted in Control TLVs.
Data Center Bridging
Table 7-1.
show interface dcbx detail Command Example Fields (continued)
Field
Description
Local DCBX Status:
Protocol State
Current operational state of the DCBX protocol: Waiting for ACK or IN-SYNC.
Peer DCBX Status:
DCBX Operational
Version
DCBX version advertised in Control TLVs received from the peer device.
Peer DCBX Status:
DCBX Max Version
Supported
Highest DCBX version supported in Control TLVs received from the peer device.
Peer DCBX Status:
Sequence Number
Sequence number transmitted in Control TLVs received from the peer device.
Peer DCBX Status:
Acknowledgment
Number
Acknowledgement number transmitted in Control TLVs received from the peer
device.
Total DCBX Frames
transmitted
Number of DCBX frames sent from the local port.
Total DCBX Frames
received
Number of DCBX frames received from the remote peer port.
Total DCBX Frame errors Number of DCBX frames with errors received.
Total DCBX Frames
unrecognized
Number of unrecognizable DCBX frames received.
show interface ets
Displays the ETS configuration applied to egress traffic on an interface, including priority groups with
priorities and bandwidth allocation.
Syntax
Parameters
show interface port-type slot/port ets {summary | detail}
port-type slot/port
Enter the port-type slot and port ETS information.
ets
{summary | detail}
Command Mode
EXEC Privilege
Command
History
Version 8.3.17.0
Enter the keyword summary for a summary list of results or enter the keyword detail
for a full list of results.
Supported on M I/O Aggregator
Data Center Bridging | 95
www.dell.com | support.dell.com
Example
Figure 7-5.
show interfaces ets summary Command Example
FTOS#show interface tengigabitethernet 1/1 ets summary
Interface TenGigabitEthernet 1/1
Max Supported TC Groups is 4
Number of Traffic Classes is 8
Admin mode is on
Admin Parameters :
-----------------Admin is enabled
TC-grp
Priority#
Bandwidth
TSA
-----------------------------------------------0
0,1,2,3,4,5,6,7
100%
ETS
1
2
3
4
5
6
7
Remote Parameters :
------------------Remote is disabled
Local Parameters :
-----------------Local is enabled
TC-grp
Priority#
Bandwidth
TSA
-----------------------------------------------0
0,1,2,3,4,5,6,7
100%
ETS
1
2
3
4
5
6
7
Oper status is internally propagated
ETS DCBX Oper status is Down
State Machine Type is Asymmetric
Conf TLV Tx Status is enabled
Reco TLV Tx Status is enabled
FTOS#
96
|
Data Center Bridging
Example
Figure 7-6.
show interfaces ets detail Command Example
FTOS#show interface tengigabitethernet 1/1 ets detail
Interface TenGigabitEthernet 1/1
Max Supported TC Groups is 4
Number of Traffic Classes is 8
Admin mode is on
Admin Parameters:
-----------------Admin is enabled
TC-grp
Priority#
Bandwidth
TSA
-----------------------------------------------0
0,1,2,3,4,5,6,7
100%
ETS
1
2
3
4
5
6
7
Remote Parameters :
------------------Remote is disabled
Local Parameters :
-----------------Local is enabled
TC-grp
Priority#
Bandwidth
TSA
-----------------------------------------------0
0,1,2,3,4,5,6,7
100%
ETS
1
2
3
4
5
6
7
Oper status is internally propagated
ETS DCBX Oper status is Down
State Machine Type is Asymmetric
Conf TLV Tx Status is enabled
Reco TLV Tx Status is enabled
0 Input Conf TLV Pkts, 0 Output Conf TLV Pkts, 0 Error Conf TLV Pkts
0 Input Reco TLV Pkts, 0 Output Reco TLV Pkts, 0 Error Reco TLV Pkts
FTOS#
Data Center Bridging | 97
www.dell.com | support.dell.com
Usage
Information
Table 7-2 lists the show interface ets summary field descriptions.
Table 7-2.
show interfaces ets detail Command Example Fields
Field
Description
Interface
Interface type with stack-unit and port number.
Max Supported TC Group Maximum number of priority groups supported.
Number of Traffic Classes Number of 802.1p priorities currently configured.
Admin mode
ETS mode: on or off.
When on, the scheduling and bandwidth allocation configured in an ETS output
policy or received in a DCBX TLV from a peer can take effect on an interface.
Admin Parameters
ETS configuration on local port, including priority groups, assigned dot1p
priorities, and bandwidth allocation.
Remote Parameters
ETS configuration on remote peer port, including admin mode (enabled if a valid
TLV was received or disabled), priority groups, assigned dot1p priorities, and
bandwidth allocation. If ETS admin mode is enabled on the remote port for DCBX
exchange, the Willing bit received in ETS TLVs from the remote peer is included.
Local Parameters
ETS configuration on local port, including admin mode (enabled when a valid TLV
is received from a peer), priority groups, assigned dot1p priorities, and bandwidth
allocation.
Operational status (local
port)
Port state for current operational ETS configuration:
•
•
Init: Local ETS configuration parameters were exchanged with the peer.
Recommend: Remote ETS configuration parameters were received from the
•
Internally propagated: ETS configuration parameters were received from
peer.
the configuration source.
98
|
ETS DCBX Oper status
Operational status of the ETS configuration on the local port: match or mismatch.
State Machine Type
Type of state machine used for DCBX exchanges of ETS parameters:
Feature - for legacy DCBX versions; Asymmetric - for an IEEE version.
Conf TLV Tx Status
Status of ETS Configuration TLV advertisements: enabled or disabled.
Reco TLV Tx Status
Status of ETS Recommendation TLV advertisements: enabled or disabled
ETS TLV Statistic: Input
Conf TLV pkts
Number of ETS Configuration TLVs received.
ETS TLV Statistic:
Output Conf TLV pkts
Number of ETS Configuration TLVs transmitted.
ETS TLV Statistic: Error
Conf TLV pkts
Number of ETS Error Configuration TLVs received.
ETS Reco TLV Statistic:
Input Reco TLV pkts
Number of ETS Recommendation TLVs received.
ETS Reco TLV Statistic:
Output Reco TLV pkts
Number of ETS Recommendation TLVs transmitted.
ETS Reco TLV Statistic:
Error Reco TLV pkts
Number of ETS Error Recommendation TLVs received.
Data Center Bridging
show interface pfc
Displays the PFC configuration applied to ingress traffic on an interface, including priorities and link
delay.
Syntax
Parameters
show interface port-type slot/port pfc {summary | detail}
port-type slot/port
pfc
Enter the port-type slot and port PFC information.
{summary | detail}
Enter the keyword summary for a summary list of results or enter the keyword detail
for a full list of results.
Command Mode
EXEC Privilege
Command
History
Version 8.3.17.0
Example
Figure 7-7.
Supported on M I/O Aggregator
show interface pfc summary Command Example
FTOS# show interfaces tengigabitethernet 0/49 pfc summary
Interface TenGigabitEthernet 0/49
Admin mode is on
Admin is enabled
Remote is enabled, Priority list is 4
Remote Willing Status is enabled
Local is enabled
Oper status is Recommended
PFC DCBX Oper status is Up
State Machine Type is Feature
TLV Tx Status is enabled
PFC Link Delay 45556 pause quantams
Application Priority TLV Parameters:
-------------------------------------FCOE TLV Tx Status is disabled
ISCSI TLV Tx Status is disabled
Local FCOE PriorityMap is 0x8
Local ISCSI PriorityMap is 0x10
Remote FCOE PriorityMap is 0x8
Remote ISCSI PriorityMap is 0x8
FTOS#
Data Center Bridging | 99
www.dell.com | support.dell.com
Example
Figure 7-8.
show interface pfc detail Command Example
FTOS# show interfaces tengigabitethernet 0/49 pfc detail
Interface TenGigabitEthernet 0/49
Admin mode is on
Admin is enabled
Remote is enabled
Remote Willing Status is enabled
Local is enabled
Oper status is recommended
PFC DCBX Oper status is Up
State Machine Type is Feature
TLV Tx Status is enabled
PFC Link Delay 45556 pause quanta
Application Priority TLV Parameters :
-------------------------------------FCOE TLV Tx Status is disabled
ISCSI TLV Tx Status is disabled
Local FCOE PriorityMap is 0x8
Local ISCSI PriorityMap is 0x10
Remote FCOE PriorityMap is 0x8
Remote ISCSI PriorityMap is 0x8
0 Input TLV pkts, 1 Output TLV pkts, 0 Error pkts, 0 Pause Tx pkts, 0 Pause
Rx pkts
Usage
Information
Table 7-3 lists the show interface pfc summary field descriptions.
Table 7-3.
show interfaces pfc summary Command Example Fields
Field
Description
Interface
Interface type with stack-unit and port number.
Admin mode is on
Admin is enabled
PFC mode: on or off.
Priority list: list of the configured PFC priorities (if any).
When the PFC admin mode is on, PFC advertisements are enabled to be sent and
received from peers.
Remote is enabled,
Priority list,
Remote Willing Status is
enabled
Remote Admin mode: (enabled if a valid TLV was received or disabled)
Priority list: list of the configured PFC priorities (if any).
Remote Willing Status: Willing bit received in PFC TLVs from the remote peer.
Local is enabled
Local PFC configuration including the mode and the list of PFC priorities
configured.
Operational status (local
port)
Port state for current operational PFC configuration:
•
•
•
100
|
Init: Local PFC configuration parameters were exchanged with the peer.
Recommend: Remote PFC configuration parameters were received from the
peer.
Internally propagated: PFC configuration parameters were received from the
configuration source.
PFC DCBX Oper status
Operational status for the exchange of the PFC configuration on the local port:
match (up) or mismatch (down).
State Machine Type
Type of state machine used for DCBX exchanges of the PFC parameters:
Feature - for legacy DCBX versions; Symmetric - for an IEEE version.
TLV Tx Status
Status of the PFC TLV advertisements: enabled or disabled.
Data Center Bridging
Table 7-3.
show interfaces pfc summary Command Example Fields (continued)
Field
Description
PFC Link Delay
Link delay (in quanta) used to pause specified priority traffic.
Application Priority TLV: Status of FCoE advertisements in application priority TLVs from the local DCBX
FCOE TLV Tx Status
port: enabled or disabled.
Application Priority TLV: Status of ISCSI advertisements in application priority TLVs from the local DCBX
SCSI TLV Tx Status
port: enabled or disabled.
Application Priority TLV: Priority bitmap used by the local DCBX port in FCoE advertisements in application
Local FCOE Priority Map priority TLVs.
Application Priority TLV: Priority bitmap used by the local DCBX port in ISCSI advertisements in application
Local ISCSI Priority Map priority TLVs.
Application Priority TLV: Priority bitmap received from the remote DCBX port in FCoE advertisements in
Remote FCOE Priority
application priority TLVs.
Map
Application Priority TLV: Priority bitmap received from the remote DCBX port in iSCSI advertisements in
application priority TLVs.
Remote ISCSI Priority
Map
PFC TLV Statistics: Input Number of PFC TLVs received.
TLV pkts
PFC TLV Statistics:
Output TLV pkts
Number of PFC TLVs transmitted.
PFC TLV Statistics: Error Number of PFC error packets received.
pkts
PFC TLV Statistics: Pause Number of PFC pause frames transmitted.
Tx pkts
PFC TLV Statistics: Pause Number of PFC pause frames received.
Rx pkts
show interface pfc statistics
Displays counters for the PFC frames received and transmitted (by dot1p priority class) on an interface.
Syntax
Parameters
show interface port-type slot/port pfc statistics
port-type
Enter the port type.
slot/port
Enter the slot/port number.
Command Mode
EXEC Privilege
Command
History
Version 8.3.17.0
Supported on M I/O Aggregator
Data Center Bridging | 101
www.dell.com | support.dell.com
Example
Figure 7-9.
show interfaces pfc statistics Command Example
FTOS#show interface tengigabitethernet 1/49 pfc statistics
Interface TenGigabitEthernet 1/49
Priority
-------0
1
2
3
4
5
6
7
FTOS#
Received Pfc Frames
------------------0
0
0
0
0
0
0
0
Transmitted Pfc Frames
---------------------0
0
0
0
0
0
0
0
show stack-unit stack-ports ets detail
Displays the ETS configuration applied to egress traffic on stacked ports, including ETS operational
mode on each unit and the configurated priority groups with dot1p priorities, bandwidth allocation, and
scheduler type.
Syntax
Parameters
102
|
show stack-unit {all | stack-unit} stack-ports {all | port-number} ets detail
stack-unit
Enter the stack unit identification.
port-number
Enter the port number.
Command Mode
EXEC Privilege
Command
History
Version 8.3.17.0
Data Center Bridging
Supported on M I/O Aggregator
Example
Figure 7-10.
show stack-unit stack-ports ets detail Command Example
FTOS#show stack-unit all stack-ports all ets details
Stack unit 1 stack port all
Max Supported TC Groups is 4
Number of Traffic Classes is 1
Admin mode is on
Admin Parameters:
-------------------Admin is enabled
TC-grp
Priority#
Bandwidth
TSA
-----------------------------------------------0
0,1,2,3,4,5,6,7
100%
ETS
1
2
3
4
5
6
7
8
FTOS#
show stack-unit stack-ports pfc detail
Displays the PFC configuration applied to ingress traffic on stacked ports, including PFC operational
mode on each unit with the configured priorities, link delay, and number of pause packets sent and
received.
Syntax
Parameters
Command Mode
Command
History
Example
show stack-unit {all | stack-unit} stack-ports {all | port-number} pfc detail
stack-unit
Enter the stack unit.
port-number
Enter the port number.
CONFIGURATION
Version 8.3.17.0
Figure 7-11.
Supported on M I/O Aggregator
show stack-unit all stack-ports all pfc details Command Example
FTOS#show stack-unit all stack-ports all pfc details
stack unit 1 stack-port all
Admin mode is On
Admin is enabled
Local is enabled
Link Delay 45556 pause quantum
0 Pause Tx pkts, 0 Pause Rx pkts
FTOS#
Data Center Bridging | 103
104
|
Data Center Bridging
www.dell.com | support.dell.com
8
Dynamic Host Configuration Protocol (DHCP)
Overview
Dynamic host configuration protocol (DHCP) is an application layer protocol that dynamically assigns
IP addresses and other configuration parameters to network end-stations (hosts) based on configuration
policies determined by network administrators.
An Aggregator can operate as a DHCP client. As a DHCP client, the Aggregator requests an IP address
from a DHCP server.
The following types of DHCP commands are described in this chapter:
•
•
DHCP Client Commands
Other Commands supported by DHCP Client
DHCP Client Commands
•
•
•
•
•
ip address dhcp
release dhcp interface
renew dhcp interface
show ip dhcp client statistics
show ip dhcp lease
Other Commands supported by DHCP Client
•
•
debug ip dhcp client events
debug ip dhcp clients packets
Dynamic Host Configuration Protocol (DHCP) | 105
www.dell.com | support.dell.com
ip address dhcp
Acquire an IP address dynamically on an interface from the DHCP server.
Syntax
ip address dhcp
To diable DHCP Client on an interface, use the no ip address dhcp command.
Command Mode
Default
INTERFACE
Enabled
Command
History
Usage
Information
Version 8.3.17.0
Supported on M I/O Aggregator
In the M I/O Aggregator, the DHCP client is enabled only on the default vlan and management
interface 0/0. Use the ip address command to assign a static ip address that overwrites the
dynamically assigned IP address.
clear ip dhcp client statistics
Displays DHCP client statistics, including the number of DHCP messages sent and received on an
interface.
Syntax
clear ip dhcp client statistics {all | interface type slot/port}
Parameters
all
Clear DHCP client statistics on all DHCP client-enabled interfaces on the switch.
interface type slot/
port
Clear DHCP client statistics on the specified interface.
•
•
Command Mode
Default
For the management interface on the stack-unit, enter the keyword
managementethernet followed by slot/port information. The slot and port
range is 0.
For a VLAN, enter the keyword vlan followed by a number from 1 to 4094.
EXEC Privilege
None.
Command
History
Version 8.3.17.0
Supported on M I/O Aggregator
debug ip dhcp client events
Enable the display of log messages for the following events on DHCP client interfaces:
•
•
•
•
Syntax
106
|
IP address acquisition
IP address release
Renewal of IP address and lease time
Release of an IP address
debug ip dhcp client events [interface type slot/port]
Dynamic Host Configuration Protocol (DHCP)
Parameters
interface type slot/
port
Display log messages for DHCP packets sent and received on the specified
interface.
•
•
Command Mode
Default
Command
History
For the management interface on the stack-unit, enter the keyword
managementethernet followed by slot/port information. The slot and port
range is 0.
For a VLAN, enter the keyword vlan followed by a number from 1 to 4094.
EXEC Privilege
None
Version 8.3.17.0
Supported on M I/O Aggregator
debug ip dhcp clients packets
Enable the display of log messages for all DHCP packets sent and received on DHCP client interfaces.
Syntax
Parameters
debug ip dhcp client packets [interface type slot/port]
interface type slot/
port
Display log messages for DHCP packets sent and received on the specified
interface.
•
•
Command Mode
Default
Command
History
For the management interface on the stack-unit, enter the keyword
managementethernet followed by slot/port information. The slot and port
range is 0.
For a VLAN, enter the keyword vlan followed by a number from 1 to 4094.
EXEC Privilege
None
Version 8.3.17.0
Supported on M I/O Aggregator
release dhcp interface
Release the dynamically-acquired IP address on an Ethernet interface while retaining the DHCP client
configuration on the interface.
Syntax
Parameters
release dhcp interface type slot/port
interface type slot/
port
•
•
Command Mode
Default
For the management interface on the stack-unit, enter the keyword
managementethernet followed by slot/port information. The slot and port
range is 0.
For a VLAN, enter the keyword vlan followed by a number from 1 to 4094.
EXEC Privilege
None.
Dynamic Host Configuration Protocol (DHCP) | 107
www.dell.com | support.dell.com
Command
History
Usage
Information
Version 8.3.17.0
Supported on M I/O Aggregator
When you enter the release dhcp command, although the IP address that was dynamically-acquired
from a DHCP server is released from an interface, the ability to acquire a new DHCP server-assigned
address remains in the running configuration for the interface. To acquire a new IP address, enter either
the renew dhcp command at the EXEC privilege level or the ip address dhcp command at the
interface configuration level.
renew dhcp interface
Re-acquire a dynamic IP address on an Ethernet interface enabled as a DHCP client.
Syntax
Parameters
renew dhcp interface type slot/port
interface type slot/
port
Enter any of the following keywords and slot/port or number to clear counters from
a specified interface:
•
•
Command Mode
Default
Command
History
Usage
Information
For the management interface on the stack-unit, enter the keyword
managementethernet followed by slot/port information. The slot and port
range is 0.
For a VLAN, enter the keyword vlan followed by a number from 1 to 4094.
EXEC Privilege
None.
Version 8.3.17.0
Supported on M I/O Aggregator
The renew dhcp command is used to renew the lease of IP address obtained through dhcp.
To display the currently configure dynamic IP address and lease time, enter the show ip dhcp lease
command.
show ip dhcp client statistics
Displays DHCP client statistics, including the number of DHCP messages sent and received on an
interface.
Syntax
Parameters
show ip dhcp client statistics {all | interface type slot/port}
all
Display DHCP client statistics on all DHCP client-enabled interfaces on the switch.
interface type slot/
port
Display DHCP client statistics on the specified interface.
•
•
Command Mode
Default
108
|
EXEC Privilege
None.
Dynamic Host Configuration Protocol (DHCP)
For the management interface on the stack-unit, enter the keyword
managementethernet followed by slot/port information. The slot and port
range is 0.
For a VLAN, enter the keyword vlan followed by a number from 1 to 4094.
Command
History
Version 8.3.17.0
Supported on M I/O Aggregator
show ip dhcp lease
Displays lease information about the dynamic IP address currently assigned to a DHCP client-enabled
interface.
Syntax
Parameters
show ip dhcp lease [interface type slot/port]
interface type slot/
port
Display DHCP lease information on the specified interface.
•
•
Command Mode
Default
Command
History
For the management interface on the stack-unit, enter the keyword
managementethernet followed by slot/port information. The slot and port
range is 0.
For a VLAN, enter the keyword vlan followed by a number from 1 to 4094.
EXEC Privilege
Display DHCP lease information on all DHCP client-enabled interfaces on the switch.
Version 8.3.17.0
Supported on M I/O Aggregator
Dynamic Host Configuration Protocol (DHCP) | 109
www.dell.com | support.dell.com
110
|
Dynamic Host Configuration Protocol (DHCP)
9
FIP Snooping
Overview
In a converged Ethernet network, an Aggregator can operate as an intermediate Ethernet bridge to
snoop on Fibre Channel over Ethernet Initialization Protocol (FIP) packets during the login process on
Fibre Channel over Ethernet (FCoE) forwarders (FCFs). Acting as a transit FIP snooping bridge, the
switch uses dynamically-created ACLs to permit only authorized FCoE traffic to be transmitted
between an FCoE end-device and an FCF.
FIP Snooping Commands
The following Dell Force10 operating software (FTOS) commands are used to configure and verify the
FIP snooping feature:
•
•
•
•
•
•
•
•
clear fip-snooping statistics
debug fip-snooping
show fip-snooping config
show fip-snooping enode
show fip-snooping fcf
show fip-snooping sessions
show fip-snooping statistics
show fip-snooping system
clear fip-snooping statistics
Clear the statistics on the FIP packets snooped on all VLANs, a specified VLAN, or a specified port
interface.
Syntax
Parameters
Command Modes
clear fip-snooping statistics [interface vlan vlan-id | interface port-type port/slot | interface
port-channel port-channel-number]
vlan-id
Enter the VLAN ID of the FIP packet statistics to be cleared.
port-type port/slot
Enter the port-type and slot number of the FIP packet statistics to be cleared.
port-channelnumber]
Enter the port channel number of the FIP packet statistics to be cleared.
EXEC Privilege
FIP Snooping | 111
www.dell.com | support.dell.com
Command
History
Version 8.3.17.0
Supported on M I/O Aggregator
debug fip-snooping
Enable the debug FIP protocol specific messages.
Syntax
debug fip-snooping [all | acl | error | ifm | info | ipc | rx]
Parameters
all
Enable all the debug options.
acl
Enable for ACL specific debugs
error
Enable for Error specific debugs
ifm
Enable for IFM specific debugs
info
Enable for Information specific debugs
ipc
Enable for IPC specific debugs
rx
Enable for packet receive specific debugs
Command Modes
EXEC Privilege
Command
History
Version 8.3.17.0
Supported on M I/O Aggregator
show fip-snooping config
Displays the FIP snooping status and configured FC-MAP values.
Syntax
Command Mode
Command
History
Example
show fip-snooping config
•
•
EXEC
EXEC Privilege
Version 8.3.17.0
Figure 9-1.
Supported on M I/O Aggregator
show fip-snooping config Command Example
FTOS#show fip-snooping config
FIP Snooping Feature enabled Status: Enabled
FIP Snooping Global enabled Status: Enabled
Global FC-MAP Value: 0X0EFC00
FTOS#
112
|
FIP Snooping
show fip-snooping enode
Displays information on the ENodes in FIP-snooped sessions, including the ENode interface and MAC
address, FCF MAC address, VLAN ID, and FC-ID.
Syntax
show fip-snooping enode [enode-mac-address]
Parameters
Command Mode
enode-macaddress
•
•
Command
History
Example
Enter the MAC address of the ENodes to be displayed.
EXEC
EXEC Privilege
Version 8.3.17.0
Figure 9-2.
Supported on M I/O Aggregator
show fip-snooping enode Command Example
FTOS# show fip-snooping enode
Enode MAC
Enode Interface
----------------------d4:ae:52:1b:e3:cd
Te 0/11
Table 9-1.
FCF MAC
------54:7f:ee:37:34:40
VLAN
---100
FC-ID
----62:00:11
show fip-snooping enode Command Field Description
Field
Description
ENode MAC
MAC address of the ENode
ENode Interface
Slot/ port number of the interface connected to the ENode.
FCF MAC
MAC address of the FCF
VLAN
VLAN ID number used by the session
FC-ID
Fibre Channel session ID assigned by the FCF.
show fip-snooping fcf
Displays information on the FCFs in FIP-snooped sessions, including the FCF interface and MAC
address, FCF interface, VLAN ID, FC-MAP value, FKA advertisement period, and number of ENodes
connected.
Syntax
show fip-snooping fcf [fcf-mac-address]
Parameters
Command Mode
Command
History
fcf-mac-address
•
•
Enter the MAC address of the FCF to be displayed.
EXEC
EXEC Privilege
Version 8.3.17.0
Supported on M I/O Aggregator
FIP Snooping | 113
www.dell.com | support.dell.com
Example
Figure 9-3.
show fip-snooping fcf Command Example
FTOS# show fip-snooping fcf
FCF MAC
FCF Interface
------------------54:7f:ee:37:34:40
Po 128
VLAN
---100
FC-MAP
FKA_ADV_PERIOD
------------------0e:fc:00
4000
No. of Enodes
------------1
Table 9-2 lists the show fip-snooping fcf command field descriptions.
Table 9-2.
show fip-snooping fcf Command Field Descriptions
Field
Description
FCF MAC
MAC address of the FCF
FCF Interface
Slot/port number of the interface to which the FCF is connected.
VLAN
VLAN ID number used by the session
FC-MAP
FC-Map value advertised by the FCF.
FKA_ADV_PERIOD
Period of time (in milliseconds) during which FIP keep-alive
advertisements are transmitted.
No of ENodes
Number of ENodes connected to the FCF
show fip-snooping sessions
Displays information on FIP-snooped sessions on all VLANs or a specified VLAN, including the
ENode interface and MAC address, the FCF interface and MAC address, VLAN ID, FCoE MAC
address and FCoE session ID number (FC-ID), worldwide node name (WWNN) and the worldwide
port name (WWPN).
Syntax
show fip-snooping sessions [interface vlan vlan-id]
Parameters
Command Mode
Command
History
114
|
FIP Snooping
vlan-id
•
•
Enter the vlan-id of the specified VLAN to be displayed.
EXEC
EXEC Privilege
Version 8.3.17.0
Supported on M I/O Aggregator
Example
Figure 9-4.
show fip-snooping sessions Command Example
FTOS#show fip-snooping sessions
Enode MAC
Enode Intf
FCF MAC
FCF Intf VLAN FCoE MAC
FC-ID
00:0e:1e:0c:54:a6 Te 0/14 00:05:73:f2:4f:ae Po128 100 0e:fc:00:9a:00:27 9a:00:27 20:01:00:0e:1e:0c:54:a6
00:0e:1e:06:01:5e Te 0/16 00:05:73:f2:4f:af Po128 100 0e:fc:00:9a:01:18 9a:01:18 20:01:00:0e:1e:06:01:5
Port WWNN
20:00:00:0e:1e:0c:54:a6
20:00:00:0e:1e:0c:54:a6
Table 9-3 lists the show fip-snooping sessions command field descriptions.
Table 9-3.
show fip-snooping sessions Command Field Description
Field
Description
ENode MAC
MAC address of the ENode.
ENode Interface
Slot/ port number of the interface connected to the ENode.
FCF MAC
MAC address of the FCF.
FCF Interface
Slot/ port number of the interface to which the FCF is connected.
VLAN
VLAN ID number used by the session.
FCoE MAC
MAC address of the FCoE session assigned by the FCF.
FC-ID
Fibre Channel ID assigned by the FCF.
Port WWPN
Worldwide port name of the CNA port.
Port WWNN
Worldwide node name of the CNA port.
show fip-snooping statistics
Displays statistics on the FIP packets snooped on all interfaces, including VLANs, physical ports, and
port channels.
Syntax
show fip-snooping statistics [interface vlan vlan-id | interface port-type port/slot | interface
port-channel port-channel-number]
Parameters
Command Mode
•
•
vlan-id
Enter the VLAN ID of the FIP packet statistics to be displayed.
port-type port/slot
Enter the port-type and slot number of the FIP packet statistics to be displayed.
port-channelnumber]
Enter the port channel number of the FIP packet statistics to be displayed.
EXEC
EXEC Privilege
FIP Snooping | 115
www.dell.com | support.dell.com
Command
History
Example
Version 8.3.17.0
Figure 9-5.
Supported on M I/O Aggregator
show fip-snooping statistics Command Example
FTOS# show fip-snooping statistics interface vlan 100
Number of Vlan Requests
Number of Vlan Notifications
Number of Multicast Discovery Solicits
Number of Unicast Discovery Solicits
Number of FLOGI
Number of FDISC
Number of FLOGO
Number of Enode Keep Alive
Number of VN Port Keep Alive
Number of Multicast Discovery Advertisement
Number of Unicast Discovery Advertisement
Number of FLOGI Accepts
Number of FLOGI Rejects
Number of FDISC Accepts
Number of FDISC Rejects
Number of FLOGO Accepts
Number of FLOGO Rejects
Number of CVL
Number of FCF Discovery Timeouts
Number of VN Port Session Timeouts
Number of Session failures due to Hardware Config
FTOS(conf)#
:0
:0
:2
:0
:2
:16
:0
:9021
:3349
:4437
:2
:2
:0
:16
:0
:0
:0
:0
:0
:0
:0
FTOS# show fip-snooping statistics int tengigabitethernet 0/11
Number of Vlan Requests
:1
Number of Vlan Notifications
:0
Number of Multicast Discovery Solicits
:1
Number of Unicast Discovery Solicits
:0
Number of FLOGI
:1
Number of FDISC
:16
Number of FLOGO
:0
Number of Enode Keep Alive
:4416
Number of VN Port Keep Alive
:3136
Number of Multicast Discovery Advertisement
:0
Number of Unicast Discovery Advertisement
:0
Number of FLOGI Accepts
:0
Number of FLOGI Rejects
:0
Number of FDISC Accepts
:0
Number of FDISC Rejects
:0
Number of FLOGO Accepts
:0
Number of FLOGO Rejects
:0
Number of CVL
:0
Number of FCF Discovery Timeouts
:0
Number of VN Port Session Timeouts
:0
Number of Session failures due to Hardware Config
:0
116
|
FIP Snooping
Figure 9-6.
show fip-snooping statistics (port channel) Command Example
FTOS# show fip-snooping statistics interface port-channel 22
Number of Vlan Requests
:0
Number of Vlan Notifications
:2
Number of Multicast Discovery Solicits
:0
Number of Unicast Discovery Solicits
:0
Number of FLOGI
:0
Number of FDISC
:0
Number of FLOGO
:0
Number of Enode Keep Alive
:0
Number of VN Port Keep Alive
:0
Number of Multicast Discovery Advertisement
:4451
Number of Unicast Discovery Advertisement
:2
Number of FLOGI Accepts
:2
Number of FLOGI Rejects
:0
Number of FDISC Accepts
:16
Number of FDISC Rejects
:0
Number of FLOGO Accepts
:0
Number of FLOGO Rejects
:0
Number of CVL
:0
Number of FCF Discovery Timeouts
:0
Number of VN Port Session Timeouts
:0
Number of Session failures due to Hardware Config
:0
Table 9-4 lists the show fip-snooping statistics command field descriptions.
Table 9-4.
show fip-snooping statistics Command Fields Description
Field
Description
Number of Vlan Requests
Number of FIP-snooped VLAN request frames received on the
interface
Number of VLAN Notifications
Number of FIP-snooped VLAN notification frames received on
the interface.
Number of Multicast Discovery
Solicits
Number of FIP-snooped multicast discovery solicit frames
received on the interface
Number of Unicast Discovery
Solicits
Number of FIP-snooped unicast discovery solicit frames
received on the interface
Number of FLOGI
Number of FIP-snooped FLOGI request frames received on the
interface
Number of FDISC
Number of FIP-snooped FDISC request frames received on the
interface
Number of FLOGO
Number of FIP-snooped FLOGO frames received on the
interface
Number of ENode Keep Alives
Number of FIP-snooped ENode keep-alive frames received on
the interface
Number of VN Port Keep Alives
Number of FIP-snooped VN port keep-alive frames received on
the interface
Number of Multicast Discovery
Advertisements
Number of FIP-snooped multicast discovery advertisements
received on the interface
Number of Unicast Discovery
Advertisements
Number of FIP-snooped unicast discovery advertisements
received on the interface
FIP Snooping | 117
www.dell.com | support.dell.com
Table 9-4.
show fip-snooping statistics Command Fields Description (continued)
Field
Description
Number of FLOGI Accepts
Number of FIP FLOGI accept frames received on the interface
Number of FLOGI Rejects
Number of FIP FLOGI reject frames received on the interface
Number of FDISC Accepts
Number of FIP FDISC accept frames received on the interface
Number of FDISC Rejects
Number of FIP FDISC reject frames received on the interface
Number of FLOGO Accepts
Number of FIP FLOGO accept frames received on the interface
Number of FLOGO Rejects
Number of FIP FLOGO reject frames received on the interface
Number of CVLs
Number of FIP clear virtual link frames received on the
interface
Number of FCF Discovery
Timeouts
Number of FCF discovery timeouts that occurred on the
interface
Number of VN Port Session
Timeouts
Number of VN port session timeouts that occurred on the
interface
Number of Session failures due to
Hardware Config
Number of session failures due to hardware configuration that
occurred on the interface
show fip-snooping system
Displays information on the status of FIP snooping on the switch (enabled or disabled), including the
number of FCoE VLANs, FCFs, ENodes, and currently active sessions.
Syntax
Command Mode
Command
History
Example
show fip-snooping system
•
•
EXEC
EXEC Privilege
Version 8.3.17.0
Figure 9-7.
Supported on M I/O Aggregator
show fip-snooping system Command Example
FTOS# show fip-snooping system
Global Mode
FCOE VLAN List (Operational)
FCFs
Enodes
Sessions
118
|
FIP Snooping
:
:
:
:
:
Enabled
1, 100
1
2
17
10
Internet Group Management Protocol (IGMP)
IGMP Commands
The Dell Force10 operating software (FTOS) supports internet group management protocol (IGMP)
snooping version 2 and 3 on all Dell Force10 systems:
•
•
•
•
•
•
clear ip igmp groups
debug ip igmp
ip igmp snooping flood
show ip igmp groups
show ip igmp interface
show ip igmp snooping mrouter
Important Points to Remember
•
•
•
•
•
•
•
•
•
•
FTOS supports version 1, version 2, and version 3 hosts.
FTOS IGMP snooping implementation is based on IP multicast address (not based on Layer 2
multicast mac-address) and the IGMP snooping entries are in Layer 3 flow table not in Layer 2
forwarding information base (FIB).
FTOS IGMP snooping implementation is based on draft-ietf-magma-snoop-10.
IGMP snooping is supported on all M I/O Aggregator stack members.
IGMP snooping is enabled by default on the switch.
A maximum of 8k groups and 4k virtual local area networks (VLAN) are supported.
IGMP snooping is not supported on default VLAN interface.
Flooding of unregistered multicast traffic is enabled by default.
Queries are not accepted from the server side ports and are only accepted from the uplink LAG.
Reports and Leaves are flooded by default to the uplink LAG irrespective of whether it is an
mrouter port or not.
Internet Group Management Protocol (IGMP) | 119
www.dell.com | support.dell.com
clear ip igmp groups
Clear entries from the group cache table.
Syntax
Parameters
clear ip igmp groups [group-address | interface]
group-address
(OPTIONAL) Enter the IP multicast group address in dotted decimal format.
interface
(OPTIONAL) Enter the interface type and slot/port information:
For a VLAN interface enter the keyword vlan followed by a number from 1 to 4094.
Command Modes
EXEC Privilege
Command
History
Version 8.3.17.0
Supported on M I/O Aggregator
debug ip igmp
Enable debugging of IGMP packets.
Syntax
debug ip igmp [group address | interface]
To disable IGMP debugging, enter the no ip igmp command. To disable all debugging, enter the undebug
all command.
Defaults
Parameters
Disabled
group-address
(OPTIONAL) Enter the IP multicast group address in dotted decimal format.
interface
(OPTIONAL) Enter the interface type and slot/port information:
For a VLAN interface enter the keyword vlan followed by a number from 1 to 4094.
Command Modes
EXEC Privilege
Command
History
Version 8.3.17.0
Supported on M I/O Aggregator
ip igmp snooping flood
This command controls the flooding behavior of unregistered multicast data packets.When flooding is
disabled, unregistered multicast data traffic is forwarded to only multicast router ports in a VLAN. If
there is no multicast router port in a VLAN, unregistered multicast data traffic is dropped.
Syntax
Defaults
Command Modes
Command
History
120
|
ip igmp snooping flood
Enabled
CONFIGURATION
Version 8.3.17.0
Supported on M I/O Aggregator
Internet Group Management Protocol (IGMP)
show ip igmp groups
View the IGMP groups.
Syntax
Parameters
Command Modes
show ip igmp groups [group-address [detail] | detail | interface [group-address [detail]]]
group-address
(OPTIONAL) Enter the group address in dotted decimal format to view information on
that group only.
interface
(OPTIONAL) Enter the interface type and slot/port information:
For a VLAN interface enter the keyword vlan followed by a number from 1 to 4094.
detail
(OPTIONAL) Enter the keyword detail to display the IGMPv3 source
information.
EXEC
EXEC Privilege
Command
History
Example
Version 8.3.17.0
Figure 10-1.
Supported on M I/O Aggregator
show ip igmp snooping mrouter Command Example
FTOS#show ip igmp groups
Total Number of Groups: 5
IGMP Connected Group Membership
Group Address
Interface
Expires
Last Reporter
225.0.0.0
Vlan 100
00:02:04 3.0.0.51
Member Ports: Po 2
225.0.0.1
Vlan 100
00:02:04 3.0.0.51
Member Ports: Po 2
225.0.0.2
Vlan 100
00:02:04 3.0.0.51
Member Ports: Po 2
225.0.0.3
Vlan 100
00:02:04 3.0.0.51
Member Ports: Po 2
225.0.0.4
Vlan 100
00:02:04 3.0.0.51
Member Ports: Po 2
Mode
Uptime
IGMPv2
00:00:05
IGMPv2
00:00:05
IGMPv2
00:00:05
IGMPv2
00:00:05
IGMPv2
00:00:05
Table 10-1. show ip igmp groups Command Example Fields
Field
Description
Group Address
Lists the multicast address for the IGMP group.
Interface
Lists the interface type, slot and port number.
Mode
Displays the IGMP version used.
Uptime
Displays the amount of time the group has been operational.
Expires
Displays the amount of time until the entry expires.
Last Reporter
Displays the IP address of the last host to be a member of the
IGMP group.
Member Ports
Indicates the member ports of the port channel. If the port channel
is VLT, an asterisk (*) after the port channel number indicates the
port channel is locally down and that a remote VLT port is up.
Internet Group Management Protocol (IGMP) | 121
www.dell.com | support.dell.com
show ip igmp interface
View information on the interfaces participating in IGMP.
Syntax
Parameters
show ip igmp interface [interface]
interface
(OPTIONAL) Enter any of the following keywords and slot/port or number to clear
counters from a specified interface:
•
•
•
Command Modes
For a Port Channel interface, enter the keyword port-channel followed by a
number. Range: 1-128
For a 10-Gigabit Ethernet interface, enter the keyword TenGigabitEthernet
followed by the slot/port information.
For a VLAN, enter the keyword vlan followed by a number from 1 to 4094.
EXEC
EXEC Privilege
Command
History
Example
Version 8.3.17.0
Figure 10-2.
Supported on M I/O Aggregator
show ip igmp snooping mrouter Command Example
FTOS#show ip igmp interface
Vlan 2 is up, line protocol is down
Inbound IGMP access group is not set
Interface IGMP group join rate limit is not set
IGMP snooping is enabled on interface
IGMP Snooping query interval is 60 seconds
IGMP Snooping querier timeout is 125 seconds
IGMP Snooping last member query response interval is 1000 ms
IGMP snooping fast-leave is disabled on this interface
IGMP snooping querier is disabled on this interface
Vlan 3 is up, line protocol is down
Inbound IGMP access group is not set
Interface IGMP group join rate limit is not set
IGMP snooping is enabled on interface
IGMP Snooping query interval is 60 seconds
IGMP Snooping querier timeout is 125 seconds
IGMP Snooping last member query response interval is 1000 ms
IGMP snooping fast-leave is disabled on this interface
IGMP snooping querier is disabled on this interface
--More--
show ip igmp snooping mrouter
Displays multicast router interfaces.
Syntax
Parameters
122
|
show ip igmp snooping mrouter [vlan number]
vlan number
Enter the keyword vlan followed by the vlan number.
Range: 1 to 4094
Internet Group Management Protocol (IGMP)
Command Modes
EXEC
EXEC Privilege
Command
History
Example
Version 8.3.17.0
Figure 10-3.
Supported on M I/O Aggregator
show ip igmp snooping mrouter Command Example
FTOS#show ip igmp snooping mrouter vlan 2
Interface Router Ports
Vlan 2
Po 128
FTOS#
Related
Commands
show ip igmp groups
Use this IGMP command to view groups.
Internet Group Management Protocol (IGMP) | 123
www.dell.com | support.dell.com
124
|
Internet Group Management Protocol (IGMP)
11
\
Interfaces
Overview
This chapter defines interface commands and is divided into the following sections:
•
•
•
Port Interface Commands
Port Channel Commands
Time Domain Reflectometer (TDR) Commands
Port Interface Commands
The following commands are for physical, loopback, and null interfaces:
•
•
•
•
•
•
•
•
•
•
•
•
•
•
•
•
•
•
•
•
•
•
clear counters
clear mac-address-table dynamic
interface range
interface range macro (define)
interface range macro name
interface vlan
keepalive
monitor interface
name
show config (INTERFACE mode)
show config (from INTERFACE RANGE mode)
show config (from INTERFACE VLAN mode)
show interfaces configured
show interfaces description
show interfaces stack-unit
show interfaces port-channel
show interfaces status
show interfaces switchport
show range
show vlan
shutdown
speed (for 1000/10000/auto interfaces)
Interfaces | 125
www.dell.com | support.dell.com
Port Channel Commands
A link aggregation group (LAG) is a group of links that appear to a MAC client as if they were a single
link according to IEEE 802.3ad. In FTOS, a LAG is referred to as a Port Channel.
Table 11-1.
Port Channel Limits
Platform
Maximum Port Channel
IDs
Maximum Members per Port
Channel
128
16
M I/O Aggregator
Because each port can be assigned to only one Port Channel, and each Port Channel must have at least
one port, some of those nominally available Port Channels might have no function because they could
have no members if there are not enough ports installed. In the M I/O Aggregator, those ports could be
provided by stack members.
The commands in this section are specific to Port Channel interfaces:
•
•
•
•
•
auto vlan
group
monitor interface
show config (from INTERFACE RANGE mode)
show interfaces port-channel
Note: The FTOS implementation of LAG or Port Channel requires that you configure a LAG
on both switches manually. For information on FTOS Link Aggregation Control Protocol
(LACP) for dynamic LAGs, refer to Chapter 14, Link Aggregation Control Protocol (LACP).
For more information on configuring and using Port Channels, refer to the Dell PowerEdge
Configuration Guide for the M I/O Aggregator.
Time Domain Reflectometer (TDR) Commands
Time domain reflectormeter (TDR) is useful for troubleshooting an interface that is not establishing a
link; either it is flapping or not coming up at all. TDR detects open or short conditions of copper cables
on 100/1000/10GBase-T modules.
•
•
tdr-cable-test
show tdr
Important Points to Remember
•
•
•
•
126
|
Interfaces
The interface and port must be enabled (configured—see the interface command) before running
TDR. An error message is generated if you have not enabled the interface.
The interface on the far-end device must be shut down before running TDR.
Because TDR is an intrusive test on an interface that is not establishing a link, do not run TDR on
an interface that is passing traffic.
When testing between two devices, do not run the test on both ends of the cable.
Virtual LAN (VLAN) Commands
The following commands configure and monitor virtual local area networks (VLANs). VLANs are a
virtual interface and use many of the same commands as physical interfaces.
You can configure an IP address and Layer 3 protocols on a VLAN called Inter-VLAN routing. FTP,
TFTP, ACLs, and SNMP are not supported on a VLAN.
Occasionally, while sending broadcast traffic over multiple Layer 3 VLANs, the virtual router
redundancy protocol (VRRP) state of a VLAN interface may continually switch between Master and
Backup.
•
•
•
•
•
•
•
auto vlan
default vlan-id
name
show config (from INTERFACE VLAN mode)
show vlan
vlan tagged
vlan untagged
auto vlan
Change the port to auto or admin vlan mode (enable or disable all auto VLANs).
Syntax
auto vlan <cr>
To remove membership from 4K VLAN, use the no auto vlan command.
Parameters
Defaults
Command Modes
Usage
Information
Command
History
description
Enter a text string description to identify the VLAN (80 characters maximum).
none
INTERFACE
The auto vlan command adds the port as untagged to default vlan and tagged to all other 4K-1 VLAN.
Version 8.3.17.0
Supported on M I/O Aggregator
clear counters
Clear the counters used in the show interfaces commands for all VRRP groups, VLANs, and physical
interfaces, or selected ones.
Syntax
clear counters interface
Interfaces | 127
www.dell.com | support.dell.com
Parameters
interface
(OPTIONAL) Enter any of the following keywords and slot/port or number to clear
counters from a specified interface:
•
•
•
Defaults
Without a specific interface specified, the command clears all interface counters.
Command Modes
EXEC Privilege
Command
History
Version 8.3.17.0
Example
For the management interface on the stack-unit, enter the keyword
managementethernet followed by slot/port information. The slot and port
range is 0.
For a 10-Gigabit Ethernet interface, enter the keyword TenGigabitEthernet
followed by the slot/port information.
For a Port Channel interface, enter the keyword port-channel followed by a
number. Range: 1-128
Figure 11-1.
Supported on M I/O Aggregator
clear counters Command Example
FTOS#clear counters
Clear counters on all interfaces [confirm]
clear mac-address-table dynamic
Clear the MAC address table of all MAC addresses learned dynamically.
Syntax
Parameters
clear mac-address-table dynamic {interface tengigabitethernet slot/port-id}
interface
Enter the keyword interface range and one of the interfaces — slot/port,
port-channel or VLAN number. Select the range of interfaces for bulk configuration.
You can enter up to six comma separated ranges—spaces are not required between the
commas. Comma-separated ranges can include VLANs, port-channels and physical
interfaces.
Slot/Port information must contain a space before and after the dash. For example,
interface range tengigabitethernet 0/1 - 5 is valid; interface range
tengigabitethernet 0/1-5 is not valid.
• For a 10-Gigabit Ethernet interface, enter the keyword TenGigabitEthernet
followed by the slot/port information.
128
Command Modes
EXEC Privilege
Command
History
Version 8.3.17.0
|
Interfaces
Supported on M I/O Aggregator
default vlan-id
Set the default VLAN-id.
Syntax
default vlan-id <vlan-id>
To set the default VLAN-id, use the no default vlan-id command.
Defaults
Command Modes
none
CONFIGURATION
Command
History
Version 8.3.17.0
Related
Commands
Supported on M I/O Aggregator
show vlan
Displays VLAN configuration.
description
Assign a descriptive text string to the interface.
Syntax
description desc_text
To delete a description, enter no description.
Parameters
Defaults
Command Modes
desc_text
No description is defined.
INTERFACE
Command
History
Usage
Information
Version 8.3.17.0
•
•
•
•
Related
Commands
Enter a text string up to 240 characters long.
Supported on M I/O Aggregator
Spaces between characters are not preserved after entering this command unless you enclose the
entire description in quotation marks (“desc_text”).
Entering a text string after the default vlan-id command overwrites any previous text string
configured as the description.
The show tdr and default vlan-id commands are the only commands that you can configure on an
interface that is a member of a port-channel.
Use the show interfaces description command to display descriptions configured for each
interface.
show interfaces description
Displays the description field of interfaces.
Interfaces | 129
www.dell.com | support.dell.com
group
Group two LAGs in a supergroup (“fate-sharing group” or “failover group”).
Syntax
group group_number port-channel number port-channel number
To remove an existing LAG supergroup, use the no group group_number command.
Parameters
Defaults
Command Modes
Command
History
Example
group_number
Enter an integer from 1 to 32 that will uniquely identify this LAG
fate-sharing group.
port-channel number
Enter the keyword port-channel followed by an existing LAG number.
Enter this keyword/variable combination twice, identifying the two LAGs to
be paired.
none
PORT-CHANNEL FAILOVER-GROUP (conf-po-failover-grp)
Version 8.3.17.0
Figure 11-2.
Supported on M I/O Aggregator
group Command Example
FTOS(conf)#port-channel failover-group
FTOS(conf-po-failover-grp)#group 1 port-channel 1 port-channel 2
FTOS(conf-po-failover-grp)#
Related
Commands
show interfaces port-channel
Displays information on configured Port Channel groups.
interface range
This command permits configuration of a range of interfaces to which subsequent commands are
applied (bulk configuration). Using the interface range command, you can enter identical commands
for a range of interface.
Syntax
Parameters
interface range interface, interface,...
interface,
interface,...
Enter the keyword interface range and one of the interfaces — slot/port,
port-channel or VLAN number. Select the range of interfaces for bulk configuration.
You can enter up to six comma separated ranges—spaces are not required between the
commas. Comma-separated ranges can include VLANs, port-channels and physical
interfaces.
Slot/Port information must contain a space before and after the dash. For example,
interface range tengigabitethernet 0/1 - 5 is valid; interface range
tengigabitethernet 0/1-5 is not valid.
• For a 10-Gigabit Ethernet interface, enter the keyword TenGigabitEthernet
•
Defaults
Command Modes
130
|
Interfaces
none
CONFIGURATION
followed by the slot/port information.
For a VLAN, enter the keyword vlan followed by a number from 1 to 4094.
Command
History
Usage
Information
Version 8.3.17.0
When creating an interface range, interfaces appear in the order they are entered; they are not sorted.
The command verifies that interfaces are present (physical) or configured (logical). Important things to
remember:
•
•
•
•
•
Example
Supported on M I/O Aggregator
Bulk configuration is created if at least one interface is valid.
Non-existing interfaces are excluded from the bulk configuration with a warning message.
The interface range prompt includes interface types with slot/port information for valid interfaces.
The prompt allows for a maximum of 32 characters. If the bulk configuration exceeds 32
characters, it is represented by an ellipsis ( ... ).
When the interface range prompt has multiple port ranges, the smaller port range is excluded from
the prompt.
If overlapping port ranges are specified, the port range is extended to the smallest start port and the
biggest end port.
Figure 11-3.
Bulk Configuration Warning Message
FTOS(conf)#interface range tengig 2/0 - 1 , tengig 10/0 , tengig 3/0
, fa 0/0
% Warning: Non-existing ports (not configured) are ignored by
interface-range
Example
Figure 11-4.
Interface Range prompt with Multiple Ports
FTOS(conf)#interface range tengig 2/0 - 23 , tengig 2/1 - 10
FTOS(conf-if-range-tengig-2/0-23#
Example
Figure 11-5.
Interface Range prompt Overlapping Port Ranges
FTOS(conf)#interface range tengig 2/1 - 11 , tengig 2/1 - 23
FTOS(conf-if-range-tengig-2/1-23#
Only VLAN and port-channel interfaces created using the interface vlan and vlan tagged commands
can be used in the interface range command.
Use the show running-config command to display the VLAN and port-channel interfaces. VLAN or
port-channel interfaces that are not displayed in the show running-config command cannot be used
with the bulk configuration feature of the interface range command. You cannot create virtual
interfaces (VLAN, Port-channel) using the interface range command.
Note: If a range has VLAN, physical, and port-channel interfaces, only commands related to
physical interfaces can be bulk configured. To configure commands specific to VLAN or
port-channel, only those respective interfaces should be configured in a particular range.
Interfaces | 131
www.dell.com | support.dell.com
Figure 11-6 is an example of a single range bulk configuration.
Example
Figure 11-6.
Single Range Bulk Configuration
FTOS(conf)# interface range tengigabitethernet 5/1 - 23
FTOS(conf-if-range)# no shutdown
FTOS(conf-if-range)#
Figure 11-7 shows how to use commas to add different interface types to the range enabling all Ten
Gigabit Ethernet interfaces in the range 5/1 to 5/23 and both Ten Gigabit Ethernet interfaces 1/1 and
1/2.
Example
Figure 11-7.
Ethernet
Multiple Range Bulk Configuration Gigabit Ethernet and Ten Gigabit
FTOS(conf-if)# interface range tengigabitethernet 5/1 - 23, tengigabitethernet 1/1 - 2
FTOS(conf-if-range)# no shutdown
FTOS(conf-if-range)#
Figure 11-8 shows how to use commas to add VLAN and port-channel interfaces to the range.
Example
Figure 11-8.
Multiple Range Bulk Configuration with VLAN and port channel
FTOS(conf-if)# interface range tengigabitethernet 5/1 - 23, tengigabitethernet 1/1 – 2,
Vlan 2 – 100 , Port 1 – 25
FTOS(conf-if-range)# no shutdown
FTOS(conf-if-range)#
Related
Commands
show config (from INTERFACE
RANGE mode)
Shows the bulk configuration interfaces.
show interfaces status
Displays a summary of interface information.
interface range macro (define)
Defines a macro for an interface-range.
interface range macro (define)
Defines a macro for an interface range and then saves the macro in the running configuration.
Syntax
Parameters
define interface range macro name interface , interface , ...
name
Enter up to 16 characters for the macro name.
interface , interface ,...
Enter the interface keyword (see below) and one of the interfaces slot/port,
port-channel or VLAN numbers. Select the range of interfaces for bulk
configuration. You can enter up to six comma separated ranges—spaces are
not required between the commas. Comma-separated ranges can include
VLANs, port-channels and physical interfaces.
Slot/Port information must contain a space before and after the dash. For
example, interface range tengigabitethernet 0/1 - 5 is valid;
interface range tengigabitethernet 0/1-5 is not valid.
•
•
132
|
Interfaces
For a 10-Gigabit Ethernet interface, enter the keyword
TenGigabitEthernet followed by the slot/port information.
For a VLAN, enter the keyword vlan followed by a number from 1 to
4094.
Defaults
Command Modes
Command
History
Usage
Information
Example
none
CONFIGURATION
Version 8.3.17.0
Supported on M I/O Aggregator
Figure 11-9 is an example of how to define an interface range macro named test. To display the macro
definition, execute the show running-config command.
Figure 11-9.
define interface-range macro Command Example
FTOS(conf)# define interface-range test tengigabitethernet 0/0 - 3 ,
tengigabitethernet 5/0 - 47 , tengigabitethernet 13/0 - 89
FTOS# show running-config | grep define
define interface-range test tengigabitethernet 0/0 - 3 , tengigabitethernet 5/0 47 , tengigabitethernet 13/0 - 89
FTOS(conf)#interface range macro test
FTOS(conf-if-range-te-0/0-3,te-5/0-47,te-13/0-89)#
Related
Commands
group
Configures a range of command (bulk configuration)
interface range macro name
Runs an interface range macro.
interface range macro name
Run the interface-range macro to automatically configure the pre-defined range of interfaces.
Syntax
Parameters
Defaults
Command Modes
Command
History
Usage
Information
Example
interface range macro name
name
Enter the name of an existing macro.
none
CONFIGURATION
Version 8.3.17.0
Supported on M I/O Aggregator
Figure 11-10 runs the macro named test that was defined earlier.
Figure 11-10.
interface-range macro Command Example
FTOS(conf)#interface range macro test
FTOS(conf-if-range-te-0/0-3,tengig-5/0-47,tengig-13/0-89)#
Related
Commands
group
Configures a range of command (bulk configuration)
interface range macro (define)
Defines a macro for an interface range (bulk configuration)
Interfaces | 133
www.dell.com | support.dell.com
interface vlan
Configure the default VLAN to enable Static or DCHP IP configuration
Syntax
interface vlan vlan-id
To delete a VLAN, use the no interface vlan vlan-id command.
Parameters
Defaults
Command Modes
Command
History
Usage
Information
Example
vlan-id
Enter 1 for the default VLAN.
Not configured
CONFIGURATION
Version 8.3.17.0
Supported on M I/O Aggregator
For more information about VLANs and the commands to configure them, refer to Virtual LAN
(VLAN) Commands.
Figure 11-11.
interface vlan Command Example
FTOS(conf)#int vlan 3
FTOS(conf-if-vl-3)#
Related
Commands
show vlan
Displays the current VLAN configuration on the switch.
vlan tagged
Adds a Layer 2 interface to a VLAN as a tagged interface.
vlan untagged
Adds a Layer 2 interface to a VLAN as an untagged interface.
keepalive
Keep the interface alive when it is not transmitting data.
Syntax
Defaults
Command Modes
Command
History
Usage
Information
134
|
Interfaces
keepalive
Enabled
INTERFACE
Version 8.3.17.0
Supported on M I/O Aggregator
When you configure keepalive, the system keeps the link is up even if the link is not active at the time.
monitor interface
Monitor counters on a single interface or all interfaces on a stack unit. The screen is refreshed every 5
seconds and the CLI prompt disappears.
Syntax
monitor interface [interface]
To disable monitoring and return to the CLI prompt, press the q key.
Parameters
interface
(OPTIONAL) Enter the following keywords and slot/port or number information:
•
•
•
Command Modes
For the management port, enter the keyword managementethernet followed by
the slot (0-1) and the port (0).
For a 10-Gigabit Ethernet interface, enter the keyword TenGigabitEthernet
followed by the slot/port information.
For a Port Channel interface, enter the keyword port-channel followed by a number.
Range: 1-128
EXEC
EXEC Privilege
Command
History
Usage
Information
Example
Version 8.3.17.0
Supported on M I/O Aggregator
The delta column displays changes since the last screen refresh.
Figure 11-12.
systest-3
monitor Command Example of a Single Interface
Monitor time: 00:00:06
Refresh Intvl.: 2s
Time: 03:26:26
Interface: tengig 0/3, Enabled, Link is Up, Linespeed is 1000 Mbit
Traffic statistics:
Input bytes:
Output bytes:
Input packets:
Output packets:
64B packets:
Over 64B packets:
Over 127B packets:
Over 255B packets:
Over 511B packets:
Over 1023B packets:
Error statistics:
Input underruns:
Input giants:
Input throttles:
Input CRC:
Input IP checksum:
Input overrun:
Output underruns:
Output throttles:
m
l
T
q
-
Table 11-2.
Current
9069828
606915800
54001
9401589
67
49166
350
1351
286
2781
43
43
0
0
0
0
0
0
0
0
0
0
0
0
0
0
0
0
0
0
0
0
0
0
0
0
Change mode
Page up
Increase refresh interval
Quit
Rate
Bps
Bps
pps
pps
pps
pps
pps
pps
pps
pps
Delta
86
86
1
1
0
1
0
0
0
0
pps
pps
pps
pps
pps
pps
pps
pps
0
0
0
0
0
0
0
0
c - Clear screen
a - Page down
t - Decrease refresh interval
monitor Command Menu Options
Key
Description
systest-3
Displays the host name assigned to the system.
monitor time
Displays the amount of time since the monitor interface command was entered.
time
Displays the amount of time the chassis is up (since last reboot).
Interfaces | 135
www.dell.com | support.dell.com
Table 11-2.
monitor Command Menu Options
Key
Description
m
Change the view from a single interface to all interfaces on the stack unit or visa-versa.
c
Refresh the view.
b
Change the counters displayed from Packets on the interface to Bytes.
r
Change the [delta] column from change in the number of packets/bytes in the last interval to
rate per second.
l
Change the view to next interface on the stack unit, or if in the stack unit mode, the next
stack unit in the chassis.
a
Change the view to the previous interface on the stack unit, or if the stack unit mode, the
previous stack unit in the chassis.
T
Increase the screen refresh rate.
t
Decrease the screen refresh rate.
q
Return to the CLI prompt.
name
Assign a name to the Default VLAN.
Syntax
name vlan-name
To remove the name from the VLAN, use the no name command.
Parameters
Defaults
Command Modes
Command
History
Usage
Information
vlan-name
Enter up to 32 characters as the name of the VLAN.
Not configured.
INTERFACE VLAN
Version 8.3.17.0
Supported on M I/O Aggregator
This CLI applies only to the Default VLAN.
To display information about a named VLAN, enter the show vlan command with the name parameter
or the show interfaces description command.
Related
Commands
136
|
Interfaces
default vlan-id
Assigns a descriptive text string to the interface.
interface vlan
Configures a VLAN.
show vlan
Displays the current VLAN configurations on the switch.
negotiation auto
Enable auto-negotiation on an interface.
Syntax
negotiation auto
To disable auto-negotiation, enter no negotiation auto.
Defaults
Command Modes
Enabled
INTERFACE
Command
History
Usage
Information
Version 8.3.17.0
Supported on M I/O Aggregator
The no negotiation auto command is only available if you first manually set the speed of a port to
10Mbits or 100Mbits.
The negotiation auto command provides a mode option for configuring an individual port to
forced-master/forced slave once auto-negotiation is enabled
Figure 11-13.
negotiation auto Master/Slave Example
FTOS(conf)# int tengig 0/0
FTOS(conf-if)#neg auto
FTOS(conf-if-autoneg)# ?
end
Exit from configuration mode
exit
Exit from autoneg configuration mode
mode
Specify autoneg mode
no
Negate a command or set its defaults
show
Show autoneg configuration information
FTOS(conf-if-autoneg)#mode ?
forced-master
Force port to master mode
forced-slave
Force port to slave mode
FTOS(conf-if-autoneg)#
If the mode option is not used, the default setting is slave. If you do not configure forced-master or
forced slave on a port, the port negotiates to either a master or a slave state. Port status is one of the
following:
•
•
•
•
•
Forced-master
Force-slave
Master
Slave
Auto-neg Error—typically indicates that both ends of the node are configured with forced-master
or forced-slave.
Caution: Ensure that one end of your node is configured as forced-master and one is
configured as forced-slave. If both are configured the same (that is forced-master or
forced-slave), the show interfaces command will flap between an auto-neg-error and
forced-master/slave states.
You can display master/slave settings with the show interfaces command.
Interfaces | 137
www.dell.com | support.dell.com
Figure 11-14. Display Auto-negotiation Master/Slave Setting (partial)
FTOS#show interfaces configured
TenGigabitEthernet 13/18 is up, line protocol is up
Hardware is Dell Force10Eth, address is 00:01:e8:05:f7:fc
Current address is 00:01:e8:05:f7:fc
Interface index is 474791997
Internet address is 1.1.1.1/24
MTU 1554 bytes, IP MTU 1500 bytes
LineSpeed 1000 Mbit, Mode full duplex, Master
ARP type: ARPA, ARP Timeout 04:00:00
Last clearing of "show interfaces" counters 00:12:42
Queueing strategy: fifo
Input Statistics:
...
Both sides of the link must have auto-negotiation enabled or disabled for the link to come up.
The following table details the possible speed and auto-negotiation combinations for a line between
two 100/1000/10GB Base-T Ethernet interfaces.
Table 11-3.
Auto-negotiation and Link Speed Combinations
Port 1
Link Status between Port
1 and Port 2
auto-negotiation enabled* speed
1000 or auto
auto-negotiation enabled* speed
1000 or auto
Up at 1000 Mb/s
auto-negotiation enabled speed
100
auto-negotiation enabled speed
100
Up at 100 Mb/s
auto-negotiation disabled speed
100
auto-negotiation disabled speed
100
Up at 100 Mb/s
auto-negotiation disabled speed
100
auto-negotiation enabled speed
100
Down
auto-negotiation enabled* speed
1000 or auto
auto-negotiation disabled speed
100
Down
Port 0
* You cannot disable auto-negotiation when the speed is set to 1000 or auto.
Related
Commands
speed (for 1000/10000/auto
interfaces)
Set the link speed to 1000, 10000, or auto-negotiate the speed.
show config (INTERFACE mode)
Displays the interface configuration.
Syntax
Command Modes
Command
History
138
|
Interfaces
show config
INTERFACE
Version 8.3.17.0
Supported on M I/O Aggregator
Example
Figure 11-15.
show config Command Example for the INTERFACE Mode
FTOS(conf-if)#show conf
!
interface TenGigabitEthernet 1/1
no ip address
switchport
no shutdown
FTOS(conf-if)#
show config (from INTERFACE RANGE mode)
Displays the bulk configured interfaces (group).
Syntax
Command Modes
Command
History
Example
show config
CONFIGURATION INTERFACE (conf-if-range)
Version 8.3.17.0
Figure 11-16.
Supported on M I/O Aggregator
show config (Bulk Configuration) Command Example
FTOS(conf)#interface range tengigabitethernet 1/1 - 2
FTOS(conf-if-range-tengig-1/1-2)#show config
!
interface TenGigabitEthernet 1/1
no ip address
switchport
no shutdown
!
interface TenGigabitEthernet 1/2
no ip address
switchport
no shutdown
FTOS(conf-if-range-tengig-1/1-2)#
show config (from INTERFACE VLAN mode)
Displays the current configuration of the Default VLAN.
Syntax
Command Modes
Example
show config
INTERFACE VLAN
Figure 11-17.
show config Command Example for the Default VLAN
FTOS(conf-if-vl-1)#show config
!
interface Vlan 1
description a
no ip address
mtu 2500
shutdown
FTOS(conf-if-vl-1)#
Command
History
Version 8.3.17.0
Supported on M I/O Aggregator
Interfaces | 139
www.dell.com | support.dell.com
show config (from PROTOCOL LLDP mode)
Displays the LLDP configuration.
Syntax
Command Modes
Example
show config
PROTOCOL LLDP
Figure 11-18.
show config Command Example for a Selected VLAN
FTOS(conf-lldp)#show conf
!
protocol lldp
FTOS(conf-lldp)#
show interfaces
Displays information on a specific physical interface or virtual interface.
Syntax
Parameters
show interfaces interface
interface
Enter one of the following keywords and slot/port or number information:
•
•
•
•
Command Modes
For the management interface on the stack-unit, enter the keyword
managementethernet followed by slot/port information. The slot and port range is 0.
For a 10-Gigabit Ethernet interface, enter the keyword TenGigabitEthernet followed by
the slot/port information.
For a VLAN, enter the keyword vlan followed by a number from 1 to 4094.
For a Port Channel interface, enter the keyword port-channel followed by a number.
Range: 1-128
EXEC
EXEC Privilege
Command
History
Usage
Information
Version 8.3.17.0
Supported on M I/O Aggregator
Use this show interfaces command for details on a specific interface. Use the show interfaces
stack-unit command for details on all interfaces on the designated stack unit.
On the M I/O Aggregator, the show interface output displays incorrect rate information details over time
for link monitoring when the rate-interval is configured for 5 seconds. Dell Force10 recommends using
higher rate-intervals such as 15 to 299 seconds to minimize the errors seen.
Note: In the CLI output, the power value will be rounded to a 3-digit value. For receive/
transmit power that is less than 0.000, an snmp query will return the corresponding dbm value
even though the CLI displays as 0.000.
140
|
Interfaces
Note: After the counters are cleared, the line-rate continues to increase until it reaches the
maximum line rate. When the maximum line rate is reached, there will be no change in the
line-rate.
Example
Figure 11-19.
show interfaces Command Example for 10G Port
FTOS#show interfaces tengigabitethernet 2/0
TenGigabitEthernet 2/0 is up, line protocol is up
Hardware is Dell Force10Eth, address is 00:01:e8:05:f7:3a
Interface index is 100990998
Internet address is 213.121.22.45/28
MTU 1554 bytes, IP MTU 1500 bytes
LineSpeed 10000 Mbit
ARP type: ARPA, ARP Timeout 04:00:00
Last clearing of "show interfaces" counters 02:31:45
Queueing strategy: fifo
Input Statistics:
0 packets, 0 bytes
Input 0 IP Packets, 0 Vlans 0 MPLS
0 64-byte pkts, 0 over 64-byte pkts, 0 over 127-byte pkts
0 over 255-byte pkts, 0 over 511-byte pkts, 0 over 1023-byte pkts
0 symbol errors, 0 runts, 0 giants, 0 throttles
0 CRC, 0 IP Checksum, 0 overrun, 0 discarded
Output Statistics:
1 packets, 64 bytes, 0 underruns
0 Multicasts, 2 Broadcasts, 0 Unicasts
0 IP Packets, 0 Vlans, 0 MPLS
0 throttles, 0 discarded
Rate info (interval 299 seconds):
Input 00.00 Mbits/sec,
0 packets/sec, 0.00% of line-rate
Output 00.00 Mbits/sec,
0 packets/sec, 0.00% of line-rate
Time since last interface status change: 00:00:27
Table 11-4.
Lines in show interfaces Command Example
Line
Description
TenGigabitEthernet 2/0...
Displays the interface’s type, slot/port, and administrative and line protocol
status.
Hardware is...
Displays the interface’s hardware information and its assigned MAC address.
Interface index...
Displays the interface index number used by SNMP to identify the interface.
Internet address...
States whether an IP address is assigned to the interface. If one is, that address
is displayed.
MTU 1554...
Displays link and IP MTU information.
If the chassis is in Jumbo mode, this number can range from 576 to 9252.
LineSpeed
Displays the interface’s line speed.
ARP type:...
Displays the ARP type and the ARP timeout value for the interface.
Last clearing...
Displays the time when the show interfaces counters where cleared.
Queuing strategy...
States the packet queuing strategy. FIFO means first in first out.
Interfaces | 141
www.dell.com | support.dell.com
Table 11-4.
Lines in show interfaces Command Example
Line
Input Statistics:
Description
Displays all the input statistics including:
• Number of packets and bytes into the interface
• Number of packets with IP headers and VLAN tagged headers.
Note: The sum of the number of packets may not be as expected
since a VLAN tagged IP packet counts as both a VLAN packet and an
IP packet.
•
•
•
Output Statistics:
Displays output statistics sent out of the interface including:
•
•
•
142
|
Interfaces
Packet size and the number of those packets inbound to the interface
Number of symbol errors, runts, giants, and throttles packets:
symbol errors = number packets containing bad data. That is, the port
MAC detected a physical coding error in the packet.
runts = number of packets that are less than 64B
giants = packets that are greater than the MTU size
throttles = packets containing PAUSE frames
Number of CRC, IP Checksum, overrun, and discarded packets:
CRC = packets with CRC/FCS errors
IP Checksum = packets with IP Checksum errors
overrun = number of packets discarded due to FIFO overrun conditions
discarded = the sum of input symbol errors, runts, giants, CRC, IP
Checksum, and overrun packets discarded without any processing
Number of packets, bytes and underruns out of the interface
packets = total number of packets
bytes = total number of bytes
underruns = number of packets with FIFO underrun conditions
Number of Multicast, Broadcast and Unicast packets:
Multicasts = number of MAC multicast packets
Broadcasts = number of MAC broadcast packets
Unicasts = number of MAC unicast packets
Number of throttles and discards packets:
throttles = packets containing PAUSE frames
discarded = number of packets discarded without any processing
Rate information...
Estimate of the input and output traffic rate over a designated interval (30 to
299 seconds).
Traffic rate is displayed in bits, packets per second, and percent of line rate.
Time since...
Elapsed time since the last interface status change (hh:mm:ss format).
Figure 11-20.
show interfaces ManagementEthernet Command Example
FTOS#show interface managementethernet ?
0/0
Management Ethernet interface number
FTOS#show interface managementethernet 0/0
ManagementEthernet 0/0 is up, line protocol is up
Hardware is DellForce10Eth, address is 00:1e:c9:f1:00:05
Current address is 00:1e:c9:f1:00:05
Pluggable media not present
Interface index is 235159752
Internet address is 10.11.209.87/16
Mode of IP Address Assignment : MANUAL
DHCP Client-ID: mgmt001ec9f10005
Virtual-IP is not set
Virtual-IP IPv6 address is not set
MTU 1554 bytes, IP MTU 1500 bytes
LineSpeed 100 Mbit, Mode full duplex
ARP type: ARPA, ARP Timeout 04:00:00
Last clearing of "show interface" counters 5d4h57m
Queueing strategy: fifo
Input 3448753 packets, 950008323 bytes, 3442163 multicast
Received 0 errors, 0 discarded
Output 4627 packets, 814226 bytes, 0 multicast
Output 0 errors, 0 invalid protocol
Usage
Information
The interface counter “over 1023-byte pkts” does not increment for packets in the range 9216 > x <
1023.
The Management port is enabled by default (no show tdr). If necessary, use the ip address command
to assign an IP address to the Management port.
Related
Commands
show interfaces configured
Displays any interface with a non-default configuration.
show interfaces port-channel
Displays information on all interfaces on a specific stack unit.
show interfaces switchport
Displays Layer 2 information about the interfaces.
show inventory
Displays the M I/O Aggregator type, components (including media), FTOS
version including hardware identification numbers and configured
protocols.
show ip interface
Displays Layer 3 information about the interfaces.
show memory
Displays the stack unit(s) status.
show interfaces status
Displays all interfaces configured using the interface range command.
show interfaces configured
Displays any interface with a non-default configuration.
Syntax
Command Modes
show interfaces configured
EXEC
EXEC Privilege
Command
History
Version 8.3.17.0
Supported on M I/O Aggregator
Interfaces | 143
www.dell.com | support.dell.com
Example
Figure 11-21.
show interfaces configured Command Example
FTOS#show interfaces configured
TenGigabitEthernet 1/1 is up, line protocol is down(error-disabled[UFD])
Hardware is DellForce10Eth, address is 00:01:e8:00:ab:01
Current address is 00:01:e8:00:ab:01
Server Port AdminState is Down
Pluggable media not present
Interface index is 67703553
Internet address is not set
Mode of IP Address Assignment : NONE
DHCP Client-ID :tenG2580001e800ab01
MTU 12000 bytes, IP MTU 11982 bytes
LineSpeed auto
Flowcontrol rx off tx off
ARP type: ARPA, ARP Timeout 04:00:00
Last clearing of "show interface" counters 05:15:07
Queueing strategy: fifo
Input Statistics:
0 packets, 0 bytes
0 64-byte pkts, 0 over 64-byte pkts, 0 over 127-byte pkts
0 over 255-byte pkts, 0 over 511-byte pkts, 0 over 1023-byte pkts
0 Multicasts, 0 Broadcasts
0 runts, 0 giants, 0 throttles
0 CRC, 0 overrun, 0 discarded
Output Statistics:
0 packets, 0 bytes, 0 underruns
0 64-byte pkts, 0 over 64-byte pkts, 0 over 127-byte pkts
0 over 255-byte pkts, 0 over 511-byte pkts, 0 over 1023-byte pkts
0 Multicasts, 0 Broadcasts, 0 Unicasts
0 throttles, 0 discarded, 0 collisions, 0 wreddrops
Rate info (interval 299 seconds):
Input 00.00 Mbits/sec,
0 packets/sec, 0.00% of line-rate
Output 00.00 Mbits/sec,
0 packets/sec, 0.00% of line-rate
Time since last interface status change: 05:14:12
TenGigabitEthernet 1/2 is up, line protocol is down(error-disabled[UFD])
FTOS#
show interfaces description
Displays the descriptions configured on the interface.
Syntax
Parameters
show interfaces [interface] description
interface
Enter one of the following keywords and slot/port or number information:
•
•
•
Command Modes
For the management interface on the stack unit enter the keyword
ManagementEthernet followed by the slot/port information. The slot range is 0-0 and
the port range is 0.
For a 10-Gigabit Ethernet interface, enter the keyword TenGigabitEthernet followed by
the slot/port information.
For VLAN interfaces, enter the keyword vlan followed by a number from 1 to 4094.
EXEC
EXEC Privilege
Command
History
144
|
Interfaces
Version 8.3.17.0
Supported on M I/O Aggregator
Example
Figure 11-22.
show interfaces description Command Example
FTOS#show interface description
Interface
OK Status
TenGigabitEthernet 0/1
NO admin down
TenGigabitEthernet 0/2
NO admin down
TenGigabitEthernet 0/3
NO admin down
TenGigabitEthernet 0/4
NO admin down
TenGigabitEthernet 0/5
NO admin down
TenGigabitEthernet 0/6
NO admin down
TenGigabitEthernet 0/7
NO up
TenGigabitEthernet 0/8
YES up
TenGigabitEthernet 0/9
NO admin down
TenGigabitEthernet 0/10 NO admin down
TenGigabitEthernet 0/11 NO admin down
TenGigabitEthernet 0/12 NO admin down
TenGigabitEthernet 0/13 NO admin down
TenGigabitEthernet 0/14 NO admin down
TenGigabitEthernet 0/15 NO admin down
TenGigabitEthernet 0/16 YES up
TenGigabitEthernet 0/17 NO admin down
TenGigabitEthernet 0/18 NO admin down
TenGigabitEthernet 0/19 NO admin down
TenGigabitEthernet 0/20 NO admin down
TenGigabitEthernet 0/21 NO admin down
Protocol
down
down
down
down
down
down
down
up
down
down
down
down
down
down
down
up
down
down
down
down
down
Description
Table 11-5.
show interfaces description Command Example Fields
Field
Description
Interface
Displays type of interface and associated slot and port number.
OK?
Indicates if the hardware is functioning properly.
Status
States whether the interface is enabled (up) or disabled (administratively down).
Protocol
States whether IP is enabled (up) or disabled (down) on the interface.
Description Displays the description (if any) manually configured for the interface.
show interfaces port-channel
Displays information on configured Port Channel groups.
Syntax
Parameters
Command Modes
show interfaces port-channel [channel-number] [brief | description]
channel-number
For a Port Channel interface, enter the keyword port-channel followed by a
number:
Range: 1-128
brief
(OPTIONAL) Enter the keyword brief to display only the port channel
number, the state of the port channel, and the number of interfaces in the port
channel.
description
(OPTIONAL) Enter the keyword description to display interface
information with description.
EXEC
EXEC Privilege
Command
History
Version 8.3.17.0
Supported on M I/O Aggregator
Interfaces | 145
www.dell.com | support.dell.com
Example
Figure 11-23.
FTOS#show interfaces port-channel
Port-channel 1 is down, line protocol is down
Hardware address is 00:1e:c9:f1:00:05, Current address is 00:1e:c9:f1:00:05
Interface index is 1107755009
Minimum number of links to bring Port-channel up is 1
Internet address is not set
Mode of IP Address Assignment : NONE
DHCP Client-ID :lag1001ec9f10005
MTU 1554 bytes, IP MTU 1500 bytes
LineSpeed auto
Members in this channel:
ARP type: ARPA, ARP Timeout 04:00:00
Last clearing of "show interface" counters 03:28:00
Queueing strategy: fifo
Input Statistics:
0 packets, 0 bytes
0 64-byte pkts, 0 over 64-byte pkts, 0 over 127-byte pkts
0 over 255-byte pkts, 0 over 511-byte pkts, 0 over 1023-byte pkts
0 Multicasts, 0 Broadcasts
0 runts, 0 giants, 0 throttles
0 CRC, 0 overrun, 0 discarded
Output Statistics:
0 packets, 0 bytes, 0 underruns
0 64-byte pkts, 0 over 64-byte pkts, 0 over 127-byte pkts
0 over 255-byte pkts, 0 over 511-byte pkts, 0 over 1023-byte pkts
0 Multicasts, 0 Broadcasts, 0 Unicasts
0 throttles, 0 discarded, 0 collisions
Table 11-6.
146
show interfaces port-channel Command Example (EtherScale)
|
Interfaces
show interfaces port-channel Command Example Fields
Field
Description
Port-Channel 1...
Displays the LAG’s status. In the example, the status of the LAG’s LAG
fate-sharing group (“Failover-group”) is listed.
Hardware is...
Displays the interface’s hardware information and its assigned MAC
address.
Port-channel is part...
Indicates whether the LAG is part of a LAG fate-sharing group
(“Failover-group”).
Internet address...
States whether an IP address is assigned to the interface. If one is, that
address is displayed.
MTU 1554...
Displays link and IP MTU.
LineSpeed
Displays the interface’s line speed. For a port channel interface, it is the
line speed of the interfaces in the port channel.
Members in this...
Displays the interfaces belonging to this port channel.
ARP type:...
Displays the ARP type and the ARP timeout value for the interface.
Last clearing...
Displays the time when the show interfaces counters were cleared.
Queueing strategy.
States the packet queuing strategy. FIFO means first in first out.
packets input...
Displays the number of packets and bytes into the interface.
Input 0 IP packets...
Displays the number of packets with IP headers, VLAN tagged headers
and MPLS headers.
The number of packets may not add correctly because a VLAN tagged IP
packet counts as both a VLAN packet and an IP packet.
0 64-byte...
Displays the size of packets and the number of those packets entering that
interface. This information is displayed over two lines.
Received 0...
Displays the type and number of errors or other specific packets received.
This information is displayed over three lines.
Figure 11-24.
show interfaces port-channel brief Command Example
FTOS#show int po 1 brief
Codes: L - LACP Port-channel
LAG
1
FTOS#
Related
Commands
show lacp
Mode
L3
Status
down
Uptime
00:00:00
Ports
Te 0/16
(Down)
Displays the LACP matrix.
Interfaces | 147
www.dell.com | support.dell.com
show interfaces stack-unit
Displays information on all interfaces on a specific M I/O Aggregator stack member.
Syntax
Parameters
Command Modes
show interfaces stack-unit unit-number
unit-number
Enter the stack member number (0 to 5).
EXEC
EXEC Privilege
Command
History
Example
Version 8.3.17.0
Figure 11-25.
Supported on M I/O Aggregator
show interfaces status Command Example
FTOS#show interfaces stack-unit 0
TenGigabitEthernet 0/1 is down, line protocol is down
Hardware is DellForce10Eth, address is 00:1e:c9:f1:00:05
Current address is 00:1e:c9:f1:00:05
Server Port AdminState is Down
Pluggable media not present
Interface index is 34148609
Internet address is not set
Mode of IP Address Assignment : NONE
DHCP Client-ID :tenG130001ec9f10005
MTU 1554 bytes, IP MTU 1500 bytes
LineSpeed auto
Flowcontrol rx off tx off
ARP type: ARPA, ARP Timeout 04:00:00
Last clearing of "show interface" counters 5d5h24m
Queueing strategy: fifo
Input Statistics:
0 packets, 0 bytes
0 64-byte pkts, 0 over 64-byte pkts, 0 over 127-byte pkts
0 over 255-byte pkts, 0 over 511-byte pkts, 0 over 1023-byte pkts
0 Multicasts, 0 Broadcasts
0 runts, 0 giants, 0 throttles
0 CRC, 0 overrun, 0 discarded
Output Statistics:
0 packets, 0 bytes, 0 underruns
0 64-byte pkts, 0 over 64-byte pkts, 0 over 127-byte pkts
0 over 255-byte pkts, 0 over 511-byte pkts, 0 over 1023-byte pkts
0 Multicasts, 0 Broadcasts, 0 Unicasts
0 throttles, 0 discarded, 0 collisions
Rate info (interval 299 seconds):
Input 00.00 Mbits/sec,
0 packets/sec, 0.00% of line-rate
Output 00.00 Mbits/sec,
0 packets/sec, 0.00% of line-rate
Time since last interface status change: 5d5h23m
!-------------output truncated ----------------!
Related
Commands
show diag
Displays data plane and management plane input/output statistics.
show interfaces status
Displays a summary of interface information or specify a stack unit and interface to display status
information for that specific interface only.
Syntax
148
|
Interfaces
show interfaces [interface | stack-unit unit-number] status
Parameters
interface
(OPTIONAL) Enter one of the following keywords and slot/port or number
information:
•
Defaults
Command Modes
For a 10-Gigabit Ethernet interface, enter the keyword
TenGigabitEthernet followed by the slot/port information.
none
EXEC
EXEC Privilege
Command
History
Example
Version 8.3.17.0
Figure 11-26.
Supported on M I/O Aggregator
show interfaces status Command Example
FTOS#show interface status
Port
Description Status
Te 0/1
Down
Te 0/2
Down
Te 0/3
Down
Te 0/4
Down
Te 0/5
Down
Te 0/6
Down
Te 0/7
Down
Te 0/8
Up
Te 0/9
Down
Te 0/10
Down
Te 0/11
Down
Te 0/12
Down
Te 0/13
Down
Te 0/14
Down
Te 0/15
Down
Te 0/16
Up
FTOS#
Speed
Duplex
Auto
Auto
Auto
Auto
Auto
Auto
Auto
Auto
Auto
Auto
Auto
Auto
Auto
Auto
10000 Mbit Full
Auto
Auto
Auto
Auto
Auto
Auto
Auto
Auto
Auto
Auto
Auto
Auto
Auto
Auto
10000 Mbit Full
Vlan
-----------------
show interfaces switchport
Displays only virtual and physical interfaces in Layer 2 mode. This command displays the Layer 2
mode interfaces’ IEEE 802.1Q tag status and VLAN membership.
Syntax
Parameters
show interfaces switchport [interface | stack-unit unit-id ]
interface
Enter one of the following keywords and slot/port or number information:
•
•
stack-unit
unit-id
Command Modes
For a 10-Gigabit Ethernet interface, enter the keyword TenGigabitEthernet
followed by the slot/port information.
Enter the keyword backup to view the backup interface for this interface.
(OPTIONAL) Enter the keyword stack-unit followed by the stack member number.
Range: 0 to 5
EXEC
EXEC Privilege
Command
History
Version 8.3.17.0
Supported on M I/O Aggregator
Interfaces | 149
www.dell.com | support.dell.com
Example
Figure 11-27.
show interfaces switchport Command Example
FTOS#show interfaces switchport
Codes:
U
x
G
i
-
Untagged, T - Tagged
Dot1x untagged, X - Dot1x tagged
GVRP tagged, M - Trunk, H - VSN tagged
Internal untagged, I - Internal tagged, v - VLT untagged, V - VLT
tagged
Name: TenGigabitEthernet 1/1
802.1QTagged: Hybrid
IO-AGG port mode: Auto VLANs enabled
Vlan membership:
Q
Vlans
U
1
T
2-4094
Native VlanId:
1.
Name: TenGigabitEthernet 1/2
802.1QTagged: Hybrid
IO-AGG port mode: Auto VLANs enabled
Vlan membership:
Q
Vlans
U
1
T
2-4094
Native VlanId:
--More--
Table 11-8.
Related
Commands
1.
Items in show interfaces switchport Command Example
Items
Description
Name
Displays the interface’s type, slot and port number.
802.1QTagged
Displays whether if the VLAN tagged (“True”), untagged (“False”), or hybrid
(“Hybrid”), which supports both untagged and tagged VLANs by port 13/0.
Vlan membership
Lists the VLANs to which the interface is a member. Starting with FTOS 7.6.1,
this field can display native VLAN membership by port 13/0.
show ip interface
Displays Layer 3 information about the interfaces.
show range
Displays all interfaces configured using the group command.
Syntax
Command Mode
Command
History
150
|
Interfaces
show range
INTERFACE RANGE (config-if-range)
Version 8.3.17.0
Supported on M I/O Aggregator
Example
Figure 11-28.
show range Command Example
FTOS(conf-if-range-te-0/16)#show range
interface tengigabitethernet 0/16
FTOS(conf-if-range-te-0/16)#
Related
Commands
show ip interface
Displays Layer 3 information about the interfaces.
show tdr
Displays the TDR test results.
Syntax
Parameters
Defaults
Command Modes
Command
History
Example
show tdr interface
Enter the keyword TenGigabitEthernet followed by the slot/port information
for the 100/1000/10GbaseT Ethernet interface.
interface
none
EXEC
Version 8.3.17.0
Figure 11-29.
Supported on M I/O Aggregator
show tdr tengigabitethernet Command Example
FTOS#show tdr tengigabitethernet 1/1
Time since last test: 00:00:02
Pair A, Length: OK Status: Terminated
Pair B, Length: 92 (+/- 1) meters, Status: Short
Pair C, Length: 93 (+/- 1) meters, Status: Open
Pair D, Length: 0 (+/- 1) meters, Status: Impedance Mismatch
Table 11-9.
Usage
Information
TDR Test Status
Status
Definition
OK Status: Terminated
TDR test is complete, no fault is detected on the
cable, and the test is terminated
Length: 92 (+/- 1) meters, Status: Shorted
A short is detected on the cable. The location, in
this example is 92 meters, of the short is accurate
to plus or minus one meter.
Length: 93 (+/- 1) meters, Status: Open
An opening is detected on the cable. The location,
in this example is 93 meters, of the open is
accurate to plus or minus one meter.
Status: Impedance Mismatch
There is an impedance mismatch in the cables.
If the TDR test has not been run, an error messages is generated:
%Error: Please run the TDR test first
Note that TDR test is supported only on 10GbaseT interfaces.
Interfaces | 151
www.dell.com | support.dell.com
Related
Commands
vlan tagged
Runs the TDR test.
show vlan
Displays the current VLAN configurations on the switch.
Syntax
Parameters
show vlan [brief | id vlan-id | name vlan-name]
brief
(OPTIONAL) Enter the keyword brief to display the following information:
•
•
•
•
•
Command Modes
VLAN ID
VLAN name (left blank if none is configured.)
Spanning Tree Group ID
MAC address aging time
IP address
id vlan-id
(OPTIONAL) Enter the keyword id followed by a number from 1 to 4094. Only
information on the VLAN specified is displayed.
name
vlan-name
(OPTIONAL) Enter the keyword name followed by the name configured for the VLAN.
Only information on the VLAN named is displayed.
EXEC
EXEC Privilege
Command
History
Example
Version 8.3.17.0
Figure 11-30.
Supported on M I/O Aggregator
show vlan Command Example
FTOS#show vlan
Codes: * - Default VLAN, G - GVRP VLANs, R - Remote Port Mirroring VLANs, P Primary, C - Community, I - Isolated
Q: U - Untagged, T - Tagged
x - Dot1x untagged, X - Dot1x tagged
G - GVRP tagged, M - Vlan-stack, H - VSN tagged
i - Internal untagged, I - Internal tagged, v - VLT untagged, V - VLT tagged
NUM
1
2
*
20
1002
FTOS#
Status
Inactive
Inactive
Active
Active
Description
a
Q Ports
U Te 0/3,5,13,53-56
T Te 0/3,13,55-56
Table 11-10. show vlan Command Information
Column Heading
Description
(Column 1 — no heading)
asterisk symbol (*) = Default VLAN
G = GVRP VLAN
P = primary VLAN
C = community VLAN
I = isolated VLAN
NUM
152
|
Interfaces
Displays existing VLAN IDs.
Table 11-10. show vlan Command Information
Column Heading
Description
Status
Displays the word Inactive for inactive VLANs and the word
Active for active VLANs.
Q
Displays G for GVRP tagged, M for member of a VLAN-Stack VLAN, T
for tagged interface, U (for untagged interface), x (uncapitalized x) for
Dot1x untagged, or X (capitalized X) for Dot1x tagged.
Ports
Displays the type, slot, and port information. For the type, Po = port
channel, Fo= fortygigabit ethernet, and Te = ten gigabit ethernet.
Figure 11-31.
show vlan id Command Example
FTOS# show vlan id 40
Codes: * - Default VLAN, G - GVRP VLANs, R - Remote Port Mirroring
VLANs, P - Primary, C - Community, I - Isolated
Q: U - Untagged, T - Tagged
x - Dot1x untagged, X - Dot1x tagged
G - GVRP tagged, M - Vlan-stack, H - VSN tagged
i - Internal untagged, I - Internal tagged, v - VLT untagged, V
- VLT tagged
NUM
1
FTOS#
Figure 11-32.
Status
Inactive
Description
a
show vlan brief Command Example
FTOS#show vlan brief
VLAN Name
---- -------------------------------1
2
20
1002
FTOS#
Figure 11-33.
Q Ports
STG
---0
0
0
0
MAC Aging
--------0
0
0
0
IP Address
-----------------unassigned
unassigned
unassigned
unassigned
Using a VLAN Name Example
FTOSconf)#interface vlan 222
FTOS(conf-if-vl-222)#name test
FTOS(conf-if-vl-222)#do show vlan name test
Codes:
Q: U x G -
* - Default VLAN, G - GVRP VLANs
Untagged, T - Tagged
Dot1x untagged, X - Dot1x tagged
GVRP tagged, M - Vlan-stack
NUM
Status
Description
222
Inactive
FTOS(conf-if-vl-222)#
FTOS#
Related
Commands
interface vlan
Q Ports
U TenGig 1/22
Configures a VLAN.
Interfaces | 153
www.dell.com | support.dell.com
shutdown
Disable an interface.
Syntax
shutdown
To activate an interface, enter no shutdown.
Defaults
Command Modes
Command
History
Usage
Information
The interface is disabled.
INTERFACE
Version 8.3.17.0
Supported on M I/O Aggregator
The show tdr command marks a physical interface as unavailable for traffic. To discover if an interface
is disabled, use the show ip interface command. Disabled interfaces are listed as down.
Disabling a VLAN or a port channel causes different behavior. When a VLAN is disabled, the Layer 3
functions within that VLAN are disabled. Layer 2 traffic continues to flow. Entering the show tdr
command on a port channel disables all traffic on the port channel and the individual interfaces within
the port channel. To enable a port channel, you must enter no show tdr on the port channel interface
and at least one interface within that port channel.
The show tdr and description commands are the only commands that you can configure on an interface
that is a member of a port channel.
Related
Commands
vlan tagged
Test the condition of copper cables on 100/1000/10G Base-T
modules.
interface vlan
Creates a VLAN.
show ip interface
Displays the interface routing status. Add the keyword brief to display a table
of interfaces and their status.
speed (for 1000/10000/auto interfaces)
Set the speed for 1000/10000 Base-T Ethernet interfaces. Both sides of a link must be set to the same
speed (1000/10000) or to auto or the link may not come up.
Syntax
speed {1000 | 10000 | auto}
To return to the default setting, use the no speed {1000 | 10000 | auto} command.
Parameters
1000
Enter the keyword 1000 to set the interface’s speed to 1000 Mb/s.
10000
Enter the keyword 10000 to set the interface’s speed to 10000 Mb/s.
(Auto-negotiation is enabled. See name for more information)
auto
Defaults
154
|
Interfaces
auto
Enter the keyword auto to set the interface to auto-negotiate its speed.
(Auto-negotiation is enabled. See name for more information)
Command Modes
Command
History
Usage
Information
INTERFACE
Version 8.3.17.0
Supported on M I/O Aggregator
This command is found on the 1000/10000 Base-T Ethernet interfaces.
When you enable auto, the system performs and automatic discovery to determine the optics installed
and configure the appropriate speed.
When you configure a speed for the 1000/10000 interface, you should confirm name command setting.
Both sides of the link should have auto-negotiation either enabled or disabled. For speed settings of
1000 or auto, the software sets the link to auto-negotiation and you cannot change that setting.
In FTOS, the command speed 1000 is an exact equivalent of speed auto 1000 in IOS.
Related
Commands
name
Enables or disables auto-negotiation on an interface.
tdr-cable-test
Test the condition of copper cables on 100/1000/10GBase-T modules.
Syntax
Parameters
Defaults
Command Modes
Command
History
Usage
Information
tdr-cable-test interface
interface
Enter the keyword TenGigabitEthernet followed by the slot/port
information for the 100/1000/10GBase-T Ethernet interface.
none
EXEC
Version 8.3.17.0
Supported on M I/O Aggregator
The interface must be enabled to run the test or an error message is generated:
FTOS#tdr-cable-test tengigabitethernet 5/2
%Error: Interface is disabled TenGIG 5/2
Related
Commands
show tdr
Displays the results of the TDR test.
Interfaces | 155
www.dell.com | support.dell.com
vlan tagged
Add a Layer 2 interface to a VLAN as a tagged interface.
Syntax
tagged interface
To remove a tagged interface from a VLAN, use no tagged interface command.
Parameters
interface
Enter the following keywords and slot/port or number information:
•
Defaults
Command Modes
Command
History
Usage
Information
For a 10-Gigabit Ethernet interface, enter the keyword TenGigabitEthernet
followed by the slot/port information.
All interfaces in Layer 2 mode are untagged.
INTERFACE VLAN
Version 8.3.17.0
Supported on M I/O Aggregator
When you use the no tagged command, the interface is automatically placed in the default VLAN as
an untagged interface unless the interface is a member of another VLAN. If the interface belongs to
several VLANs, you must remove it from all VLANs to change it to an untagged interface.
Tagged interfaces can belong to multiple VLANs, while untagged interfaces can only belong to one
VLAN at a time.
When two or more ports configured for VLANs form a LAG, the resulting LAG is a tagged member of
all the configured VLANs and an untagged member of the VLAN to which the port with the lowest
port ID belongs.
For example, if port 0/33 is an untagged member of VLAN 2 and port 0/41 is an untagged member of
VLAN 3, the resulting LAG consisting of the two ports is an untagged member of VLAN 2 and a
tagged member of VLANs 2 and 3.
Example
Figure 11-34.
VLAN Tagged Command Example
FTOS(conf-if-te-0/2)#vlan tagged ?
VLAN-RANGE
Comma/Hyphen separated VLAN ID set
FTOS(conf-if-te-0/2)#vlan tagged 2,3-4
FTOS(conf-if-te-0/2)#show config
!
interface TenGigabitEthernet 0/2
mtu 12000
vlan tagged 2-4
!
port-channel-protocol LACP
port-channel 1 mode active
!
protocol lldp
advertise management-tlv system-name
dcbx port-role auto-downstream
no shutdown
FTOS(conf-if-te-0/2)#
Related
Commands
156
|
Interfaces
interface vlan
Configures a VLAN.
vlan untagged
Specifies which interfaces in a VLAN are untagged.
vlan untagged
Add a Layer 2 interface to a VLAN as an untagged interface.
Syntax
untagged interface
To remove an untagged interface from a VLAN, use the no untagged interface command.
Parameters
interface
Enter the following keywords and slot/port or number information:
•
Defaults
Command Modes
Command
History
Usage
Information
For a 10-Gigabit Ethernet interface, enter the keyword TenGigabitEthernet
followed by the slot/port information.
All interfaces in Layer 2 mode are untagged.
INTERFACE VLAN
Version 8.3.17.0
Supported on M I/O Aggregator
Untagged interfaces can only belong to one VLAN.
In the default VLAN, you cannot use the no untagged interface command. To remove an untagged
interface from all VLANs, including the default VLAN, enter INTERFACE mode and use the no vlan
tagged command.
When two or more ports configured for VLANs form a LAG, the resulting LAG is a tagged member of
all the configured VLANs and an untagged member of the VLAN to which the port with the lowest
port ID belongs.
For example, if port 0/33 is an untagged member of VLAN 2 and port 0/41 is an untagged member of
VLAN 3, the resulting LAG consisting of the two ports is an untagged member of VLAN 2 and a
tagged member of VLANs 2 and 3.
Example
Figure 11-35.
VLAN Untagged Command Example
FTOS(conf-if-te-0/2)#vlan untagged ?
<1-4094>
Untagged VLAN id
FTOS(conf-if-te-0/2)#
FTOS(conf-if-te-0/2)#vlan untagged 4094
FTOS(conf-if-te-0/2)#show config
!
interface TenGigabitEthernet 0/2
mtu 12000
vlan untagged 4094
!
port-channel-protocol LACP
port-channel 1 mode active
!
protocol lldp
advertise management-tlv system-name
dcbx port-role auto-downstream
no shutdown
FTOS(conf-if-te-0/2)#
Related
Commands
interface vlan
Configures a VLAN.
vlan tagged
Specifies which interfaces in a VLAN are tagged.
Interfaces | 157
158
|
Interfaces
www.dell.com | support.dell.com
12
IPv4 Routing
IP Commands
This chapter describes the IPv4-related commands. They are:
•
•
•
•
•
•
•
•
•
•
•
•
•
clear tcp statistics
debug ip dhcp
debug ip icmp
ip route
management route
show arp
show hosts
show ip management-route
show ip multicast-cam stack-unit
show ip interface
show ip route
show ip route summary
show ip management-route
clear tcp statistics
Clear the TCP counters.
Syntax
clear tcp statistics
Command Modes
EXEC Privilege
Command
History
Version 8.3.17.0
Supported on M I/O Aggregator
debug ip dhcp
Enable debug information for DHCP relay transactions and display the information on the console.
Syntax
debug ip dhcp
To disable debug, use the no debug ip dhcp command.
IPv4 Routing | 159
www.dell.com | support.dell.com
Defaults
Debug disabled
Command Modes
EXEC Privilege
Command
History
Version 8.3.17.0
Example
Figure 12-1.
Supported on M I/O Aggregator
debug ip dhcp Command Example
FTOS#debug ip dhcp
00:12:21 : %RELAY-I-PACKET: BOOTP REQUEST (Unicast) received at interface 113.3.3.17 BOOTP
Request, hops = 0, XID = 0xbf05140f, secs = 0, hwaddr = 00:60:CF:20:7B:8C, giaddr = 0.0.0.0
00:12:21 : %RELAY-I-BOOTREQUEST: Forwarded BOOTREQUEST for 00:60:CF:20:7B:8C to 14.4.4.2
00:12:26 : %RELAY-I-PACKET: BOOTP REQUEST (Unicast) received at interface 113.3.3.17 BOOTP
Request, hops = 0, XID = 0xbf05140f, secs = 5, hwaddr = 00:60:CF:20:7B:8C, giaddr = 0.0.0.0
00:12:26 : %RELAY-I-BOOTREQUEST: Forwarded BOOTREQUEST for 00:60:CF:20:7B:8C to 14.4.4.2
00:12:40 : %RELAY-I-PACKET: BOOTP REQUEST (Unicast) received at interface 113.3.3.17 BOOTP
Request, hops = 0, XID = 0xda4f9503, secs = 0, hwaddr = 00:60:CF:20:7B:8C, giaddr = 0.0.0.0
00:12:40 : %RELAY-I-BOOTREQUEST: Forwarded BOOTREQUEST for 00:60:CF:20:7B:8C to 14.4.4.2
00:12:42 : %RELAY-I-PACKET: BOOTP REPLY (Unicast) received at interface 14.4.4.1 BOOTP Reply,
hops = 0, XID = 0xda4f9503, secs = 0, hwaddr = 00:60:CF:20:7B:8C, giaddr = 113.3.3.17
00:12:42 : %RELAY-I-BOOTREPLY: Forwarded BOOTREPLY for 00:60:CF:20:7B:8C to 113.3.3.254
00:12:42 : %RELAY-I-PACKET: BOOTP REQUEST (Unicast) received at interface 113.3.3.17 BOOTP
Request, hops = 0, XID = 0xda4f9503, secs = 0, hwaddr = 00:60:CF:20:7B:8C, giaddr = 0.0.0.0
00:12:42 : %RELAY-I-BOOTREQUEST: Forwarded BOOTREQUEST for 00:60:CF:20:7B:8C to 14.4.4.2
00:12:42 : %RELAY-I-PACKET: BOOTP REPLY (Unicast) received at interface 14.4.4.1 BOOTP Reply,
hops = 0, XID = 0xda4f9503, secs = 0, hwaddr = 00:60:CF:20:7B:8C, giaddr = 113.3.3.17
00:12:42 : %RELAY-I-BOOTREPLY: Forwarded BOOTREPLY for 00:60:CF:20:7B:8C to 113.3.3.254
FTOS#
debug ip icmp
View information on the internal control message protocol (ICMP).
Syntax
debug ip icmp [interface] [count value]
To disable debugging, use the no debug ip icmp command.
Parameters
interface
(OPTIONAL) Enter the following keywords and slot/port or number information:
•
•
•
count value
160
Command Modes
EXEC Privilege
Command
History
Version 8.3.17.0
|
IPv4 Routing
For the Management interface, enter the keyword ManagementEthernet followed
by the slot/port information. The slot range is 0 and the port range is 0.
For a 10-Gigabit Ethernet interface, enter the keyword TenGigabitEthernet
followed by the slot/port information.
For VLAN, enter the keyword vlan followed by a number from 1 to 4094.
(OPTIONAL) Enter the keyword count followed by the count value.
Range: 1 to 65534
Default: Infinity
Supported on M I/O Aggregator
Example
Figure 12-2.
ICMP:
ICMP:
ICMP:
ICMP:
ICMP:
ICMP:
ICMP:
ICMP:
Usage
Information
debug ip icmp Command Example (Partial)
echo request rcvd from src 40.40.40.40
src 40.40.40.40, dst 40.40.40.40, echo
src 40.40.40.40, dst 40.40.40.40, echo
echo request sent to dst 40.40.40.40
echo request rcvd from src 40.40.40.40
src 40.40.40.40, dst 40.40.40.40, echo
src 40.40.40.40, dst 40.40.40.40, echo
echo request sent to dst 40.40.40.40
reply
reply
reply
reply
Use the count option to stop packets from flooding the user terminal when debugging is turned on.
ip route
Assign a static route to the switch.
Syntax
ip route destination mask {ip-address | interface [ip-address]} [distance] [permanent] [tag
tag-value]
To delete a specific static route, use the no ip route destination mask {address | interface
[ip-address]} command.
To delete all routes matching a certain route, use the no ip route destination mask command.
Parameters
destination
Enter the IP address in dotted decimal format of the destination device.
mask
Enter the mask in slash prefix formation (/x) of the destination device’s IP address.
ip-address
Enter the IP address in dotted decimal format of the forwarding router.
interface
Enter the following keywords and slot/port or number information:
•
•
Defaults
Command Modes
Command
History
For a 10-Gigabit Ethernet interface, enter the keyword TenGigabitEthernet
followed by the slot/port information.
For a VLAN, enter the keyword vlan followed by a number from 1 to 4094.
distance
(OPTIONAL) Enter a number as the distance metric assigned to the route.
Range: 1 to 255
permanent
(OPTIONAL) Enter the keyword permanent to specify the route is not removed, even
if the interface assigned to that route goes down. The route must be up initially to install
it in the routing table.
If you disable the interface with an IP address associated with the keyword
permanent, the route disappears from the routing table.
tag tag-value
(OPTIONAL) Enter the keyword tag followed by a number to assign to the route.
Range: 1 to 4294967295
Not configured.
CONFIGURATION
Version 8.3.17.0
Supported on M I/O Aggregator
IPv4 Routing | 161
www.dell.com | support.dell.com
Usage
Information
Using the following example of a static route:
ip route 33.33.33.0 /24 tengigabitethernet 0/0 172.31.5.43
•
•
•
•
•
Related
Commands
The software installs a next hop that is not on the directly connected subnet but which recursively
resolves to a next hop on the interface’s configured subnet. In the example, if gig 0/0 has ip
address on subnet 2.2.2.0 and if 172.31.5.43 recursively resolves to 2.2.2.0, FTOS installs the
static route.
When the interface goes down, FTOS withdraws the route.
When the interface comes up, FTOS re-installs the route.
When recursive resolution is “broken,” FTOS withdraws the route.
When recursive resolution is satisfied, FTOS re-installs the route.
show ip route
Views the switch routing table.
management route
Configure a static route that points to the Management interface or a forwarding router.
Syntax
Parameters
Defaults
Command Modes
Command
History
Usage
Information
management route {ipv4-address}/mask {forwarding-router-address | managementethernet}
{ipv4-address}/mask
Enter an IPv4 address (A.B.C.D) followed by the prefix-length for
the IP address of the management interface.
forwarding-router-address
Enter an IPv4 address of a forwarding router.
managementethernet
Enter the keyword managementethernet for the Management
interface.
Not configured.
CONFIGURATION
Version 8.3.17.0
Supported on M I/O Aggregator
When a static route (or a protocol route) overlaps with Management static route, the static route (or a
protocol route) is preferred over the Management Static route. Also, Management static routes and the
Management Connected prefix are not reflected in the hardware routing tables. Separate routing tables
are maintained for IPv4 management routes. This command manages both tables.
show hosts
View the host table and DNS configuration.
Syntax
Command Modes
show hosts
EXEC
EXEC Privilege
Command
History
162
|
IPv4 Routing
Version 8.3.17.0
Supported on M I/O Aggregator
Example
Figure 12-3.
show hosts Command Example
FTOS#show hosts
Default domain is not set
Name/address lookup uses static
Name servers are not set
Host
Flags
-----------ks
(perm,
4200-1
(perm,
1230-3
(perm,
ZZr
(perm,
Z10-3
(perm,
FTOS#
Table 12-1.
mappings
OK)
OK)
OK)
OK)
OK)
TTL
----
Type
---IP
IP
IP
IP
IP
Address
------2.2.2.2
192.68.69.2
192.68.99.2
192.71.18.2
192.71.23.1
show hosts Command Example Fields
Field
Description
Default domain...
Displays the domain name (if configured).
Name/address lookup...
States if DNS is enabled on the system.
If DNS is enabled, the Name/Address lookup is domain service.
If DNS is not enabled, the Name/Address lookup is static mapping.
Name servers are...
Lists the name servers, if configured.
Host
Displays the host name assigned to the IP address.
Flags
Classifies the entry as one of the following:
• perm - the entry was manually configured and will not time out
• temp - the entry was learned and will time out after 72 hours of inactivity.
Also included in the flag is an indication of the validity of the route:
•
•
•
ok - the entry is valid.
ex - the entry expired.
?? - the entry is suspect.
TTL
Displays the amount of time until the entry ages out of the cache. For dynamically
learnt entries only.
Type
Displays IP as the type of entry.
Address
Displays the IP address(es) assigned to the host.
show arp
Displays the ARP table.
Syntax
show arp [interface interface | ip ip-address [mask] | macaddress mac-address [mac-address
mask]] [static | dynamic] [summary]
IPv4 Routing | 163
www.dell.com | support.dell.com
Parameters
interface interface
(OPTIONAL) Enter the following keywords and slot/port or number
information:
•
•
•
ip ip-address mask
(OPTIONAL) Enter the keyword ip followed by an IP address in the dotted
decimal format. Enter the optional IP address mask in the slash prefix format (/
x).
macaddress
mac-address mask
(OPTIONAL) Enter the keyword macaddress followed by a MAC address in
nn:nn:nn:nn:nn:nn format. Enter the optional MAC address mask in
nn:nn:nn:nn:nn format also.
static
(OPTIONAL) Enter the keyword static to view entries entered manually.
dynamic
(OPTIONAL) Enter the keyword dynamic to view dynamic entries.
summary
(OPTIONAL) Enter the keyword summary to view a summary of ARP entries.
retries
(OPTIONAL) Enter the keyword summary to view the number of ARP retries
before a 20 sec back off.
inspection
(OPTIONAL) Enter the keyword inspection to view dynamic ARP Inspection
details.
Command Modes
EXEC Privilege
Command
History
Version 8.3.17.0
Example
For the Management interface, enter the keyword managementethernet
followed by the slot/port information.
For a 10-Gigabit Ethernet interface, enter the keyword
TenGigabitEthernet followed by the slot/port information.
For a VLAN, enter the keyword vlan followed by a number from 1 to 4094.
Figure 12-4.
Supported on M I/O Aggregator
show arp Command Example (Partial)
FTOS>show arp
Protocol
Address
Age(min) Hardware Address Interface VLAN CPU
---------------------------------------------------------------------------------------Internet
10.11.8.6
167 00:01:e9:45:00:03
Ma 0/0
CP
Internet
10.11.68.14
124 00:01:e9:45:00:03
Ma 0/0
CP
Internet
10.11.209.254
0
00:01:e9:45:00:03
Ma 0/0
CP
164
|
IPv4 Routing
Figure 12-5.
show arp Command Example with Private VLAN data
FTOS#show arp
Protocol
Address
Age(min) Hardware Address
Interface VLAN
CPU
----------------------------------------------------------------------------------Internet
5.5.5.1
00:01:e8:43:96:5e
Vl 10 pv 200
CP
Internet
5.5.5.10
00:01:e8:44:99:55
Vl 10
CP
Internet
10.1.2.4
1
00:01:e8:d5:9e:e2
Ma 0/0
CP
Internet
10.10.10.4
1
00:01:e8:d5:9e:e2
Ma 0/0
CP
Internet
10.16.127.53
1
00:01:e8:d5:9e:e2
Ma 0/0
CP
Internet
10.16.134.254
20
00:01:e8:d5:9e:e2
Ma 0/0
CP
Internet
133.33.33.4
1
00:01:e8:d5:9e:e2
Ma 0/0
CP
Line 1 shows community VLAN 200 (in primary VLAN 10) in
a PVLAN.
Line 2 shows primary VLAN 10.
Table 12-2.
show arp Command Example Fields
Row Heading
Description
Protocol
Displays the protocol type.
Address
Displays the IP address of the ARP entry.
Age(min)
Displays the age in minutes of the ARP entry.
Hardware Address
Displays the MAC address associated with the ARP entry.
Interface
Displays the first two letters of the interfaces type and the slot/port
associated with the ARP entry.
VLAN
Displays the VLAN ID, if any, associated with the ARP entry.
CPU
Lists which CPU the entries are stored on.
Figure 12-6.
show arp summary Command Example
FTOS#show arp summary
Total Entries
Static Entries
Dynamic Entries
CPU
----------------------------------------------------------3
0
3
CP
FTOS#
Table 12-3.
show arp summary Command Example Fields
Row Heading
Description
Total Entries
Lists the total number of ARP entries in the ARP table.
Static Entries
Lists the total number of configured or static ARP entries.
Dynamic Entries
Lists the total number of learned or dynamic ARP entries.
CPU
Lists which CPU the entries are stored on.
IPv4 Routing | 165
www.dell.com | support.dell.com
show ip management-route
View the IP addresses assigned to the Management interface.
Syntax
Parameters
Command Modes
show ip management-route [all | connected | summary | static]
all
(OPTIONAL) Enter the keyword all to view all IP addresses assigned to all
Management interfaces on the switch.
connected
(OPTIONAL) Enter the keyword connected to view only routes directly
connected to the Management interface.
summary
(OPTIONAL) Enter the keyword summary to view a table listing the number
of active and non-active routes and their sources.
static
(OPTIONAL) Enter the keyword static to view non-active routes also.
EXEC
EXEC Privilege
Command
History
Example
Version 8.3.17.0
Figure 12-7.
Supported on M I/O Aggregator
show ip management route Command Example
FTOS#show ip management-route
Destination
----------10.1.2.0/24
172.16.1.0/24
Gateway
------ManagementEthernet 0/0
10.1.2.4
State
----Connected
Active
FTOS#
show ip multicast-cam stack-unit
Displays content-addressable memory (CAM) entries.
Syntax
Parameters
show ip multicast-cam stack-unit 0-5 port-set pipe-number [ip-address mask [longer-prefixes] |
detail | member-info | summary]
0-5
Enter the stack-unit ID, from 0 to 5.
pipe-number
Enter the number of the Port-Pipe number.
Range: 0 to 0
ip-address mask
(OPTIONAL) Enter the IP address and mask of a route to CAM entries for that route
only.
Enter the keyword longer-prefixes to view routes with a common prefix.
[longer-prefix]
detail
166
|
IPv4 Routing
Enter the keyword detail to display the group index ID used by the ecmp routes in
the CAM.
member-info
Enter the keyword member-info to display the group index used by the ecmp, the
number of egress ports (members) for the ecmp, and the port details of each member.
The detail information under member-info will give the MAC address, VLAN
ID and gateway of every member port of the ecmp.
summary
Command Modes
(OPTIONAL) Enter the keyword summary to view a table listing route prefixes and
the total number routes which can be entered in to CAM.
EXEC
EXEC Privilege
Command
History
Example
Version 8.3.17.0
Figure 12-8.
Supported on M I/O Aggregator
show ip cam stack-unit Command Example
FTOS#show ip multicast-cam stack-unit 0 port-set 0 10.10.10.10/32
longer-prefixes
Destination
EC CG V C
----------------10.10.10.10
VId
Mac-Addr
Port
-- -- - - ----- ----------------- ------------0 0 1 1
0 00:00:00:00:00:00
3f01
CP
FTOS#
Table 12-4.
show ip cam Command Example Fields
Field
Description
Destination
Displays the destination route of the index.
CG
Displays 0.
V
Displays a 1 if the entry is valid and a 0 otherwise.
C
Displays the CPU bit.
1 indicates that a packet hitting this entry is forwarded to the control processor, depending
on Egress port.
V Id
Displays the VLAN ID. If the entry is 0, the entry is not part of a VLAN.
Mac Addr
Displays the next-hop router’s MAC address.
Port
Displays the egress interface. Use the second half of the entry to determine the interface.
For example, in the entry 17cl CP, the CP is the pertinent portion.
CP = control processor
Fo= 40 Gigabit Ethernet interface
Te = 10 Gigabit Ethernet interface
show ip interface
View IP-related information on all interfaces.
Syntax
show ip interface [interface | brief] [configuration]
IPv4 Routing | 167
www.dell.com | support.dell.com
Parameter
interface
(OPTIONAL) Enter the following keywords and slot/port or number information:
•
•
•
•
Command Modes
For the Management interface, enter the keyword ManagementEthernet
followed by zero (0).
For a Port Channel interface, enter the keyword port-channel followed by a
number:
Range: 1 to 128
For a 10-Gigabit Ethernet interface, enter the keyword TenGigabitEthernet
followed by the slot/port information.
For a VLAN, enter the keyword vlan followed by a number from 1 to 4094.
brief
(OPTIONAL) Enter the keyword brief to view a brief summary of the interfaces and
whether an IP address is assigned.
configuration
(OPTIONAL) Enter the keyword configuration to display the physical interfaces
with non-default configurations only.
EXEC
EXEC Privilege
Command
History
Example
Version 8.3.17.0
Figure 12-9.
Supported on M I/O Aggregator
show ip interface Command Example
FTOS#show ip int te 0/0
TenGigabitEthernet 0/0 is down, line protocol is down
Internet address is not set
IP MTU is 1500 bytes
Inbound access list is not set
Proxy ARP is enabled
Split Horizon is enabled
Poison Reverse is disabled
ICMP redirects are not sent
ICMP unreachables are not sent
FTOS#
Table 12-5.
168
|
IPv4 Routing
show ip interface Command Example Items
Lines
Description
TenGigabitEthernet 0/0...
Displays the interface’s type, slot/port and physical and line protocol
status.
Internet address...
States whether an IP address is assigned to the interface. If one is, that
address is displayed.
IP MTU is...
Displays IP MTU value.
Inbound access...
Displays the name of the any configured incoming access list. If none is
configured, the phrase “not set” is displayed.
Proxy ARP...
States whether proxy ARP is enabled on the interface.
Split horizon...
States whether split horizon for RIP is enabled on the interface.
Poison Reverse...
States whether poison for RIP is enabled on the interface
ICMP redirects...
States if ICMP redirects are sent.
ICMP unreachables...
States if ICMP unreachable messages are sent.
Figure 12-10.
show ip interface brief Command Example (Partial)
FTOS#show ip int brief
Interface
IP-Address
TenGigabitEthernet 0/1
unassigned
TenGigabitEthernet 0/2
unassigned
TenGigabitEthernet 0/3
unassigned
TenGigabitEthernet 0/4
unassigned
TenGigabitEthernet 0/5
unassigned
TenGigabitEthernet 0/6
unassigned
TenGigabitEthernet 0/7
unassigned
TenGigabitEthernet 0/8
unassigned
TenGigabitEthernet 0/9
unassigned
Table 12-6.
OK? Method Status
NO None
up
YES None
up
YES None
up
NO None
up
NO None
up
NO None
up
NO None
up
NO None
up
NO None
up
Protocol
down
up
up
down
down
down
down
down
down
show ip interface brief Column Headings
Field
Description
Interface
Displays type of interface and the associated slot and port number.
IP-Address
Displays the IP address for the interface, if configured.
Ok?
Indicates if the hardware is functioning properly.
Method
Displays Manual if the configuration is read from the saved configuration.
Status
States whether the interface is enabled (up) or disabled (administratively
down).
Protocol
States whether IP is enabled (up) or disabled (down) on the interface.
show ip route
View information, including how they were learned, about the IP routes on the switch.
Syntax
Parameter
show ip route [hostname | ip-address [mask] [longer-prefixes] | list prefix-list [process-id] |
connected | static | summary]
ip-address
(OPTIONAL) Specify a name of a device or the IP address of the device to view
more detailed information about the route.
mask
(OPTIONAL) Specify the network mask of the route. Use this parameter with
the IP address parameter.
longer-prefixes
(OPTIONAL) Enter the keyword longer-prefixes to view all routes with a
common prefix.
list prefix-list
(OPTIONAL) Enter the keyword list and the name of a configured prefix list.
process-id
(OPTIONAL) Specify that only OSPF routes with a certain process ID must be
displayed.
connected
(OPTIONAL) Enter the keyword connected to view only the directly
connected routes.
static
(OPTIONAL) Enter the keyword static to view only routes configured by the
ip route command.
summary
(OPTIONAL) Enter the keyword summary. See show ip route summary.
IPv4 Routing | 169
www.dell.com | support.dell.com
Command Modes
EXEC
EXEC Privilege
Command
History
Example
Version 8.3.17.0
Figure 12-11.
Supported on M I/O Aggregator
show ip route summary and show ip route static Command Examples
FTOS#show ip route summary
Route Source
Active Routes
Non-active Routes
connected
2
0
static
1
0
Total
3
0
Total 3 active route(s) using 612 bytes
FTOS#show ip route static ?
|
Pipe through a command
<cr>
FTOS#show ip route static
Destination
Gateway
Dist/Metric Last Change
--------------------------- ----------*S
0.0.0.0/0
via 10.10.91.9, Te 1/2
1/0
3d2h
FTOS#
Table 12-7.
show ip route all Command Example Fields
Field
Description
(undefined)
Identifies the type of route:
•
•
•
•
•
•
•
•
•
•
•
•
•
•
•
•
•
•
•
•
170
|
IPv4 Routing
C = connected
S = static
R = RIP
B = BGP
IN = internal BGP
EX = external BGP
LO = Locally Originated
O = OSPF
IA = OSPF inter area
N1 = OSPF NSSA external type 1
N2 = OSPF NSSA external type 2
E1 = OSPF external type 1
E2 = OSPF external type 2
i = IS-IS
L1 = IS-IS level-1
L2 = IS-IS level-2
IA = IS-IS inter-area
* = candidate default
> = non-active route
+ = summary routes
Destination
Identifies the route’s destination IP address.
Gateway
Identifies whether the route is directly connected and on which interface the route is
configured.
Dist/Metric
Identifies if the route has a specified distance or metric.
Last Change
Identifies when the route was last changed or configured.
show ip route summary
View a table summarizing the IP routes in the switch.
Syntax
Command Modes
show ip route summary
EXEC
EXEC Privilege
Command
History
Example
Version 8.3.17.0
Figure 12-12.
Supported on M I/O Aggregator
show ip route summary Command Example
FTOS>show ip route summary
Route Source
Active Routes
Non-active Routes
connected
17
0
static
3
0
ospf 100
1368
2
Intra-area: 762 Inter-area: 1 External-1: 600 External-2: 5
Total
1388
2
Total 1388 active route(s) using 222440 bytes
Total 2 non-active route(s) using 128 bytes
FTOS>
Table 12-8.
Related
Commands
show ip route summary Column Headings
Column Heading
Description
Route Source
Identifies how the route is configured in FTOS.
Active Routes
Identifies the best route if a route is learned from two protocol sources.
Non-active Routes
Identifies the back-up routes when a route is learned by two different protocols. If the
best route or active route goes down, the non-active route will become the best route.
ospf 100
If routing protocols (OSPF, RIP) are configured and routes are advertised, then
information on those routes is displayed.
Total 1388 active...
Displays the number of active and non-active routes and the memory usage of those
routes.
If there are no routes configured in the FTOS, this line does not appear.
show ip route
Displays information about the routes found in switch.
show tcp statistics
View information on TCP traffic through the switch.
Syntax
show tcp statistics
Command Modes
EXEC Privilege
Command
History
Version 8.3.17.0
Supported on M I/O Aggregator
IPv4 Routing | 171
www.dell.com | support.dell.com
Example
Figure 12-13.
show tcp statistics cp Command Example
FTOS#show tcp statistics
Rcvd: 9849 Total, 0 no port
0 checksum error, 0 bad offset, 0 too short
5735 packets (7919 bytes) in sequence
20 dup packets (2 bytes)
0 partially dup packets (0 bytes)
1 out-of-order packets (0 bytes)
0 packets ( 0 bytes) with data after window
0 packets after close
0 window probe packets, 0 window update packets
0 dup ack packets, 0 ack packets with unsend data
6671 ack packets (152813 bytes)
Sent: 6778 Total, 0 urgent packets
7 control packets
6674 data packets (152822 bytes)
12 data packets (1222 bytes) retransmitted
85 ack only packets (5677 delayed)
0 window probe packets, 0 window update packets
0 Connections initiated, 7 connections accepted, 7 connections established
8 Connections closed (including 4 dropped, 0 embryonic dropped)
12 Total rxmt timeout, 1 connections dropped in rxmt timeout
26 Keepalive timeout, 25 keepalive probe, 1 Connections dropped in keepalive
FTOS#
Table 12-9.
show tcp statistics cp Command Example Fields
Field
Description
Rcvd:
Displays the number and types of TCP packets received by the switch.
•
•
0 checksum error...
Total = total packets received
no port = number of packets received with no designated port.
Displays the number of packets received with the following:
•
•
•
checksum errors
bad offset to data
too short
329 packets...
Displays the number of packets and bytes received in sequence.
17 dup...
Displays the number of duplicate packets and bytes received.
0 partially...
Displays the number of partially duplicated packets and bytes received.
7 out-of-order...
Displays the number of packets and bytes received out of order.
0 packets with data after
window
Displays the number of packets and bytes received that exceed the switch’s
window size.
0 packets after close
Displays the number of packet received after the TCP connection was closed.
0 window probe packets...
Displays the number of window probe and update packets received.
41 dup ack...
Displays the number of duplicate acknowledgement packets and
acknowledgement packets with data received.
10184 ack...
Displays the number of acknowledgement packets and bytes received.
Sent:
Displays the total number of TCP packets sent and the number of urgent packets
sent.
25 control packets...
Displays the number of control packets sent and the number retransmitted.
11603 data packets...
Displays the number of data packets sent.
24 data packets retransmitted Displays the number of data packets resent.
172
|
IPv4 Routing
Table 12-9.
show tcp statistics cp Command Example Fields (continued)
Field
Description
355 ack...
Displays the number of acknowledgement packets sent and the number of packet
delayed.
0 window probe...
Displays the number of window probe and update packets sent.
7 Connections initiated...
Displays the number of TCP connections initiated, accepted, and established.
14 Connections closed...
Displays the number of TCP connections closed, dropped.
20 Total rxmt...
Displays the number of times the switch tried to re-send data and the number of
connections dropped during the TCP retransmit timeout period.
0 Keepalive....
Lists the number of keepalive packets in timeout, the number keepalive probes
and the number of TCP connections dropped during keepalive.
IPv4 Routing | 173
174
|
IPv4 Routing
www.dell.com | support.dell.com
13
iSCSI Optimization
Overview
Internet small computer system interface (iSCSI) optimization enables quality-of-service (QoS)
treatment for iSCSI storage traffic on an Aggregator.
Note: When iSCSI storage devices are detected on the server-ports, storm-control is disabled
on those ports. When the iSCSI devices are off the ports, storm-control is enabled again.
iSCSI Commands
The following FTOS commands are used to verify the iSCSI Optimization feature:
•
•
•
show iscsi
show iscsi sessions
show iscsi sessions detailed
show iscsi
Displays the currently configured iSCSI settings.
Syntax
Command Mode
show iscsi
EXEC
EXEC Privilege
Command
History
Version 8.3.17.0
Supported on M I/O Aggregator
iSCSI Optimization | 175
www.dell.com | support.dell.com
Example
Figure 13-1.
show iscsi Command Example
FTOS#show iscsi
iSCSI is enabled
iSCSI COS : dot1p is 4 no-remark
Session aging time: 10
Maximum number of connections is 256
-----------------------------------------------iSCSI Targets and TCP Ports:
-----------------------------------------------TCP Port
Target IP Address
3260
860
FTOS#
Related
Commands
show iscsi sessions
Displays information on active iSCSI sessions on the switch.
show iscsi sessions detailed
Displays detailed information on active iSCSI sessions on the switch.
show iscsi sessions
Displays information on active iSCSI sessions on the switch.
Syntax
Command Mode
show iscsi sessions
EXEC
EXEC Privilege
Command
History
Example
Version 8.3.17.0
Figure 13-2.
Supported on M I/O Aggregator
show iscsi sessions Command Example
FTOS# show isci sessions
Session 0:
Target: iqn.2001-05.com.equallogic:0-8a0906-0e70c2002-10a0018426a48c94-iom010
Initiator: iqn.1991-05.com.microsoft:win-x9l8v27yajg
ISID: 400001370000
Session 1:
Target: iqn.2001-05.com.equallogic:0-8a0906-0f60c2002-0360018428d48c94-iom011
Initiator: iqn.1991-05.com.microsoft:win-x9l8v27yajg
ISID: 400001370000.
Related
Commands
176
|
iSCSI Optimization
show iscsi
Displays the currently configured iSCSI settings.
show iscsi sessions detailed
Displays detailed information on active iSCSI sessions on the switch.
show iscsi sessions detailed
Displays detailed information on active iSCSI sessions on the switch.
Syntax
Parameters
Command Mode
show iscsi sessions detailed [session isid]
isid
Enter the session’s iSCSi ID to display detailed information on specified iSCSi
session.
EXEC
EXEC Privilege
Command
History
Example
Version 8.3.17.0
Figure 13-3.
Supported on M I/O Aggregator
show iscsi sessions detailed Command Example
FTOS# show isci sessions detailed
Session 0
:
----------------------------------------------------------------------------Target:iqn.2010-11.com.ixia:ixload:iscsi-TG1
Initiator:iqn.2010-11.com.ixia.ixload:initiator-iscsi-2c
Up Time:00:00:01:28(DD:HH:MM:SS)
Time for aging out:00:00:09:34(DD:HH:MM:SS)
ISID:806978696102
Initiator
Initiator
Target
Target
Connection
IP Address
TCP Port
IP Address
TCPPort
ID
10.10.0.44
33345
10.10.0.101
3260
0
Session 1
:
----------------------------------------------------------------------------Target:iqn.2010-11.com.ixia:ixload:iscsi-TG1
Initiator:iqn.2010-11.com.ixia.ixload:initiator-iscsi-35
Up Time:00:00:01:22(DD:HH:MM:SS)
Time for aging out:00:00:09:31(DD:HH:MM:SS)
ISID:806978696102
Initiator
Initiator
Target
Target
Connection
IP Address
TCP Port
IP Address
TCPPort
ID
10.10.0.53
33432
10.10.0.101
3260
0
Related
Commands
show iscsi
Displays the currently configured iSCSI settings.
show iscsi sessions
Displays information on active iSCSI sessions on the switch.
iSCSI Optimization | 177
178
|
iSCSI Optimization
www.dell.com | support.dell.com
14
Link Aggregation Control Protocol (LACP)
Overview
This chapter contains commands for Dell Force10’s implementation of the link aggregation control
protocol (LACP) for the creation of dynamic link aggregation groups (LAGs — called port-channels
in FTOS parlance).
LACP Commands
Use the following commands for LACP:
•
•
•
clear lacp counters
debug lacp
show lacp
clear lacp counters
Clear Port Channel counters.
Syntax
Parameters
Command Modes
clear lacp port-channel-number counters
port-channel-number
Enter a port-channel number:
Range: 1 to 128
EXEC
EXEC Privilege
Command
History
Related
Commands
Version 8.3.17.0
show lacp
Supported on M I/O Aggregator
Displays the LACP configuration
Link Aggregation Control Protocol (LACP) | 179
www.dell.com | support.dell.com
debug lacp
Debug LACP (events).
Syntax
debug lacp [events | pdu interface [in | out]]
To disable LACP debugging, use the no debug lacp [events | pdu interface [in | out]] command.
Parameters
events
(OPTIONAL) Enter the keyword events to debug LACP event information.
pdu in | out
(OPTIONAL) Enter the keyword pdu to debug LACP Protocol Data Unit
information. Optionally, enter an in or out parameter to:
•
•
interface in | out
Enter the following keywords and slot/port or number information:
•
Defaults
Command Modes
Receive enter in
Transmit enter out
For a Ten Gigabit Ethernet interface, enter the keyword TenGigabitEthernet
followed by the slot/port information.
none
EXEC
EXEC Privilege
Command
History
Version 8.3.17.0
Supported on M I/O Aggregator
show lacp
Displays the LACP matrix.
Syntax
Parameters
Command Modes
show lacp port-channel-number [sys-id | counters]
port-channel-number
Enter a port-channel number:
Range: 1 to 128
sys-id
(OPTIONAL) Enter the keyword sys-id and the value that identifies a
system.
counters
(OPTIONAL) Enter the keyword counters to display the LACP counters.
EXEC
EXEC Privilege
Command
History
180
|
Version 8.3.17.0
Supported on M I/O Aggregator
Link Aggregation Control Protocol (LACP)
Example 1
Figure 14-1.
show lacp port-channel-number Command Example
FTOS#show lacp
Port-channel 1
Actor
System
Partner System
128
admin up, oper up, mode lacp
ID: Priority 32768, Address 0001.e800.a12b
ID: Priority 32768, Address 0001.e801.45a5
Actor Admin Key 1, Oper Key 1, Partner Oper Key 1
LACP LAG 1 is an aggregatable link
A - Active LACP, B - Passive LACP, C - Short Timeout, D - Long Timeout
E - Aggregatable Link, F - Individual Link, G - IN_SYNC, H - OUT_OF_SYNC
I - Collection enabled, J - Collection disabled, K - Distribution enabled L Distribution disabled,
M - Partner Defaulted, N - Partner Non-defaulted, O - Receiver is in expired state,
P - Receiver is not in expired state
Port Te 0/1 is enabled, LACP is
Actor
Admin: State ACEHJLMP
Oper: State ACEGIKNP
Partner Admin: State BDFHJLMP
Oper: State BCEGIKNP
FTOS#
Example 2
Figure 14-2.
enabled and mode is lacp
Key 1
Priority 128
Key 1
Priority 128
Key 0
Priority 0
Key 1
Priority 128
show lacp sys-id Command Example
FTOS#show lacp 1 sys-id
Actor
System ID: Priority 32768, Address 0001.e800.a12b
Partner System ID: Priority 32768, Address 0001.e801.45a5
FTOS#
Example 3
Figure 14-3.
show lacp counter Command Example
FTOS#show lacp 1 counters
---------------------------------------------------------------------LACP PDU
Marker PDU
Unknown Illegal
Port
Xmit
Recv
Xmit
Recv
Pkts Rx Pkts Rx
---------------------------------------------------------------------TenGig
0/1 200
200
0
0
0
0
FTOS#
Related
Commands
clear lacp counters
Clears the LACP counters.
show interfaces port-channel
Displays the information on configured Port Channel groups.
Link Aggregation Control Protocol (LACP) | 181
www.dell.com | support.dell.com
182
|
Link Aggregation Control Protocol (LACP)
15
Layer 2
Overview
This chapter describes commands to configure Layer 2 features. It contains the following sections:
•
•
MAC Addressing Commands
Virtual LAN (VLAN) Commands
MAC Addressing Commands
The following commands are related to configuring, managing, and viewing MAC addresses:
•
•
clear mac-address-table dynamic
show cam mac stack-unit
Virtual LAN (VLAN) Commands
The following commands configure and monitor virtual local area networks (VLANs). VLANs are a
virtual interface and use many of the same commands as physical interfaces.
You can configure an IP address and Layer 3 protocols on a VLAN called Inter-VLAN routing. FTP,
TFTP, ACLs, and SNMP are not supported on a VLAN.
Occasionally, while sending broadcast traffic over multiple Layer 3 VLANs, the virtual router
redundancy protocol (VRRP) state of a VLAN interface may continually switch between Master and
Backup.
For more information, also refer to Virtual LAN (VLAN) Commands.
Layer 2 | 183
www.dell.com | support.dell.com
clear mac-address-table dynamic
Clear the MAC address table of all MAC address learned dynamically.
Syntax
Parameters
clear mac-address-table dynamic {address mac-address | all | interface interface | vlan vlan-id}
address mac-address
Enter the keyword address followed by a MAC address in
nn:nn:nn:nn:nn:nn format.
all
Enter the keyword all to delete all MAC address entries in the MAC address
table.
interface interface
Enter the following keywords and slot/port or number information:
•
vlan vlan-id
Command Modes
EXEC Privilege
Command
History
Version 8.3.17.0
For a 10-Gigabit Ethernet interface, enter the keyword
TenGigabitEthernet followed by the slot/port information.
Enter the keyword vlan followed by a VLAN ID number from 1 to 4094.
Supported on M I/O Aggregator
description
Add a description about the selected VLAN.
Syntax
description description
To remove the description from the VLAN, use the no description command.
Parameters
Defaults
Command Modes
Command
History
Related
Commands
description
Enter a text string description to identify the VLAN (80 characters maximum).
none
INTERFACE VLAN
Version 8.3.17.0
Supported on M I/O Aggregator
show vlan
Displays VLAN configuration.
show cam mac stack-unit
Displays the Content Addressable Memory (CAM) size and the portions allocated for MAC addresses
and for MAC ACLs.
Syntax
184
|
Layer 2
show cam mac stack-unit unit_number port-set port-pipe count [vlan vlan-id] [interface interface]
Parameters
stack-unit unit_number
(REQUIRED) Enter the keyword stack-unit followed by a stack member
number to select the stack unit for which to gather information.
Range: 0 to 5
port-set port-pipe
(REQUIRED) Enter the keyword port-set followed by a Port-Pipe number
to select the Port-Pipe for which to gather information.
Range: 0
address mac-addr
(OPTIONAL) Enter the keyword address followed by a MAC address in
the nn:nn:nn:nn:nn:nn format to display information on that MAC address.
dynamic
(OPTIONAL) Enter the keyword dynamic to display only those MAC
addresses learned dynamically by the switch.
static
(OPTIONAL) Enter the keyword static to display only those MAC address
specifically configured on the switch.
interface interface
(OPTIONAL) Enter the keyword interface followed by the interface type,
slot and port information:
•
vlan vlan-id
Command Modes
For a 10-Gigabit Ethernet interface, enter the keyword
TenGigabitEthernet followed by the slot/port information.
(OPTIONAL) Enter the keyword vlan followed by the VLAN ID to display
the MAC address assigned to the VLAN.
Range: 1 to 4094.
EXEC
EXEC Privilege
Command
History
Version 8.3.17.0
Supported on M I/O Aggregator
Layer 2 | 185
186
|
Layer 2
www.dell.com | support.dell.com
16
Link Layer Discovery Protocol (LLDP)
Overview
The link layer discovery protocol (LLDP) advertises connectivity and management from the local
station to the adjacent stations on an IEEE 802 LAN. LLDP facilitates multi-vendor interoperability by
using standard management tools to discover and make available a physical topology for network
management. The Dell Fore10 operating software (FTOS) implementation of LLDP is based on IEEE
standard 802.1ab.
LLDP Commands
This chapter contains the following commands, in addition to the commands:
•
•
•
•
•
•
clear lldp counters
debug lldp interface
protocol lldp (Configuration)
protocol lldp (Interface)
show lldp neighbors
show lldp statistics
The starting point for using LLDP is invoking LLDP with the protocol lldp command in either
CONFIGURATION or INTERFACE mode.
The information distributed by LLDP is stored by its recipients in a standard management information
base (MIB). The information can be accessed by a network management system through a
management protocol such as SNMP.
For details about implementing LLDP/LLDP-MED, refer to the Link Layer Discovery Protocol
chapter of the Dell PowerEdge Configuration Guide for the M I/O Aggregator.
clear lldp counters
Clear LLDP transmitting and receiving counters for all physical interfaces or a specific physical
interface.
Syntax
clear lldp counters interface
Link Layer Discovery Protocol (LLDP) | 187
www.dell.com | support.dell.com
Parameters
interface
Enter the following keywords and slot/port or number information:
•
Defaults
For a 10-Gigabit Ethernet interface, enter the keyword tenGigabitEthernet
followed by the slot/port information.
none
Command Modes
EXEC Privilege
Command
History
Version 8.3.17.0
Supported on M I/O Aggregator
debug lldp interface
Enable LLDP debugging to display timer events, neighbor additions or deletions, and other
information about incoming and outgoing packets.
Syntax
debug lldp interface {interface | all}{events | packet {brief | detail} {tx | rx | both}}
To disable debugging, use the no debug lldp interface {interface | all}{events} {packet {brief |
detail} {tx | rx | both}} command.
Parameters
interface
Enter the following keywords and slot/port or number information:
•
Defaults
188
all
(OPTIONAL) Enter the keyword all to display information on all interfaces.
events
(OPTIONAL) Enter the keyword events to display major events such as timer
events.
packet
(OPTIONAL) Enter the keyword packet to display information regarding packets
coming in or going out.
brief
(OPTIONAL) Enter the keyword brief to display brief packet information.
detail
(OPTIONAL) Enter the keyword detail to display detailed packet information.
tx
(OPTIONAL) Enter the keyword tx to display transmit only packet information.
rx
(OPTIONAL) Enter the keyword rx to display receive only packet information
both
(OPTIONAL) Enter the keyword both to display both receive and transmit packet
information.
none
Command Modes
EXEC Privilege
Command
History
Version 8.3.17.0
|
For a 10-Gigabit Ethernet interface, enter the keyword tenGigabitEthernet
followed by the slot/port information.
Link Layer Discovery Protocol (LLDP)
Supported on M I/O Aggregator
protocol lldp (Configuration)
Enable LLDP globally on the switch.
Syntax
protocol lldp
To disable LLDP globally on the chassis, use the no protocol lldp command.
Defaults
Command Modes
Command
History
Disabled
CONFIGURATION (conf-lldp)
Version 8.3.17.0
Supported on M I/O Aggregator
protocol lldp (Interface)
Enter the LLDP protocol in the INTERFACE mode.
Syntax
[no] protocol lldp
To return to the global LLDP configuration mode, use the no protocol lldp command from the
Interface mode.
Defaults
LLDP is not enabled on the interface.
Command Modes
INTERFACE (conf-if-interface-lldp)
Command
History
Usage
Information
Version 8.3.17.0
Supported on M I/O Aggregator
You must enable LLDP globally from CONFIGURATION mode before you can configure it on an
interface. This command places you in LLDP mode on the interface; it does not enable the protocol.
When you enter the LLDP protocol in the Interface context, it overrides global configurations. When
you execute the no protocol lldp from INTERFACE mode, interfaces begin to inherit the configuration
from global LLDP CONFIGURATION mode.
show lldp neighbors
Displays LLDP neighbor information for all interfaces or a specified interface.
Syntax
Parameters
show lldp neighbors [interface] [detail]
interface
(OPTIONAL) Enter the following keywords and slot/port or number information:
•
detail
For a 10-Gigabit Ethernet interface, enter the keyword tenGigabitEthernet
followed by the slot/port information.
(OPTIONAL) Enter the keyword detail to display all the TLV information, timers, and
LLDP tx and rx counters.
Link Layer Discovery Protocol (LLDP) | 189
www.dell.com | support.dell.com
Defaults
none
Command Modes
EXEC Privilege
Command
History
Version 8.3.17.0
Example
Figure 16-1.
Supported on M I/O Aggregator
show lldp neighbors Command Example
FTOS(conf-if-te-1/31)#do show lldp neighbors
Loc PortID
Rem Host Name
Rem Port Id
Rem Chassis Id
------------------------------------------------------------------------Te 1/37
FTOS
Te 1/38
FTOS
Te 1/39
FTOS
Te 1/40
FTOS
FTOS(conf-if-te-1/31)#
Usage
Information
TenGigabitEthernet
TenGigabitEthernet
TenGigabitEthernet
TenGigabitEthernet
0/37
0/38
0/39
0/40
Omitting the keyword detail displays only the remote chassis ID, Port ID, and Dead Interval.
show lldp statistics
Displays the LLDP statistical information.
Syntax
Defaults
show lldp statistics
none
Command Modes
EXEC Privilege
Command
History
Version 8.3.17.0
Example
Figure 16-2.
Supported on M I/O Aggregator
show lldp statistics Command Example
FTOS#show lldp statistics
--------- LLDP GLOBAL STATISTICS ON CHASSIS -----------Total number of neighbors: 4
Last table change time: 00:01:17, In ticks: 3859
Total number of Table Inserts: 7
Total number of Table Deletes: 3
Total number of Table Drops: 0
Total number of Table Age Outs: 0
FTOS#
190
|
00:01:e8:05:40:46
00:01:e8:05:40:46
00:01:e8:05:40:46
00:01:e8:05:40:46
Link Layer Discovery Protocol (LLDP)
17
Port Monitoring
Overview
The port monitoring feature allows you to monitor network traffic by forwarding a copy of each
incoming or outgoing packet from one port to another port.
Monitoring Commands
•
•
•
•
•
•
description
monitor session
show config
show monitor session
show running-config monitor session
source (port monitoring)
Important Points to Remember
•
•
•
•
•
•
•
Port monitoring is supported on physical ports only; virtual local area networks (VLANs) and
port-channel interfaces do not support port monitoring.
The monitoring (destination, “MG”) and monitored (source, “MD”) ports must be on the same
switch.
The monitored (source) interface must be a server-facing interface in the format slot/port, where
valid slot numbers are 0-1 and server-facing port numbers are from 1 to 32. The monitoring
interface must be an uplink port in the chassis.
FTOS permits a limited set of commands for monitoring ports. To display these commands, use
the ? command.
A monitoring port may not be a member of a VLAN.
There may only be one destination port in a monitoring session.
A source port (MD) can only be monitored by one destination port (MG). If you try to assign a
monitored port to more than one monitoring port, the following error is displayed (Message 1).
Port Monitoring | 191
www.dell.com | support.dell.com
Message 1 Assign a Monitored Port to More than One Monitoring Port
FTOS(conf)#mon ses 1
FTOS(conf-mon-sess-1)#source tengig 0/0 destination tengig 0/60 direction both
FTOS(conf-mon-sess-1)#do show mon ses
SessionID
Source
Destination
Direction
Mode
Type
-------------------------------------1
TenGig 0/0
TenGig 0/60
both
interface
Port-based
FTOS(conf-mon-sess-1)#mon ses 2
FTOS(conf-mon-sess-2)#source tengig 0/0 destination tengig 0/61 direction both
% Error: MD port is already being monitored.
Note: There is no limit to the number of monitoring sessions per system, provided that there
are only four destination ports per port-pipe. If each monitoring session has a unique
destination port, the maximum number of session is four per port-pipe.
description
Enter a description of this monitoring session.
Syntax
description {description}
To remove the description, use the no description {description} command.
Parameters
Defaults
Command Modes
description
Enter a description regarding this session(80 characters maximum).
none
MONITOR SESSION (conf-mon-sess-session-ID)
Command
History
Version 8.3.17.0
Related
Commands
monitor session
Supported on M I/O Aggregator
Enables a monitoring session.
monitor session
Create a session for monitoring traffic with port monitoring.
Syntax
monitor session session-ID
To delete a session, use the no monitor session session-ID command.
To delete all monitor sessions, use the no monitor session all command.
Parameters
Defaults
192
|
Port Monitoring
session-ID
none
Enter a session identification number.
Range: 0 to 65535
Command Modes
CONFIGURATION
Command
History
Example
Version 8.3.17.0
Figure 17-1.
Supported on M I/O Aggregator
monitor session Command Example
FTOS(conf)# monitor session 60
FTOS(conf-mon-sess-60)
Usage
Information
The monitor command is saved in the running configuration at the Monitor Session mode level and can
be restored after a chassis reload.
Related
Commands
description
Displays the monitor session
show running-config monitor session
Displays the running configuration of a monitor session
show config
Displays the current monitor session configuration.
Syntax
Defaults
Command Modes
Command
History
Example
show config
none
MONITOR SESSION (conf-mon-sess-session-ID)
Version 8.3.17.0
Figure 17-2.
Supported on M I/O Aggregator
show config Command Example
FTOS(conf-mon-sess-5)#show config
!
monitor session 5
source TenGigabitEthernet 0/4 destination TenGigabitEthernet 0/43 direction rx
FTOS(conf-mon-sess-5)#
show monitor session
Displays the monitor information of a particular session or all sessions.
Syntax
show monitor session {session-ID}
To display monitoring information for all sessions, use the show monitor session command.
Parameters
Defaults
session-ID
(OPTIONAL) Enter a session identification number.
Range: 0 to 65535
none
Port Monitoring | 193
www.dell.com | support.dell.com
Command Modes
EXEC
EXEC Privilege
Command
History
Example
Version 8.3.17.0
Figure 17-3.
Supported on M I/O Aggregator
show monitor session Command Example
FTOS#show monitor session 5
SessionID
Source
-------------5
Te 0/4
FTOS#
Related
Commands
monitor session
Destination
----------Te 0/43
Direction
--------rx
Mode
---interface
Type
---Port-based
Creates a session for monitoring.
show running-config monitor session
Displays the running configuration of all monitor sessions or a specific session.
Syntax
show running-config monitor session {session-ID}
To display the running configuration for all monitor sessions, use just the show running-config
monitor session command.
Parameters
Defaults
Command Modes
session-ID
(OPTIONAL) Enter a session identification number.
Range: 0 to 65535
none
EXEC
EXEC Privilege
Command
History
Example
Version 8.3.17.0
Figure 17-4.
Supported on M I/O Aggregator
show running-config monitor session Command Example
FTOS#show run monitor session
!
monitor session 5
source TenGigabitEthernet 0/4
!
monitor session 20
source TenGigabitEthernet 0/3
FTOS#
FTOS#show run monitor session
!
monitor session 20
source TenGigabitEthernet 0/3
FTOS#
Usage
Information
194
|
Port Monitoring
destination TenGigabitEthernet 0/43 direction rx
destination TenGigabitEthernet 0/42 direction both
20
destination TenGigabitEthernet 0/42 direction both
The monitoring command is saved in the running configuration at the Monitor Session mode level and
can be restored after a chassis reload.
Related
Commands
monitor session
Creates a session for monitoring.
description
Displays a monitor session.
Port Monitoring | 195
www.dell.com | support.dell.com
source (port monitoring)
Configure a port monitor source.
Syntax
source interface destination interface direction {rx | tx | both}
To disable a monitor source, use the no source interface destination interface direction {rx | tx |
both} command.
Parameters
interface
Enter the one of the following keywords and slot/port information:
•
For a 10-Gigabit Ethernet interface, enter the keyword
TenGigabitEthernet followed by the slot/port information.
destination
Enter the keyword destination to indicate the interface destination.
direction {rx | tx | both}
Enter the keyword direction followed by one of the packet directional
indicators.
rx: to monitor receiving packets only
tx: to monitor transmitting packets only
both: to monitor both transmitting and receiving packets
Defaults
Command Modes
Command
History
Example
none
MONITOR SESSION (conf-mon-sess-session-ID)
Version 8.3.17.0
Figure 17-5.
Supported on M I/O Aggregator
Configuring a Port Monitor Source Command Example
FTOS(conf-mon-sess-11)#source tengig 10/0 destination tengig 10/47 direction
rx
FTOS(conf-mon-sess-11)#
Usage
Information
196
|
Port Monitoring
The monitored (source) interface must be a server-facing interface in the format slot/port, where valid
slot numbers are 0-1 and server-facing port numbers are from 1 to 32.
18
Quality of Service (QoS)
Overview
The Dell Force10 operating software (FTOS) commands for quality of service (QoS) include traffic
conditioning and congestion control. This chapter contains the section:
•
Policy-Based QoS Commands
Policy-Based QoS Commands
The commands are:
•
•
show qos statistics
show qos dot1p-queue-mapping
show qos statistics
View QoS statistics.
Syntax
Parameters
Defaults
Command Modes
show qos statistics [interface]
interface
For a Ten Gigabit Ethernet interface, enter the keyword
TenGigabitEthernet followed by the slot/port information.
none
EXEC
EXEC Privilege
Command
History
Version 8.3.17.0
Supported on M I/O Aggregator
Quality of Service (QoS) | 197
www.dell.com | support.dell.com
Example 1
Figure 18-1.
show qos statistics Command Example
FTOS#show qos statistics
Interface Te 0/20
Queue# Matched Pkts
0
0
1
0
2
0
3
0
FTOS#
Table 18-1.
show qos statistics Command Description (ED and EE Series)
Field
Description
Queue #
Queue Number
Matched Pkts
The number of packets that matched the class-map criteria.
Note: When trust is configured, matched packet counters are not
incremented in this field.
show qos dot1p-queue-mapping
View dot1p to queue mapping.
Syntax
Defaults
Command Modes
show qos dot1p-queue-mapping
none
EXEC
EXEC Privilege
Command
History
Example
Version 8.3.17.0
Figure 18-2.
Supported on M I/O Aggregator
show qos wred-profile Command Example
FTOS#show qos dot1p-queue-mapping
Dot1p Priority : 0 1 2 3 4 5
Queue : 0 0 0 1 2 3
FTOS#
198
|
Quality of Service (QoS)
6
3
7
3
19
Security
Commands
This chapter describes various types of security commands in the Dell Force10 operating software
(FTOS), in the following sections:
•
•
Authentication and Password Commands
SSH Server and SCP Commands
Note: Starting with FTOS version 7.2.1.0, LEAP with MSCHAP v2 supplicant is
implemented.
Authentication and Password Commands
This section contains the following commands controlling management access to the system:
•
•
•
•
•
•
enable password
enable restricted
enable smux-debug
service password-encryption
show users
username
SSH Server and SCP Commands
FTOS supports secure shell (SSH) protocol versions 1.5 and 2.0. SSH is a protocol for secure remote
login over an insecure network. SSH sessions are encrypted and use authentication. The SSH and SCP
commands are:
•
•
•
•
show ip ssh
show ip ssh client-pub-keys
show ip ssh rsa-authentication
ssh
Security | 199
www.dell.com | support.dell.com
enable password
Change the password for the enable command.
Syntax
enable password [level level] [encryption-type] password
To delete a password, use the no enable password [encryption-type] password [level level]
command.
Parameters
Defaults
Command Modes
(OPTIONAL) Enter the keyword level followed by a number as the level of
access.
Range: 1 to 15
encryption-type
(OPTIONAL) Enter the number 7 or 0 as the encryption type.
Enter a 7 followed by a text string as the hidden password. The text string must
be a password that was already encrypted by a Dell Force10 router.
Use this parameter only with a password that you copied from the show
running-config file of another Dell Force10 router.
password
Enter a text string, up to 32 characters long, as the clear text password.
No password is configured. level = 15
CONFIGURATION
Command
History
Usage
Information
level level
Version 8.3.17.0
Supported on M I/O Aggregator
Use this command to define a password for a level.
Passwords must meet the following criteria:
•
•
Start with a letter, not a number.
Passwords can have a regular expression as the password. To create a password with a regular
expression in it, you must use CNTL + v prior to entering regular expression. For example, to
create the password abcd]e, you type “abcd CNTL v ]e”. When the password is created, you
do not use the CNTL + v key combination and enter “abcd]e”.
Note: The question mark (?) and the tilde (~) are not supported characters.
Related
Commands
show running-config
Views the current configuration.
enable restricted
Allows Dell Force10 technical support to access restricted commands.
Syntax
enable restricted [encryption-type] password
To disallow access to restricted commands, use the no enable restricted command.
200
|
Security
Parameters
encryption-type
(OPTIONAL) Enter the number 7 as the encryption type.
Enter 7 followed a text string as the hidden password. The text string must be a
password that was already encrypted by a Dell Force10 router.
Use this parameter only with a password that you copied from the show
running-config file of another Dell Force10 router.
password
Enter a text string, up to 32 characters long, as the clear text password.
Command Modes
Not configured.
Command
History
Version 8.3.17.0
Usage
Information
Supported on M I/O Aggregator
Only Dell Force10 Technical Support staff use this command.
enable smux-debug
Enable SMUX debug-level commands.
Syntax
enable smux-debug
To disable SMUX debug, use no enable smux-debug command.
Command Modes
Not configured.
Command
History
Version 8.3.17.0
Supported on M I/O Aggregator
service password-encryption
Encrypt all passwords configured in FTOS.
Syntax
service password-encryption
To store new passwords as clear text, use the no service password-encryption command.
Defaults
Command Modes
Command
History
Enabled.
CONFIGURATION
Version 8.3.17.0
Supported on M I/O Aggregator
Caution: Encrypting passwords with this command does not provide a high level of security.
When the passwords are encrypted, you cannot return them to plain text unless you re-configure
them. To remove an encrypted password, use the no password password command.
Security | 201
www.dell.com | support.dell.com
Usage
Information
To keep unauthorized people from viewing passwords in the switch configuration file, use the service
password-encryption command. This command encrypts the clear-text passwords created for user
name passwords, authentication key passwords, the privileged command password, and console and
virtual terminal line access passwords.
To view passwords, use the show running-config command.
show ip ssh
Displays information about established SSH sessions.
Syntax
Command Modes
show ip ssh
EXEC
EXEC Privilege
Example
Figure 19-1.
show ip ssh Command Example
FTOS#show ip ssh
2#show ip ssh
SSH server
SSH server version
Password Authentication
Hostbased Authentication
RSA
Authentication
FTOS#
Related
Commands
show ip ssh client-pub-keys
:
:
:
:
:
disabled.
v1 and v2.
enabled.
disabled.
disabled.
Displays the client-public keys.
show ip ssh client-pub-keys
Displays the client public keys used in host-based authentication.
Syntax
Defaults
Command Modes
Command
History
Example
show ip ssh client-pub-keys
none
EXEC
Version 8.3.17.0
Figure 19-2.
Supported on M I/O Aggregator
show ip ssh client-pub-keys Command Example
FTOS#show ip ssh client-pub-keys
poclab4,123.12.1.123 ssh-rsa AAAAB3NzaC1yc2EAAAABIwAAAIEAox/
QQp8xYhzOxn07yh4VGPAoUfgKoieTHO9G4sNV+ui+DWEc3cgYAcU5Lai1MU2ODrzhCwyDNp05tKBU3tReG1
o8AxLi6+S4hyEMqHzkzBFNVqHzpQc+Rs4p2urzV0F4pRKnaXdHf3Lk4D460HZRhhVrxqeNxPDpEnWIMPJi0
ds= ashwani@poclab4
FTOS#
202
|
Security
Usage
Information
This command displays the contents of the file flash://ADMIN_DIRssh/knownhosts
show ip ssh rsa-authentication
Displays the authorized-keys for the RSA authentication.
Syntax
Parameters
Defaults
Command Modes
Command
History
Example
show ip ssh rsa-authentication {my-authorized-keys}
my-authorized-keys
Display the RSA authorized keys.
none
EXEC
Version 8.3.17.0
Figure 19-3.
Supported on M I/O Aggregator
show ip ssh rsa-authentication Command Example
FTOS#show ip ssh rsa-authentication my-authorized-keys
ssh-rsa
AAAAB3NzaC1yc2EAAAABIwAAAIEAyB17l4gFp4r2DRHIvMc1VZd0Sg5GQxRV1y1X1JOMeO6Nd0WuYyzrQMM
4qJAoBwtneOXfLBcHF3V2hcMIqaZN+CRCnw/
zCMlnCf0+qVTd1oofsea5r09kS0xTp0CNfHXZ3NuGCq9Ov33m9+U9tMwhS8vy8AVxdH4x4km3c3t5Jvc=
freedom@poclab4
FTOS#
Usage
Information
This command displays the contents of the file flash:/ADMIN_DIR/ssh/authorized-keys.username.
show users
View information on all users logged into the switch.
Syntax
Parameters
show users [all]
all
Command Modes
EXEC Privilege
Command
History
Version 8.3.17.0
Example
Figure 19-4.
(OPTIONAL) Enter the keyword all to view all terminal lines in the switch.
Supported on M I/O Aggregator
show users Command Example
FTOS#show user
Line
0 console 0
*
3 vty 1
FTOS#
User
admin
admin
Host(s)
idle
idle
Location
172.31.1.4
Security | 203
www.dell.com | support.dell.com
Table 1 describes the information in the show users command example.
Table 1 show users Command Description
Related
Commands
Field
Description
(untitled)
Indicates with am asterisk (*) which terminal line you are using.
Line
Displays the terminal lines currently in use.
User
Displays the user name of all users logged in.
Host(s)
Displays the terminal line status.
Location
Displays the IP address of the user.
ssh
Enables a user.
ssh
Open an SSH connection specifying the hostname, username, port number and version of the SSH
client.
FTOS supports both inbound and outbound SSH sessions using IPv4 addressing. Inbound SSH
supports accessing the system through the management interface as well as through a physical Layer 3
interface.
Syntax
Parameters
Defaults
ssh {hostname | ipv4 address} [-l username | -p port-number | -v {1 | 2}]
hostname
(OPTIONAL) Enter the IP address or the hostname of the remote device.
ipv4 address
(OPTIONAL) Enter the IP address in dotted decimal format A.B.C.D.
-l username
(OPTIONAL) Enter the keyword -l followed by the user name used in this SSH
session.
Default: The user name of the user associated with the terminal.
-p port-number
(OPTIONAL) Enter the keyword -p followed by the port number.
Range: 1 to 65536
Default: 22
-v {1 | 2}
(OPTIONAL) Enter the keyword -v followed by the SSH version 1 or 2.
Default: The version from the protocol negotiation
As above.
Command Modes
EXEC Privilege
Command
History
Version 8.3.17.0
Example
Figure 19-5.
Supported on M I/O Aggregator
ssh Command Example
FTOS#ssh 123.12.1.123 -l ashwani -p 5005 -v 2
204
|
Security
username
Establish an authentication system based on user names.
Syntax
username name [access-class access-list-name] [nopassword | {password | secret}
[encryption-type] password] [privilege level]
If you do not want a specific user to enter a password, use the nopassword option.
To delete authentication for a user, use the no username name command.
Parameters
name
Enter a text string for the name of the user up to 63 characters.
access-class
access-list-name
Enter the keyword access-class followed by the name of a configured access
control list (either an IP access control list or MAC access control list).
nopassword
Enter the keyword nopassword to specify that the user should not enter a
password.
password
Enter the keyword password followed by the encryption-type or the password.
secret
Enter the keyword secret followed by the encryption-type or the password.
encryption-type
Enter an encryption type for the password that you will enter.
•
•
•
Defaults
Command Modes
Command
History
Usage
Information
Related
Commands
0 directs FTOS to store the password as clear text. It is the default encryption
type when using the password option.
7 to indicate that a password encrypted using a DES hashing algorithm will
follow. This encryption type is available with the password option only.
5 to indicate that a password encrypted using an MD5 hashing algorithm will
follow. This encryption type is available with the secret option only, and is the
default encryption type for this option.
password
Enter a string up to 32 characters long.
privilege level
Enter the keyword privilege followed by a number from zero (0) to 15.
secret
Enter the keyword secret followed by the encryption type.
The default encryption type for the password option is 0. The default encryption type for the secret
option is 0.
CONFIGURATION
Version 8.3.17.0
Supported on M I/O Aggregator
To view the defined user names, use the show running-config user command.
service
password-encryp
tion
Specifies a password for users on terminal lines.
show
running-config
Views the current configuration.
Security | 205
206
|
Security
www.dell.com | support.dell.com
Simple Network Management Protocol (SNMP)
and Syslog
Overview
This chapter contains commands to configure and monitor the simple network management protocol
(SNMP) v1/v2 and Syslog. The chapter contains the following sections:
•
•
SNMP Commands
Syslog Commands
SNMP Commands
The SNMP command available in the Dell Force10 operating software (FTOS) is:
•
snmp-server community
The SNMP is used to communicate management information between the network management
stations and the agents in the network elements. FTOS supports SNMP versions 1, and 2c supporting
only read-only mode.
Important Points to Remember
•
•
Typically, 5-second timeout and 3-second retry values on an SNMP server are sufficient for both
local area network (LAN) and wide area network (WAN) applications. If you experience a timeout
with these values, the recommended best practice on Dell Force10 switches (to accommodate their
high port density) is to increase the timeout and retry values on your SNMP server to the
following:
— SNMP Timeout—greater than 3 seconds
— SNMP Retry count—greater than 2 seconds
SNMP operations are not supported on a virtual LAN (VLAN).
Syslog Commands
The following commands allow you to configure logging functions on all Dell Force10 switches:
•
•
•
•
•
•
•
•
•
•
•
clear logging
logging hostname
logging buffered
logging console
logging facility
logging history
logging history size
logging monitor
logging on
logging source-interface
logging trap
Simple Network Management Protocol (SNMP) and Syslog | 207
www.dell.com | support.dell.com
•
•
•
show logging
snmp-server community
terminal monitor
clear logging
Clear the messages in the logging buffer.
Syntax
Defaults
clear logging
none
Command Modes
EXEC Privilege
Command
History
Version 8.3.17.0
Related
Commands
show logging
Supported on M I/O Aggregator
Displays logging settings and system messages in the internal buffer.
logging hostname
Configure an IP address or host name of a Syslog server where logging messages will be sent. Multiple
logging servers of IPv4 can be configured.
Syntax
logging {ipv4-address | hostname}
To disable logging, enter no logging.
Parameters
Defaults
Command Modes
Command
History
Related
Commands
208
|
ipv4-address
Enter an IPv4 address (A.B.C.D).
hostname
Enter the name of a host already configured and recognized by the switch.
Disabled
CONFIGURATION
Version 8.3.17.0
Supported on M I/O Aggregator
logging on
Enables the logging asynchronously to logging buffer, console, Syslog server, and
terminal lines.
logging trap
Enables logging to the Syslog server based on severity.
Simple Network Management Protocol (SNMP) and Syslog
logging buffered
Enable logging and specify which messages are logged to an internal buffer. By default, all messages
are logged to the internal buffer.
Syntax
logging buffered [level] [size]
To return to the default values, use the no logging buffered command. To disable logging stored to an
internal buffer, use the no logging buffered command.
Parameters
Defaults
Command Modes
Command
History
Usage
Information
Related
Commands
level
(OPTIONAL) Indicate a value from 0 to 7 or enter one of the following
equivalent words: emergencies, alerts, critical, errors, warnings, notifications,
informational, or debugging.
Default: 7 or debugging.
size
(OPTIONAL) Indicate the size, in bytes, of the logging buffer. The number of
messages buffered depends on the size of each message.
Range: 40960 to 524288.
Default: 40960 bytes.
level = 7; size = 40960 bytes
CONFIGURATION
Version 8.3.17.0
Supported on M I/O Aggregator
When you decrease the buffer size, all messages stored in the buffer are lost. Increasing the buffer size
does not affect messages stored in the buffer.
clear logging
Clears the logging buffer.
logging hostname
Returns the logging buffered parameters to the default setting.
show logging
Displays the logging setting and system messages in the internal buffer.
logging console
Specify which messages are logged to the console.
Syntax
logging console [level]
To return to the default values, use the logging hostname command. To disable logging to the console,
use the no logging console command.
Parameters
Defaults
Command Modes
Command
History
level
(OPTIONAL) Indicate a value from 0 to 7 or enter one of the following parameters: emergencies,
alerts, critical, errors, warnings, notifications, informational, or debugging.
Default: 7 or debugging.
7 or debugging
CONFIGURATION
Version 8.3.17.0
Supported on M I/O Aggregator
Simple Network Management Protocol (SNMP) and Syslog | 209
www.dell.com | support.dell.com
Related
Commands
clear logging
Clears the logging buffer.
logging hostname
Returns the logging console parameters to the default setting.
show logging
Displays the logging settings and system messages in the internal buffer.
logging facility
Configure the Syslog facility, used for error messages sent to Syslog servers.
Syntax
logging facility [facility-type]
To return to the default values, use the no logging facility command.
Parameters
facility-type
(OPTIONAL) Enter one of the following parameters.
• auth (authorization system)
• cron (Cron/at facility)
• deamon (system deamons)
• kern (kernel)
• local0 (local use)
• local1 (local use)
• local2 (local use)
• local3 (local use)
• local4 (local use)
• local5 (local use)
• local6 (local use)
• local7 (local use)
• lpr (line printer system)
• mail (mail system)
• news (USENET news)
• sys9 (system use)
• sys10 (system use)
• sys11 (system use)
• sys12 (system use)
• sys13 (system use)
• sys14 (system use)
• syslog (Syslog process)
• user (user process)
• uucp (Unix to Unix copy process)
The default is local7.
Defaults
Command Modes
Command
History
Related
Commands
210
|
local7
CONFIGURATION
Version 8.3.17.0
Supported on M I/O Aggregator
logging
hostname
Enables logging to a Syslog server.
logging on
Enables logging.
Simple Network Management Protocol (SNMP) and Syslog
logging history
Specify which messages are logged to the history table of the switch and the SNMP network
management station (if configured).
Syntax
logging history level
To return to the default values, use the no logging history command.
Parameters
Defaults
Command Modes
Command
History
Related
Commands
level
Indicate a value from 0 to 7 or enter one of the following equivalent words:
emergencies, alerts, critical, errors, warnings, notifications, informational, or
debugging.
The default is 4.
4 or warnings
CONFIGURATION
Version 8.3.17.0
Supported on M I/O Aggregator
show logging history
Displays information logged to the history buffer.
logging history size
Specify the number of messages stored in the FTOS logging history table.
Syntax
logging history size size
To return to the default values, use the no logging history size command.
Parameters
Defaults
Command Modes
Command
History
Usage
Information
Related
Commands
size
Indicate a value as the number of messages to be stored.
Range: 0 to 500.
Default: 1 message.
1 message
CONFIGURATION
Version 8.3.17.0
Supported on M I/O Aggregator
When the number of messages reaches the limit you set with the logging history size command, older
messages are deleted as newer ones are added to the table.
show logging history
Displays information logged to the history buffer.
Simple Network Management Protocol (SNMP) and Syslog | 211
www.dell.com | support.dell.com
logging monitor
Specify which messages are logged to Telnet applications.
Syntax
logging monitor [level]
To disable logging to terminal connections, use the no logging monitor command.
Parameters
Defaults
Command Modes
level
Indicate a value from 0 to 7 or enter one of the following parameters: emergencies, alerts,
critical, errors, warnings, notifications, informational, or debugging.
The default is 7 or debugging.
7 or debugging
CONFIGURATION
Command
History
Version 8.3.17.0
Related
Commands
logging hostname
Supported on M I/O Aggregator
Returns the logging monitor parameters to the default setting.
logging on
Specify that debug or error messages are asynchronously logged to multiple destinations, such as
logging buffer, Syslog server, or terminal lines.
Syntax
logging on
To disable logging to logging buffer, Syslog server and terminal lines, use the no logging on
command.
Defaults
Command Modes
Command
History
Usage
Information
Related
Commands
212
|
Enabled
CONFIGURATION
Version 8.3.17.0
Supported on M I/O Aggregator
When you use the no logging on command, messages are logged only to the console.
logging hostname
Enables logging to Syslog server.
logging buffered
Sets the logging buffered parameters.
logging console
Sets the logging console parameters.
logging monitor
Sets the logging parameters for the terminal connections.
Simple Network Management Protocol (SNMP) and Syslog
logging source-interface
Specify that the IP address of an interface is the source IP address of Syslog packets sent to the Syslog
server.
Syntax
logging source-interface interface
To disable this command and return to the default setting, use the no logging source-interface
command.
Parameters
interface
Enter the following keywords and slot/port or number information:
•
•
Defaults
Command Modes
Not configured.
CONFIGURATION
Command
History
Usage
Information
For a Ten Gigabit Ethernet interface, enter the keyword TenGigabitEthernet
followed by the slot/port information.
For VLAN interface, enter the keyword vlan followed by a number from 1 to 4094.
Version 8.3.17.0
Supported on M I/O Aggregator
Syslog messages contain the IP address of the interface used to egress the router. By configuring the
logging source-interface command, the Syslog packets contain the IP address of the interface
configured.
Related
Commands
logging
hostname
Enables the logging to another device.
logging trap
Specify which messages are logged to the Syslog server based the message severity.
Syntax
logging trap [level]
To return to the default values, use the no logging trap command. To disable logging, use the no
logging trap command.
Parameters
level
Defaults
Command Modes
Command
History
Related
Commands
Indicate a value from 0 to 7 or enter one of the following parameters: emergencies, alerts,
critical, errors, warnings, notifications, informational, or debugging.
The default is 6.
6 or informational.
CONFIGURATION
Version 8.3.17.0
Supported on M I/O Aggregator
logging
hostname
Enables the logging to another device.
logging on
Enables logging.
Simple Network Management Protocol (SNMP) and Syslog | 213
www.dell.com | support.dell.com
show logging
Displays the logging settings and system messages logged to the internal buffer of the switch.
Syntax
Parameters
Command Modes
show logging [number | [history [reverse] [number] | reverse [number] | summary | driverlog
[stack-unit number] | kernellog [stack-unit number]]
number
(OPTIONAL) Enter the number of message to be displayed on the output.
Range: 1 to 65535
history
(OPTIONAL) Enter the keyword history to view only information in the Syslog history
table.
reverse
(OPTIONAL) Enter the keyword reverse to view the Syslog messages in FIFO (first in,
first out) order.
summary
(OPTIONAL) Enter the keyword summary to view a table showing the number of
messages per type and per slot.
driverlog
(OPTIONAL) Enter the keyword driverlog to view the driverlog information per
stack-unit.
Enter the keyword stack-unit followed by the stack member ID of the switch for which
you want to display the driver log.
Range: 0 to 1
kernellog
(OPTIONAL) Enter the keyword kernellog to view the kernellog information per
stack-unit.
Enter the keyword stack-unit followed by the stack member ID of the switch for which
you want to display the driver log.
Range: 0 to 1
EXEC
EXEC Privilege
Command
History
214
|
Version 8.3.17.0
Supported on M I/O Aggregator
Simple Network Management Protocol (SNMP) and Syslog
Example 1
Figure 20-1.
show logging Command Example
FTOS#show logging
Syslog logging: enabled
Console logging: level debugging
Monitor logging: level debugging
Buffer logging: level debugging, 168 Messages Logged, Size (40960
bytes)
Trap logging: level informational
Logging to 172.16.1.162
Logging to 10.10.10.4
Logging to 10.1.2.4
Logging to 172.31.1.4
Logging to 133.33.33.4
Aug 1 15:05:53: %STKUNIT1-M:CP %SYS-5-CONFIG_I: Configured from console
Jul 31 20:25:40: %STKUNIT1-M:CP %SYS-5-CONFIG_I: Configured from
console
Jul 31 20:14:03: %STKUNIT1-M:CP %SYS-5-CONFIG_I: Configured from
console
Jul 31 20:03:58: %STKUNIT1-M:CP %SYS-5-CONFIG_I: Configured from
console
Jul 31 18:22:10: %STKUNIT1-M:CP %SYS-5-CONFIG_I: Configured from
console
Jul 31 15:50:30: %STKUNIT1-M:CP %SYS-5-CONFIG_I: Configured from
console
Jul 31 14:26:22: %STKUNIT1-M:CP %SYS-5-CONFIG_I: Configured from
console
Jul 31 14:26:17: %STKUNIT1-M:CP %SEC-3-AUTHENTICATION_ENABLE_SUCCESS:
Enable pas
sword authentication success on console
Jul 31 14:26:17: %STKUNIT1-M:CP %SEC-4-ENABLE_PASSW_NOT_CONFIGURED:
Enable passw
ord is required for authentication but not configured
Jul 31 10:38:12: %STKUNIT1-M:CP %SYSADM-5-CPU_THRESHOLD_CLR: Overall cpu
usage o
f management-unit drops below threshold. Cpu1minUsage (65%)
--More--
Example 2
Figure 20-2.
show logging history Command Example
FTOS#show logging history
Syslog History Table: 1 maximum table entries,
saving level warnings or higher
SNMP notifications not Enabled
May 22 08:53:09: %STKUNIT0-M:CP %SEC-3-AUTHENTICATION_ENABLE_SUCCESS:
Enable password authentication success on vty0 ( 10.11.68.22 )
FTOS#
Simple Network Management Protocol (SNMP) and Syslog | 215
www.dell.com | support.dell.com
Example 3
Figure 20-3.
show logging driverlog Command Example
FTOS#show logging driverlog stack-unit 1
0:Task(tUsrRoot): [
45232]SS DRV DEBUG: Wrapper init complete
1:Task(tUsrRoot): [
206775]SS DRV DEBUG: Core init complete
2:Task(tUsrRoot): [
221545]SS DRV DEBUG: SMUX-DRV: BASE MODUEL in
Fanout ENABLED
3:Task(tUsrRoot): [
24038]SS DRV DEBUG: port:32 isfanout:1
4:Task(tUsrRoot): [
27]SS DRV DEBUG: port:36 isfanout:1
5:Task(tUsrRoot): [
19]SS DRV DEBUG: port:40 isfanout:0
6:Task(tUsrRoot): [
17]SS DRV DEBUG: port:44 isfanout:0
7:Task(tUsrRoot): [
22]SS DRV DEBUG: port:48 isfanout:1
8:Task(tUsrRoot): [
22]SS DRV DEBUG: port:52 isfanout:1
9:Task(tUsrRoot): [
33]SS DRV DEBUG: Appl init complete
10:Task(tUsrRoot): [
2590]SS DRV DEBUG: Util Init complete
11:Task(tUsrRoot): [
21]SS DRV DEBUG: Device Entry Get Complete
12:Task(tUsrRoot): [
25]SS DRV DEBUG: Sysconf init complete
13:Task(tUsrRoot): [
19]SS DRV DEBUG: Initializing default soc/sal
configs
14:Task(tUsrRoot): [
237]SS DRV DEBUG: sysconf probe complete
15:Task(tUsrRoot): [
118]SS DRV DEBUG: Updating based on Optm
16:Task(tUsrRoot): [
10351]SS DRV DEBUG: Updating based on Fanout
17:Task(tUsrRoot): [
2561]SS DRV DEBUG: unit 0 localWc6 speed10
18:Task(tUsrRoot): [
24]SS DRV DEBUG: unit 0 localWc5 speed10
19:Task(tUsrRoot): [
21]SS DRV DEBUG: unit 0 localWc3 speed40
20:Task(tUsrRoot): [
18]SS DRV DEBUG: unit 0 localWc2 speed40
snmp-server community
Configure a new community string access for SNMPv1, and v2.
Syntax
snmp-server community community-name {ro}
To remove access to a community, use the no snmp-server community community-string {ro | rw}
command.
Parameters
Defaults
Command Modes
Command
History
Usage
Information
Example
community-name
Enter a text string (up to 20 characters long) to act as a password for SNMP.
ro
Enter the keyword ro to specify read-only permission.
none
CONFIGURATION
Version 8.3.17.0
Supported on M I/O Aggregator
Figure 20-4 configures a community named guest that is mapped to the security named guestuser
with Read Only (ro) permissions.
Figure 20-4.
snmp-server community Command Example
FTOS#config
FTOS(conf)# snmp-server community guest ro
Related
Commands
216
|
show running-config
Displays the current SNMP configuration and defaults.
Simple Network Management Protocol (SNMP) and Syslog
terminal monitor
Configure the FTOS to display messages on the monitor/terminal.
Syntax
terminal monitor
To return to default settings, use the terminal no monitor command.
Defaults
Command Modes
Disabled.
EXEC
EXEC Privilege
Command
History
Version 8.3.17.0
Related
Commands
logging monitor
Supported on M I/O Aggregator
Sets the logging parameters on the monitor/terminal.
Simple Network Management Protocol (SNMP) and Syslog | 217
www.dell.com | support.dell.com
218
|
Simple Network Management Protocol (SNMP) and Syslog
21
Stacking Commands
Overview
Stacking is supported on an Aggregator only on the 40GbE ports on the base module. Stacking is
limited to two Aggregators in the same chassis in a single stack. Up to three stacks are supported in an
M1000e chassis.
Stacking provides a single point of management and NIC teaming for high availability and higher
throughput. To configure an Aggregator stack, you must use the CLI.
The stacking commands are always available and operational, whether or not an Aggregator has a
stacking module inserted. You can use the commands to pre-configure an Aggregator, so that the
configuration settings are invoked when the Aggregator is attached to other Aggregator blades.
For more information about using the Aggregator stacking feature, refer to the “Stacking Aggregators”
chapter in the Dell Force10 Configuration Guide for the M I/O Aggregator.
Stacking Commands
You can use the following commands to manage a stack of Aggregator IO modules:
•
•
•
•
•
•
•
power-cycle stack-unit
reset stack-unit
show system stack-ports
show system stack-unit iom-mode
show system stack-unit fanout
show system stack-unit stack-group
stack-unit iom-mode
power-cycle stack-unit
To hard reset any stack unit including master unit.
Syntax
power-cycle stack-unit [0-5 | all]
Default
None
Command Modes
EXEC Privilege
Stacking Commands | 219
www.dell.com | support.dell.com
Command
History
Usage
Information
Version 8.3.17.0
Supported on M I/O Aggregator
This command is used to reset the stack-unit. The master unit can also be power cycled using this
command.
reset stack-unit
Reset any designated stack member except the management unit (master unit).
Syntax
Parameters
Default
reset stack-unit 0-5 hard
0-5
Enter the stack member unit identifier of the stack member to reset.
hard
Reset the stack unit if the unit is in a problem state.
none
Command Modes
EXEC Privilege
Command
History
Version 8.3.17.0
Usage
Information
Supported on M I/O Aggregator
Resetting the management unit is not allowed (an error message is displayed if you try to do so).
Resetting is a soft reboot, including flushing the forwarding tables.
You can run this command directly on the stack standby unit (Standby Master) to reset the standby.
You cannot reset any other unit from the standby unit.
Example
Figure 21-1.
reset stack-unit Command Example on the Stack Standby Unit
FTOS#show system brief
Stack MAC : 00:1e:c9:f1:00:9b
-- Stack Info -Unit UnitType
Status
ReqTyp
CurTyp
Version
Ports
----------------------------------------------------------------------------------0
Management
online
I/O-Aggregator I/O-Aggregator 8-3-17-46
56
1
Standby
online
I/O-Aggregator I/O-Aggregator 8-3-17-46
56
2
Member
not present
3
Member
not present
4
Member
not present
5
Member
not present
FTOS#
FTOS#reset stack-unit 0 <<Resetting master not allowed
% Error: Reset of master unit is not allowed.
FTOS#
FTOS#reset stack-unit 1
FTOS#01:02:00: %STKUNIT0-M:CP %CHMGR-5-STACKUNIT_RESET: Stack unit 1 being reset
01:02:00: %STKUNIT0-M:CP %IFMGR-1-DEL_PORT: Removed port: Te 1/1-32,41-56
01:02:00: %STKUNIT0-M:CP %CHMGR-2-STACKUNIT_DOWN: Stack unit 1 down - reset
01:02:00: %STKUNIT1-S:CP %IFMGR-1-DEL_PORT: Removed port: Te 1/1-32,41-56
01:02:05: %I/O-Aggregator:0 %IFAGT-5-STACK_PORT_LINK_DOWN: Changed stack port
state to down: 0/37
01:02:11: %STKUNIT0-M:CP %POLLMGR-2-ALT_STACK_UNIT_STATE: Alternate Stack-unit is
not present
FTOS#01:02:12: %STKUNIT0-M:CP %CHMGR-2-STACKUNIT_DOWN: Stack unit 1 down - card
removed
220
|
Stacking Commands
Related
Commands
reload
Reboots FTOS.
power-cycle stack-unit
Resets the designated stack member.
show system stack-ports
Displays information about the stacking ports on all switches in the M I/O Aggregator switch stack.
Syntax
Parameters
Defaults
Command Modes
show system stack-ports [status | topology]
status
(OPTIONAL) Enter the keyword status to display the command output without the
Connection field.
topology
(OPTIONAL) Enter the keyword topology to limit the table to just the Interface and
Connection fields.
none
EXEC
EXEC Privilege
Command
History
Example
Version 8.3.17.0
Figure 21-2.
Supported on M I/O Aggregator
show system stack-ports Command Example
FTOS#show system stack-ports
Topology: Daisy chain
Interface Connection
Link Speed
Admin
Link
Trunk
(Gb/s)
Status
Status
Group
-----------------------------------------------------------------0/33
40
up
down
0/37
1/37
40
up
up
1/33
40
up
down
1/37
0/37
40
up
up
FTOS#
Example
Figure 21-3.
show system stack-ports status Command Example
TOS#show system stack-ports status
Topology: Daisy chain
Interface Link Speed
Admin
Link
Trunk
(Gb/s)
Status
Status
Group
------------------------------------------------------0/33
40
up
down
0/37
40
up
up
1/33
40
up
down
1/37
40
up
up
Stacking Commands | 221
www.dell.com | support.dell.com
Example
Figure 21-4.
show system stack-ports topology Command Example
FTOS#show system stack-ports topology
Topology: Daisy chain
Interface Connection
Trunk
Group
----------------------------0/33
0/37
1/37
1/33
1/37
0/37
FTOS#
Related
Commands
Table 21-1.
show system stack-ports Command Description
Field
Description
Topology
Lists the topology of stack ports connected: Ring, Daisy chain, or Standalone
Interface
The unit/port ID of the connected stack port on this unit
Link Speed
Link Speed of the stack port in Gb/s
Admin
Status
The only currently listed status is Up.
Connection
The stack port ID to which this unit’s stack port is connected
power-cycle stack-unit
Resets the designated stack member.
show diag
Displays the data plane or management plane input and output statistics of the
designated component of the designated stack member.
show system
Displays the current status of all stack members or a specific member.
show system stack-unit iom-mode
Displays the current iom-mode (stack/standalone) and the mode configured after next reboot.
Syntax
show system stack-unit <unit-number> iom-mode[configured]
Command Modes
EXEC Privilege
Command
History
Version 8.3.17.0
Supported on M I/O Aggregator
show system stack-unit fanout
Displays the current 40GbE ports configured in fanout mode.
Syntax
222
show system stack-unit <unit-number> fanout [configured]
Command Modes
EXEC Privilege
Command
History
Version 8.3.17.0
|
Stacking Commands
Supported on M I/O Aggregator
Example
Figure 21-5.
show system stack-unit fanout Command Example
FTOS#show system stack-unit 0 fanout ?
configured
Configured fan out ports
FTOS#show system stack-unit 0 fanout configured ?
|
Pipe through a command
<cr>
FTOS#show system stack-unit 0 fanout configured
Configured fan out ports in stack-unit 0
Configured
Next Boot
33
33
37
37
41
41
45
45
FTOS#
show system stack-unit stack-group
Displays the stack-groups present/configured for a M I/O Aggregator stack unit.
Syntax
Parameters
show system stack-unit <unit-number> stack-group [configured]
unit number
<0-5>
Command Modes
EXEC Privilege
Command
History
Version 8.3.17.0
Related
Commands
Example
Number of the member stack unit. Valid values: 0 to 5. Default: 0.
Supported on M I/O Aggregator
reload
Reboots FTOS.
show system
Displays the current status of all stack members or a specific member.
Figure 21-6.
show system stack-unit stack-group Command Example
FTOS#show system stack-unit 0 stack-group ?
configured
Configured stack groups
|
Pipe through a command
<cr>
FTOS#show system stack-unit 0 stack-group configured
Configured stack groups in stack-unit 0
FTOS##show system stack-unit 0 stack-group
Stack group
Ports
-----------------------------------0
0/33
1
0/37
2
0/41
3
0/45
FTOS#
Stacking Commands | 223
www.dell.com | support.dell.com
stack-unit iom-mode
Toggle the M I/O Aggregator operating mode from standalone to stack or vice-versa.
Syntax
Parameters
Defaults
Command Modes
Command
History
Related
Commands
Example
stack-unit <unit-number> iom-mode [stack | standalone]
unit number
<0-5>
Number of the member stack unit. Valid values: 0 to 5. Default: 0.
stack
Enable stack mode.
standalone
Enable stand-alone mode.
standalone
CONFIGURATION
Version 8.3.17.0
Supported on M I/O Aggregator
reload
Reboots FTOS.
show system
Displays the current status of all stack members or a specific member.
Figure 21-7.
show system stack-unit stack-group Command Example
FTOS(conf)#stack-unit 0 iom-mode stack
% You are about to stack your IOA module, please reload the IOA
and then plug in the stacking cable for the changes to take effect.
FTOS(conf)#
FTOS#
224
|
Stacking Commands
22
Storm Control
Overview
The Dell Force10 operating software (FTOS) storm control feature allows users to limit or suppress
traffic during a traffic storm.
Note: When iSCSI storage devices are detected on the server-ports, storm-control is disabled
on the those ports. When the iSCSI devices are off the ports, storm-control is enabled again.
Storm Control Commands
The storm control commands are:
•
•
io-aggregator broadcast storm-control
show io-aggregator broadcast storm-control status
io-aggregator broadcast storm-control
Rate-limit the broadcast traffic to 1 Gbps.
Syntax
io-aggregator broadcast storm-control
To disable storm control, use the no io-aggregator broadcast storm-control command.
Defaults
Command Modes
Command
History
Enabled
CONFIGURATION
Version 8.3.17.0
Supported on M I/O Aggregator
show io-aggregator broadcast storm-control status
Shows if storm control is enabled or disabled. If enabled, displays information on the rate limit value.
Syntax
Command Modes
show io-aggregator broadcast storm-control status
EXEC Privilege
Storm Control | 225
www.dell.com | support.dell.com
Command
History
226
Example
Version 8.3.17.0
Figure 22-1.
Supported on M I/O Aggregator
calendar set Command Example
FTOS#show io-aggregator broadcast storm-control status
Storm-Control Enabled
Broadcast Traffic limited to 1000 Mbps
FTOS#
|
Storm Control
23
System Time
Overview
The commands in this chapter configure time values on the system, either using the Dell Force10
operating software (FTOS), the hardware, or using the network time protocol (NTP). With NTP, the
switch can act only as a client to an NTP clock host. For more information, refer to the “Network Time
Protocol” section of the Management chapter in the Dell Force10 Configuration Guide for the M I/O
Aggregator.
Time Commands
The NTP commands are:
•
•
•
•
•
•
•
•
•
calendar set
show calendar
show clock
clock read-calendar
clock set
clock summer-time date
clock summer-time recurring
clock timezone
clock update-calendar
calendar set
Set the time and date for the switch hardware clock.
Syntax
Parameters
calendar set time month day year
time
Enter the time in hours:minutes:seconds. For the hour variable, use the 24-hour format, for
example, 17:15:00 is 5:15 pm.
month
Enter the name of one of the 12 months in English.
You can enter the name of a day to change the order of the display to time day month
year.
System Time | 227
www.dell.com | support.dell.com
day
Enter the number of the day.
Range: 1 to 31.
You can enter the name of a month to change the order of the display to time day month
year.
year
Enter a four-digit number as the year.
Range: 1993 to 2035.
Command Modes
EXEC Privilege
Command
History
Version 8.3.17.0
Example
Figure 23-1.
Supported on M I/O Aggregator
calendar set Command Example
FTOS#calendar set 12:11:00 21 may 2012
FTOS#
Usage
Information
You can change the order of the month and day parameters to enter the time and date as time day
month year.
In the switch, the hardware clock is separate from the software and is called the calendar. This
hardware clock runs continuously. After the hardware clock (the calendar) is set, the FTOS
automatically updates the software clock after system bootup.You cannot delete the hardware clock
(calendar).
To manually update the software with the hardware clock, use the command clock read-calendar.
Related
Commands
clock read-calendar
Sets the software clock based on the hardware clock.
clock set
Sets the software clock.
clock update-calendar
Sets the hardware clock based on the software clock.
show clock
Displays the clock settings.
show calendar
Displays the current date and time based on the switch hardware clock.
Syntax
Command Modes
show calendar
EXEC
EXEC Privilege
Command
History
Example
Version 8.3.17.0
Figure 23-2.
Supported on M I/O Aggregator
show clock Command Example
FTOS#show calendar
12:29:34 pacific Tue May 22 2012
FTOS#
228
|
System Time
Related
Commands
show clock
Displays the time and date from the switch software clock.
show clock
Displays the current clock settings.
Syntax
Parameters
Command Modes
show clock [detail]
detail
(OPTIONAL) Enter the keyword detail to view the source information of the clock.
EXEC
EXEC Privilege
Command
History
Example
Version 8.3.17.0
Figure 23-3.
Supported on M I/O Aggregator
show clock Command Example
FTOS#show clock
12:30:04.402 pacific Tue May 22 2012
FTOS#
Example
Figure 23-4.
show clock detail Command Example
FTOS#show clock detail
12:30:26.892 pacific Tue May 22 2012
Time source is RTC hardware
Summer time starts 00:00:00 UTC Wed Mar 14 2012
Summer time ends 00:00:00 pacific Wed Nov 7 2012
FTOS#
Related
Commands
clock summer-time recurring
Displays the time and date from the switch hardware clock.
show calendar
Displays the time and date from the switch hardware clock.
clock read-calendar
Set the software clock on the switch from the information set in hardware clock (calendar).
Syntax
clock read-calendar
Defaults
Not configured.
Command Modes
EXEC Privilege
Command
History
Version 8.3.17.0
Usage
Information
Supported on M I/O Aggregator
In the switch, the hardware clock is separate from the software and is called the calendar. This
hardware clock runs continuously. After the hardware clock (the calendar) is set, the FTOS
automatically updates the software clock after system bootup.
System Time | 229
www.dell.com | support.dell.com
You cannot delete this command (that is, there is not a “no” version of this command).
clock set
Set the software clock in the switch.
Syntax
Parameters
Defaults
clock set time month day year
time
Enter the time in hours:minutes:seconds. For the hour variable, use the 24-hour format, example,
17:15:00 is 5:15 pm.
month
Enter the name of one of the 12 months, in English.
You can enter the number of a day and change the order of the display to time day month year.
day
Enter the number of the day.
Range: 1 to 31.
You can enter the name of a month to change the order of the display to time month day year.
year
Enter a four-digit number as the year.
Range: 1993 to 2035.
Not configured
Command Modes
EXEC Privilege
Command
History
Version 8.3.17.0
Example
Figure 23-5.
Supported on M I/O Aggregator
clock set Command Example
FTOS#clock set 12:11:00 21 may 2012
FTOS#
Usage
Information
You can change the order of the month and day parameters to enter the time and date as time day
month year. You cannot delete the software clock.
The software clock runs only when the software is up. The clock restarts, based on the hardware clock,
when the switch reboots.
Dell Force10 recommends using an outside time source, such as NTP, to ensure accurate time on the
switch.
230
|
System Time
clock summer-time date
Set a date (and time zone) on which to convert the switch to daylight saving time on a one-time basis.
Syntax
clock summer-time time-zone date start-month start-day start-year start-time end-month end-day
end-year end-time [offset]
To delete a daylight saving time zone configuration, use the no clock summer-time command.
Parameters
Defaults
Command Modes
Command
History
Related
Commands
time-zone
Enter the three-letter name for the time zone. This name is displayed in the show clock
output.
start-month
Enter the name of one of the 12 months in English.
You can enter the name of a day to change the order of the display to time day month
year.
start-day
Enter the number of the day.
Range: 1 to 31.
You can enter the name of a month to change the order of the display to time day month
year.
start-year
Enter a four-digit number as the year.
Range: 1993 to 2035.
start-time
Enter the time in hours:minutes. For the hour variable, use the 24-hour format, example,
17:15 is 5:15 pm.
end-day
Enter the number of the day.
Range: 1 to 31.
You can enter the name of a month to change the order of the display to time day month
year.
end-month
Enter the name of one of the 12 months in English.
You can enter the name of a day to change the order of the display to time day month
year.
end-time
Enter the time in hours:minutes. For the hour variable, use the 24-hour format, example,
17:15 is 5:15 pm.
end-year
Enter a four-digit number as the year.
Range: 1993 to 2035.
offset
(OPTIONAL) Enter the number of minutes to add during the summer-time period.
Range: 1 to1440.
Default: 60 minutes
Not configured.
CONFIGURATION
Version 8.3.17.0
calendar set
Supported on M I/O Aggregator
Sets the hardware clock.
System Time | 231
www.dell.com | support.dell.com
clock summer-time recurring
Sets a date (and time zone) on which to convert the switch to daylight saving
time each year.
show clock
Displays the current clock settings.
clock summer-time recurring
Set the software clock to convert to daylight saving time on a specific day each year.
Syntax
clock summer-time time-zone recurring [start-week start-day start-month start-time end-week
end-day end-month end-time [offset]]
To delete a daylight saving time zone configuration, use the no clock summer-time command.
Parameters
time-zone
Enter the three-letter name for the time zone. This name is displayed in the show clock
output.
You can enter up to eight characters.
start-week
(OPTIONAL) Enter one of the following as the week that daylight saving begins and then
enter values for start-day through end-time:
•
•
•
start-day
Enter the name of the day that you want daylight saving time to begin. Use English three
letter abbreviations, for example, Sun, Sat, Mon, etc.
Range: Sun – Sat
start-month
Enter the name of one of the 12 months in English.
start-time
Enter the time in hours:minutes. For the hour variable, use the 24-hour format, example,
17:15 is 5:15 pm.
end-week
Enter the one of the following as the week that daylight saving ends:
•
•
•
Defaults
Command Modes
Command
History
232
|
System Time
week-number: Enter a number from 1-4 as the number of the week in the month to
start daylight saving time.
first: Enter this keyword to start daylight saving time in the first week of the month.
last: Enter this keyword to start daylight saving time in the last week of the month.
week-number: enter a number from 1-4 as the number of the week to end daylight
saving time.
first: enter the keyword first to end daylight saving time in the first week of the
month.
last: enter the keyword last to end daylight saving time in the last week of the month.
end-day
Enter the weekday name that you want daylight saving time to end. Enter the weekdays
using the three letter abbreviations, for example Sun, Sat, Mon etc.
Range: Sun to Sat
end-month
Enter the name of one of the 12 months in English.
end-time
Enter the time in hours:minutes:seconds. For the hour variable, use the 24-hour format,
example, 17:15:00 is 5:15 pm.
offset
(OPTIONAL) Enter the number of minutes to add during the summer-time period.
Range: 1 to 1440.
Default: 60 minutes.
Not configured.
CONFIGURATION
Version 8.3.17.0
Supported on M I/O Aggregator
Related
Commands
calendar set
Sets the hardware clock.
clock summer-time date
Sets a date (and time zone) on which to convert the switch to daylight saving
time on a one-time basis.
show clock
Displays the current clock settings.
clock timezone
Configure a timezone for the switch.
Syntax
clock timezone timezone-name offset
To delete a timezone configuration, use the no clock timezone command.
Parameters
timezone-name
Enter the name of the timezone. You cannot use spaces.
offset
Enter one of the following:
•
•
Default
Command Modes
Command
History
Usage
Information
a number from 1 to 23 as the number of hours in addition to UTC for the
timezone.
a minus sign (-) followed by a number from 1 to 23 as the number of hours
Not configured.
CONFIGURATION
Version 8.3.17.0
Supported on M I/O Aggregator
Coordinated universal time (UTC) is the time standard based on the International Atomic Time
standard, commonly known as Greenwich Mean time. When determining system time, you must
include the differentiator between UTC and your local timezone. For example, San Jose, CA is the
Pacific Timezone with a UTC offset of -8.
clock update-calendar
Set the switch hardware clock based on the software clock.
Syntax
clock update-calendar
Defaults
Not configured.
Command Modes
EXEC Privilege
Command
History
Version 8.3.17.0
Usage
Information
Supported on M I/O Aggregator
Use this command only if you are sure that the hardware clock is inaccurate and the software clock is
correct.
You cannot delete this command (that is, there is not a “no” form of this command).
System Time | 233
www.dell.com | support.dell.com
Related
Commands
234
|
System Time
calendar set
Sets the hardware clock.
24
Uplink Failure Detection (UFD)
Overview
Uplink failure detection (UFD) provides detection of the loss of upstream connectivity and, if used
with network interface controller (NIC) teaming, automatic recovery from a failed link.
UFD Commands
The UFD commands are:
•
•
•
debug uplink-state-group
show running-config uplink-state-group
show uplink-state-group
debug uplink-state-group
Enable debug messages for events related to a specified uplink-state group or all groups.
Syntax
debug uplink-state-group [group-id]
To turn off debugging event messages, use the no debug uplink-state-group [group-id] command.
Parameters
Defaults
group-id
Enables debugging on the specified uplink-state group. Valid group-id values
are 1 to 16.
none
Command Modes
EXEC Privilege
Command
History
Version 8.3.17.0
Supported on M I/O Aggregator
show running-config uplink-state-group
Displays the current configuration of one or more uplink-state groups.
Syntax
show running-config uplink-state-group [group-id]
Uplink Failure Detection (UFD) | 235
www.dell.com | support.dell.com
Parameters
Defaults
Command Modes
group-id
Displays the current configuration of all uplink-state groups or a specified
group. Valid group-id values are 1 to 16.
none
EXEC
EXEC Privilege
Command
History
Example
Version 8.3.17.0
Figure 24-1.
Supported on M I/O Aggregator
show running-config uplink-state-group Command Example
FTOS#sho running-config uplink-state-group
!
uplink-state-group 1
downstream TenGigabitEthernet 0/1-32
downstream TenGigabitEthernet 1/1-32
upstream Port-channel 128
defer-timer 10
FTOS#
Related
Commands
show uplink-state-group
Displays status information on a specified uplink-state group or all groups.
show uplink-state-group
Displays status information on a specified uplink-state group or all groups.
Syntax
Parameters
Defaults
Command Modes
show uplink-state-group [group-id] [detail]
group-id
Displays status information on a specified uplink-state group or all
groups. Valid group-id values are 1 to 16.
detail
Displays additional status information on the upstream and
downstream interfaces in each group
none
EXEC
EXEC Privilege
Command
History
236
|
Version 8.3.17.0
Uplink Failure Detection (UFD)
Supported on M I/O Aggregator
Example
Figure 24-2.
show uplink-state-group Command Examples
FTOS#show uplink-state-group Command Example
FTOS#show uplink-state-group
Uplink State Group: 1
Status: Enabled, Down
FTOS#
FTOS#show uplink-state-group 1
Uplink State Group: 1
Status: Enabled, Down
FTOS#
FTOS#
FTOS#show uplink-state-group 1 detail
(Up): Interface up
Uplink State Group
Defer Timer
Upstream Interfaces
Downstream Interfaces
5(Dis)
(Dwn): Interface down
:
:
:
:
(Dis): Interface disabled
1
Status: Enabled, Down
10 sec
Po 128(Dwn)
Te 0/1(Dis) Te 0/2(Dis) Te 0/3(Dis) Te 0/4(Dis) Te 0/
Te 0/6(Dis) Te 0/7(Dis) Te 0/8(Dis) Te 0/9(Dis) Te 0/
10(Dis)
Te 0/11(Dis) Te 0/12(Dis) Te 0/13(Dis) Te 0/14(Dis) Te 0/
15(Dis)
Te 0/16(Dis) Te 0/17(Dis) Te 0/18(Dis) Te 0/19(Dis) Te 0/
20(Dis)
Te 0/21(Dis) Te 0/22(Dis) Te 0/23(Dis) Te 0/24(Dis) Te 0/
25(Dis)
Te 0/26(Dis) Te 0/27(Dis) Te 0/28(Dis) Te 0/29(Dis) Te 0/
30(Dis)
Te 0/31(Dis) Te 0/32(Dis) Te 1/1(Dis) Te 1/2(Dis) Te 1/
3(Dis)
Te 1/4(Dis) Te 1/5(Dis) Te 1/6(Dis) Te 1/7(Dis) Te 1/8(Dis)
Te 1/9(Dis) Te 1/10(Dis) Te 1/11(Dis) Te 1/12(Dis) Te 1/
13(Dis)
Te 1/14(Dis) Te 1/15(Dis) Te 1/16(Dis) Te 1/17(Dis) Te 1/
18(Dis)
Te 1/19(Dis) Te 1/20(Dis) Te 1/21(Dis) Te 1/22(Dis) Te 1/
23(Dis)
Te 1/24(Dis) Te 1/25(Dis) Te 1/26(Dis) Te 1/27(Dis) Te 1/
28(Dis)
Te 1/29(Dis) Te 1/30(Dis) Te 1/31(Dis) Te 1/32(Dis)
FTOS#
Related
Commands
show running-config
uplink-state-group
Displays the current configuration of one or more uplink-state groups.
Uplink Failure Detection (UFD) | 237
www.dell.com | support.dell.com
238
|
Uplink Failure Detection (UFD)
25
Debugging and Diagnostics
This chapter contains three sections:
•
•
Offline Diagnostic Commands
Hardware Commands
Offline Diagnostic Commands
The offline diagnostics test suite is useful for isolating faults and debugging hardware. While tests are
running, the Dell Force10 operating software (FTOS) results are saved as a text file
(TestReport-SU-X.txt) in the flash directory. The show file command is available only on Master and
Standby.
Important Points to Remember
•
•
•
•
•
Offline diagnostics can only be run when the unit is offline.
Offline diagnostics cannot be run in Stacking mode.
You can only run offline diagnostics on a unit to which you are connected via the console. In other
words, you cannot run diagnostics on a unit to which you are connected via a stacking link.
Diagnostic results are stored in a file (TestReport-SU-X.txt) in the flash directory. To review the
results, use the show file command, which prints the results to the screen.
Diagnostics only test connectivity, not the entire data path.
The offline diagnostics commands are:
•
•
•
•
diag stack-unit
offline stack-unit
online stack-unit
show diag
Hardware Commands
These commands display information from a hardware sub-component or ASIC.
The hardware commands are:
•
•
•
clear hardware stack-unit
hardware watchdog
show diag
Debugging and Diagnostics | 239
www.dell.com | support.dell.com
•
•
show hardware stack-unit
show hardware system-flow
clear hardware stack-unit
Clear statistics from selected hardware components.
Syntax
Parameters
clear hardware stack-unit 0–5 {counters | unit 0–1 counters | cpu data-plane statistics | cpu
party-bus statistics | stack-port 0–52}
stack-unit 0-5
Enter the keyword stack-unit followed by 0 to 5 to select a particular stack
member and then enter one of the following command options to clear a
specific collection of data.
counters
Enter the keyword counters to clear the counters on the selected stack
member.
unit 0–0 counters
Enter the keyword unit along with a port-pipe number, from 0 to 1,
followed by the keyword counters to clear the counters on the selected
port-pipe.
cpu data-plane statistics
Enter the keywords cpu data-plane statistics to clear the data plane
statistics.
cpu party-bus statistics
Enter the keywords cpu party-bus statistics to clear the management
statistics.
stack-port 33–56
Enter the keyword stack-port followed by the port number of the stacking
port to clear the statistics of the particular stacking port.
Range: 33 to 56
Note: You can identify stack port numbers by physical inspection of
the rear modules. The numbering is the same as for the 10G ports.
You can also inspect the output of the show system stack-ports
command.
Defaults
Command Modes
EXEC Privilege
Command
History
Version 8.3.17.0
Related
Commands
240
none
|
show diag
Debugging and Diagnostics
Supported on M I/O Aggregator
Displays the data plane or management plane input and output statistics of the
designated component of the designated stack member.
diag stack-unit
Run offline diagnostics on a stack unit.
Syntax
diag stack-unit number {alllevels | level0 | level1 | level2 [verbose no-reboot] | terminate | interactive
{test <id>}
Defaults
number
Enter the stack-unit number.
Range: 0 to 5
alllevels
Enter the keyword alllevels to run the complete set of offline diagnostic tests.
level0
Enter the keyword level0 to run Level 0 diagnostics. Level 0 diagnostics check for the
presence of various components and perform essential path verifications. In addition, they
verify the identification registers of the components on the board.
level1
Enter the keyword Level1 to run Level 1 diagnostics. Level 1 diagnostics is a smaller set of
diagnostic tests with support for automatic partitioning. They perform status/self test for all
the components on the board and test their registers for appropriate values. In addition, they
perform extensive tests on memory devices (e.g., SDRAM, flash, NVRAM, EEPROM, and
CPLD) wherever possible. There are no tests on 10G links. At this level, stack ports are shut
down automatically.
level2
Enter the keyword level2 to run Level 2 diagnostics. Level 2 diagnostics is a full set of
diagnostic tests with no support for automatic partitioning. Level 2 diagnostics are used
primarily for on-board loopback tests and more extensive component diagnostics. Various
components on the board are put into loop back mode, and test packets are transmitted
through those components. These diagnostics also perform snake tests using VLAN
configurations. You must physically remove the unit from the stack to test 10G links.
verbose
Enter the keyword verbose to run the diagnostic in verbose mode. Verbose mode gives more
information in the output than standard mode.
no-reboot
Enter the keyword no-reboot to avoid automatic rebooting of the chassis after completion of
diagnostic execution. Generally, this option is never used because if you run the diagnostic
once again without rebooting the chassis, it may cause an issue with the diagnostic results.
terminate
Enter the keyword terminate to stop the execution of the level diag that is already started
using the diag stack-unit command. Once this CLI is issued, syslogs indicating the
termination of the diag test is displayed. The diag results for the executed tests are stored in
the flash directory (TestReport-SU-X.txt).
interactive
Enter the keyword interactive to run some individual diag tests such as POWERLEDTEST,
STATUSLEDTEST and so on. The help option under the interactive command displays the
list of tests that can be run.
none
Command Modes
EXEC Privilege
Command
History
Version 8.3.17.0
Supported on M I/O Aggregator
hardware watchdog
Set the watchdog timer to trigger a reboot and restart the system.
Syntax
Defaults
hardware watchdog
Enabled
Debugging and Diagnostics | 241
www.dell.com | support.dell.com
Command Mode
CONFIGURATION
Command
History
Usage
Information
Version 8.3.17.0
Supported on M I/O Aggregator
This command enables a hardware watchdog mechanism that automatically reboots an FTOS switch/
router with a single unresponsive unit. This is a last resort mechanism intended to prevent a manual
power cycle.
offline stack-unit
Place a stack unit in the offline state.
Syntax
offline stack-unit number
Parameters
Defaults
number
none
Command Mode
EXEC Privilege
Command
History
Version 8.3.17.0
Usage
Information
Enter the stack unit number.
Range: 0 to 5
Supported on M I/O Aggregator
While executing the offline stack unit CLI, the following warning message is displayed:
Warning - offline of stack unit will bring down all the protocols and the
unit will be operationally down, except for running Diagnostics.
Make sure that stacking is not configured for Diagnostics execution.Also, reboot/online command is
necessary for normal operation after the offline command is issued.
online stack-unit
Place a stack unit in the online state.
Syntax
online stack-unit number
Parameters
Defaults
number
none
Command Mode
EXEC Privilege
Command
History
Version 8.3.17.0
H
242
|
Enter the stack unit number.
range: 0 to 5
Debugging and Diagnostics
Supported on M I/O Aggregator
show diag
View diagnostics information.
Syntax
Parameters
Defaults
show diag {information | stack-unit number [detail | periodic | summary] | testcase}
information
Enter the keyword information to view current diagnostics information
in the system.
stack-unit unit-id
Enter the keyword stack-unit followed by the unit-id to display information on
a specific stack member. Range: 0 to 5.
detail
(OPTIONAL) Enter the keyword detail to view detailed diagnostics
information.
summary
(OPTIONAL) Enter the keyword summary to view a summary of the
diagnostics information. By default, the summary is displayed.
testcase
Enter the keyword testcase to view to view the list of all the diag tests available.
Summary
Command Modes
EXEC Privilege
Command
History
Version 8.3.17.0
Example 1
Figure 25-1.
Supported on M I/O Aggregator
show diag information Command Example
FTOS#show diag information
Diag information:
Diag software image version:
8-3-17-36
------------------------------------------------------------------Stack-unit Member 0:
Unit diags are terminated (Stackunit Offline).
Stack-unit Member 1:
Not present.
Stack-unit Member 2:
Not present.
Stack-unit Member 3:
Not present.
Stack-unit Member 4:
Not present.
Stack-unit Member 5:
Not present.
-------------------------------------------------------------------
Example 2
Figure 25-2.
show diag stack-unit Command Example
FTOS#show diag stackunit 0
Diag status of Stackunit member 0:
-------------------------------------------------------------------------Stackunit is currently offline.
Stackunit level0 diag issued at Tue May 15, 2012 11:11:47 AM.
Current diag status:
Unit diags are terminated.
Total number of diags:
17
Number of diags performed:
1
Number of diags passed:
1
Number of diags failed:
0
Number of diags pending:
16
Last Test executed:
POWERRAILSTATUSTEST
Last notification received at:
Tue May 15, 2012 11:12:24 AM
--------------------------------------------------------------------------
Debugging and Diagnostics | 243
www.dell.com | support.dell.com
Example 3
Figure 25-3.
show diag testcase stack-unit Command Example
FTOS#show diag testcase stack-unit 0
**************************** Navasota Diagnostics Test
*************************
Test ID
------1
2
3
4
5
6
7
8
9
10
11
12
13
14
15
16
17
101
102
103
104
105
106
107
108
109
110
111
112
113
114
115
116
117
118
119
120
121
122
123
124
201
202
203
204
205
206
207
208
209
210
Test Description
---------------POWERRAILSTATUSTEST
OPTMODSLOTPOWERSTATUSTEST
TSENSORACCESSTEST
RTCPRESENCETEST
CPUSDRAMPRESENCETEST
CPUSDRAMSIZETEST
USBAACCESSTEST
USBHOSTCONTROLLERACCESSTEST
SDFLASHACCESSTEST
QSFPPLUSPOWERMODETEST
CPLDPRESENCETEST
FLASHACCESSTEST
BOARDREVTEST
MGMTPHYPRESENCETEST
OPTMODTYPETEST
QSFPPLUSPRESENCETEST
CPUTYPEDETECTTEST
RTCFUNCTIONTEST
RTCROLLOVERTEST
GPIOACCESSTEST
PSOCACCESSTEST
PCIEBCM56846ACCESSTEST
CPUSDRAMACCESSTEST
CPUSDRAMDATALINETEST
CPUSDRAMADDRESSLINETEST
USBFILECOPYTEST
FLASHRWTEST
I2CSTRESSTEST
AVSPOWERCNTRLACCESSTEST
SERVERPORTPHYACCESSTEST
SERVERPORTPHYRWTEST
QSFPPLUSPHYACCESSTEST
QSFPPLUSPHYRWTEST
QSFPPLUSPHYEXTLINKTEST
QSFPPLUSEEPROMTEST
OPTMODPHYACCESSTEST
OPTMODPHYRWTEST
OPTMODPHYEXTLINKTEST
OPTMODMODULEEEPROMTEST
MGMTPHYACCESSTEST
SDFLASHFILECOPYSTRESSTEST
QSFPPLUSPHYLNKSPEEDTEST
OPTMODPHYLNKSPEEDTEST
MGMTPHYLOOPBACKTEST
MGMTMACLOOPBACKTEST
CPUSNAKESERVERPORTPHYLPBKTEST
CPUSNAKESERVERPORTMACLPBKTEST
CPUSNAKEQSFPPPHYLPBKTEST
CPUSNAKEQSFPPMACLPBKTEST
CPUSNAKEOPTMODPHYLPBKTEST
CPUSNAKEOPTMODMACLPBKTEST
Total Diagnostic Testcases in All Levels: 51
Test Level
---------Level0
Level0
Level0
Level0
Level0
Level0
Level0
Level0
Level0
Level0
Level0
Level0
Level0
Level0
Level0
Level0
Level0
Level1
Level1
Level1
Level1
Level1
Level1
Level1
Level1
Level1
Level1
Level1
Level1
Level1
Level1
Level1
Level1
Level1
Level1
Level1
Level1
Level1
Level1
Level1
Level1
Level2
Level2
Level2
Level2
Level2
Level2
Level2
Level2
Level2
Level2
************************************* END
**************************************
244
|
Debugging and Diagnostics
Example 4
Figure 25-4.
show diag testcase stack-unit interactive Command Example
FTOS#show diag testcase stack-unit 0 interactive
**************************** Navasota Diagnostics Test
*************************
Test ID
------401
402
403
404
405
406
407
408
409
410
411
Test Description
---------------POWERLEDTEST
DEBUGLEDTEST
STATUSLEDTEST
OPTMODLEDCONTROLTEST
FIXEDLEDCONTROLTEST
RTCBATTERYTEST
CPLDRESETTEST
I2CDEVICESCANTEST
SERVERPORTPHYEXTLINKTEST
CPUSNAKEQSFPPEXTLPBKTEST
CPUSNAKEOPTMODEXTLPBKTEST
Test Level
---------Interactive
Interactive
Interactive
Interactive
Interactive
Interactive
Interactive
Interactive
Interactive
Interactive
Interactive
Total Diagnostic Testcases in Interactive: 11
************************************* END
**************************************
show hardware stack-unit
Displays the data plane or management plane input and output statistics of the designated component
of the designated stack member.
Syntax
show hardware stack-unit 0-5 {buffer [buffer unit | port [(1-56) | all] total buffer | buffer unit (1) port
(1-56) queue [(0-14) | a11] buffer-info} {phy-firmware-version} {cpu data-plane statistics
[stack-port 0-52] | cpu party-bus statistics | cpu private-mgmt statistics | drops [unit 0-1 [port
1-56]] | stack-port 33-56 | unit 0-0 {counters | details | port-stats [detail] | register}}
Parameters
stack-unit 0-5
{command-option}
Enter the keyword stack-unit followed by 0 to 5 to select a particular stack
member and then enter one of the following command options to display a
collection of data based on the option entered.
buffer
Enter the keyword buffer, optionally followed by the keywords
total-buffer to show the total buffer statistics per stack unit. Enter the
keywords buffer unit then total-buffer to display the buffer details per unit
and mode of allocation. To display the forwarding plane statistics containing
the packet buffer usage per port per stack unit, enter the keywords buffer
unit followed by port and the port number (1-56 or all), then buffer-info.
To display the forwarding plane statistics containing the packet buffer
statistics per COS per port, enter the keywords buffer unit and port (1-56),
and queue (0-14 or all), and buffer-info.
Buffer unit default: 1
fpga
Enter the keyword fpga, to display fpga details.
fru
Enter the keyword fru, to display fru details.
phy-firmware-version
Each member of the stack is updated automatically with the latest firmware
while booting as well as during OIR. Enter the keyword
phy-firmware-version, to dump the physical firmware version for stack
units.
Debugging and Diagnostics | 245
www.dell.com | support.dell.com
Defaults
Command Modes
cpu data-plane statistics
Enter the keywords cpu data-plane statistics, optionally followed by the
keywords stack port and its number — 0 to 52 — to display the data plane
statistics, which shows the High Gig (Higig) port raw input/output counter
statistics to which the stacking module is connected.
cpu party-bus statistics
Enter the keywords cpu party-bus statistics, to display the Management
plane input/output counter statistics of the pseudo party bus interface.
cpu private-mgmt
statistics
Enter the keywords cpu private-mgmt statistics, to display the
Management plane input/output counter statistics of the Private
Management interface.
drops [unit 0-0 [port
1-56]]
Enter the drops keyword to display internal drops on the selected stack
member. Optionally, use the unit keyword with 0 to select port-pipe 0, and
then use port 1-56 to select a port on that port-pipe.
stack-port 33-56
Enter this keyword and a stacking port number to select a stacking port for
which to display statistics. Identify the stack port number as you would to
identify a 10G port that was in the same place in one of the rear modules.
Note: You can identify stack port numbers by physical inspection of
the rear modules. The numbering is the same as for the 10G ports.
You can also inspect the output of the show system stack-ports
command.
unit 0-0 {counters | details
| port-stats [detail] |
register}
Enter the unit keyword followed by 0 for port-pipe 0, and then enter one of
the following keywords to troubleshoot errors on the selected port-pipe and
to give status on why a port is not coming up to register level: counters,
details, port-stats [detail], or register
none
EXEC
EXEC Privilege
Command
History
Example 1
Version 8.3.17.0
Figure 25-5.
Supported on M I/O Aggregator
show hardware stack-unit phy-firmware-version Command Example
FTOS#show hardware stack-unit 1 phy-firmware-version
PortNumber
Status
Programmed Version
SW Version
=======================================================================
41
Present
01.05
01.05
42
Present
01.05
01.05
43
Present
01.05
01.05
44
Present
01.05
01.05
45
Not Present
N/A
N/A
46
Not Present
N/A
N/A
47
Not Present
N/A
N/A
48
Not Present
N/A
N/A
49
Present
01.06
01.06
50
Present
01.06
01.06
51
Present
01.06
01.06
52
Present
01.06
01.06
53
Present
01.06
01.06
54
Present
01.06
01.06
55
Present
01.06
01.06
56
Present
01.06
01.06
FTOS#
246
|
Debugging and Diagnostics
In the above example, the “Status” field represents presence of OPTM ports, “Programmed version”
field represents loaded firmware version, and “SW version” represents SDK version.
Example 2
Figure 25-6.
show hardware stack-unit cpu data-plane statistics Command Example
FTOS#show hardware stack-unit 1 cpu data-plane statistics
bc pci driver statistics for device:
rxHandle
:7392
noMhdr
:0
noMbuf
:0
noClus
:0
recvd
:7392
dropped
:0
recvToNet
:7392
rxError
:0
rxDatapathErr
:0
rxPkt(COS0)
:0
rxPkt(COS1)
:0
rxPkt(COS2)
:10
rxPkt(COS3)
:0
rxPkt(COS4)
:0
rxPkt(COS5)
:338
rxPkt(COS6)
:0
rxPkt(COS7)
:7044
rxPkt(UNIT0)
:7392
transmitted
:29899
txRequested
:29899
noTxDesc
:0
txError
:0
txReqTooLarge
:0
txInternalError :0
txDatapathErr
:0
txPkt(COS0)
:0
txPkt(COS1)
:0
txPkt(COS2)
:0
txPkt(COS3)
:0
txPkt(COS4)
:0
txPkt(COS5)
:0
txPkt(COS6)
:0
txPkt(COS7)
:0
txPkt(UNIT0)
:0
FTOS#
Example 3
Figure 25-7.
show hardware stack-unit cpu party-bus statistics Command Example
FTOS#show hardware stack-unit 1 cpu party-bus statistics
Input Statistics:
8189 packets, 8076608 bytes
0 dropped, 0 errors
Output Statistics:
366 packets, 133100 bytes
0 errors
FTOS#
Example 4
Figure 25-8. show hardware stack-unit drops (drop summary for entire switch)
Command Example
FTOS#show hardware stack-unit 1 drops
UNIT No: 0
Total
Total
Total
Total
Total
FTOS#
Ingress Drops
IngMac Drops
Mmu Drops
EgMac Drops
Egress Drops
:
:
:
:
:
7448
0
0
0
16
Debugging and Diagnostics | 247
www.dell.com | support.dell.com
Example 5
Figure 25-9.
Example
show hardware stack-unit drops unit (drop summary per port) Command
FTOS#show hardware stack-unit 1 drops unit 0
UserPort
PortNumber
Drops
Egress Drops
1
1
0
2
2
0
3
3
0
4
4
0
5
5
5
6
6
0
7
7
0
8
8
0
9
9
0
10
10
0
--More-FTOS#
Example 6
Figure 25-10.
Example
Ingress Drops
|
Debugging and Diagnostics
Total Mmu Drops
0
0
0
0
0
0
0
0
0
0
0
0
0
0
0
0
728
0
0
0
0
0
0
0
0
0
0
0
0
0
0
0
0
0
0
0
0
0
0
0
EgMac
show hardware stack-unit drops (drop counters per port) Command
FTOS#show hardware stack-unit
--- Ingress Drops
--Ingress Drops
IBP CBP Full Drops
PortSTPnotFwd Drops
IPv4 L3 Discards
Policy Discards
Packets dropped by FP
(L2+L3) Drops
Port bitmap zero Drops
Rx VLAN Drops
--- Ingress MAC counters--Ingress FCSDrops
Ingress MTUExceeds
--- MMU Drops
--HOL DROPS
TxPurge CellErr
Aged Drops
--- Egress MAC counters--Egress FCS Drops
--- Egress FORWARD PROCESSOR
IPv4 L3UC Aged & Drops
TTL Threshold Drops
INVALID VLAN CNTR Drops
L2MC Drops
PKT Drops of ANY Conditions
Hg MacUnderflow
TX Err PKT Counter
FTOS#
248
IngMac Drops
1 drops unit 0 port 27
:
:
:
:
:
:
:
:
:
0
0
0
0
0
0
0
0
0
: 0
: 0
: 0
: 0
: 0
: 0
Drops
: 0
: 0
: 0
: 0
: 0
: 0
: 0 25
---
Example 7
Figure 25-11.
show hardware stack-unit port-statistics Command Example
FTOS#show hardware stack-unit 1 unit 0 port-stats
ena/ speed/ link auto
STP
port link duplex scan neg?
state
pause
xe0 !ena
1G FD
SW Yes Forward
xe1 !ena
1G FD
SW Yes Forward
xe2 up
1G FD
SW Yes Forward
xe3 !ena
1G FD
SW Yes Forward
xe4 down 10G FD
SW Yes
Block
xe5 !ena
1G FD
SW Yes Forward
xe6 !ena
1G FD
SW Yes Forward
xe7 !ena
1G FD
SW Yes Forward
xe8 !ena
1G FD
SW Yes Forward
xe9 !ena
1G FD
SW Yes Forward
xe10 down 10G FD
SW Yes Forward
xe11 !ena
1G FD
SW Yes Forward
xe12 !ena
1G FD
SW Yes
Block
xe13 !ena
1G FD
SW Yes Forward
xe14 !ena
1G FD
SW Yes Forward
xe15 !ena
1G FD
SW Yes Forward
xe16 !ena
1G FD
SW Yes Forward
xe17 !ena
1G FD
SW Yes Forward
xe18 down
1G FD
SW Yes Forward
xe19 !ena
1G FD
SW Yes Forward
xe20 down
1G FD
SW Yes Forward
--More-FTOS#
Example 8
Figure 25-12.
lrn inter
max loop
discrd ops
face frame back
Tag
F
GMII 1550
Tag
F
GMII 1554
None
FA
GMII 11996
Tag
F
GMII 1550
None
FA
KR 8996
Tag
F
GMII 1550
Tag
F
GMII 1550
Tag
F
GMII 1550
Tag
F
GMII 1550
Tag
F
GMII 1550
Tag
F
KR 1550
Tag
F
GMII 1550
None
FA
GMII 11996
Tag
F
GMII 1550
Tag
F
GMII 1550
Tag
F
GMII 1550
Tag
F
GMII 1550
Tag
F
GMII 1550
Tag
F
GMII 1550
Tag
F
GMII 1550
Tag
F
GMII 1550
show hardware stack-unit unit 0 register Command Example
FTOS#show hardware stack-unit 0 unit 0 register
0x0f180d34 ALTERNATE_EMIRROR_BITMAP_PARITY_CONTROL.ipipe0 = 0x00000001
0x0f180d35 ALTERNATE_EMIRROR_BITMAP_PARITY_STATUS_INTR.ipipe0 = 0x00000000
0x0f180d36 ALTERNATE_EMIRROR_BITMAP_PARITY_STATUS_NACK.ipipe0 = 0x00000000
0x0018070c ARB_EOP_DEBUG.ipipe0 = 0x00000000
0x00180312 ARB_RAM_DBGCTRL.ipipe0 = 0x00000000
0x03300000 ASF_PORT_SPEED.cpu0 = 0x00000000
0x03322000 ASF_PORT_SPEED.xe0 = 0x00000000
0x03326000 ASF_PORT_SPEED.xe1 = 0x00000000
0x0332a000 ASF_PORT_SPEED.xe2 = 0x00000007
0x0332e000 ASF_PORT_SPEED.xe3 = 0x00000000
0x03323000 ASF_PORT_SPEED.xe4 = 0x00000000
0x03327000 ASF_PORT_SPEED.xe5 = 0x00000000
0x0332b000 ASF_PORT_SPEED.xe6 = 0x00000000
0x0332f000 ASF_PORT_SPEED.xe7 = 0x00000000
0x03324000 ASF_PORT_SPEED.xe8 = 0x00000000
0x03328000 ASF_PORT_SPEED.xe9 = 0x00000000
0x0332c000 ASF_PORT_SPEED.xe10 = 0x00000000
0x03330000 ASF_PORT_SPEED.xe11 = 0x00000000
0x03325000 ASF_PORT_SPEED.xe12 = 0x00000000
0x03329000 ASF_PORT_SPEED.xe13 = 0x00000000
0x0332d000 ASF_PORT_SPEED.xe14 = 0x00000000
0x03331000 ASF_PORT_SPEED.xe15 = 0x00000000
0x03332000 ASF_PORT_SPEED.xe16 = 0x00000000
0x03336000 ASF_PORT_SPEED.xe17 = 0x00000000
0x0333a000 ASF_PORT_SPEED.xe18 = 0x00000000
0x0333e000 ASF_PORT_SPEED.xe19 = 0x00000000
0x03333000 ASF_PORT_SPEED.xe20 = 0x00000000
0x03337000 ASF_PORT_SPEED.xe21 = 0x00000000
0x0333b000 ASF_PORT_SPEED.xe22 = 0x00000000
0x0333f000 ASF_PORT_SPEED.xe23 = 0x00000000
0x03334000 ASF_PORT_SPEED.xe24 = 0x00000000
0x03338000 ASF_PORT_SPEED.xe25 = 0x00000000
0x0333c000 ASF_PORT_SPEED.xe26 = 0x00000000
0x03340000 ASF_PORT_SPEED.xe27 = 0x00000000
0x03335000 ASF_PORT_SPEED.xe28 = 0x00000000
0x03339000 ASF_PORT_SPEED.xe29 = 0x00000000
!------------------ output truncated ---------------!
Debugging and Diagnostics | 249
www.dell.com | support.dell.com
Example 9
Figure 25-13.
show hardware stack-unit unit details Command Example
FTOS#show hardware stack-unit 0 unit 0 details
******************************************************
The total no of FP & CSF Devices in the Card is 1
The total no of FP Devices in the Card is 1
The total no of CSF Devices in the Card is 0
The number of ports in device 0 is - 49
The number of Hg ports in devices 0 is - 1
The CPU Port of the device is 0
The staring unit no the SWF in the device is 0
******************************************************
bcmLinkMonStatusShow: The Current Link Status Is
Front End Link Status
0x200000000000000000000000
Front End Port Present Status 0x000000000000000000000000
Back Plane Link Status
0x00000000
******************************************************
Link Status of all the ports in the Device - 0
The linkStatus of Front End Port 1 is FALSE
The linkStatus of Front End Port 2 is FALSE
The linkStatus of Front End Port 3 is TRUE
The linkStatus of Front End Port 4 is FALSE
The linkStatus of Front End Port 5 is FALSE
The linkStatus of Front End Port 6 is FALSE
The linkStatus of Front End Port 7 is FALSE
The linkStatus of Front End Port 8 is FALSE
The linkStatus of Front End Port 9 is FALSE
The linkStatus of Front End Port 10 is FALSE
The linkStatus of Front End Port 11 is FALSE
The linkStatus of Front End Port 12 is FALSE
The linkStatus of Front End Port 13 is FALSE
The linkStatus of Front End Port 14 is FALSE
The linkStatus of Front End Port 15 is FALSE
The linkStatus of Front End Port 16 is FALSE
The linkStatus of Front End Port 17 is FALSE
The linkStatus of Front End Port 18 is FALSE
The linkStatus of Front End Port 19 is FALSE
The linkStatus of Front End Port 20 is FALSE
The linkStatus of Front End Port 21 is FALSE
The linkStatus of Front End Port 22 is FALSE
The linkStatus of Front End Port 23 is FALSE
The linkStatus of Front End Port 24 is FALSE
The linkStatus of Front End Port 25 is FALSE
The linkStatus of Front End Port 26 is FALSE
The linkStatus of Front End Port 27 is FALSE
The linkStatus of Front End Port 28 is FALSE
The linkStatus of Front End Port 29 is FALSE
The linkStatus of Front End Port 30 is FALSE
The linkStatus of Front End Port 31 is FALSE
The linkStatus of Front End Port 32 is FALSE
The linkStatus of Front End Port 37 is FALSE
!------------------ output truncated ---------------!
Example 10
Figure 25-14.
show hardware stack-unit per stack unit buffer Command Example
FTOS#show hardware stack-unit 0 buffer total-buffer
FTOS#sh hardware stack-unit 0 buffer total-buffer
Total Buffers allocated per Stack-Unit 46080
250
|
Debugging and Diagnostics
Example 11
Figure 25-15.
Example
show hardware stack-unit per port buffer (a Specific Port) Command
FTOS(conf)#show hardware stack-unit 0 buffer unit 0 port 1 buffer-info
----- Buffer Stats for Unit 0 Port 1 ----Maximum Shared Limit for the Port: 30720
Default Packet Buffer allocate for the Port: 120
Used Packet Buffer for the Port: 0
Example 12
Figure 25-16.
show hardware stack-unit queue buffer Command Example
FTOS(conf)#show hardware stack-unit 0 buffer unit 0 port 1 queue 2 buffer-info
----- Buffer Stats for Unit 0 Port 1 Queue 2 ----Maximum Shared Limit: 30720
Default Packet Buffer allocate for the Queue: 8
Used Packet Buffer: 0
Related
Commands
show interfaces port-channel
Displays information on all interfaces on a specific stack member.
show processes cpu
Displays CPU usage information based on running processes.
show system stack-ports
Displays information about the stacking ports on all switches in the stack.
show system
Displays the current status of all stack members or a specific member.
show hardware system-flow
Displays Layer 2 ACL or QoS data for the selected stack member and stack member port-pipe.
Syntax
Parameters
show hardware system-flow layer2 stack-unit 0-5 port-set 0-0 [counters]
acl | qos
For the selected stack member and stack member port-pipe, display which
system flow entry the packet hits and what queue the packet takes as it dumps
the raw system flow tables.
stack-unit 0-5
Enter the keyword stack-unit followed by 0 to 5 to select a stack member ID.
port-set 0-0
[counters]
Defaults
Enter the keyword port-set with a port-pipe number — 0.
(OPTIONAL) Enter the keyword counters to display hit counters for the selected
ACL or QoS option.
none
Command Modes
EXEC Privilege
Command
History
Version 8.3.17.0
Supported on M I/O Aggregator
Debugging and Diagnostics | 251
www.dell.com | support.dell.com
Example 1
252
Figure 25-17.
show hardware system-flow layer2 counters Command Example
FTOS#show hardware system-flow layer2 stack-unit 0 port-set 0 counters
--------------------------------------------------------------------------EntryId
Description
#HITS
--------------------------------------------------------------------------2048
STP BPDU Redirects
0
2047
LLDP BPDU Redirects
164904
2045
LACP traffic Redirects
0
2044
GVRP traffic Redirects
0
2043
ARP Reply Redirects
0
2042
802.1x frames Redirects
0
2041
VRRP frames Redirects
0
2040
IPv6VRRP frames Redirects
0
2039
GRAT ARP
0
2036
IPv6 Mcast Control Traffic
128840
2000
VLT ARP SYNC Frames
0
1999
ICL Hellos
0
1998
ICL MAC SYNC Frames
0
1997
VLT Tunneled STP Frames
0
1995
DROP Cases
43207
1917
L3 Term Traffic ClassID 1 to Q6 0
1916
L3 CPU Bound Traffic ClassId 2 to Q5
0
1915
Unknown MCAST Packets
0
1792
BGP with TTL1, L4 SRC port Redirects
0
1791
BGP with TTL1, L4 DST Port Redirects
0
25
FTOS#
|
Debugging and Diagnostics
Example 2
Figure 25-18.
show hardware system-flow layer2 (non-counters) Command Example
FTOS#show hardware system-flow layer2 stack-unit 0 port-set 0
############## FP Entry for redirecting STP BPDU to CPU Port ################
EID 2048: gid=1,
slice=15, slice_idx=0x00, prio=0x800, flags=0x82, Installed
tcam: color_indep=0,
higig=0, higig_mask=0,
KEY=0x00000000 00000000 00000000 0180c200 00000000 00000000 00000000
, FPF4=0x00
MASK=0x00000000 00000000 00000000 ffffffff ffff0000 00000000 00000000
,
0x00
action={act=Drop, param0=0(0x00), param1=0(0x00)},
action={act=CosQCpuNew, param0=7(0x07), param1=0(0x00)},
action={act=CopyToCpu, param0=0(0x00), param1=0(0x00)},
action={act=UpdateCounter, param0=1(0x01), param1=0(0x00)},
meter=NULL,
counter={idx=0, mode=0x01, entries=1}
################ FP Entry for redirecting LLDP BPDU to RSM ################
EID 2047: gid=1,
slice=15, slice_idx=0x01, prio=0x7ff, flags=0x82, Installed
tcam: color_indep=0,
higig=0, higig_mask=0,
KEY=0x00000000 00000000 00000000 0180c200 000e0000 00000000 00000000
, FPF4=0x00
MASK=0x00000000 00000000 00000000 ffffffff ffff0000 00000000 00000000
,
0x00
action={act=Drop, param0=0(0x00), param1=0(0x00)},
action={act=CosQCpuNew, param0=7(0x07), param1=0(0x00)},
action={act=CopyToCpu, param0=0(0x00), param1=0(0x00)},
action={act=UpdateCounter, param0=1(0x01), param1=0(0x00)},
meter=NULL,
counter={idx=1, mode=0x01, entries=1}
############## FP Entry for redirecting LACP traffic to CPU Port ############
EID 2045: gid=1,
slice=15, slice_idx=0x02, prio=0x7fd, flags=0x82, Installed
tcam: color_indep=0,
higig=0, higig_mask=0,
KEY=0x00000000 00000000 00000000 0180c200 00020000 00000000 00000000
, FPF4=0x00
MASK=0x00000000 00000000 00000000 ffffffff ffff0000 00000000 00000000
,
0x00
action={act=Drop, param0=0(0x00), param1=0(0x00)},
action={act=CosQCpuNew, param0=7(0x07), param1=0(0x00)},
action={act=CopyToCpu, param0=0(0x00), param1=0(0x00)},
action={act=UpdateCounter, param0=1(0x01), param1=0(0x00)},
meter=NULL,
counter={idx=2, mode=0x01, entries=1}
################# FP Entry for redirecting GVRP traffic to RSM ###########
EID 2044: gid=1,
slice=15, slice_idx=0x03, prio=0x7fc, flags=0x82, Installed
tcam: color_indep=0,
higig=0, higig_mask=0,
KEY=0x00000000 00000000 00000000 0180c200 00210000 00000000 00000000
, FPF4=0x00
MASK=0x00000000 00000000 00000000 ffffffff ffff0000 00000000 00000000
,
0x00
action={act=Drop, param0=0(0x00), param1=0(0x00)},
action={act=CosQCpuNew, param0=7(0x07), param1=0(0x00)},
action={act=CopyToCpu, param0=0(0x00), param1=0(0x00)},
action={act=UpdateCounter, param0=1(0x01), param1=0(0x00)},
meter=NULL,
counter={idx=3, mode=0x01, entries=1}
################# FP Entry for redirecting ARP Replies to RSM #############
EID 2043: gid=1,
slice=15, slice_idx=0x04, prio=0x7fb, flags=0x82, Installed
tcam: color_indep=0,
higig=0, higig_mask=0,
KEY=0x00000000 00000000 00000000 00000000 00000000 00000806 00001600
, FPF4=0x00
MASK=0x00000000 00000000 00000000 00000000 00000000 0000ffff 00001600
,
0x00
action={act=Drop, param0=0(0x00), param1=0(0x00)},
action={act=CosQCpuNew, param0=6(0x06), param1=0(0x00)},
action={act=CopyToCpu, param0=0(0x00), param1=0(0x00)},
action={act=UpdateCounter, param0=1(0x01), param1=0(0x00)},
!--------- output truncated -----------------!
Debugging and Diagnostics | 253
254
|
Debugging and Diagnostics
www.dell.com | support.dell.com
26
Internet Control Message Protocol (ICMP)
Message Types
This chapter lists and describes the possible internet control message protocol (ICMP) Message Types
resulting from a ping. The first three columns list the possible symbol or type/code. For example, you
would receive a ! or 03 as an echo reply from your ping.
Table 26-1.
Symbol
ICMP Messages and Their Definitions
Type
Code
•
Query
Error
Timeout (no reply)
!
0
U
3
C
Description
4
3
•
destination unreachable:
0
network unreachable
•
1
host unreachable
•
2
protocol unreachable
•
3
port unreachable
•
4
fragmentation needed but don’t fragment bit set
•
5
source route failed
•
6
destination network unknown
•
7
destination host unknown
•
8
source host isolated (obsolete)
•
9
destination network administratively prohibited
•
10
destination host administratively prohibited
•
11
network unreachable for TOS
•
12
host unreachable for TOS
•
13
communication administratively prohibited by
filtering
•
14
host precedence violation
•
15
precedence cutoff in effect
•
0
source quench
•
redirect
•
0
redirect for network
•
1
redirect for host
•
2
redirect for type-of-service and network
•
3
redirect for type-of-service and host
•
0
echo request
5
8
echo reply
•
Internet Control Message Protocol (ICMP) Message Types | 255
www.dell.com | support.dell.com
Table 26-1.
256
Symbol
&
ICMP Messages and Their Definitions
Type
Code
9
0
router advertisement
•
10
0
router solicitation
•
11
Query
Error
time exceeded:
0
time-to-live equals 0 during transit
•
1
time-to-live equals 0 during reassembly
•
12
|
Description
parameter problem:
1
IP header bad (catchall error)
•
2
required option missing
•
13
0
timestamp request
•
14
0
timestamp reply
•
15
0
information request (obsolete)
•
16
0
information reply (obsolete)
•
17
0
address mask request
•
18
0
address mask reply
•
Internet Control Message Protocol (ICMP) Message Types