1
Wireless Sensor Network
Revision: /1
C o p y r i g h t © 2 0 1 0 - 2 0 1 C a m p b e l l S c i e n t i f i c , I n c .
PLEASE READ FIRST
About this manual
Please note that this manual was originally produced by Campbell Scientific Inc. (CSI) primarily
for the US market. Some spellings, weights and measures may reflect this origin.
Some useful conversion factors:
Area:
Length:
Mass:
Pressure:
Volume:
1 in2 (square inch) = 645 mm2
1 in. (inch) = 25.4 mm
1 ft (foot) = 304.8 mm
1 yard = 0.914 m
1 mile = 1.609 km
1 oz. (ounce) = 28.35 g
1 lb (pound weight) = 0.454 kg
1 psi (lb/in2) = 68.95 mb
1 US gallon = 3.785 litres
In addition, part ordering numbers may vary. For example, the CABLE5CBL is a CSI part
number and known as a FIN5COND at Campbell Scientific Canada (CSC). CSC Technical
Support will be pleased to assist with any questions.
About sensor wiring
Please note that certain sensor configurations may require a user supplied jumper wire. It is
recommended to review the sensor configuration requirements for your application and supply the jumper
wire is necessary.
Table of Contents
PDF viewers: These page numbers refer to the printed version of this document. Use the
PDF reader bookmarks tab for links to specific sections.
1. Understanding a Wireless Sensor Network ............. 1
1.1
1.2
1.3
1.4
1.5
General Description ............................................................................. 1
CWB100 Wireless Base Station ........................................................... 2
CWS220 Wireless Infrared Radiometer ............................................... 3
CWS655 Wireless Water Content Reflectometer ................................ 4
CWS900 Wireless Sensor Interface ..................................................... 5
2. Specifications............................................................. 8
2.1
2.2
2.3
2.4
2.5
Wireless Sensor Network Radio .......................................................... 8
2.1.1 Electrical ....................................................................................... 8
2.1.2 Typical RF Range ......................................................................... 9
2.1.3 RSSI .............................................................................................. 9
2.1.4 Service Discovery Protocol ........................................................... 9
2.1.5 Antenna Options ......................................................................... 10
CWB100 Specifications ..................................................................... 10
2.2.1 CWB100 Physical Specifications ............................................... 10
2.2.2 CWB100 Electrical Specifications .............................................. 10
2.2.3 CWB100 Environmental Specifications ..................................... 11
2.2.4 Datalogger Compatibility ............................................................ 11
CWS220 Specifications ..................................................................... 11
2.3.1 CWS220 Physical Specifications ................................................ 11
2.3.2 CWS220 Electrical Specifications .............................................. 12
2.3.3 CWS220 Environmental Specifications ...................................... 12
CWS655 Specifications ..................................................................... 12
2.4.1 CWS655 Physical Specifications ................................................ 12
2.4.2 CWS655 Electrical Specifications .............................................. 12
2.4.3 WS655 Environmental Specifications ........................................ 13
CWS900 Specifications ..................................................................... 13
2.5.1 CWS900 Physical Specifications ................................................ 13
2.5.2 CWS900 Electrical Specifications .............................................. 13
2.5.3 CWS900 Environmental Specifications ...................................... 14
3. Getting Started: Creating a Wireless Sensor
Network .................................................................. 14
3.1
Hardware and Software Required for a WSN .................................... 14
3.1.1 A205 CWS to PC Interface ......................................................... 14
3.1.2 Required Cables .......................................................................... 15
3.1.3 Configuration CD ........................................................................ 16
3.1.4 Configuration Software ............................................................... 16
3.1.5 Driver Installation ....................................................................... 16
3.2
Creating a Model of the WSN ............................................................ 16
3.2.1 Wireless Sensor Planner and Network Planner ........................... 16
3.2.2 Installing Wireless Sensor Planner .............................................. 17
3.2.3 Using Wireless Sensor Planner ................................................... 17
3.2.3.1 Simple WSN Example...................................................... 18
3.3
Configuring the Devices in the WSN ................................................. 21
i
Table of Contents
3.4
3.5
3.6
3.7
3.8
3.9
3.3.1 Configuring the CWB100 .......................................................... 21
3.3.2 Configuring the CWS655 ........................................................... 23
3.3.3 Configuring the CWS900 ........................................................... 24
Sending the Sensor Configuration File to the Datalogger ................. 24
Programming the Datalogger............................................................. 25
Connecting the CWB100 to the Datalogger ...................................... 27
Powering CWS Sensors and Initiating Auto-discovery ..................... 27
Verify that Data is being Transmitted ............................................... 28
Physical Connections......................................................................... 28
3.9.1 Connecting the Base Station to the Datalogger .......................... 28
3.9.2 Connecting Sensors to the CWS900........................................... 29
4. Programming the Datalogger .................................. 29
4.1
4.2
4.3
4.4
4.5
4.6
Array Declaration .............................................................................. 29
CWB100() Instruction ....................................................................... 30
4.2.1 Configuration String ................................................................... 31
4.2.2 Field Names ............................................................................... 32
4.2.3 Status Monitoring ....................................................................... 32
ArrayIndex() Instruction .................................................................... 33
CWB100RSSI() Instruction ............................................................... 34
CWB100Routes() Instruction ............................................................ 34
Program Example .............................................................................. 35
5. CWS Button and LED Behavior ............................... 37
5.1
5.2
5.3
Sensor Link to Base Station .............................................................. 37
Sensor Battery Voltage ...................................................................... 37
CWS Sensor Search for Base Station ................................................ 37
6. Testing the Network ................................................. 38
7. Maintenance ............................................................. 40
7.1
7.2
Replacing a Sensor in the Network ................................................... 41
Stopping or Loading a New Datalogger Program ............................. 41
8. Troubleshooting ....................................................... 42
Appendices
A. Using DevConfig for CWS Setup .......................... A-1
B. Measurement Names and Meanings ..................... B-1
B.1
B.2
B.3
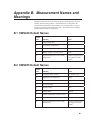
CWS220 Default Names ................................................................. B-1
CWS655 Default Names ................................................................. B-1
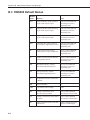
CWS900 Default Names ................................................................. B-2
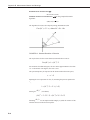
B.3.1 Wind Vector Calculations ........................................................ B-4
ii
Table of Contents
C. Battery Life ............................................................. C-1
C.1
C.2
C.3
C.4
Battery Characteristics ..................................................................... C-1
Effect of Polling Interval and Repeaters on Battery Life ................. C-1
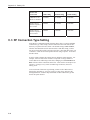
RF Connection Type Setting ............................................................ C-2
Repair of a Lost Connection ............................................................. C-3
1-1.
1-2.
1-3.
1-4.
3-1.
3-2.
3-3.
3-4.
B-1.
B-2.
B-3.
CWB100 Wireless Base Station ........................................................... 2
CWS220 Wireless Infrared Radiometer ............................................... 3
CWS655 Wireless Water Content Reflectometer ................................ 4
CWS900 Wireless Sensor Interface ..................................................... 5
A205 CWS to PC Interface ................................................................ 15
Connection of A205 ........................................................................... 15
CWB100 Wiring Connections ........................................................... 28
CWS900 Connector Pin-Out .............................................................. 29
Input Sample Vectors ....................................................................... B-4
Mean Wind Vector ........................................................................... B-5
Standard Deviation of Direction....................................................... B-6
1-1.
1-2.
2-1.
4-1.
CWS900 Configurations and Outputs .................................................. 6
CWS900 Wind Sensor Configurations and Outputs ............................ 7
CWS FHSS Radio Specifications ........................................................ 8
Values Transmitted by CWS Sensors ................................................ 30
Figures
Tables
iii
Table of Contents
iv
Wireless Sensor Network
1.
Understanding a Wireless Sensor Network
1.1
General Description
Why wireless?
There are situations when it is desirable to make measurements in locations
where the use of cabled sensors is problematic. Protecting cables by running
them through conduit or burying them in trenches is time consuming, labor
intensive, and sometimes not even possible. Local fire codes may preclude the
use of certain types of sensor cable inside buildings. In some applications
measurements need to be made at distances where long cables decrease the
quality of the measurement or are too expensive. There are also times when it
is important to increase the number of measurements being made but the
datalogger does not have enough available channels left for attaching
additional sensor cables. Each of these instances can be resolved with a
Campbell Scientific Wireless Sensor Network (WSN). A WSN provides a
reliable, low maintenance, low power method for making measurements in
applications where cabled sensors are impractical or otherwise undesirable.
What is it?
A Campbell WSN consists of a CWB100 Wireless Base Station and one or
more Campbell Wireless Sensors (CWS). The base station communicates with
a Campbell Scientific CR800-series, CR1000, or CR3000 datalogger, which
serves as the gateway to the network. Although compatible dataloggers use the
PakBus© communication protocol, PakBus© is not used for the datalogger to
base station communication, nor for the base station to sensor communication.
In other words, the CWB100 and wireless sensors are not PakBus© devices.
The base station communicates with all of the wireless sensors in the network.
Any sensor can serve as an RF repeater to communicate with other wireless
sensors. A sensor can route its transmissions through up to three other sensors
on the way back to the base station.
Wireless sensors include the CWS220 Wireless Infrared Radiometer, the
CWS655 Wireless Water Content Reflectometer, and the CWS900 Wireless
Sensor Interface. Additional sensor types can be integrated into the network by
connecting them to the CWS900 Wireless Sensor Interface.
How does it work?
The CWB100 Wireless Base Station and one or more wireless sensors are first
configured using an A205 CWS to PC Interface and Campbell Scientific’s
Wireless Sensor Planner, Network Planner or Device Configuration Utility
software.
The datalogger is programmed with the CRBasic editor to interface with the
CWB100 and determine a polling interval. After the polling interval has been
received, the base station uses that information to poll the sensors prior to
being polled by the datalogger. Power is applied to the sensors and a Setup
button pressed to cause them to establish a route to the base station. The base
1
Wireless Sensor Network
station synchronizes wireless sensor measurements and polls all sensors,
storing the collected measurements so that it can transfer them as soon as the
datalogger requests them. This minimizes the amount of time the datalogger
needs to wait for a response from the network through the CWB100 base
station. At the start of each polling interval the datalogger polls the base
station and sensor values are transferred to the datalogger for storage. This
method of data transfer from the sensors to the datalogger provides the fastest
and lowest power method available. An optional configuration string file may
be downloaded to the datalogger to predefine sensor and field names along
with the order in which values are returned to the destination array.
In order to conserve battery power, the sensors do not initiate any
communication except during Network Discovery. Instead they transmit only
when polled by the base station.
1.2
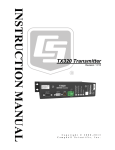
CWB100 Wireless Base Station
The CWB100 is the master radio in the wireless sensor network and serves as
the interface between the datalogger and the wireless sensors. It holds
information for the routes to all the sensors in the network and is responsible
for polling the sensors. It synchronizes wireless sensors to make their
measurements at the beginning of the datalogger’s scan. The CWB100
communicates using serial protocol or USB.
The CWB100 is packaged in an extruded aluminum housing, and needs to be
sheltered in an enclosure. It has a terminal block for connecting power and
data lines from the CWB100 to the datalogger wiring panel. It also has a USB
port for connection to a computer during configuration. The CWB100 is
powered through either the USB connector or the terminal block.
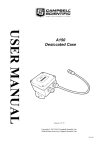
FIGURE 1-1. CWB100 Wireless Base Station
For specifications of the CWB100, see Section 2.2, CWB100 Specifications.
2
Wireless Sensor Network
1.3
CWS220 Wireless Infrared Radiometer
The CWS220 is a Wireless Infrared Radiometer that incorporates Apogee
Instrument's SI-111 infrared sensor to provide a non-contact means of
measuring the surface temperature of an object. It senses the infrared radiation
being emitted by the target. The CWS220 is used to measure leaf, canopy, and
average surface temperature. Contact sensors have difficulty making
measurements without influencing the temperature, maintaining thermal
contact, and providing a spatial average.
The CWS220 is mounted at an appropriate distance from the target where it
can measure an individual leaf, a canopy, or any surface of interest. Because
the CWS220 is wireless, it can be mounted in many locations that would be
problematic for a cabled sensor.
The CSW220 includes a thermopile for measuring a millivolt output dependent
on the target to sensor body temperature difference. A thermistor measures the
temperature of the sensor body. The sensor body temperature is used to
reference the target temperature.
The calibration coefficients used for determining the target temperature by
means of the Stefan-Boltzman equation are stored in the CWS220 at the time
of calibration.
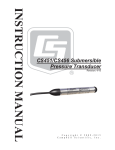
FIGURE 1-2. CWS220 Wireless Infrared Radiometer
The CWS220 outputs 5 values: Target temperature, Sensor body temperature,
Internal temperature, Battery Voltage, and Signal strength.
Additional detail regarding CWS220 output is available in Appendix B,
Measurements Names and Meanings.
For specifications of the CWS220, see Section 2.3, CWS220 Specifications.
3
Wireless Sensor Network
1.4
CWS655 Wireless Water Content Reflectometer
The CWS655 is based on Campbell Scientific’s CS655 water content
reflectometer. It measures volumetric soil water content, electrical
conductivity (EC), dielectric permittivity, and ambient temperature of soils or
other porous media.
The water content information is derived from the probe’s sensitivity to the
dielectric permittivity of the medium surrounding its stainless-steel rods.
Dielectric permittivity increases with volumetric water content in a predictable
fashion. During water content measurements, the CWS655 is configured as a
water content reflectometer with the two parallel rods forming an open-ended
transmission line. A differential oscillator circuit is connected to the rods. An
oscillator state change is triggered by the return of a reflected signal from one
of the rods. The two-way travel time of the oscillator-induced electromagnetic
waves on the rod increases with increasing volumetric water content of the
surrounding media, hence the name water content reflectometer.
The electrical conductivity of the surrounding medium is derived from signal
attenuation information. This is accomplished by exciting the rods with a
known non-polarizing waveform and determining the signal attenuation due to
EC. The EC measurement is used to correct the oscillator period and is also
available to the user.
Temperature is measured with a thermistor that is in contact with one of the
rods. The thermistor makes a point measurement near the top of the sensor
rods. In a typical application this will correspond to a soil temperature reading
near the soil surface so care should be taken in interpreting soil temperature
data.
Because the CWS655 is wireless, it can be mounted in many locations that
would be problematic for a cabled sensor.
The CWS655 is generally not intended for burial below the soil surface in
typical installations as this will attenuate the radio signal and make it difficult
to change the batteries. Submersion in water or saturated soil may cause
damage to sensor electronics.
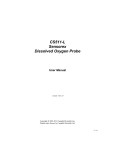
FIGURE 1-3. CWS655 Wireless Water Content Reflectometer
4
Wireless Sensor Network
The CWS655 outputs 8 values: Volumetric water content, Bulk electrical
conductivity, Dielectric permittivity, Soil temperature, Period Average,
Voltage ratio, Internal temperature, Battery voltage, and Signal strength.
Additional detail regarding CWS655 output is available in Appendix B,
Measurement Names and Meanings.
For specifications of the CWS655, see Section 2.4, CWS655 Specifications.
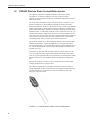
1.5
CWS900 Wireless Sensor Interface
The CWS900 is a Wireless Sensor Interface. The CWS900 measures analog
voltages, low level AC, pulse counts, and can supply an excitation voltage for
powering some sensors or making bridge measurements. It has a sealed
connector for use with a variety of sensors, such as temperature/humidity
probes, rain gages, wind monitors, or other low power sensors. The type of
measurement that the sensor performs is configured using Wireless Sensor
Planner, Network Planner, or DevConfig software.
FIGURE 1-4. CWS900 Wireless Sensor Interface
The CWS900 outputs 4 - 12 values, depending on configuration. TABLE 1-1
and TABLE 1-2 show available configurations and outputs.
It is important to note the units of the measurement being made by the
CWS900. In some cases additional processing of the measurement by the
datalogger program or post processing in a spreadsheet or database will be
necessary to convert the measurement to engineering units.
5
Wireless Sensor Network
6
*
*
*
*
*
*
*
*
*
*
*
*
*
*
*
*
*
CWS900 Internal Temperature, C
*
Battery Voltage, V
pH, V
*
Signal Strength
Dissolved Oxygen, V
Leaf Wetness Sensor, V
Relative Humidity
Probe Pressure, kPa
Probe Temperature, C
Avg Pulse Freq during polling interval, Hz
Max Pulse Freq during polling interval, Hz
Interval Count of Switch Closures
Total Count of Switch Closures
*
*
Differential Channel, V
*
*
*
Single Ended Channel 3, V
Single Ended Channel 2, V
Single Ended Channel 1 Measurement
Single Ended Channel 1 and 2 Measurement
Single Ended Channel 1, 2, and 3
Measurement
Differential Channel Measurement
Switch Closure
Pulse Count
Low Level AC
Rain Gage
Pyranometer (or Quantum Sensor)
109 Temperature Probe
HMP60 Temp/Humidity Probe
LWS Leaf Wetness Sensor
CS511 Dissolved Oxygen Sensor
CS525 ISFET pH Probe
CS450 Pressure Transducer
Single Ended Channel 1, V
Configuration
Output
TABLE 1-1. CWS900 Configurations and Outputs
*
*
*
*
*
*
*
*
*
*
*
*
*
*
*
*
*
*
*
*
*
*
*
*
*
*
*
*
*
*
*
*
*
*
*
*
*
*
*
*
*
*
*
*
*
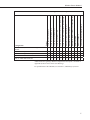
Wireless Sensor Network
Wind Speed Maximum, m/s
Wind Speed Minimum, m/s
Wind Speed Std Dev, m/s
Wind Dir Avg Unit Vector Mean Wind Dir, deg
Wind Dir Std Dev, Yamartino Algorithm, deg
Resultant Mean Wind Speed, m/s
Resultant Wind Dir Avg, deg
Resultant Wind Dir Std Dev CSI algorithm, deg
Signal Strength
Battery Voltage, V
CWS900 Internal Temperature, C
Configuration
05103, 05103-45, or 05106 RM Young Wind
Monitor
05305 RM Young Wind Monitor
03002 RM Young Wind Sentry Set
034B Met One Windset
#40C or #200P NRG Wind Set
Output
Wind Speed Average, m/s
TABLE 1-2. CWS900 Wind Sensor Configurations and Outputs
*
*
*
*
*
*
*
*
*
*
*
*
*
*
*
*
*
*
*
*
*
*
*
*
*
*
*
*
*
*
*
*
*
*
*
*
*
*
*
*
*
*
*
*
*
*
*
*
*
*
*
*
*
*
*
*
*
*
*
*
Additional detail regarding CWS900 configurations and outputs is available in
Appendix B, Measurement Names and Meanings.
For specifications of the CWS900, see Section 2.5, CWS900 Specifications.
7
Wireless Sensor Network
2.
Specifications
2.1
Wireless Sensor Network Radio
The CWB100 and CWS sensors use a 25 mW FHSS radio. Three models are
available depending on location of usage. TABLE 2-1 shows model numbers
and locations used for all models.
2.1.1 Electrical
TABLE 2-1. CWS FHSS Radio Specifications
Model
Where Used
Frequency
FHSS
Channels
CWSxxx, CWB100
U.S. Canada,
902-928 MHz
50
CWSxxxA, CWB100A
Australia, and
New Zealand
CWSxxxE, CWB100E
Europe
868 MHz
16
Transmitter Power Output:
25 mW (+14 dBm)
Receiver Sensitivity:
-110 dBm (0.1% Frame Error rate)
Current Drain
Standby:
Receiving:
Transmitting:
3 PA
18 mA typical (full run)
45 mA
Average operating current w/1 second
access time:
15 PA
Operating Temperature Range:
-25° to +50°C (-13° F to + 122°F)
Additional Features
GFSK modulation
Data interleaving
Forward Error Correction BCH (31,21)
Data scrambling
Quality of Service management
8
RSSI
Wireless Sensor Network
2.1.2 Typical RF Range
RF range is affected by antenna height and by obstacles between the two
antennae. The following ranges represent typical distances of RF range as
measured with a 0 dBd Omnidirectional 1/2 wave whip antenna connected to
the CWB100 radio base station:
Base
Height
Sensor
Height
RF Range
Dense Corn Field 2.1 m (7’) tall
1.2 m (4’)
1.2 m (4’)
0.9 m (3’)
0.0 m (0’)
152 m (500’)
131 m (430’)
Inside Industrial Building
1.2 m (4’)
0.9 m (3’)
> 76 m (250’)
Mixed Juniper/Maple Forest
1.2 m (4’)
1.2 m (4’)
0.9 m (3’)
0.0 m (0’)
156 m (513’)
103 m (340’)
Residential Street (Line of Sight)
1.2 m (4’)
1.2 m (4’)
0.9 m (3’)
0.0 m (0’)
392 m (1285’)
329 m (1080’)
Location
2.1.3 RSSI
Received Signal Strength Indicator (RSSI) is a measurement of the power
present in a radio transmission received by a wireless sensor. RSSI is a
unitless number between 0 (no signal) and 32 (full signal). RSSI is measured
periodically when the CWB100RSSI instruction is executed in the datalogger
program. The RSSI measurement may be used to determine whether a sensor
in the WSN is well positioned for reliable data transmission. See Section 5.3,
CWS Sensor Search for Base Station, for details on the CWB100RSSI
instruction.
2.1.4 Service Discovery Protocol
The CWS radio incorporates a service discovery protocol (SDP) which allows
the network of wireless sensors to auto-discover their connection to the base,
and the route used for that connection. The end result of this auto-discovery is
a list of sensor node addresses, and the route through other wireless sensors, if
any, used to reach these sensor nodes. The base station then uses these routes
to poll the sensors for data. The CRBasic instruction CWB100Routes may be
used to retrieve the routing information from the CWB100 radio. See Section
4.5, CWB100Routes() Instruction, for details on the CWB100Routes
instruction.
The sensors periodically check the synchronization status and, if the
connection to the base station is lost, it is automatically re-established, through
routers if necessary. It may take up to a day for a sensor to rediscover the base
station if early attempts fail, but the process may be manually triggered by
pressing the Setup button on the back of the sensor and holding it in for 8-10
seconds (see Section 5, CWS Button and LED Behavior).
The only parameter needed by the service discovery protocol is the base station
radio address. This parameter is used to prevent overlapping sensor networks
from “joining” each other. All sensors that are part of one network are
configured with the same base station address and that is the only base station
to which they will establish a communication link.
9
Wireless Sensor Network
2.1.5 Antenna Options
All CWS wireless sensors contain a built-in 0 dBd 1/4 wave antenna. No other
antenna options are available for the wireless sensors.
The CWB100 Wireless Base Station has a RPSMA connector for use with one
of several models of antenna. The base station does not automatically ship
with an antenna, so one must be ordered as a separate item. Antenna options
available for the CWB100 and CWB100A include the following:
Model
Description
15730
900MHz 0dBd Omni 1/4 Wave Whip Antenna w/Right Angle
15731
900MHz 0dBd Omni 1/4 Wave Whip Antenna, Straight 2 inches
Tall
14204
900MHz 0dBd Omni 1/2 Wave Whip Antenna
15970
900MHz 1dBd Dipole Antenna w/Adhesive Mount
14221
900MHz 3dBd Omni Antenna
14201
900MHz 9dBd Yagi Antenna
Larger outdoor antenna models require a cable to connect to the CWB100.
Available options include COAXRPSMA-L LMR195 cable and COAXNTN-L
RG8 cable. A surge suppressor kit, part number 14462, is required for
connecting the COAXNTN-L cable to the CWB100.
For antenna options for the CWB100E 868 MHz Wireless Base Station,
contact Campbell Scientific.
2.2
CWB100 Specifications
2.2.1 CWB100 Physical Specifications
Dimensions (including mounting bracket):
10.8 cm x 4.4 cm x 4.4 cm
(4.25” x 1.75” x 1.75”)
Weight:
140 g (5 oz)
2.2.2 CWB100 Electrical Specifications
10
Power:
4.5 - 22 VDC
Current Drain (@12V)
Standby:
Receiving:
Transmitting:
< 1 mA
10 mA
20 mA
Radio:
Internal 25 mW FHSS Radio
Communication:
Serial Protocol or USB
Wireless Sensor Network
Terminal Block Connector:
Bi-Directional Serial datalogger
connection
USB Port:
Computer connection for
configuration
Antenna:
RPSMA antenna connection
Memory:
Can store data table for up to 50
wireless sensors.
Operating Temperature Range:
-25° to +50°C (-13° F to + 122°F)
Terminal Block Pin-Out:
I/O Name
Description
In
+12V
12V Supply
n/a GND
Supply Ground
i/o DATA/A CPI “A”
i/o B
CPI “B”
n/a ISO_GND CPI Signal Reference
2.2.3 CWB100 Environmental Specifications
Temperature Range:
-25° to +50°C (-13° F to + 122°F)
Humidity Range:
Store and use in non-condensing
(desiccated) environment.
2.2.4 Datalogger Compatibility
The CWB100 is compatible with Campbell Scientific datalogger models
CR800-series, CR1000, and CR3000. These dataloggers use the CRBasic
instruction CWB100() to communicate with the CWB100. See Section 4,
Programming the Datalogger, for programming details.
Datalogger operating systems that support the CWB100 and CWS sensors are:
2.3
CR800-Series
CR800.Std.21 and higher
CR1000
CR1000.Std.21 and higher
CR3000
CR3000.Std.21 and higher
CWS220 Specifications
2.3.1 CWS220 Physical Specifications
Dimensions:
15 cm x 6 cm x 4.5 cm (6” x 2.4” x 1.8”)
Weight:
270 g (9.6 oz)
11
Wireless Sensor Network
2.3.2 CWS220 Electrical Specifications
Power:
2 AA Batteries
Average Current Drain:
300 PA with 15 minute polling
Radio:
Internal 25 mW FHSS Radio
Absolute Accuracy:
±0.2°C @ -10° to +65°C; ±0.5°C @ -40° to +70°C
Repeatability:
±0.05°C @ -10° to +65°C; ±0.1°C @ -40° to +70°C
Response Time:
<1 s to changes in target temperature
Wavelength Range:
8 to 14 μm (corresponds to atmospheric window)
Field of View (FOV):
22° half angle
2.3.3 CWS220 Environmental Specifications
2.4
Temperature Range:
-25° to +50°C (-13° F to + 122°F)
Humidity Range:
0 to 100%
Weather Resistance:
IP67 rating for sensor and battery pack (battery pack
must be properly installed; each sensor is leak tested)
CWS655 Specifications
2.4.1 CWS655 Physical Specifications
Dimensions
Body:
Rods:
14.5 cm x 6 cm x 4.5 cm (5.7” x 2.4” x 1.8”)
12 cm (4.7”)
Weight:
216 g (7.6 oz)
2.4.2 CWS655 Electrical Specifications
12
Power:
2 AA Batteries
Average Current Drain:
300 PA with 15 minute polling
Radio:
Internal 25 mW FHSS Radio
Soil Water Content
Accuracy:
± 2% when using Topps equation
EC Accuracy:
r(5% of reading + 0.05 dS/m)
Temperature Accuracy:
± 0.2°C
Wireless Sensor Network
2.4.3 WS655 Environmental Specifications
2.5
Temperature Range:
-25° to +50°C (-13° F to + 122°F)
Humidity Range:
0 to 100%
Weather Resistance:
IP67 rating for sensor and battery pack (battery pack
must be properly installed; each sensor is leak tested)
CWS900 Specifications
2.5.1 CWS900 Physical Specifications
Dimensions:
15 cm x 6 cm x 4.5 cm (6” x 2.4” x 1.8”)
Weight:
184 g (6.5 oz)
2.5.2 CWS900 Electrical Specifications
Power:
2 AA Batteries
Average Current Drain:
300 PA with 15 minute polling (depending
on attached sensor)
Radio:
Internal 25 mW FHSS Radio
Single-Ended Analog Channels:
SE1, SE2, SE3
Differential Analog Channels:
DF1
Analog Input Range:
-1 to + 2.5 VDC
Accuracy:
±(0.02% of reading + 2 μV) @ 0° to +50°C;
±(0.05% of reading + 2 μV) @ -35° to +70°C
Resolution:
0.3 PV
Excitation Voltage:
2.5V, 3.3 V, 5.0 V
20 mA maximum
Excitation Voltage Accuracy:
±2% @ -35° to +70°C
Bridge Measurement Accuracy
(+2.5 excitation only):
Low Level AC Input:
±(0.03% of reading + 3 μV) @ 0° to + 50°C;
±(0.07% of reading + 3 μV) @ -35° to + 70°C
20 mV minimum
10 kHz maximum frequency
Switch Closure
Maximum Count Rate:
Minimum Open Time:
Minimum Closed Time:
Maximum Bounce Time:
100 Hz
5 ms
5 ms
4 ms
Temperature Accuracy:
± 0.2ºC
13
Wireless Sensor Network
2.5.3 CWS900 Environmental Specifications
3.
Temperature Range:
-25° to +50°C (-13°F to + 122°F)
Humidity Range:
0 to 100%
Weather Resistance:
IP67 rating for sensor and battery back (battery pack
must be properly installed; each sensor is leak tested)
Getting Started: Creating a Wireless Sensor
Network
The steps to quickly creating a wireless sensor network are:
NOTE
3.1
1.
Obtain the required hardware and software
2.
Create a model of the network using default names
3.
Configure all the devices in the network
4.
Send configuration string file to the datalogger (optional)
5.
Program the datalogger to communicate with the CWB100
6.
Connect the CWB100 to the datalogger
7.
Apply power to the wireless sensors and initiate auto-discovery
8.
Verify that data is being transmitted
When building the network it is always best to start at the base and
work outwards.
Hardware and Software Required for a WSN
3.1.1 A205 CWS to PC Interface
The A205 CWS to PC Interface is used to communicate between wireless
sensors and a computer via a USB cable. One end of the A205 has a type B
female USB port while the other end has a four-pin female connector that
connects to the four-pin male connector located behind the battery pack of a
CWS sensor.
The A205 is necessary for configuring wireless sensors prior to deployment
and is also useful for testing and troubleshooting them. When connected to a
USB port on the computer, the A205 provides power to the wireless sensor.
CAUTION
14
When connecting the A205 CWS to PC Interface to a
wireless sensor, be sure the sensor has been powered
down (battery pack disconnected) for at least 15 seconds.
Wireless Sensor Network
FIGURE 3-1. A205 CWS to PC Interface
FIGURE 3-2. Connection of A205
3.1.2 Required Cables
A data cable, CSI part number 17648, ships with the A205. The cable has a
USB type A male connector on one end and a type B male connector on the
other end. The type B connector is connected directly to the CWB100 without
the A205 during configuration and is connected to the A205 when configuring
wireless sensors.
A serial cable is used for communication between the computer and the
datalogger.
15
Wireless Sensor Network
3.1.3 Configuration CD
A Configuration CD ships with each CWB100 Wireless Base Station. The CD
has software and files needed to configure and use wireless sensors including:
x
Wireless Sensor Planner
x
Device Configuration Utility
x
Device drivers for CWB100 radio
x
Operating Systems for CR800-Series, CR1000, and CR3000
dataloggers
x
CRBasic Help files for CRBasic instruction related to wireless sensors
x
Wireless Sensor Network Manual
The contents of the Configuration CD are also available at
www.campbellsci.com/downloads.
3.1.4 Configuration Software
Wireless Sensor Planner is typically used to configure a wireless sensor
network. Wireless Sensor Planner is similar to Network Planner, a component
of LoggerNet 4.1 and higher. Either Wireless Sensor Planner or Network
Planner can be used with wireless sensor networks. Device Configuration
Utility version 1.17 and higher may also be used to set up the network.
Network Planner and DevConfig are bundled with LoggerNet software.
LoggerNet version 4.1 and higher is required for support of the wireless sensor
devices. Wireless Sensor Planner and DevConfig are on the Configuration CD
that ships with the CWB100 Wireless Base Station. DevConfig and Wireless
Sensor Planner are also available as standalone products at
www.campbellsci.com/downloads.
After setting up the network with Wireless Sensor Planner, configuration
settings are written to the components of the network.
3.1.5 Driver Installation
If no CWB100 or A205 have been previously plugged into your computer, it
will be necessary to install device drivers to enable communication with this
device. The drivers are available on the Configuration CD that ships with the
CWB100. The drivers can also be downloaded at
www.campbellsci.com/downloads.
3.2
Creating a Model of the WSN
3.2.1 Wireless Sensor Planner and Network Planner
The Wireless Sensor Planner is a graphical application that assists in the design
of wireless sensor networks. The Wireless Sensor Planner is essentially a
subset of the Network Planner. It is identical in functionality and use, but
contains only the components for a wireless sensor network. The CWB100
and wireless sensors are placed on a drawing canvas and communication links
16
Wireless Sensor Network
are specified. As the network is being designed, Wireless Sensor Planner
automatically determines many individual device settings. After the model is
completed, device settings can be written to the devices using Wireless Sensor
Planner.
Network Planner version 1.1 or higher, available in LoggerNet 4.1 and higher,
can also be used to set up a wireless sensor network. See Section 4 “Setting up
Datalogger Networks” in the LoggerNet manual for more information on using
Network Planner. This manual will show only the use of Wireless Sensor
Planner to set up the wireless sensor network, but the steps shown will be
almost identical to those used with Network Planner.
3.2.2 Installing Wireless Sensor Planner
Run Setup from the CWB100 Configuration CD.
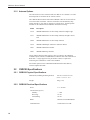
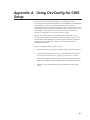
3.2.3 Using Wireless Sensor Planner
Launch Wireless Sensor Planner by double-clicking the Wireless Sensor
Planner shortcut on the Windows desktop. This will open a window that
includes a Device Palette, Drawing Canvas, Configure Devices list, and Station
Summary. These will be used to develop a model that includes a wireless base
station and one or more wireless sensors. After specifying the communication
links between the base station and the sensors, configuration settings will be
sent to components of the system.
Device Palette
Drawing Canvas
Configure Devices List
Station Summary
17
Wireless Sensor Network
3.2.3.1 Simple WSN Example
In this example, a CWB100 base station communicates with a CWS655 and a
CWS900 with a 109-L-CWS temperature sensor attached. Both sensors are
within radio range of the base so no repeaters are necessary.
Although station names and measurement names may be customized in
Wireless Sensor Planner, the fastest way to configure the network is to use the
default names provided. When using default names, the network is configured
simply by entering the base station address and choosing a measurement
configuration for each CWS900 in the network. In this Quick Start example,
default names will be used.
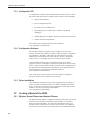
Placing Devices on the Drawing Canvas
Begin by placing a CWB100, a CWS655 and a CWS900 on the Drawing
Canvas. Select CWB100 from the Device Palette then click anywhere on the
Drawing Canvas to place it there. Next select CWS655 from the Device
Palette and select the Drawing Canvas. Finally, select CWS900 from the
Device Palette and select the Drawing Canvas. The icons on the Drawing
Canvas may be repositioned by selecting the icon and dragging it to a different
part of the canvas.
Link Tool
18
Wireless Sensor Network
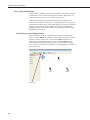
Adding Communication Links to Devices
The next step is to add links between the base station and the other two
devices. This represents the radio communication link between the devices.
To create links, click the Link Tool icon on the toolbar. The mouse cursor
changes from a hand to a jagged line indicating the Link Tool is currently
active. Select CWB100 to indicate that it is the first device in the link. Next
drag the resulting line to the CWS655 to complete the link.
A dialog box will appear highlighting the link. Click the OK button to accept
the link.
The link is now represented on the Drawing Canvas by a line between the base
station and the CWS655.
19
Wireless Sensor Network
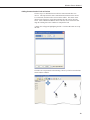
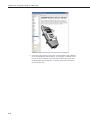
To add the link from the CWB100 to the CWS900, select the CWB100 and
drag the resulting line to the CWS900. Another Add Link Between Stations
dialog box will appear showing the new link. Click the OK button to accept
the link. A new dialog box called Station Link Properties will appear.
The CWS900 Wireless Sensor Interface connects to a variety of sensors. This
dialog box provides options for selecting the measurement type, excitation
voltage, and excitation delay needed for your sensor. Select the CWS900_1
tab at the top of the dialog box.
20
Wireless Sensor Network
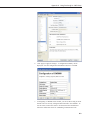
The Radio ID may be left blank and will be filled in automatically when the
device is programmed. Use the Measurement Configuration drop-down list to
choose the 109 Temperature Probe. The dialog box also shows the default
sensor field names that will be used when a measurement is taken. You can
accept the default field names or type in custom field names.
After making the selections, press the Apply button to close the dialog box and
complete the link.
3.3
Configuring the Devices in the WSN
The next step in setting up the network is to send configuration settings to the
devices in the wireless sensor network model. The devices that need to be
configured are listed in the Configure Devices panel. If the Configure Devices
list is not visible to the right of the Drawing Canvas, enable it by navigating to
View | Show Device Configuration List. The Configure Device list shows each
task that needs to be completed to set up the network successfully.
The settings that need to be configured for the sensors include the address of
the CWB100 base station, sensor name, field names, and measurement settings.
These settings are stored in non-volatile flash memory and are not erased, even
when a new operating system is sent to the wireless sensor.
3.3.1 Configuring the CWB100
Configure the CWB100 by connecting it directly to a USB port on your
computer using the 17648 cable. The cable will provide power to the
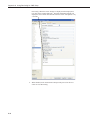
CWB100. Select the Program settings for CWB100_1:CWB100 item in the
list, then select Click Here.
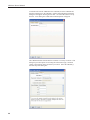
When the Setup Dialog window opens, make sure that the computer is
connected to the device as described in the dialog and that the correct Serial
Port is specified (it will show up as CWB100 (COMxx). A table showing
settings that Wireless Sensor Planner has determined for the CWB100 will be
21
Wireless Sensor Network
shown. To save these settings in a XML file for future reference, click Save
and choose a filename. To send these settings to the CWB100, click Connect.
After settings have been sent to the CWB100, a new window will show which
settings have been applied. This window will provide the option to save the
XML file, print it, and compare it to another saved configuration file.
After the new settings have been sent to the device, the “Settings have Been
Applied” window will appear. Options are available for saving the settings to a
XML file, printing the settings, and comparing the settings to another XML
file. When finished with these actions, click OK.
22
Wireless Sensor Network
3.3.2 Configuring the CWS655
To configure the CWS655 Water Content Reflectometer, first connect the
A205 to the type B USB connector on the 17648 cable. Remove the battery
door on the CWS655 and locate the four-pin connector near the top of the
sensor. Connect the A205 to the sensor at the four-pin connector. The A205
label should be facing toward the CWS655 antenna.
Select the Program settings for CWS655_1:CWS655 item in the Configure
Devices list, then select Click Here.
When the Setup Dialog window for configuring the CWS655 opens, verify that
the Serial Port matches the port number where the A205 is connected and click
Connect. Press the Setup button on the back of the CWS655. Settings will be
transferred and applied to the CWS655. In the Settings have Been Applied
window, options are available for saving the settings to a XML file, printing
the settings, and comparing the settings to another XML file. When finished
with these actions, click OK.
NOTE
The Setup button must be pressed to enable communications
between the wireless sensor and computer.
23
Wireless Sensor Network
3.3.3 Configuring the CWS900
To configure the CWS900 Wireless Sensor Interface, first connect the A205 to
the type B USB connector on the 17648 cable. Remove the battery door on the
CWS900 and locate the four-pin connector near the top of the sensor. Connect
the A205 to the sensor at the four-pin connector. The A205 label should be
facing toward the CWS900 antenna.
Select the Program settings for CWS900_1:CWS900 item in the Configure
Devices list, then select Click Here.
When the Setup Dialog window for configuring the CWS900 opens, verify that
the Serial Port matches the port number where the A205 is connected and click
Connect. Press the Setup button on the back of the CWS900. Settings will be
transferred and applied to the CWS900. In the Settings have Been Applied
window, options are available for saving the settings to a XML file, printing
the settings, and comparing the settings to another XML file. When finished
with these actions, click OK.
NOTE
3.4
The Setup button must be pressed to enable communications
between the wireless sensor and computer.
Sending the Sensor Configuration File to the Datalogger
The sensor configuration file is a text file with a single line of text that
provides the datalogger with information related to the data that will be
transmitted by wireless sensors in the network. It is useful for predefining
sensor field names so that the datalogger table definitions do not change each
time a new wireless sensor is discovered. Wireless Sensor Planner creates the
file based on the radio address, sensor name, and sensor field names or custom
field names specified for each sensor in the network.
The CRBasic instruction CWB100 reads the sensor configuration file into a
constant string that is used by the datalogger to apply names to the values
24
Wireless Sensor Network
transmitted by wireless sensors. See Section 4.2.1, Configuration String, for
more information on the format and use of the configuration string.
After the configuration settings have been sent to the base station and wireless
sensors, the sensor configuration file may be sent to the datalogger. The
datalogger must then be programmed to access that file using the third
parameter of the CWB100 instruction. See Section 4, Programming the
Datalogger, for programming details.
To send the sensor configuration file to the datalogger, connect a serial cable or
USB-to-serial cable to the RS-232 port between the computer and the
datalogger.
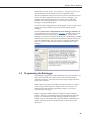
Select the Send a sensor configuration file to the datalogger attached item
in the Configure Devices list, then select Click Here. Enter the correct COM
port number for the cable that attaches to the datalogger. Ensure that the
datalogger is powered as described in the dialog box. The datalogger’s PakBus
address does not need to be specified for this transaction but if a security code
is present in the datalogger, that code needs to be entered in the Datalogger
Security Code field. Click Connect to send the configuration file to the
datalogger.
3.5
Programming the Datalogger
The datalogger program must include a destination array large enough to store
all the values returned by the wireless sensors and a scan that includes a
CWB100() instruction. The scan interval must be large enough to allow the
sensors time to transmit.
In this example, the program will simply collect data from the two wireless
sensors once per minute and store a sample of each value collected. For
additional details and advanced programming examples, see Section 4,
Programming the Datalogger.
Begin by opening the CRBasic editor in LoggerNet, PC400 or RTDAQ
software. Select New CR1000 Program File to begin editing the datalogger
program. For information on writing datalogger programs or using the
CRBasic editor, see the CR1000 and LoggerNet manuals. Additionally, the
CRBasic editor help file has an example program for the wireless sensor
instructions.
25
Wireless Sensor Network
Determining Size of the Array
In this example the WSN includes a CWS655 and a CWS900 configured to
measure a 109 temperature probe. Section 1.4, CWS655 Wireless Water
Content Reflectomer, shows that the CWS655 transmits 8 values and Section
1.5, CWS900 Wireless Sensor Interface, shows that the CWS900 transmits 4
values when configured to measure a 109 probe. Thus the array needs to be
sized to accept at least 12 values:
Public WSN(12)
Note that since the array is sized to fit the number of incoming values exactly,
no additional wireless sensors may be added to this network without first
modifying the datalogger program.
Determining the Scan Rate
The scan in which the CWB100() instruction resides must be long enough to
allow for 60 seconds per sensor per hop. If the CWB100RSSI() instruction is
used also, an additional 60 seconds/sensor/hop must be included. In this
example, each sensor needs only one hop to transmit data to the base station.
At 60 seconds per hop, the minimum scan rate is 120 seconds:
Scan (120,Sec,0,0)
.
.
.
NextScan
NOTE
The 120 second scan rate in this example provides a relatively fast
check of system components, but will drain the sensor’s batteries
within a few months. In practice, a more typical scan rate is in the
range of 5 to 15 minutes. See Appendix C, Battery Life, for details
on battery life.
Inserting the CWB100() Instruction
For the CWB100() instruction, specify the odd numbered control port where
the CWB100 radio will attach to the datalogger (C1), the destination array
where CWS measurements will be stored, and the name of the configuration
string (in quotes “ “):
CWB100(1, WSN(),”CPU:CWSConfig.txt”)
26
Wireless Sensor Network
Finishing the Program
Add a one minute data table and CallTable instruction to complete the program
Public WSN(12)
DataTable (WSNData,True,-1)
DataInterval (0,2,Min,0)
Sample (12,WSN(),FP2)
EndTable
BeginProg
Scan (2,Min,0,0)
CWB100(1, WSN(),"CPU:CWSConfig.txt")
CallTable WSNData
NextScan
EndProg
Save the program and send it to the datalogger.
NOTE
3.6
If the CRBasic editor does not compile the program and indicates
the error message “Undeclared variable CWB100” this indicates
that the compiler is too old and does not support the wireless
sensor CRBasic instructions. It is still possible to send the
program and run it in the datalogger as long as the datalogger has
operating system version 21 or higher.
Connecting the CWB100 to the Datalogger
The DATA/A terminal on the CWB100 radio connects to the odd numbered
control port specified in the CWB100() instruction. In this example, DATA/A
connects to C1.
CAUTION
1.
Power down the datalogger.
2.
Connect CWB100 G terminal to G terminal on the datalogger.
Connect to power ground (G), not analog ground (
).
3.
Connect CWB100 +12V terminal to 12V terminal on the datalogger.
4.
Connect CWB100 DATA/A terminal to C1 on the datalogger.
5.
Apply power to the datalogger.
The LED activity indicator on the CWB100 will flash red and green rapidly as
it goes through the power-up sequence. Then the red LED will flash every 5
seconds.
3.7
Powering CWS Sensors and Initiating Auto-discovery
Connect the 109-L-CWS sensor to the CWS900 female connector at the
bottom of the CWS900. Press the connector firmly into the sockets and rotate
the locking nut to hold it in position.
27
Wireless Sensor Network
Power the CWS sensors by attaching the battery pack to the 4-pin connector.
The red LED light will hold steady for about 4 seconds and then turn off.
Press and hold the Setup button on the back of the sensor. The blue LED light
will flash up to four times indicating the battery voltage then stop flashing.
When the Setup button is continually pressed, about four seconds later the blue
LED will start flashing again about once per second as the sensor searches for
the base station. This process is known as auto-discovery. Once autodiscovery begins, release the Setup button and wait for the sensor to establish
communication with the CWB100 radio.
Establishing the radio link may take five minutes or more. Patience is
important at this stage of the network setup.
Once the radio link is established, the sensor will flash its red LED light and
transmit its table definitions to the CWB100. During this process the red LED
on the CWB100 stays on longer than usual indicating that it is receiving a
transmission. Afterward the sensor will flash the blue LED when it makes a
measurement followed by a flash of the red LED indicating that it has
transmitted the measurement to the CWB100.
If the Setup button is not pressed to initiate auto-discovery, the wireless sensor
will automatically begin auto-discovery 12 hours after being powered.
For additional information about CWS sensor diagnostics, see Section 5, CWS
Button and LED Behavior.
3.8
Verify that Data is being Transmitted
After the sensors have established links to the CWB100 radio, verify that data
is being received. This may be done with the Connect screen in LoggerNet, the
Monitor Values tab in PC400, or the Monitor Data tab in PC200W.
3.9
Physical Connections
3.9.1 Connecting the Base Station to the Datalogger
Connect the CWB100 to the datalogger as shown in FIGURE 3-3.
FIGURE 3-3. CWB100 Wiring Connections
28
Wireless Sensor Network
3.9.2 Connecting Sensors to the CWS900
For sensors that are compatible with the CWS900 but do not have the –LWS
connector option available, or for compatible sensors not sold by Campbell
Scientific, a connector will need to be added to the sensor in order to interface
it with the CWS900. Two options are available.
A CWS900 Mating Connector may be purchased from Campbell Scientific and
connected to the sensor pigtail. This will require soldering the sensor wires to
pins on the connector and ensuring the connections are waterproof.
A DES2 Junction Box with a special –LWS cable may be purchased from
Campbell Scientific and the sensor connected to the –LWS cable through a
terminal block.
The connector pin-out for the CWS900 is shown in FIGURE 3-4.
FIGURE 3-4. CWS900 Connector Pin-Out
After connecting the non-standard sensor to the CWS900, test the connections
and sensor performance with DevConfig software. See Appendix A, Using
DevConfig for CWS Setup, for details.
4.
Programming the Datalogger
Section 3, Getting Started: Creating a Wireless Sensor Network, uses a simple
datalogger program to set up a network of two wireless sensors. More
advanced programming concepts are described below.
4.1
Array Declaration
All wireless sensors in a network will have their values written to the same
variable array. It is important that the array be sized large enough to store all
of the values from all of the sensors. If a sensor is discovered but the array is
not large enough to hold all of the values reported by the sensor, then none of
the values reported by that sensor will be received and it will appear that the
sensor has not been discovered. Each sensor in the network will transmit 4 –
10 values, depending on its configuration.
29
Wireless Sensor Network
TABLE 4-1. Values Transmitted by CWS Sensors
shows the number of values transmitted by different sensors in a wireless
network.
30
Wireless Sensor Network
TABLE 4-1. Values Transmitted by CWS Sensors
Sensor
Values Transmitted
CWS220 Wireless Infrared Radiometer
5
CWS655 Wireless Water Content Reflectometer
8
CWS900 Wireless Sensor Interface*
4 – 10
*
See Section 1.5, CWS900 Wireless Sensor Interface, for more information on number of values
transmitted by the CWS900
In the network example shown in Section 3, Getting Started: Creating a
Wireless Sensor Network, a CWS655 and a CWS900 configured for a 109-L
probe are used. The CWS655 transmits 8 values and the CWS900 transmits 4
values. The array needs to be dimensioned for at least 12 variables, for
example:
Public WSN(12)
The array can be sized larger than necessary to allow additional sensors to be
added to the network later without reprogramming the datalogger. Oversizing
the array will use extra datalogger memory and should be implemented with
caution.
4.2
CWB100() Instruction
The CRBasic instruction CWB100 is used to set up the polling of the base
station by the datalogger. The instruction has the following format:
CWB100( Port, Destination Array, Configuration )
Port: The Port parameter is a constant indicating the odd numbered control
port (C1, C3, C5, or C7) to which the CWB100 DATA line will be connected.
Destination Array: The Destination Array is the array variable that will hold
the values from the network. Its size determines the maximum number of
values expected from the sensor network.
One of the following error codes may be written to the first element of the
destination array if there is a problem with communication between the
datalogger and the CWB100 (see Section 8, Troubleshooting, for more
information):
Error Code
Meaning of Error Code
-1
The datalogger has failed after three consecutive attempts to
collect data from the base station.
-2
The signature verifying communication is wrong.
-3
The signature of the names held by the datalogger is different
from the signature of names held by the CWB100.
31
Wireless Sensor Network
Configuration: The Configuration parameter is an optional constant string
parameter that specifies a list of sensor descriptions. This configuration string
is supplied by the user to predefine sensor and field names along with the order
in which values are returned to the destination array. It overrides the names
provided by the sensor and predefines field names.
This parameter can specify a file, as in “CPU:CWSConfig.txt”, in which case a
file called CWSConfig.txt that contains the configuration string is copied to the
datalogger’s CPU. The file can be created by the Wireless Sensor Planner or
Network Planner software and downloaded into the datalogger as part of the
process of configuring a network of sensors.
Use of the configuration string is optional.
4.2.1 Configuration String
The configuration string consists of a list of comma separated sensor
descriptions where each sensor description is a space separated list of the
following items:
Sensor ID
Radio ID of the sensor
Required
Sensor Name
Station name of the
sensor
Required
Number of Fields
Number of values to be
transmitted by the sensor
Optional. Defaults to 1
if not specified.
1st Field Name
Name of first value
transmitted.
Optional. Treated as
unknown if not specified
2nd Field Name
Name of second value
transmitted.
Optional. Treated as
unknown if not specified
Nth Field Name
Name of last value
transmitted.
Optional. Treated as
unknown if not specified
It is good practice to keep the custom field names short in order to minimize
radio transmission time from a wireless sensor.
Unknown field names are serialized with an uncommon root name, "_F", with
the serial number starting at one greater than the number of field names
specified for that sensor.
Example of a configuration string:
12530A4013BA N40 9 WC_Corn EC_Corn Ts_Corn Ka PA VR Ti BV SS,
12530A4013B7 Barn 4 Tair Ti BV SS
The configuration string predefines field names in the destination array. The
advantage of this is that the datalogger table definitions do not change as
wireless sensors are discovered.
If no configuration string is specified, the elements of the destination array will
be renamed with field names from the sensors in the order that the sensors are
32
Wireless Sensor Network
discovered. This can make it difficult to use specific values in the datalogger
program because of uncertainty as to which position in the array the value of
interest will be assigned. The CRBasic instruction ArrayIndex may be used to
reference values returned by wireless sensors regardless of where those values
are in the destination array. See Section 4.3, ArrayIndex() Instruction, for
details on ArrayIndex.
4.2.2 Field Names
Field names are generated or learned by the base and are provided to the
datalogger for the purpose of generating table definitions. The configuration
string is used as a starting point for field name generation. If the configuration
string does not fully specify field names, default names with a serialize root
name “ _Fn” are generated by the base. Later, as new sensors are discovered,
the generated names are modified by field names learned from the sensor with
the “_Fn” portion of the name replaced by the field name learned from the
sensor.
For example, before discovery, a generated field name might be:
"CWS650__F3", then after discovery, this may change to "CWS650_BatV"
where "BatV" was the field name provided for the third field by the sensor.
If a sensor name is not provided by the configuration string, then the sensor
name learned from sensor discovery will be used to name the sensor. These
auto-discovered sensor field names are added to the end of the list of field
names until all available space in the Destination Array is consumed.
These default sensor field names are shown in Wireless Sensor Planner,
Network Planner, and DevConfig software. Descriptions of the default sensor
names are found in Appendix B, Measurement Names and Meanings.
4.2.3 Status Monitoring
All CWS sensors generate both measurement and status values. The status
fields (usually battery voltage, module temperature, and RSSI) are always
included as the last three fields returned by the sensor. Including status
information along with measurement data from each sensor is the easiest way
to manage status information. It is recommended that status data be recorded
by the datalogger to assist in data analysis and troubleshooting.
If status data is not desired, then specify only the measurement fields in the
configuration string. If the configuration string specifies fewer values than are
returned by the sensor, only as many values as are specified will be saved in
the Destination Array.
For example, CWS650_1 returns 7 values, including 3 status values. To ignore
the status values use a configuration string similar to:
AF6345bd3404 CWS650 4.
Limiting the number of fields to 4 means the first 4 measured values will be
stored in the destination array and the last 3 status values will not.
33
Wireless Sensor Network
4.3
ArrayIndex() Instruction
The ArrayIndex function is used to return the index of a named element in an
array which would otherwise be unknown. The value can then be further
processed in the program because of its known position in the array. If the
named element is not found, the function returns 0 (this will result in a
Variable Out of Bounds error).
In a wireless sensor network where auto-discovery is being used, the sensor
measurements are returned in the destination array in the order in which the
sensors are discovered by the base. It is not known until the sensors are
discovered where in the array each sensor's measurement values will be stored.
The names of the values returned by the sensors are known, however. Thus,
the ArrayIndex function can be used to return the correct index value so that
further processing such as output processing or unit conversion can be
performed.
The instruction has the following format:
ArrayIndex (Name)
Name: A string that contains the name of the value for which an index is
desired. All CWS sensors have a default sensor name, and a fieldname for
each returned value. For instance, a CWS900 with a sensor name of
CWS900_3AF has a 109 probe attached and returns four default values: Ts
(109 temperature), Ti (internal temperature), BV (battery voltage), and SS
(signal strength). Thus, the default name for the sensor's temperature
measurement might be CWS900_3AF_Ts. This would be entered as a string in
the ArrayIndex function:
Const NumValues = 12
Public CWSArray(NumValues)
Public Tair_F
DataTable (WSN5min,True,1000)
DataInterval (0,2,Min,0)
Sample (1,CWSArray(ArrayIndex("CWS900_TS")),FP2)
FieldNames (CWS900_Temp)
Sample (1,CWSArray(ArrayIndex("CWS655_VWC")),FP2)
FieldNames (CWS655_VWC)
EndTable
BeginProg
Scan (2,Min,0,0)
CWB100 (3,CWSArray())
Tair_F = CWSArray(ArrayIndex("CWS900_TS")) * 1.8 + 32
CallTable (WSN5min)
NextScan
EndProg
In this example wireless sensor data is written to a destination array called
CWSArray. Because the default measurement name is known, it is entered in
quote marks in the Name field of the ArrayIndex instruction. The datalogger
can then search for that name in the destination array and reference its position
34
Wireless Sensor Network
in the array for program use regardless of the order in which the sensor was
discovered.
CRBasic instruction Fieldnames is used after each output instruction to provide
a unique output name to the values. If more than one output instruction is in
the DataTable and Fieldnames is omitted, a compiler error will be returned
indicating duplicate output names. If the compiler error is ignored and the
program sent to the datalogger, the datalogger may generate additional
compiler errors or it may accept the program but size the DataTable with fewer
fields than specified in the program. It is therefore good practice to put a
FieldNames instruction after each output instruction that utilizes ArrayIndex.
4.4
CWB100RSSI() Instruction
The CRBasic instruction CWB100RSSI is used to trigger a round of RSSI
(signal strength) polling of each sensor in the network. The RSSI values will
be returned along with other data in the next measurement cycle. If RSSI
polling is never triggered, the RSSI field associated with each sensor will
always return NAN. The instruction has the following format:
CWB100RSSI ( Port )
Port: The Port parameter is a constant indicating the control port (C1, C3, C5,
or C7) to which the CWB100 Data line is connected.
The CWB100RSSI() instruction should not be executed as often as the
CWB100() instruction polls the sensors. This is because it requires an
additional RF polling cycle to measure the RSSI from the sensors, which
decreases battery life and scan rate (see Section 3.5, Programming the
Datalogger).
4.5
CWB100Routes() Instruction
The CRBasic instruction CWB100Routes is used to view the routes used by
various wireless sensors to transmit their data to the CWB100 base station.
The instruction returns the sensor serial number, the sensor name and any hops
to the base for each wireless sensor in the network. A hop is a sensor's link
through a routing sensor back to the wireless base. The hop is also specified as
sensor serial number sensor name. The format of the returned string is:
RadioID SensorName Hop1 Hop2 Hop3
The path specified by Hop1 Hop2 Hop3 is the path from the sensor back to the
base (the base would be after Hop3). If a sensor transmits directly to the base
with no hops, only the RadioID and SensorName will be returned. The
information for each sensor is terminated by a carriage return/line feed.
This instruction does not trigger any additional communication to the sensors
in the wireless sensor network, and thus, does not affect power consumption of
the sensors.
The instruction has the following format:
CWB100Routes ( Port, Routes )
35
Wireless Sensor Network
Port: The Port parameter is a constant indicating the control port (C1, C3, C5,
or C7) to which the CWB100 Data line is connected.
Routes: A destination variable of type String where the routing information
will be stored. It is important to size the variable large enough to hold all of
the routing information.
Example
Public WSNRoutes as String *100
.
.
.
Scan()
CWB100Routes(C7, WSNRoutes)
NextScan
For example, in a network with sensors named W900_006, W900_Red,
W900_39D, and W220_38F, the CWB100Routes() instruction returns the
following string:
125309400006 W900_006
12530A401388 W900_Red
12530A40139D W900_39D: 12530A401388 W900_Red
12530A40138F W220_38F
This reports that sensor W900_006 hops directly to the base station.
W900_Red also hops directly to the base station. W900_39D hops to
W900_Red and from there hops to the base station. Finally, W220_38F hops
directly to the base station.
4.6
Program Example
In example program 4.6-1, CWB100 is used to poll the CWB100 base station
every 10 minutes and CWB100RSSI is used to trigger a radio strength signal
measurement every 60 minutes. A flag called GetRSSI is available to
manually force the RSSI measurement. Sensor routes are also updated hourly.
The wireless sensor measured in this example is a CWS900 interfaced to a
109-LW temperature probe.
ArrayIndex is use in the DataTable and the disable variable is used to exclude
NAN values from influencing the average and minimum calculations.
Wiring for Example Program 4.6-1:
36
CWB100 Channel
Wire Color
CR1000 Channel
+12V
Red
12V
G
Black
G
DATA/A
Green
C3
Wireless Sensor Network
Example 4.6-1. Program for Wireless Sensor Network
Const NumVals = 4 'Values returned by CWS900
Public GetRSSI As Boolean
Public WSN(NumVals)
Public WNSRoutes As String *100
DataTable(SensorNetwork,True, -1 )
DataInterval( 0,10,Min,0)
Average (1,WSN(ArrayIndex("CWS900_Ts")),IEEE4,WSN(ArrayIndex("CWS900_Ts"))= NAN)
FieldNames (CWS900_T_C)
Average (1,WSN(ArrayIndex("CWS900_Ti")),IEEE4,WSN(ArrayIndex("CWS900_Ti"))= NAN)
FieldNames (CWS900_Ti_C)
Minimum (1,WSN(ArrayIndex("CWS900_BV")),IEEE4,WSN(ArrayIndex("CWS900_BV"))= NAN,False)
FieldNames (CWS900_BattV_Min)
Minimum (1,WSN(ArrayIndex("CWS900_SS")),IEEE4,WSN(ArrayIndex("CWS900_SS"))= NAN,False)
FieldNames (CWS900_RSSI_Min)
EndTable
BeginProg
Scan (600,Sec,0,0)
CWB100(3,WSN, )'Poll CWB100 for sensor data:
If IfTime (0,60,Min) Then GetRSSI = True
If GetRSSI = True Then
CWB100RSSI( 3 ) 'Trigger a radio signal strength measurement
CWB100Routes (3,WNSRoutes)'Verify routes
GetRSSI = False
EndIf
CallTable SensorNetwork
NextScan
EndProg
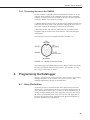
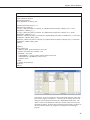
This numeric screen from LoggerNet shows both Public and final storage data
generated by program example 4.6-1. CWS900_SS will display NAN except
during the scan immediately following the CWB100RSSI() instruction. The
disable variable in the Minimum() instruction excludes NAN values from the
minimum calculation. Note that in the SensorNetwork data table, the labels for
the measurements match those assigned by FieldNames in the datalogger
program.
37
Wireless Sensor Network
5.
CWS Button and LED Behavior
The Setup button on the back of a CWS sensor and the RED and BLUE LED
lights provide diagnostic information regarding the sensor and its
communication with the CWB100 base station radio.
5.1
Sensor Link to Base Station
Press the Setup button momentarily to see how the CWS sensor is linked to the
CWB100 base station. The RED LED flashes to indicate the number of hops
to the base radio as follows:
No RED LED flashes:
no link to base
1 RED LED flash:
direct (1 hop) link to base
2 RED LED flashes:
link through 1 repeater to base (2 hops)
3 RED LED flashes:
link through 2 repeaters to base (3 hops)
4 RED LED flashes:
link through 3 repeaters to base (4 hops)
These flashes do not provide any information regarding the strength of the
radio communication. They simply tell how many hops are required for the
sensor to reach the CWB100 base station. Signal strength is measured when
the datalogger executes a CWB100RSSI( ) instruction (see Section 4.4,
CWB100RSSI() Instruction).
5.2
Sensor Battery Voltage
After pressing the Setup button momentarily the RED LED flashes if
connected to the base as described above, while the BLUE LED flashes
simultaneously to indicate battery voltage as follows:
1 flash:
Battery voltage < 2.25V; batteries should be replaced or recharged
2 flashes: 2.25V < Battery voltage < 2.50V
3 flashes: 2.50V < Battery voltage < 2.75V
4 flashes: Battery voltage > 2.75V
5.3
CWS Sensor Search for Base Station
If the Setup button is held for about four more seconds after the link/battery
status flashes have stopped, the BLUE LED will begin flashing about once per
second, and the radio will attempt to find a link to the base station. This
process is called auto-discovery. It will do this even if it already has a link to
the base.
The sequence for the search is:
1.
38
Attempt to link to base. The search attempt takes from 30 seconds to 5
minutes. During this time the BLUE LED blinks about once per second.
Wireless Sensor Network
2.
If the initial attempt fails to link to the base station, the CWS sensor will
delay 5 minutes before attempting to link again. The BLUE LED will be
off during this time. The sensor will try to link to the base at a five
minute interval a total of three times.
3.
If the 5-minute interval attempt fails to link to the base station, the CWS
sensor will delay one hour before attempting to link again. The BLUE
LED will be off during this time. The sensor will try to link to the base at
a one hour interval a total of four times.
4.
If the hourly attempts fail, the CWS sensor will try to connect to the base
station every 12 hours. At the beginning of each 12 hour interval it will
make three attempts spaced 5 minutes apart. This sequence will be
repeated indefinitely.
If the Setup button is not pressed to initiate auto-discovery, the wireless sensor
will automatically begin a search for the base station 12 hours after being
powered.
If discovery has been successful and the base station later loses power, the
wireless sensor keeps making measurements at the same polling interval. It
does not transmit the measured values because it only transmits data when
polled by the CWB100 base station. After 4-12 hours of no communication
with the base station, the sensor will start the autodiscovery mode and follow
the schedule shown above.
6.
Testing the Network
NOTE
Whenever possible it is best to bench test the network before field
installation.
Test the network by powering the sensors and verifying their RF connectivity.
This is done with the following steps:
1.
Configure the wireless sensors (see Section 3, Getting Started: Creating a
Wireless Sensor Network, for details).
2.
Write the datalogger program (see Section 4, Programming the
Datalogger, for details).
3.
Connect the CWB100 radio base station to the datalogger with the
DATA/A channel wired to the control port specified in the Port parameter
of the CWB100 () instruction.
4.
Send the program to the datalogger.
5.
Connect the battery pack to the first wireless sensor. When first powered
the red LED light will hold steady for 5 seconds and then turn off. Press
the Setup button on the back of the sensor and hold it in for 8-10 seconds
to force the sensor to start searching for the base station. When the button
is first pressed, the blue LED light will flash 1 to 4 times to indicate the
sensor battery voltage (see Section 5, CWS Button and LED Behavior).
After several more seconds the blue LED will flash about once per second
as the sensor searches for the base station. It may take several minutes for
39
Wireless Sensor Network
the wireless sensor to link with the base station. Once the linking has
taken place, the blue LED will stop flashing. From that point on, the blue
LED will light up whenever a measurement is taken and the red LED will
light up whenever the measurements are transmitted to the base station.
40
6.
Connect the battery pack to the next wireless sensor, press in the Setup
button for 8-10 seconds, and wait for that sensor to pair with the base
station radio. It is also possible to power all the sensors at the same time,
press the button to start the linking, and wait for them to autodiscover the
base station.
7.
To verify that all sensors have been discovered, you can view real-time
data from the sensors from LoggerNet’s Connect screen. There are two
ways to do this. First, from the Table Monitor area of the Connect screen,
choose Public from the drop down menu. Then click the Start button at
the center bottom of the Connect screen. Prior to sensor discovery, the
numeric monitor will display the name of the public variable specified in
the CWB100 instruction with NAN as the output (if no configuration
string is specified). Once any sensor has been discovered, the Public table
will disappear and must be selected again from the drop down menu. At
that time the newly discovered sensor names will appear in the Public
table. On the next datalogger scan, the sensor values will also appear.
8.
The second way to view real-time data from the sensors is to select the
Num Display button at the top of LoggerNet’s Connect screen and choose
Display 1, Display 2, or Display 3. When the Numeric Display window
opens, click the Add button. When the Add Selection window appears,
select Public to highlight it and then drag it to a gray space in the Numeric
Wireless Sensor Network
Display window. This will populate the window with names of variables
in the Public Table. Click the Start button to begin monitoring.
Prior to sensor discovery, the numeric monitor will display the name of the
public variable specified in the CWB100 instruction with NAN as the
output. Once the sensor has been discovered, NAN will change to
Undefined.
To view the user-specified Field Names in the numeric monitor, delete the
original Public variables from the display with the Delete All button and
add the Public table again with the Add button. Now the correct Field
Names will be displayed for each sensor with their real-time values.
7.
Maintenance
Minimal maintenance is required for the CWS900, CWS220, and CWS655
wireless sensors. If batteries are solar charged, the solar cell battery lid needs
to be periodically cleaned with water to remove dust and debris. Alkaline
batteries need to be replaced periodically as needed. It is good practice to store
the battery voltage of individual sensors in the datalogger to determine when
the sensor power supply needs attention.
It is important to keep the lens and view of the CWS200 clean. Otherwise the
sensor will be measuring the temperature of the obstruction instead of the
surface of interest. Clean the lens gently with a moistened cotton swab.
41
Wireless Sensor Network
Distilled water or alcohol works well for most dust/dirt. Salt deposits dissolve
better in a weak acid solution (~0.1 molar).
Sensors connected to the CWS900 may require regular maintenance and
recalibration. See the documentation for the sensor of interest for
recommended maintenance and recalibration details.
7.1
Replacing a Sensor in the Network
If a sensor in the network needs to be replaced, the CWB100 treats the
replacement sensor as a new sensor because it has a different radio address than
the original sensor. The data transmitted by the replacement sensor will have
the same field names as the original sensor, but with a ~ appended to each
name by the datalogger support software to make it unique. The original
sensor will still appear in the final storage data file with NAN’s instead of
values because the sensor is no longer working. Data from the replacement
sensor will be saved to a different position in the final storage data file with
field names that include the ~ character.
If a sensor has not responded to six polls by the CWB100 and it has been more
than two hours since the last communication, the CWB100 will stop polling
that sensor.
The only way to fully remove a sensor from the network and replace it with
another is to force the datalogger to read the sensor names from the CWB100
after the replacement sensor is configured and installed. Changing the size of
the array or the scan interval in the datalogger program, for example, will force
that reading when the program is compiled. In that case the ~ character will
not be appended to the new sensor’s field names.
If a configuration file or string is used in the CWB100( ) instruction, then the
replacement sensor is accommodated by using a new file or string that has the
old radio address replaced with the new radio address. The configuration file is
only read by the datalogger one time at compile, so a change to the
configuration file must be accompanied by a restart of the datalogger program
for the new file to be used.
7.2
Stopping or Loading a New Datalogger Program
If the datalogger program is stopped or a new program loaded, the CWB100
base station will still retain its information for the discovered sensors in the
network. The sensors will not have to initiate auto-discovery.
If the sensors are not polled by the base at least once in 13 hours, the sensors
will initiate the auto-discovery process just as if the Setup button had been
pressed to start auto-discovery.
42
Wireless Sensor Network
8.
Troubleshooting
Symptom
Possible Cause
Solution
Cannot connect to
CWB100 with USB
cable
Wrong serial port
number specified
Choose correct serial
port number from drop
down menu. If correct
port number does not
display, wait 15 seconds
for list to refresh and try
again.
Device drivers not
installed
Install device drivers
from Configuration CD
Cannot connect to CWS
sensor with A205
Wrong serial port
number specified
Choose correct serial
port number from drop
down menu. If correct
port number does not
display, wait 15 seconds
for list to refresh and try
again.
Datalogger program that
includes CWB100
instruction has compile
errors
CRBasic compiler too
old
Update compiler using
Configuration CD
Datalogger operating
system too old
Send latest OS to
datalogger. This is
available on the
Configuration CD or
from
www.campbellsci.com
Compile results
indicates configuration
file does not exist
Configuration file has
not been sent to
datalogger
Send configuration file
via Wireless Sensor
Planner, Network
Planner, or File Control
CWSConfig parameter
in CWB100 instruction
does not match file on
datalogge
Check spelling,
pathway, and filename
specified in program
and correct if needed
Low Battery
Replace or recharge
batteries
Sensor is damaged
Connect sensor directly
to computer using A205
and DevConfig software
to verify performance.
See Appendix A, Using
DevConfig for CWS
Setup, for details.
Sensor LED does not
respond when Setup
button is pressed
43
Wireless Sensor Network
Symptom
Possible Cause
Solution
Pressing Setup button
for 8-10 seconds does
not initiate autodiscovery (Blue LED
does not blink every
second indicating search
for base station)
Sensor does not have
radio base station
address programmed
into it
Reconfigure sensor to
include base station
radio address
First element in
destination array
specified in CWB100
instruction is -1 and all
other elements in the
array are zeroes
CWB100 is not
connected to control
port specified in
CWB100 Port
parameter.
Check program and
verify that the CWB100
radio DATA/A terminal
is well connected to the
control port specified in
the CWB100
instruction.
CWB100 is not
powered.
Verify that +12V and G
channel on CWB100
radio are well connected
to 12V and G terminals
on the datalogger.
Verify that the
datalogger is powered
on.
If connected to SW12
channel on datalogger,
verify that datalogger
program turns 12V
channel on and leaves it
on.
First element in
destination array
specified in CWB100
instruction is -2 and all
other elements in the
array are zeroes.
44
CWB100 G connected
to datalogger analog
ground.
Connect CWB100 G to
datalogger power
ground, G.
A device other than the
CWB100 is connected
to the control port
specified in the
CWB100 instruction
Port parameter.
Change program or
move wire connected to
DATA/A terminal so
that the program and
physical connections
match.
Wireless Sensor Network
Symptom
Possible Cause
Solution
First element in
destination array
specified in CWB100
instruction is -3 and all
other elements in the
array are zeroes.
The measurement
names in the datalogger
do not match the names
stored in the CWB100
base station.
This is a rare error
message that should
disappear after the
datalogger has made its
second attempt to
communicate with the
CWB100 base station.
On the second attempt,
the datalogger will send
the CWB100 base its
version of the names
and then the name
signatures from both
devices will match.
Values in CWB100
destination array are
NAN.
CWB100 base station is
polling sensor too
quickly.
Minimum poll rate is 60
seconds per sensor per
hop. Verify that the
scan rate in the
datalogger program for
the scan that includes
the CWB100 instruction
is longer than the
minimum poll rate.
Sensor not powered.
Press Setup button on
back of sensor to check
battery voltage.
Replace batteries if
needed.
Sensor not within radio
range of CWB100 base
station.
Move sensor closer to
CWB100 radio or add
another wireless sensor
in between to serve as a
router.
Another radio is
interfering with wireless
sensor transmissions.
Try to identify and limit
transmissions from
other radio
Incorrect radio
address/extra characters
returned by
CWB100Routes
instruction
The CWSRoutes
variable is not declared
large enough
Increase the size of the
string variable
referenced by the
CWSRoutes parameter
Variable Out of bounds
error reported in Station
Status after a sensor is
discovered and no
values are returned for
that sensor
The sensor name does
not match the name
parameter specified in
the ArrayIndex
Instruction
Change the program or
reconfigure the sensor
so that the names match
This indicates that the
CWB100 base is unable
to get data from wireless
sensor
45
Appendix A. Using DevConfig for CWS
Setup
CWS Sensors can be configured using Device Configuration Utility,
DevConfig, which can be downloaded from www.campbellsci.com/downloads.
DevConfig does not allow custom field names and will not generate a
configuration string, but it can be used to specify the base station radio address,
sensor name, and the measurement configuration for the wireless sensor. It can
also configure a CWS sensor to connect directly to the base station or use
repeaters (see Appendix C.3, RF Connection Type Setting).
Because DevConfig triggers a measurement of the wireless sensor every 5
seconds, it can be used to verify that the sensor is operating as expected. This
is useful when troubleshooting as it provides a quick method for determining
whether an issue with data from a sensor is a measurement problem or a
communication problem.
Steps for configuring sensors with DevConfig:
1.
Launch DevConfig. Specify the serial port number for the A205 interface.
2.
Connect the A205 interface to the 4-pin socket behind the sensor battery
door as described in Section 3.3, Configuring the Devices in the WSN.
3.
From the list of devices on the left side of the window choose the wireless
sensor to be configured (In the example below, the CWS900 is selected).
4.
Click the Connect button and press the Setup button on the back of the
sensor.
A-1
Appendix A. Using DevConfig for CWS Setup
5.
A-2
Once DevConfig connects to the sensor, enter the address of the CWB100
in the field called Base Station Address. If configuring a CWS900, choose
the type of measurement the sensor will make from the drop-down menu
called Measurement Configuration. If desired, change the Sensor Name
from its default value.
Appendix A. Using DevConfig for CWS Setup
6.
Click Apply to apply the changes. A configuration summary will be
displayed. Save the configuration information if desired. Click OK.
7.
If configuring a CWS900 sensor module, you can use DevConfig to ensure
that the sensor is correctly configured and connected to the CWS900. To
test the sensor, connect the sensor to be measured to the CWS900 and
follow the instructions above for establishing communication with
A-3
Appendix A. Using DevConfig for CWS Setup
DevConfig. When the sensor settings are displayed in the Deployment
tab, click on the Settings Editor tab. The field called Measurement will
display the most current measurements from the sensor with updates every
5 seconds.
8.
A-4
When finished, click on Disconnect and repeat the process for the next
sensor or close DevConfig.
Appendix B. Measurement Names and
Meanings
Default measurement names are shown in Wireless Sensor Planner, Network
Planner, and DevConfig software. Custom names may be assigned to the
measurements with Wireless Sensor Planner or Network planner. It is good
practice to keep the measurement names short. The default names, meanings
and measurement units are listed below.
B.1 CWS220 Default Names
Default
Name
Meaning
Units
Tt
Target Temperature
°C
Tb
Sensor Body Temperature
°C
Ti
Internal temperature of wireless sensor
°C
BV
Battery voltage of wireless sensor
Volts
SS
Signal strength of last received radio
transmission
Unitless, ranging from 0
(no signal) to 32 (full
signal)
B.2 CWS655 Default Names
Default
Name
Meaning
Units
VW
Volumetric Water Content
m3 water/m3 soil
EC
Bulk Electrical Conductivity
dS/m
Ka
Dielectric Permittivity
unitless
Ts
Soil Temperature
°C
Pe
Period Average
Psec
AR
Voltage Ratio
unitless
Ti
Internal temperature of wireless sensor
°C
BV
Battery voltage of wireless sensor
Volts
SS
Signal strength of last received radio
transmission
Unitless, ranging from 0
(no signal) to 32 (full
signal)
B-1
Appendix B. Measurement Names and Meanings
B.3 CWS900 Default Names
Default
Name
B-2
Meaning
Units
SE1
Single-ended DC voltage measured
on pin 5 with respect to pin 3
Volts, may need additional
processing to convert to
engineering units
SE2
Single-ended DC voltage measured
on pin 6 with respect to pin 3
Volts, may need additional
processing to convert to
engineering units
SE3
Single-ended DC voltage measured
on pin 1 with respect to pin 3
Volts, may need additional
processing to convert to
engineering units
DF1
Differential DC voltage measured
between pin 5 (high) and pin 6 (low)
Volts, may need additional
processing to convert to
engineering units
TC
Total count of switch closures
measured since sensor configuration
Integer, requires additional
processing to convert to
engineering units
IC
Number of switch closures detected
during polling interval
Integer, requires additional
processing to convert to
engineering units
MF
Maximum frequency of pulses
detected during polling interval
Hz, may need additional
processing to convert to
engineering units
AF
Average frequency of pulses
detected during polling interval
Hz, may need additional
processing to convert to
engineering units
Ts
Temperature of sensor connected to
CWS900
°C
RH
Relative humidity
%
LWS
Leaf wetness sensor voltage
Volts
DO
Voltage returned from CS511
Dissolved Oxygen Sensor
Volts, requires additional
processing to convert to DO
pH
Voltage returned from CS525 ISFET
pH probe
Volts, requires additional
processing to convert to pH
SS
Signal strength of last received radio
transmission
Unitless, ranging from 0 (no
signal) to 32 (full signal)
Appendix B. Measurement Names and Meanings
Default
Name
Meaning
Units
BV
Battery voltage of wireless sensor
Volts
Ti
Internal temperature of wireless
sensor
°C
WSA
Wind speed average during last
polling interval
meters per second
WSMX
Wind speed maximum during last
polling interval. Calculated from a
running average of three successive,
one-second wind speed
measurements
meters per second
WSMN
Wind speed minimum during last
polling interval. Calculated from a
running average of three successive,
one-second wind speed
measurements
meters per second
WSSD
Wind speed standard deviation
during last polling interval.
meters per second
WDA
Wind direction average. Calculated
over the polling interval using the
average of one-second wind
direction measurements, excluding
zero wind speed measurements.
Degrees from north, ranging
from 0° to 355°
WDSD
Wind direction standard deviation.
Calculated over the polling interval
using the average of one-second
wind direction measurements and
the Yamartino algorithm (See B3.1
for details).
Degrees
RWS
Resultant wind speed. Vector mean
horizontal wind speed calculated
over the polling interval using onesecond measurements including
measurements of zero wind speed.
meters per second
RWDA
Resultant wind direction average.
Calculated over the polling interval
using one second wind direction
measurements, excluding zero wind
speed measurements.
Degrees from north, ranging
from 0° to 355°
B-3
Appendix B. Measurement Names and Meanings
Default
Name
RWDSD
Meaning
Units
Resultant wind direction standard
deviation. Vector mean wind
direction standard deviation
calculated over the polling interval
with the CSI wind speed weighted
algorithm (See B3.1 for details).
Degrees
B.3.1 Wind Vector Calculations
When a wind speed sample is 0, the CWS900 uses 0 to process scalar or
resultant vector wind speed and standard deviation, but the sample is not used
in the computation of wind direction.
Measured raw data:
Si = horizontal wind speed
4i = horizontal wind direction
Uei = east-west component of wind
Uni = north-south component of wind
N = number of samples
Calculations:
FIGURE B-1. Input Sample Vectors
In FIGURE B-1, the short, head-to-tail vectors are the input sample vectors
described by si and 4 i , the sample speed and direction, or by Uei and Uni, the
east and north components of the sample vector. At the end of output interval
T, the sum of the sample vectors is described by a vector of magnitude U and
direction 4u. If the input sample interval is t, the number of samples in output
interval T is N T / t . The mean vector magnitude is U U / N .
B-4
Appendix B. Measurement Names and Meanings
Scalar mean horizontal wind speed, S:
S=(6si)/N
where in the case of orthogonal sensors:
Si=(Uei2+Uni2)1/2
Unit vector mean wind direction, 41:
41=Arctan (Ux/Uy)
where
Ux=(6sin 4i)/N
Uy=(6cos 4i)/N
or, in the case of orthogonal sensors
Ux=(6(Uei/Ui))/N
Uy=(6(Uni/Ui))/N
where Ui=(Uei2+Uni2)1/2
Standard deviation of wind direction, V(41), using Yamartino algorithm:
V(41)=arc sin(H)[1+0.1547 H3]
where,
H=[1-((Ux)2+(Uy)2)]1/2
and Ux and Uy are as defined above.
Resultant mean horizontal wind speed,
U:
U =(Ue2+Un2)1/2
FIGURE B-2. Mean Wind Vector
where for polar sensors:
Ue=(6Si Sin 4i)/N
Un=(6Si Cos 4i)/N
or, in the case of orthogonal sensors:
Ue=(6Uei)/N
Un=(6Uni)/N
B-5
Appendix B. Measurement Names and Meanings
Resultant mean wind direction, 4u:
4u=Arctan (Ue/Un)
Standard deviation of wind direction, V(4u), using Campbell Scientific
algorithm:
V(4u)=81(1- U /S)1/2
The algorithm for V(Tu) is developed by noting (FIGURE B-3) that
Cos (4 i ')
U i / si ; where 4 i ' 4i 4u
FIGURE B-3. Standard Deviation of Direction
The Taylor Series for the Cosine function, truncated after 2 terms is:
Cos (4 i ') # 1 (4 i ') 2 / 2
For deviations less than 40 degrees, the error in this approximation is less than
1%. At deviations of 60 degrees, the error is 10%.
The speed sample may be expressed as the deviation about the mean speed,
si
s'i S
Equating the two expressions for Cos (T‘) and using the previous equation for
si ;
1 ( 4i ') 2 / 2 Ui / ( si ' S )
2
Solving for ( 4i ') , one obtains;
( 4i ') 2
2 2U i / S (4i ' ) 2 si '/ S 2si '/S
Summing ( 4i ') over N samples and dividing by N yields the variance of 4u.
Note that the sum of the last term equals 0.
2
B-6
Appendix B. Measurement Names and Meanings
(V ( 4u )) 2
N
¦ (4i ' )2 / N
i 1
¦
N
2(1 U / S ) ¦ (( 4i ' ) 2 si ' ) / NS
i 1
((4 i ') si ') / NS , is 0 if the deviations in speed are not
The term,
correlated with the deviation in direction. This assumption has been verified in
tests on wind data by CSI; the Air Resources Laboratory, NOAA, Idaho Falls,
ID; and MERDI, Butte, MT. In these tests, the maximum differences in
2
V ( 4u) ( ¦ ( 4i ') 2 / N )1/2 and V ( 4u) ( 2(1 U / S )) 1/2
have never been greater than a few degrees.
The final form is arrived at by converting from radians to degrees (57.296
degrees/radian).
V (4u) (2(1 U / S ))1/2
81(1 U / S )1/2
B-7
Appendix C. Battery Life
C.1 Battery Characteristics
The battery life of the CWS wireless sensors is a function of the polling
interval, repeater usage, type of batteries, and temperature. The types of
batteries that can be used in the sensors are AA sized alkaline, Lithium, NiMH,
or NiCd; their capacities and characteristics are:
Battery Type
Manufacturer
Capacity
mWH)
Temperature
Characteristics
Alkaline
Duracell MX1500
3800
-20 °C to +54 °C
Alkaline
Energizer EN91
3800
-18 °C to +55 °C
Lithium
Energizer L91
4000
-40 °C to +60 °C
NiMH
Duracell DX1500
2500
-20 °C to +50 °C
NiMH
Rayovac LD715
2500
-10 °C to +45 °C
The capacities that are listed are for 21° C operation; for all the battery types
(except Lithium), the capacity decreases as the temperature decreases. For
example, the capacity of the Alkaline batteries decreases by 30% when the
temperature is at 0° C. All these batteries can be used below the stated
temperature range (the Duracell Alkaline and NiMH have both been tested to
-30° C), but their capacity is reduced.
For the rechargeable batteries, while all types can be used, by far the best type
to use is the “low self-discharge” NiMH batteries. Both of the NiMH batteries
listed above are of this type. The normal NiMH and NiCd batteries have very
high self-discharge, and would probably only last for a couple of months.
C.2 Effect of Polling Interval and Repeaters on
Battery Life
The largest factor affecting battery life is polling interval, followed by repeater
usage. This is because the radio RX/TX current is the dominant drain on the
batteries. Any sensor that is used as a repeater by another sensor will also have
its battery life decreased, as it has to send its own data as well as data from
sensors repeating through it.
Using the Duracell MX1500 Alkaline batteries, derated by ~20%, gives the
following expected sensor battery life:
C-1
Appendix C. Battery Life
Sensor and
Connection
5 Min Polling
10 Min Polling
15 Min Polling
CWS900 w/109
Probe or CWS655
15 months
21 months
24 months
Same as above,
used as a repeater
for 1 sensor
8 months
12 months
15 months
Same as above,
used as a repeater
for 2 sensors
6 months
8 months
12 months
C.3 RF Connection Type Setting
In the Device Configuration Utility Settings editor, there is a setting called RF
Connection Type. This setting is used to control how the radio does its autodiscovery of a path to the base station. The default setting is Auto Connect,
which is what should be used for most networks. With this setting, a sensor
first tries to find a direct path (one hop) to the base; it does this three times over
15 minutes. It then tries to find a path to the base using a repeater. It also does
this three times.
It can be useful to change this setting from its default in certain instances. For
example, if the wireless sensor network is composed of a large number of
sensors that are all within range of the base, changing it to Connect Direct to
Base will force all the connections to the base. There will be no attempt to use
repeaters. As long as every sensor is within range of the base, this saves
battery power.
To access the RF Connection Type Setting, connect to the CWS sensor as
described in Appendix A, Using DevConfig for CWS Setup, and select the
Settings Editor tab. Find the drop-down menu for RF Connection Type and
choose the option desired.
C-2
Appendix C. Battery Life
In another situation, there may be a sensor in a location that permits a direct
connection to the base, but misses a significant number of data polls.
Changing the sensor’s RF Connection Type setting to Connect Through
Repeater will force it to go through a repeater, and it will not attempt any
direct connection to the base, which may result in fewer missed polls.
When changing the setting to Connect Through Repeater, battery life of the
repeater should be taken into consideration (see Appendix C.2, Effect of
Polling Interval and Repeaters on Battery Life, above).
C.4 Repair of a Lost Connection
A CWS sensor radio will detect if it has lost the connection to the base, and
initiate a new path discovery automatically. The radio sends out a “beacon”
every 90 minutes, and if two of these are missed in succession, the autodiscovery process will begin.
If a CWS sensor has not received any data polls from the datalogger for more
than 13 hours, it will initiate the auto-discovery process
C-3
Campbell Scientific (Canada) Corp. | 14532 131 Avenue NW | Edmonton AB T5L 4X4 | 780.454.2505 | www.campbellsci.ca
AUSTRALIA | BRAZIL | CANADA | COSTA RICA | FRANCE | GERMANY | SOUTH AFRICA | SPAIN | UNITED KINGDOM | USA