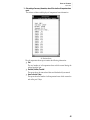
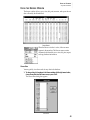
1
WEATHERLINK
®
Software
User’s Guide
For Windows
Version 4.0
Product #7862
™
0
0
This equipment has been tested and found to comply with the limits for a Class B digital
device, pursuant to Part 15 of the FCC Rules. These limits are designed to provide reasonable
protection against harmful interference in a residential installation. This equipment generates, uses and can radiate radio frequency energy and, if not installed and used in accordance
with the instructions, may cause harmful interference to radio communications. However,
there is no guarantee that interference will not occur in a particular installation. If this equipment does cause harmful interference to radio or television reception, which can be determined by turning the equipment on and off, the user is encouraged to try to correct the
interference by one or more of the following measures:
• Reorient or relocate the receiving antenna.
• Increase the separation between the equipment and receiver.
• Connect the equipment into an outlet on a circuit different from that to which the
receiver is connected.
• Consult the dealer or an experienced radio/TV technician for help.
Changes or modifications not expressly approved in writing by Davis Instruments may void
the user's authority to operate this equipment.
Product Number: 7862
Davis Instruments Part Number: 7395-121
®
Weatherlink , Version 4.0 for Windows
Rev. C Manual (July 16, 1999)
© Davis Instruments Corp. 1998. All rights reserved.
This product complies with the essential protection requirements of the
EC EMC Directive 89/336/EC
Weather Monitor II, Weather Wizard III, Weather Wizard II-s, Perception
II, and Weatherlink are registered trademarks of Davis Instruments
Corp. Hayes is a registered trademark of Hayes Microcomputer
Products, Inc. Windows is a trademark of Microsoft Corporation.
WEATHERLINK
®
Software
User’s Guide
For Windows
Version 4.0
0
0
0
TABLE OF CONTENTS
TABLE OF CONTENTS
INTRODUCTION
Contents of Package . . . . . . . . . . . . . . . . . . . . . . . . . . . . . . . . . . . . . . . . . . 1
Optional Accessories . . . . . . . . . . . . . . . . . . . . . . . . . . . . . . . . . . . . . . . . . . 1
HARDWARE INSTALLATION
Hardware Requirements . . . . . . . . . . . . . . . . . . . . . . . . . . . . . . . . . . . . . . .
Direct Connection Hardware Requirements . . . . . . . . . . . . . . . . . . . . . . .
Phone Modem Connection Hardware Requirements . . . . . . . . . . . . . . . .
Direct Connection. . . . . . . . . . . . . . . . . . . . . . . . . . . . . . . . . . . . . . . . . . . . .
Typical Direct Connection . . . . . . . . . . . . . . . . . . . . . . . . . . . . . . . . . . . . .
Direct Connection Installation . . . . . . . . . . . . . . . . . . . . . . . . . . . . . . . . . .
Phone Modem Connection . . . . . . . . . . . . . . . . . . . . . . . . . . . . . . . . . . . . . .
Typical Phone Modem Installation . . . . . . . . . . . . . . . . . . . . . . . . . . . . . .
Phone Modem Installation Instructions. . . . . . . . . . . . . . . . . . . . . . . . . . .
A Few Notes About Phone Modem Connections . . . . . . . . . . . . . . . . . . . .
3
3
3
4
4
5
6
6
6
8
SOFTWARE INSTALLATION AND SETUP
Installing the Software . . . . . . . . . . . . . . . . . . . . . . . . . . . . . . . . . . . . . . . . 9
Running the Software . . . . . . . . . . . . . . . . . . . . . . . . . . . . . . . . . . . . . . . . . 9
Adding a Station . . . . . . . . . . . . . . . . . . . . . . . . . . . . . . . . . . . . . . . . . . . . . 9
Adding a Station . . . . . . . . . . . . . . . . . . . . . . . . . . . . . . . . . . . . . . . . . . . . 9
About the Walkthrough . . . . . . . . . . . . . . . . . . . . . . . . . . . . . . . . . . . . . . 10
Finding the Correct Serial Port. . . . . . . . . . . . . . . . . . . . . . . . . . . . . . . . . . 12
USING THE SOFTWARE
Weather Station Models. . . . . . . . . . . . . . . . . . . . . . . . . . . . . . . . . . . . . . .
Multiple Stations . . . . . . . . . . . . . . . . . . . . . . . . . . . . . . . . . . . . . . . . . . . .
The Toolbar . . . . . . . . . . . . . . . . . . . . . . . . . . . . . . . . . . . . . . . . . . . . . . . .
File Menu . . . . . . . . . . . . . . . . . . . . . . . . . . . . . . . . . . . . . . . . . . . . . . . . . .
New Station . . . . . . . . . . . . . . . . . . . . . . . . . . . . . . . . . . . . . . . . . . . . . .
Open Station . . . . . . . . . . . . . . . . . . . . . . . . . . . . . . . . . . . . . . . . . . . . . .
Delete Station . . . . . . . . . . . . . . . . . . . . . . . . . . . . . . . . . . . . . . . . . . . . .
Download . . . . . . . . . . . . . . . . . . . . . . . . . . . . . . . . . . . . . . . . . . . . . . . .
View Log . . . . . . . . . . . . . . . . . . . . . . . . . . . . . . . . . . . . . . . . . . . . . . . . .
Print . . . . . . . . . . . . . . . . . . . . . . . . . . . . . . . . . . . . . . . . . . . . . . . . . . . .
Close . . . . . . . . . . . . . . . . . . . . . . . . . . . . . . . . . . . . . . . . . . . . . . . . . . . .
Hang Up . . . . . . . . . . . . . . . . . . . . . . . . . . . . . . . . . . . . . . . . . . . . . . . . .
Exit . . . . . . . . . . . . . . . . . . . . . . . . . . . . . . . . . . . . . . . . . . . . . . . . . . . . .
13
13
14
14
15
15
16
16
17
18
18
18
18
i
TABLE OF CONTENTS
Setup Menu . . . . . . . . . . . . . . . . . . . . . . . . . . . . . . . . . . . . . . . . . . . . . . . .
Walkthrough . . . . . . . . . . . . . . . . . . . . . . . . . . . . . . . . . . . . . . . . . . . . . .
Station Config . . . . . . . . . . . . . . . . . . . . . . . . . . . . . . . . . . . . . . . . . . . . .
Serial Port . . . . . . . . . . . . . . . . . . . . . . . . . . . . . . . . . . . . . . . . . . . . . . . .
Select Units . . . . . . . . . . . . . . . . . . . . . . . . . . . . . . . . . . . . . . . . . . . . . . .
Set Time . . . . . . . . . . . . . . . . . . . . . . . . . . . . . . . . . . . . . . . . . . . . . . . . .
Set Archive Interval . . . . . . . . . . . . . . . . . . . . . . . . . . . . . . . . . . . . . . . . .
Set Barometer . . . . . . . . . . . . . . . . . . . . . . . . . . . . . . . . . . . . . . . . . . . . .
Set Rain Cal. . . . . . . . . . . . . . . . . . . . . . . . . . . . . . . . . . . . . . . . . . . . . . .
Set Temp Cal . . . . . . . . . . . . . . . . . . . . . . . . . . . . . . . . . . . . . . . . . . . . . .
Set Hum Cal. . . . . . . . . . . . . . . . . . . . . . . . . . . . . . . . . . . . . . . . . . . . . . .
Set Total Rain . . . . . . . . . . . . . . . . . . . . . . . . . . . . . . . . . . . . . . . . . . . . .
Set Alarms. . . . . . . . . . . . . . . . . . . . . . . . . . . . . . . . . . . . . . . . . . . . . . . .
Clear . . . . . . . . . . . . . . . . . . . . . . . . . . . . . . . . . . . . . . . . . . . . . . . . . . . .
Auto Clear . . . . . . . . . . . . . . . . . . . . . . . . . . . . . . . . . . . . . . . . . . . . . . . .
Auto Download . . . . . . . . . . . . . . . . . . . . . . . . . . . . . . . . . . . . . . . . . . . .
Auto Fax . . . . . . . . . . . . . . . . . . . . . . . . . . . . . . . . . . . . . . . . . . . . . . . . .
Reports Menu. . . . . . . . . . . . . . . . . . . . . . . . . . . . . . . . . . . . . . . . . . . . . . .
Printing Reports . . . . . . . . . . . . . . . . . . . . . . . . . . . . . . . . . . . . . . . . . . .
NOAA Setup . . . . . . . . . . . . . . . . . . . . . . . . . . . . . . . . . . . . . . . . . . . . . . .
NOAA This Month . . . . . . . . . . . . . . . . . . . . . . . . . . . . . . . . . . . . . . . . . .
NOAA Summarize Month . . . . . . . . . . . . . . . . . . . . . . . . . . . . . . . . . . . . .
NOAA This Year . . . . . . . . . . . . . . . . . . . . . . . . . . . . . . . . . . . . . . . . . . . .
NOAA Summarize Year . . . . . . . . . . . . . . . . . . . . . . . . . . . . . . . . . . . . . .
Yearly Rainfall . . . . . . . . . . . . . . . . . . . . . . . . . . . . . . . . . . . . . . . . . . . . .
Degree-Days . . . . . . . . . . . . . . . . . . . . . . . . . . . . . . . . . . . . . . . . . . . . . .
Temp/Hum Hours . . . . . . . . . . . . . . . . . . . . . . . . . . . . . . . . . . . . . . . . . .
Soil Temp. Hours . . . . . . . . . . . . . . . . . . . . . . . . . . . . . . . . . . . . . . . . . . .
Chilling Requirement. . . . . . . . . . . . . . . . . . . . . . . . . . . . . . . . . . . . . . . .
Sunrise & Sunset. . . . . . . . . . . . . . . . . . . . . . . . . . . . . . . . . . . . . . . . . . .
Windows Menu . . . . . . . . . . . . . . . . . . . . . . . . . . . . . . . . . . . . . . . . . . . . .
Bulletin . . . . . . . . . . . . . . . . . . . . . . . . . . . . . . . . . . . . . . . . . . . . . . . . . .
Browse . . . . . . . . . . . . . . . . . . . . . . . . . . . . . . . . . . . . . . . . . . . . . . . . . .
Plot . . . . . . . . . . . . . . . . . . . . . . . . . . . . . . . . . . . . . . . . . . . . . . . . . . . . .
Strip Charts . . . . . . . . . . . . . . . . . . . . . . . . . . . . . . . . . . . . . . . . . . . . . . .
Summary. . . . . . . . . . . . . . . . . . . . . . . . . . . . . . . . . . . . . . . . . . . . . . . . .
Using the Browse Window . . . . . . . . . . . . . . . . . . . . . . . . . . . . . . . . . . . . .
Choose Date . . . . . . . . . . . . . . . . . . . . . . . . . . . . . . . . . . . . . . . . . . . . . .
Make a Note . . . . . . . . . . . . . . . . . . . . . . . . . . . . . . . . . . . . . . . . . . . . . .
Edit a Record . . . . . . . . . . . . . . . . . . . . . . . . . . . . . . . . . . . . . . . . . . . . . .
Delete a Record. . . . . . . . . . . . . . . . . . . . . . . . . . . . . . . . . . . . . . . . . . . .
Copy Records . . . . . . . . . . . . . . . . . . . . . . . . . . . . . . . . . . . . . . . . . . . . .
Export Records . . . . . . . . . . . . . . . . . . . . . . . . . . . . . . . . . . . . . . . . . . . .
Delete Records . . . . . . . . . . . . . . . . . . . . . . . . . . . . . . . . . . . . . . . . . . . .
ii
18
18
19
20
22
23
24
24
25
25
26
27
28
28
30
31
32
34
34
34
35
36
39
39
44
45
46
48
50
51
53
54
55
56
56
58
59
59
60
61
62
62
63
64
TABLE OF CONTENTS
Using the Plot Window . . . . . . . . . . . . . . . . . . . . . . . . . . . . . . . . . . . . . . . .
Adding and Removing Variables . . . . . . . . . . . . . . . . . . . . . . . . . . . . . . .
Choose Specific Date . . . . . . . . . . . . . . . . . . . . . . . . . . . . . . . . . . . . . . .
Scroll Through Dates. . . . . . . . . . . . . . . . . . . . . . . . . . . . . . . . . . . . . . . .
Choose Plot Span . . . . . . . . . . . . . . . . . . . . . . . . . . . . . . . . . . . . . . . . . .
Enter Plot Title. . . . . . . . . . . . . . . . . . . . . . . . . . . . . . . . . . . . . . . . . . . . .
Choose Axis Information . . . . . . . . . . . . . . . . . . . . . . . . . . . . . . . . . . . . .
Choose Line/Bar . . . . . . . . . . . . . . . . . . . . . . . . . . . . . . . . . . . . . . . . . . .
Set Axis Min/Max . . . . . . . . . . . . . . . . . . . . . . . . . . . . . . . . . . . . . . . . . .
Lock Axis. . . . . . . . . . . . . . . . . . . . . . . . . . . . . . . . . . . . . . . . . . . . . . . . .
Pause Plot Calculation . . . . . . . . . . . . . . . . . . . . . . . . . . . . . . . . . . . . . .
View Database Information . . . . . . . . . . . . . . . . . . . . . . . . . . . . . . . . . . .
View Details . . . . . . . . . . . . . . . . . . . . . . . . . . . . . . . . . . . . . . . . . . . . . .
Zoom In/Out . . . . . . . . . . . . . . . . . . . . . . . . . . . . . . . . . . . . . . . . . . . . . .
Plotting Data From More than One Date (Overlay) . . . . . . . . . . . . . . . . .
Plotting Data from the Previous Year (Last Year) . . . . . . . . . . . . . . . . . .
Clear Entire Plot . . . . . . . . . . . . . . . . . . . . . . . . . . . . . . . . . . . . . . . . . . .
Saving and Opening Plots and Plot Templates . . . . . . . . . . . . . . . . . . . .
Plot Menu . . . . . . . . . . . . . . . . . . . . . . . . . . . . . . . . . . . . . . . . . . . . . . . .
Colors Menu . . . . . . . . . . . . . . . . . . . . . . . . . . . . . . . . . . . . . . . . . . . . . .
Using the Strip Charts . . . . . . . . . . . . . . . . . . . . . . . . . . . . . . . . . . . . . . . .
Open Strip Chart Window . . . . . . . . . . . . . . . . . . . . . . . . . . . . . . . . . . . .
Add Variable . . . . . . . . . . . . . . . . . . . . . . . . . . . . . . . . . . . . . . . . . . . . . .
Remove Variable . . . . . . . . . . . . . . . . . . . . . . . . . . . . . . . . . . . . . . . . . . .
Change Axis Information . . . . . . . . . . . . . . . . . . . . . . . . . . . . . . . . . . . . .
Change Plot Span . . . . . . . . . . . . . . . . . . . . . . . . . . . . . . . . . . . . . . . . . .
View Historical Data . . . . . . . . . . . . . . . . . . . . . . . . . . . . . . . . . . . . . . . .
Place the Strip Chart Into Auto Update Mode . . . . . . . . . . . . . . . . . . . . .
View Database Information . . . . . . . . . . . . . . . . . . . . . . . . . . . . . . . . . . .
View Details . . . . . . . . . . . . . . . . . . . . . . . . . . . . . . . . . . . . . . . . . . . . . .
Saving a Strip Chart Template . . . . . . . . . . . . . . . . . . . . . . . . . . . . . . . .
Opening a Previously Saved Strip Chart Template . . . . . . . . . . . . . . . . .
Strip Chart Menu. . . . . . . . . . . . . . . . . . . . . . . . . . . . . . . . . . . . . . . . . . .
Colors Menu . . . . . . . . . . . . . . . . . . . . . . . . . . . . . . . . . . . . . . . . . . . . . .
Using the Yearly Rainfall Database . . . . . . . . . . . . . . . . . . . . . . . . . . . . . .
Viewing the Yearly Rainfall Database . . . . . . . . . . . . . . . . . . . . . . . . . . .
Editing Yearly Rainfall Data. . . . . . . . . . . . . . . . . . . . . . . . . . . . . . . . . . .
Deleting Data . . . . . . . . . . . . . . . . . . . . . . . . . . . . . . . . . . . . . . . . . . . . .
Start a New Rainfall Database . . . . . . . . . . . . . . . . . . . . . . . . . . . . . . . .
Degree-Days. . . . . . . . . . . . . . . . . . . . . . . . . . . . . . . . . . . . . . . . . . . . . . . .
Adding a Degree-Day Total . . . . . . . . . . . . . . . . . . . . . . . . . . . . . . . . . . .
Opening a Degree-Days Total . . . . . . . . . . . . . . . . . . . . . . . . . . . . . . . . .
Deleting a Degree-Day Total . . . . . . . . . . . . . . . . . . . . . . . . . . . . . . . . . .
PC Degree-Day Report . . . . . . . . . . . . . . . . . . . . . . . . . . . . . . . . . . . . . .
65
66
66
67
67
68
68
68
69
69
69
69
70
70
71
72
72
72
73
75
76
77
77
77
77
77
78
78
78
78
78
79
79
80
80
81
82
83
84
84
85
88
89
89
iii
TABLE OF CONTENTS
TECHNICAL REFERENCE
Archive Memory vs. Database . . . . . . . . . . . . . . . . . . . . . . . . . . . . . . . . . . 91
Archive Memory . . . . . . . . . . . . . . . . . . . . . . . . . . . . . . . . . . . . . . . . . . . 91
Database . . . . . . . . . . . . . . . . . . . . . . . . . . . . . . . . . . . . . . . . . . . . . . . . . 91
Automatic Download . . . . . . . . . . . . . . . . . . . . . . . . . . . . . . . . . . . . . . . . . 92
Automatic Clear . . . . . . . . . . . . . . . . . . . . . . . . . . . . . . . . . . . . . . . . . . . . . 92
Calibration Numbers . . . . . . . . . . . . . . . . . . . . . . . . . . . . . . . . . . . . . . . . . 93
Database Organization. . . . . . . . . . . . . . . . . . . . . . . . . . . . . . . . . . . . . . . . 93
Station Directory . . . . . . . . . . . . . . . . . . . . . . . . . . . . . . . . . . . . . . . . . . . 93
Station Configuration File . . . . . . . . . . . . . . . . . . . . . . . . . . . . . . . . . . . . 94
Database Files. . . . . . . . . . . . . . . . . . . . . . . . . . . . . . . . . . . . . . . . . . . . . 94
Weather Data Calculations. . . . . . . . . . . . . . . . . . . . . . . . . . . . . . . . . . . . . 95
Temperature . . . . . . . . . . . . . . . . . . . . . . . . . . . . . . . . . . . . . . . . . . . . . . 95
High and Low Temperature . . . . . . . . . . . . . . . . . . . . . . . . . . . . . . . . . . . 95
Barometric Pressure . . . . . . . . . . . . . . . . . . . . . . . . . . . . . . . . . . . . . . . . 95
Wind Speed . . . . . . . . . . . . . . . . . . . . . . . . . . . . . . . . . . . . . . . . . . . . . . . 95
High Wind Speed . . . . . . . . . . . . . . . . . . . . . . . . . . . . . . . . . . . . . . . . . . . 95
Wind Direction. . . . . . . . . . . . . . . . . . . . . . . . . . . . . . . . . . . . . . . . . . . . . 95
Temperature/Humidity Index. . . . . . . . . . . . . . . . . . . . . . . . . . . . . . . . . . 96
Wind Chill . . . . . . . . . . . . . . . . . . . . . . . . . . . . . . . . . . . . . . . . . . . . . . . . 96
Dew Point . . . . . . . . . . . . . . . . . . . . . . . . . . . . . . . . . . . . . . . . . . . . . . . . 96
Rainfall . . . . . . . . . . . . . . . . . . . . . . . . . . . . . . . . . . . . . . . . . . . . . . . . . . 97
Degree-Days . . . . . . . . . . . . . . . . . . . . . . . . . . . . . . . . . . . . . . . . . . . . . . 97
Chilling Requirement. . . . . . . . . . . . . . . . . . . . . . . . . . . . . . . . . . . . . . . . 97
Soil Temperature Hours . . . . . . . . . . . . . . . . . . . . . . . . . . . . . . . . . . . . . 98
Temperature/Humidity Hours . . . . . . . . . . . . . . . . . . . . . . . . . . . . . . . . . 98
Air Density . . . . . . . . . . . . . . . . . . . . . . . . . . . . . . . . . . . . . . . . . . . . . . . . 98
Equilibrium Moisture Content (EMC) . . . . . . . . . . . . . . . . . . . . . . . . . . . . 98
Bad Data . . . . . . . . . . . . . . . . . . . . . . . . . . . . . . . . . . . . . . . . . . . . . . . . . 98
Modem String . . . . . . . . . . . . . . . . . . . . . . . . . . . . . . . . . . . . . . . . . . . . . . 99
Station Modem Initialization String . . . . . . . . . . . . . . . . . . . . . . . . . . . . . 99
Auto Fax Modem Initialization String . . . . . . . . . . . . . . . . . . . . . . . . . . . 99
Command Line Options . . . . . . . . . . . . . . . . . . . . . . . . . . . . . . . . . . . . . . 100
Importing WeatherLink Data into Other Programs . . . . . . . . . . . . . . . . . . 101
Leap Year Correction . . . . . . . . . . . . . . . . . . . . . . . . . . . . . . . . . . . . . . . . 101
Computer Keeps Track of Leap Years . . . . . . . . . . . . . . . . . . . . . . . . . . 101
Computer Does Not Keep Track of Leap Years . . . . . . . . . . . . . . . . . . . 102
Backing Up and Restoring Data . . . . . . . . . . . . . . . . . . . . . . . . . . . . . . . . 102
Comprehensive Backup. . . . . . . . . . . . . . . . . . . . . . . . . . . . . . . . . . . . . 102
Individual Month Backup. . . . . . . . . . . . . . . . . . . . . . . . . . . . . . . . . . . . 102
Restoring Data. . . . . . . . . . . . . . . . . . . . . . . . . . . . . . . . . . . . . . . . . . . . 102
iv
TABLE OF CONTENTS
TROUBLESHOOTING GUIDE
Communications Problems . . . . . . . . . . . . . . . . . . . . . . . . . . . . . . . . . . .
Program Problems . . . . . . . . . . . . . . . . . . . . . . . . . . . . . . . . . . . . . . . . . .
AutoFax Troubleshooting . . . . . . . . . . . . . . . . . . . . . . . . . . . . . . . . . . . . .
Changing Windows Communications Driver . . . . . . . . . . . . . . . . . . . . .
103
103
105
106
v
TABLE OF CONTENTS
vi
1 INTRODUCTION
Welcome to Davis Instruments’ WeatherLink Software! The WeatherLink Data
Logger (referred to as the WeatherLink in this manual) and software allows you to
connect your personal computer to Davis weather stations to store, view, plot,
analyze, export, and print weather data collected by your Davis station.
CONTENTS OF PACKAGE
Before proceeding, please check to make sure your WeatherLink package contains
the following:
▲ WeatherLink Data Logger
Includes 8’ (2.4 m) cable to connect the WeatherLink to your computer and a
3" (8 mm) cable to connect the WeatherLink to the weather station.
▲ PC COM Port Adapters (9-pin and 25-pin)
Use the 9-pin adapter to connect the WeatherLink to a 9-pin serial port. Use
the 25-pin adapter to connect the WeatherLink to a 25-pin serial port.
▲ Loopback connector
The loopback connector is a short piece of cable with a phone plug at one end
and a red plastic cap at the other. The loopback connector can be used to determine what serial ports are available for the WeatherLink and for troubleshooting communications problems.
▲ WeatherLink Software Diskette
OPTIONAL ACCESSORIES
The following optional accessories, designed for use with the WeatherLink, are
available from your dealer or may be ordered directly from Davis.
▲ Telephone Modem Adapter
For transmission of data from the WeatherLink using a modem.
▲ Standard 4-Conductor Extension Cable
For more flexibility in the placement of your console. You may add one 40’
(12 m) extension cable to extend the cable run from WeatherLink to computer
up to 48’ (14.4 m).
▲ Link Isolator Kit
Provides upgraded protection against electrical disturbances. Installed
between the WeatherLink and your computer, optical coupling of signals prevent lockups of the weather station console and possible damage to the console, WeatherLink, and PC. Recommended when the station console and
computer are not grounded or are connected to two different grounds.
Includes 40’ (12 m) cable.
1
INTRODUCTION
Optional Accessories
2
2 HARDWARE INSTALLATION
There are two basic types of installations: direct connection and phone modem
connection. Direct connection involves connecting the computer directly to the
WeatherLink. Phone modem connection refers specifically to any installation
where the WeatherLink is connected to a modem and you communicate with the
WeatherLink via a modem at your computer. Requirements and installation for
each type of connection differ, and are explained separately below.
HARDWARE REQUIREMENTS
The required hardware differs depending on whether you are attempting to make
a direct connection or a phone modem connection.
Direct Connection Hardware Requirements
In addition to the provided hardware, the following are required for a direct connection.
▲ Computer running Windows™ 3.1, 95, or NT 4.0 with at least 5 MB of free disk
space
The amount of space necessary for the data files depends on the archive interval. Database files containing data stored at a 30 minute archive interval
require approximately 36K of disk space per month of data. The file size
changes in a linear fashion depending on the archive interval. For example,
data stored at a 1 minute interval requires approximately 1 MB/month while
the data stored at a 2 hour interval requires approximately 9K/month.
▲ 4MB RAM
▲ Windows-Compatible Display
VGA (16 Colors) minimum. SVGA (256 Colors) recommended.
▲ One Free Serial Port
▲ Fax Modem
A fax modem is required to take advantage of the software’s AutoFax feature
(see ”Auto Fax” on page 32). If you do not plan to use the AutoFax feature, a
fax modem is not required for a direct connection.
Phone Modem Connection Hardware Requirements
In addition to the provided hardware, the following hardware is required for a
phone modem connection.
▲ Computer running Windows™ 3.1, 95, or NT 4.0 with at least 5 MB of free disk
space
See “Direct Connection Hardware Requirements” above for hard disk space
requirements.
▲ 4MB RAM
3
HARDWARE INSTALLATION
Direct Connection
▲ Windows-Compatible Display
VGA (16 Colors) minimum. SVGA (256 Colors) recommended.
▲ One Free Serial Port
▲ One external modem to connect to the WeatherLink
The modem must be Hayes® compatible and run at either 1200 or 2400 baud.
▲ One internal fax modem or external fax modem connected to your computer
The modem must be Hayes compatible and run at either 1200 or 2400 baud. A
fax modem is required to take advantage of the software’s AutoFax feature
(see ”Auto Fax” on page 32). If you do not plan to use the AutoFax feature, a
non-fax modem is acceptable.
▲ Telephone Modem Adapter
The Telephone Modem Adapter (#7870) provides the connection between the
WeatherLink and the modem.
DIRECT CONNECTION
The instructions below explain how to make a typical direct connection. Also
included is an illustration showing how to make a direct connection using the
Short-Range Modem Pair (consult the Short-Range Modem Pair manual for
installation instructions). If using the Link Isolator Kit, consult the Link Isolator
Kit manual for installation instructions.
Typical Direct Connection
The instructions below explain how to make a typical direct connection. Note that
you may only use a single 40' (12 m) extension cable. If you extend the cable run
beyond 48' (14.4 m), the software may have difficulty communicating with the
station.
TYPICAL DIRECT CONNECTION
4
HARDWARE INSTALLATION
Direct Connection
Direct Connection Installation
1. Make a note of your station’s current barometric pressure, total rainfall, and (if applicable) calibration numbers.
You must remove power from the station console to install the WeatherLink,
which will cause these values to be erased. Use the WeatherLink software to
reenter these values after restoring power to the station.
2. Remove the mounting base from the console and remove all power by removing the
AC-power adapter and battery backup.
Failure to remove power to the console before installing the WeatherLink may
cause damage to the WeatherLink or console.
3. Insert the cable plug at the end of the short cable coming from the WeatherLink into
the jack marked WEATHERLINK on the bottom of the console.
CAUTION: Make sure that whenever you connect or disconnect the WeatherLink from the console that the console is NOT powered up. Plugging or unplugging the WeatherLink
while power is applied can damage or lock up the WeatherLink.
4. Restore power to the weather station by reattaching the power adapter and battery.
The weather station should beep three times. The third beep, which should
occur within 30 seconds, indicates that the WeatherLink is operating correctly.
5. Place the WeatherLink inside the mounting base and reattach the mounting base.
As you do so, guide the cables through the slots in the mounting base.
PLACE WEATHERLINK INSIDE BASE.
6. Locate a free serial port on the back of your computer and connect the appropriate
adapter (DB9 or DB25) to that serial port.
7. Insert the cable plug at the end of the long cable coming from the WeatherLink into
either the DB9 or DB25 adapter.
The cable which connects the WeatherLink to the computer is 8 feet (2.4 m)
long. If you need to mount the station console more than 8 feet from the computer, use a 40’ (12 m) standard 4-conductor extension cable. Do not attempt
to use more than 40’ of extension cable, or the WeatherLink may have difficulty “communicating” with the computer. If you need to mount the station
console farther away, you will need to use the Short-Range Modem Pair.
5
HARDWARE INSTALLATION
Phone Modem Connection
PHONE MODEM CONNECTION
The instructions below explain how to make a typical phone modem connection.
Typical Phone Modem Installation
The illustration below shows a typical phone modem connection. This involves
connecting the WeatherLink to the weather station and to a modem at the station
console site and connecting your computer’s modem to a phone line, which will
allow you to “dial” the weather station.
TYPICAL PHONE MODEM INSTALLATION
Phone Modem Installation Instructions
1. Install and set up an internal or external modem (according to the instructions supplied
by the manufacturer) for use with your computer.
Make a note of the COM port and IRQ used by the modem. You will need this
information when entering serial port settings for the station (see “Serial Port”
on page 20).
2. At the station console site, position the external modem in a location where it can connect to both the WeatherLink and a phone jack and plug it into the phone jack. DO NOT
TURN THE MODEM ON AT THIS TIME.
The cable which connects the WeatherLink to the modem is 8 feet (2.4 m) long.
If you need to mount the station console more than 8 feet from the modem,
use a 40’ (12 m) standard 4-conductor extension cable. Do not attempt to use
more than 40’ of extension cable, or the WeatherLink may have difficulty
“communicating” with the modem. If you need to mount the station console
farther away, you will need to use the Short-Range Modem Pair.
3. Plug the external modem into the phone jack.
6
HARDWARE INSTALLATION
Phone Modem Connection
4. Make a note of your station’s current barometric pressure, total rainfall, and (if applicable) calibration numbers.
You must remove power from the station console to install the WeatherLink,
which will cause these values to be erased. Use the WeatherLink software to
reenter these values after restoring power to the station.
5. Remove the mounting base from the console and remove all power by removing the
AC-power adapter and battery backup.
Failure to remove power to the console before installing the WeatherLink may
cause damage to the WeatherLink or console.
6. Insert the cable plug at the end of the short cable coming from the WeatherLink into
the jack marked WEATHERLINK on the bottom of the console.
7. Connect the Telephone Modem Adapter to the external modem.
Do not attempt to use the DB25 adapter and a gender changer to attach the
WeatherLink to a modem because it will not work.
8. Insert the cable plug at the end of the long cable coming from the WeatherLink into the
Telephone Modem Adapter.
9. Turn the modem on.
The modem must be on before you restore power to the station console.
10. Restore power to the weather station by reattaching the power adapter and battery.
The weather station should beep three times. The third beep, which should
occur within 30 seconds, indicates that the WeatherLink is operating correctly.
11. Place the WeatherLink inside the mounting base and reattach the mounting base.
As you do so, guide the cables through the slots in the mounting base.
PLACE WEATHERLINK INSIDE BASE.
7
HARDWARE INSTALLATION
Phone Modem Connection
A Few Notes About Phone Modem Connections
If you indicate a phone modem connection when setting up your station (see
“Serial Port” on page 20), the software automatically dials the station whenever
you attempt to initiate a program action which requires the software to “talk” to
the WeatherLink.
While connected to a phone modem station, an “On-Line” icon appears in the
toolbar. This icon indicates that you are on-line and may be used to hang up a
remote connection. To hang up, choose the On-Line icon from the toolbar or
choose Hang Up from the File menu.
TOOLBAR WITH ON-LINE ICON
Once connected, the software will remain on-line until you choose to hang up.
The software remains on line whether or not you are doing something which
requires it to be connected.
Note: If you are on-line at the time of a schedule automatic download, the automatic download is
cancelled.
8
3 SOFTWARE INSTALLATION AND SETUP
This chapter covers software installation and setup.
INSTALLING THE SOFTWARE
1. Place the Install Disk in your disk drive.
2. Choose Run from the File menu, type A:SETUP (or B:SETUP), and choose OK to begin the
installation.
3. Follow the on-screen prompts to complete the installation.
RUNNING THE SOFTWARE
To run the software, double-click on the WeatherLink 4 icon. If you have no stations in the program directory when you run the software, the software will
prompt you to add a station (see “Adding a Station” below for details). If you
have more than one station in the program directory when you run the software,
the software will prompt you to indicate which station you’d like to open.
ADDING A STATION
In order to interact with your station, you must add a station, which entails naming
the station, configuring the software to work with that station and with your computer hardware, and setting station values such as time, barometric pressure, total
rainfall, and calibration numbers. For performance reasons, the software reads
these values from the station configuration file (see ”Station Configuration File” on
page 94 for more information) rather than from the station itself. Therefore, you
must set station values from the software. If you set station values from the station’s console, the readings you see in the bulletin, database, strip charts, reports,
and plots may not agree with your station’s readings.
Adding a Station
1. Choose New Station from the File menu.
The software opens the Add New Station dialog box.
NEW STATION
9
SOFTWARE INSTALLATION AND SETUP
Adding a Station
2. Type the station name into the text box.
The station name may be up to 40 characters/spaces long. Note that the software uses the first eight characters of the station name (not counting spaces or
punctuation marks) as the name of the directory into which it saves this station’s database and configuration files. The first eight characters of each station name must, therefore, be unique. The software also uses the first three
characters as the file extension for that station’s database files (the first three
characters need not be unique).
3. Choose OK.
The software saves the station, creates a directory and subdirectories for that
station, and prompts you to indicate whether you want to enter the walkthrough procedure.
START WALKTHROUGH CONFIRMATION
About the Walkthrough
The software includes a station setup walkthrough which steps you through the
station configuration procedure. After adding a new station, the software automatically prompts you to indicate whether or not you want to be walked through
the configuration procedure. You may, of course, choose No and set up the station
by choosing all of the necessary commands from the menus. A Walkthrough command is included in the Setup menu which allows you to go through the walkthrough procedure at any time.
Note: Where necessary, the software will automatically dial a phone modem station. See “A Few
Notes About Phone Modem Connections” on page 8 for instructions on dialing and hanging
up.
If you choose Yes to begin the walkthrough, the software takes you through the
following dialog boxes:
▲ Station Configuration (see ”Station Config” on page 19)
Set station name, model, accessories, download options, and data file extension.
▲ Choose Units (see ”Select Units” on page 22)
Select units of measure in which station information is displayed.
▲ Serial Port Settings (see ”Serial Port” on page 20)
Set COM port to which WeatherLink is connected. Specify modem connection
settings such as baud rate, phone number, and modem initialization string.
▲ Set Barometer (see ”Set Barometer” on page 24)
Set barometric pressure on station and software. You must enter this information from the software if you want your station and software readings to
agree.
10
SOFTWARE INSTALLATION AND SETUP
Adding a Station
▲ Set Rain Cal (see ”Set Rain Cal” on page 25)
Set station’s rainfall calibration number.
▲ Enter Total Rainfall (see ”Set Total Rain” on page 27)
Set total rainfall amount on station and software. You must enter this information from the software if you want you station and software readings to agree.
▲ Set Time and Date (see ”Set Time” on page 23)
Set the time and date on the station, software, and computer to make sure all
three are synchronized.
Note: When you set the time and date, you will be prompted to clear your archive memory (see
”Archive Memory” on page 91 for information on the archive memory). If you do not clear
archive memory, you may end up with data stored at an incorrect time or duplicate
records. We recommend that you download before setting the time (unless you are creating a brand new station) so you may safely clear the archive memory.
▲ Set Archive Interval (see ”Set Archive Interval” on page 24)
Select the interval at which you want data stored to the WeatherLink’s archive
memory (see ”Archive Memory” on page 91).
▲ Set Station Alarms (see ”Set Alarms” on page 28)
Set alarm thresholds on the station.
▲ Set Auto Clear (see ”Auto Clear” on page 30)
Specify the high/low registers and rainfall registers you want cleared at the
same time each day and the time at which you want them cleared.
▲ Set Auto Download Time(s) (see ”Auto Download” on page 31)
Specify the stations and the times at which you want data automatically
downloaded each day.
At each step in the walkthrough procedure, the software will provide confirmation boxes prompting you to indicate whether or not you wish to continue.
WALKTHROUGH CONFIRMATION
To continue, choose OK. To skip this step and move to the next step, choose Skip.
To cancel the entire walkthrough procedure, choose Cancel.
11
SOFTWARE INSTALLATION AND SETUP
Finding the Correct Serial Port
FINDING THE CORRECT SERIAL PORT
The software contains a procedure for locating the serial port to which your station is connected or determining whether that serial port is working. Using the
Loopback command (as opposed to Test) will help you determine whether a communication problem is being caused by the serial port or by the WeatherLink.
Note: This procedure will only work for direct connections. If you are making a phone modem connection, you may want to simply check the communications software you normally use for the
correct serial port setting. Otherwise, you must consult the documentation supplied with your
modem.
In order to use this procedure, you will need the loopback connector (the short
cable with a phone jack on one end and a red plastic tip on the other) supplied
with your Weatherlink software package.
1. If necessary, disconnect the 40-foot WeatherLink cable from the DB9 or DB25 adapter
which is connected to the COM port.
2. Insert the loopback connector into the DB9 or DB25 adapter.
3. Choose Serial Port from the Setup menu.
The software opens the Serial Port dialog box.
SERIAL PORT
4. Choose Loopback.
The software will search all standard serial ports and inform you of the COM
port at which the loopback connector is located.
LOOPBACK CONNECTOR FOUND
The software automatically selects the correct COM port for you in the Serial Port
dialog box. If it cannot find the loopback connector at any COM port, your serial
port is not working. Consult your computer documentation for help.
12
4 USING THE SOFTWARE
Everything you need to know about running the software (once it is correctly
installed and set up) is explained in this chapter.
WEATHER STATION MODELS
Depending on which station model (Weather Monitor II®, Weather Wizard III®,
etc.) you are using and which optional sensors (Rain Collector or External Temperature/Humidity Sensor) you have connected to your station, certain information and options explained in this manual may not be available. The software may
only display and plot data for which your weather station has a sensor. For example, if you have a Weather Wizard III, you may not plot, view, or print barometric
pressure information.
MULTIPLE STATIONS
The software can support the use of any number of weather stations with a single
version of the program. Each station must connect to its own WeatherLink, however. If you have set up more than one station, whenever you load the software
you will be prompted to open a station.
OPEN STATION DIALOG BOX
All program actions affect the open station. To open a different station, choose
Open Station from the File menu (see “Open Station” on page 15).
13
USING THE SOFTWARE
The Toolbar
THE TOOLBAR
The toolbar contains icons which activate program commands. The illustration
below shows what commands are activated by the individual toolbar icons. Note
that the Print icon only appears when you have a window which you may print
open. The On-Line icon only appears when you are connected to a remote station.
Open
Station
Download
Bulletin
Window
Plot
Window
Strip Chart
Window
Yearly
Rainfall
Database
Window
On-Line
(Hang Up)
This Month’s
NOAA Summary
Print
Window
View
Help
Exit
Program
TOOLBAR
FILE MENU
The file menu contains commands relating to station files and
stations. Each command is explained separately below. Note
that the contents of the File menu may change, depending on
what window is currently active. For example, when the Plot
window is the active window, several commands which
enable you to save and open plots and plot templates are
added to the File menu. These added commands are
explained in the appropriate section below.
14
USING THE SOFTWARE
File Menu
New Station
Each station connected to the computer must have its own “station” within the
software. This tells the software into which database new data should be saved,
provides the necessary communication settings (serial port, IRQ, etc.), and other
station-specific information.
1. Choose New Station from the File menu.
The New Station dialog box appears.
NEW STATION
2. To add a station, type the desired station name (up to 40 characters/spaces) into the
Station Name text box and choose OK.
The software saves the station, creates a directory for that station using the
first eight characters in the station name (not including punctuation and
spaces), and prompts you to indicate whether you want to enter the walkthrough procedure (see “About the Walkthrough” on page 10).
Open Station
Only one station may be open at a time. That way the software knows into which
database downloaded data should be saved, which communications settings to
use, which database to use when plotting, etc.
1. There are three ways to open a new station. Choose Open Station from the File menu,
choose the Open Station icon from the toolbar, or right click on the main window.
The Open Station dialog box appears.
OPEN STATION
2. Select a station from the list box on the left and choose OK to open that station.
15
USING THE SOFTWARE
File Menu
Delete Station
You may delete a station from the software quickly and easily. Deleting a station
removes the station directory and subdirectories from your hard disk.
1. Choose Delete Station from the File menu.
The Delete Station dialog box appears.
DELETE STATION
2. Select a station from the list box on the left and choose OK.
You will be prompted to confirm that you want to delete the station.
3. Choose OK to confirm the deletion.
The software deletes the station and all related files.
Download
Downloading allows you to transfer weather data from the WeatherLink’s archive
memory to the database stored on your computer’s hard disk. For information on
the difference between the data in your archive memory and the data in your
database, see “Archive Memory vs. Database” on page 91.
1. Choose Download from the File menu or choose the Download icon from the toolbar.
The software will show you how much information is currently saved in the
archive memory (as a number of records and as a percentage of the archive
memory’s capacity), and prompt you to confirm that you wish to download.
DOWNLOAD CONFIRMATION
16
USING THE SOFTWARE
File Menu
2. To begin the download, choose OK.
The software will begin to download data. The software shows you the
progress of the download in the form of a status bar and a text display of the
number of records transferred so far and the total number of records to be
transferred.
DOWNLOAD STATUS
After all records have been transferred, the software saves the information
into the open station’s database. If you have set up your station to clear the
archive memory after download (see “Clear archive memory after download”
on page 20), the software clears the archive memory.
View Log
Information about the automatic download and automatic clear of your station(s)
is automatically written to a file called “download.log.“ The log will show you
whether or not the download/clear was successful for each station and give you
the time and date at which it started and completed.
1. Choose View Log from the File menu.
The automatic download log appears.
AUTOMATIC DOWNLOAD LOG
2. To close the log window, double-click on the control-box or choose Close from the File
menu.
17
USING THE SOFTWARE
Setup Menu
Print
To print the active program window, choose Print from the File menu or click on
the Print icon in the toolbar. Specify printing options (for best results make sure
Landscape mode is selected) in Windows’ print dialog box and choose OK.
Close
To close the active program window, choose Close from the File menu or press
Ctrl-F4 (or Ctrl-Z).
Hang Up
To hang up a modem connection, choose Hang Up from the File menu or choose
the On-Line icon from the toolbar.
Note: The On-Line icon only appears in the toolbar when you are connected to a remote station.
Exit
To exit the software, choose Exit from the File menu.
SETUP MENU
The commands in the Setup menu relate to station and
software setup. Each of the commands is explained separately below.
Walkthrough
The station setup walkthrough automatically steps you
through the entire station configuration procedure. It is
explained in some detail in “About the Walkthrough”
starting on page 10.
18
USING THE SOFTWARE
Setup Menu
Station Config
You may enter information which will help to identify a particular station and
select a number of station-specific settings.
1. Choose Station Config from the Setup menu or press Ctrl-C.
The Station Configuration dialog box appears.
STATION CONFIGURATION
2. Enter the following information:
▲ Name
Enter the desired station name in this text box. Note that when you first
create a station, the software uses the first eight characters of the station
name as the name of the directory into which it saves this station’s database and configuration files and the first three characters as the file extension for that station’s database files. If you change the station name, the
software will prompt you to change the name of the station directory and
database file extension.
▲ Model
Select the weather station model from the drop-down list box.
▲ Rain Collector
Select the increment in which the rain collector you use with the station
measures rainfall. If you do not have a rain collector, choose None.
▲ Outside Humidity
If you have the optional External Temperature/Humidity Sensor, select
this check box.
19
USING THE SOFTWARE
Setup Menu
▲ After download automatically export last 2 days to “download.txt”
The software is capable of automatically creating a text file which contains
all downloaded records for the last 2 days (the day on which you downloaded and the previous day) after each download. To enable this feature,
select the check box. The file (named “download.txt”) is saved into the station’s directory.
▲ Clear archive memory after download
You may have the software automatically clear the archive memory whenever it downloads data. Clearing after each download will decrease the
time it takes to download because there will be less “accumulated” data in
the archive memory. Not clearing after each download allows you to
download data into multiple databases (if more than one person uses a
single weather station, for example). To clear data in the archive memory
after each download, select the check box.
▲ Data File Ext
The file extension used on database files for this station is displayed at the
bottom of the dialog box. To change the file extension, enter a valid DOS
file extension (3 characters) into the text box.
3. When finished, choose OK.
The software save the station configuration settings.
Serial Port
In order to communicate with the WeatherLink and station, you need to specify
communications settings for the station.
1. Choose Serial Port from the Setup menu or press Ctrl-I.
The Serial Port Settings dialog box appears.
SERIAL PORT
2. Enter the following information:
▲ Serial Port
Select the serial port to which the WeatherLink (or modem) is connected.
20
USING THE SOFTWARE
Setup Menu
▲ Baud Rate
Unless you are using a modem which only operates at 1200 baud, leave
the baud rate setting at 2400.
Note: If you have a 1200 baud modem, you need to both flip this setting for the PC AND flip
the dip switch setting on the data logger. By default, both are set to 2400 baud. For
successful operation, both must remain in sync.
▲ Phone Modem Connection
Select this check box to connect to the station by modem (remote connection).
▲ Rotary Dial
Select this check box if you are using a phone modem connection and your
phone is rotary dial.
▲ Phone
Enter the phone number for the modem connected to the station in the text
box. Make sure to enter the area code and any necessary prefixes (for
example, 1, 011, etc.). You may enter the following special characters.
▲ Enter a comma (,) to force the modem to pause before dialing the next
digit. You may enter more than one comma to increase the length of
time for which the modem pauses.
▲ Enter a “w” to force the modem to wait for a dial tone before dialing
the next digit.
▲ Modem String
Enter the desired modem initialization string in the text box. The default
modem initialization string should work in almost all cases. Before changing the modem string, see “Modem String” on page 99 for an explanation
of what each part of the string means.
▲ After Connect Wait
Controls the number of seconds the software waits (after connecting to a
remote station) to send the first command. If you are having difficulty connecting to a remote station, try increasing the number of seconds until you
can connect successfully.
3. When finished selecting options, choose Test.
The software will check the connection to the station (or modem) using the
current settings and indicate whether or not it successfully connected to your
weather station model. If you cannot connect to the station, you may use
Loopback (see “Finding the Correct Serial Port” on page 12) to determine the
correct serial port or make sure the serial port itself is actually working.
4. Once the serial port settings are correct, choose OK.
The software saves the serial port settings.
21
USING THE SOFTWARE
Setup Menu
Select Units
You may select the units of measure in which data is displayed within the software. All program windows (bulletin, summary, plots, database, etc.) display data
in the selected units of measure. Choosing units of measure in the software does
not affect the units of measure in which data is displayed on the console.
1. Choose Select Units from the Setup menu or press Ctrl-U.
The Choose Units dialog box appears.
CHOOSE UNITS
2. Select the desired units of measure:
▲ Temperature: Fahrenheit (°F) or Celsius (°C)
Wind chill, dew point, degree-days, and temperature-humidity index are
all displayed in the same unit of measure as temperature.
▲ Barometer: Inches of Hg (in), Millimeters of Hg (mm), Millibars (mb), or
Hectopascals (hPa)
▲ Wind Speed: Miles per Hour (mph), Knots (knot), Kilometers per Hour (km/hr), or
Meters per Second (m/s)
▲ Rain: Inches (in) or Millimeters (mm)
3. After selecting units of measure, choose OK.
The software saves your choices. All information will be displayed in the units
of measure you selected.
22
USING THE SOFTWARE
Setup Menu
Set Time
You may set the time and date on your station console and your computer from
the software. It is important to make sure that both the station and computer display the same time and date. Because changing time and date on the station can
affect data in the WeatherLink’s archive memory, we recommend that you download data before setting the time and date and then clear your archive memory
when finished.
Note: See “Leap Year Correction” on page 101 before changing time and/or date during a leap year.
1. Choose Set Time from the Setup menu.
The Set Time & Date dialog box appears. The time and date currently displayed by the station console appear at the top of the dialog box. The software
automatically enters the time and date displayed by the computer into the text
boxes at the bottom of the dialog box.
SET TIME & DATE
2. Enter the following information:
▲ Time/Date
Enter the current time and/or date.
▲ Set the PC time also
If you want the software to set the time and date on both the station console and the computer, select this check box.
3. After entering time and date, choose OK.
The software sets the time and date on the station console (and the PC) and
then prompts you to indicate whether you want to clear your archive memory
as well.
4. To indicate whether you want to clear your archive memory, choose Yes or No.
If you choose Yes, the software clears your archive memory.
23
USING THE SOFTWARE
Setup Menu
Set Archive Interval
You may choose to store data to the WeatherLink’s archive memory at an interval
of 1, 5, 10, 15, 30, 60, or 120 minutes. This interval is known as the archive interval.
For information on archive memory and the effect that the archive interval has on
the amount of data which may be stored in the WeatherLink’s archive memory,
see “Archive Memory” on page 91.
Note: Be aware that setting the archive interval clears your archive memory. You should download
data before changing archive interval (see “Download” on page 16).
1. Choose Set Archive Interval from the Setup menu.
The Set Archive Interval dialog box appears.
SET ARCHIVE INTERVAL
2. Select the desired archive interval and choose OK.
The software warns you that it is about to clear the archive memory.
3. To continue, choose OK.
The software sets the archive interval and clears the archive memory.
Set Barometer
You must set the barometer on your station console using the software (provided
your station has a barometer). For performance reasons, the software reads the
necessary calibration number for the barometer from the station’s configuration
file, rather than reading it from the console itself (see “Calibration Numbers” on
page 93). Therefore, in order for the software to display the correct barometric
pressure, you must set the barometer from the software.
1. Choose Set Barometer from the Setup menu.
The software opens the Set Barometer dialog box.
SET BAROMETER
24
USING THE SOFTWARE
Setup Menu
2. Enter the correct barometric pressure and choose OK.
The software saves the change in barometric pressure to both the console and
the station’s configuration file.
Set Rain Cal
You may set the rainfall calibration number on your station console using the software. Based on the type of rain collector you selected in station configuration (see
“Station Config” on page 19), the software automatically changes your station
console’s rainfall calibration number to the correct setting.
Note: Consult your station manual for a more detailed description of the rainfall calibration number.
1. Choose Set Rain Cal from the Setup menu.
The software prompts you to confirm that you wish to change the rainfall calibration number.
SET RAIN CAL
2. Choose Yes.
The software sets the rainfall calibration number on your station.
Set Temp Cal
If you need to calibrate your temperature readings, you must set the temperature
calibration numbers on your station console using the software. For performance
reasons, the software reads the temperature calibration numbers from the station’s configuration file, rather than reading it from the console itself (see “Calibration Numbers” on page 93). Therefore, in order for the software to display the
correct temperature(s), you must set temperature calibration numbers from the software.
Note: Consult your station manual for a more detailed description of temperature calibration numbers.
25
USING THE SOFTWARE
Setup Menu
1. Choose Set Temp Cal from the Setup menu.
The Set Temp Cal dialog box appears. The raw reading shown in this dialog
box indicates the unadjusted reading coming from the sensor. The adjusted
reading indicates what the software displays, adjusted for any previously
entered calibration number.
SET TEMP. CAL
2. Enter the desired adjusted reading and choose OK.
The software automatically calculates the necessary calibration number to
convert the raw reading into the adjusted reading and saves that calibration
number to the console and the station’s configuration file.
Set Hum Cal
If you need to calibrate your outside humidity reading, you must set the calibration number on your station console using the software. For performance reasons,
the software reads the calibration number from the station’s configuration file,
rather than reading it from the console itself (see “Calibration Numbers” on
page 93). Therefore, in order for the software to display the correct outside
humidity, you must set the outside humidity calibration number from the software.
Note: Consult your station manual for a more detailed description of the outside humidity calibration number.
26
USING THE SOFTWARE
Setup Menu
1. Choose Set Hum Cal from the Setup menu.
The Set Hum Cal dialog box appears. The raw reading shown in this dialog
box indicates the unadjusted reading coming from the sensor. The adjusted
reading indicates what the software displays, adjusted for any previously
entered calibration number.
SET HUMIDITY CAL
2. Enter the desired adjusted reading and choose OK.
The software automatically calculates the necessary calibration number to
convert the raw reading into the adjusted reading and saves that calibration
number to the console and the station’s configuration file.
Set Total Rain
You may want to enter a total rainfall amount to reflect any rainfall which
occurred before you obtained your station or before you started using the software. In order for the software’s rainfall totals to remain consistent with the station’s totals, you must enter total rainfall from the software. Once you set total rain,
the console and software will continue to accumulate rainfall normally.
1. Choose Set Total Rain from the Setup menu.
The Set Total Rain dialog box appears.
SET TOTAL RAIN
2. Enter the total rainfall amount and choose OK.
The software saves the total rainfall amount to the console and to the station’s
configuration file.
27
USING THE SOFTWARE
Setup Menu
Set Alarms
You may quickly set the alarm thresholds on the station console using the software. Consult your station manual for information on the available alarms and
how they work.
1. Choose Set Alarms from the Setup menu or press Ctrl-A.
The Set Station Alarms dialog box appears.
SET STATION ALARMS
2. Enter the following information:
▲ High/Low Alarm
For all of the standard high/low alarms, enter the desired alarm threshold
into the text box. To clear an alarm, delete the contents of the text box.
▲ Dew Point
Turn on the dew point alarm by selecting the check box. Clear the alarm by
“de-selecting” the check box.
▲ Barometer
Select the desired change per hour which will trigger the barometer alarm.
To clear the alarm, select Off.
▲ Time
Enter the time at which the alarm should be triggered into the text box. To
clear the alarm, delete the contents of the text box.
3. When finished entering alarm information, choose Set.
The software sets the alarms on the station console to match the settings in this
dialog box.
Clear
You may quickly clear high/low registers and rainfall totals from the software.
Note: This command will not clear the highs and lows on the bulletin if it is running.
28
USING THE SOFTWARE
Setup Menu
1. Choose Clear from the Setup menu.
The Clear dialog box appears.
CLEAR
2. Indicate which high/low registers and/or rainfall totals you wish to clear by selecting
the appropriate check box.
You may quickly select all high/low registers and rainfall totals by choosing
Check All. You may quickly de-select all high/low registers and rainfall totals
by choosing Check None.
3. To clear the selected high/low registers and/or rainfall totals, choose OK.
The software clears the selected high/low registers and/or rainfall totals on
the station console.
29
USING THE SOFTWARE
Setup Menu
Auto Clear
You may set up the software to automatically clear selected high/low registers
and rainfall totals at a set time each day (the software must be running). For more
information on how the Auto Clear feature works, see “Automatic Clear” on
page 92.
Note: This command will clear highs and lows on the bulletin if it is running at the time the Auto
Clear occurs.
1. Choose Set Auto Clear from the Setup menu.
The Auto Clear dialog box appears.
AUTO CLEAR
2. Indicate which high/low registers and/or rainfall totals you wish cleared automatically
by selecting the appropriate check box.
You may quickly select all high/low registers and rainfall totals by choosing
Check All. You may quickly de-select all high/low registers and rainfall totals
by choosing Check None.
3. Enter the time at which you want the station to clear the selected highs and lows each
day into the Time text box.
4. When finished setting up Auto Clear, choose OK.
The software saves the Auto Clear settings. The selected high/low registers
and rainfall totals will be cleared at the specified time each day.
30
USING THE SOFTWARE
Setup Menu
Auto Download
You may set up the software to automatically download data at specified times
each day (the software must be running). For more information on how the automatic download feature works, see “Automatic Download” on page 92.
1. Choose Auto Download from the Setup menu or press Ctrl-J.
The Auto Download dialog box appears. The stations which appear in the
Auto Download List will be downloaded automatically.
AUTO DOWNLOAD
2. To add a station to the Auto Download List, double-click on the station name or select
the station from the Station Names list and choose Add.
The station name will be moved to the Auto Download List. You may select
more than one station before choosing Add to add several stations at once.
You may quickly add all stations in the Station Names list by choosing Add
All.
3. To remove a station from the Auto Download List, select the station and choose
Remove.
The station name will be removed from the Auto Download List. You may
select more than one station before choosing Remove to remove several stations at once. You may quickly remove all stations in the list by choosing
Clear.
31
USING THE SOFTWARE
Setup Menu
4. To set the time(s) at which the selected station should be downloaded, choose Download At.
The Download At dialog box appears.
DOWNLOAD AT
5. Enter the following information:
▲ Download Times
Select the hour(s) at which the software should automatically download
information from this station by clicking on the desired hour in the list.
You may select as many download hours as you want; the software will
download data from your station during each of the specified hours. To
de-select a previously selected hour, click on it again. To quickly select all
hours, choose Choose All. To quickly clear all selected hours, choose Clear.
▲ Offset Time
To force the software to automatically download a specific number of minutes after the selected hour(s), enter the number of minutes here. For
example, In the illustration above, the software would automatically
download at 9:05 am and 8:05 pm.
6. After setting the download time(s), choose OK.
The software saves the automatic download time settings.
Auto Fax
You may set up the software to automatically fax weather data to you after each
automatic download (see “Auto Download” on page 31). If AutoFax is enabled,
the software creates a text file (“auto.fax“) which contains all weather data for the
current day and the previous day and then faxes that document to the number
you specify after the AutoDownload is complete. In order to use AutoFax, you
will need to have a working fax modem and know to which serial port the fax
modem is connected.
32
USING THE SOFTWARE
Setup Menu
1. Choose Auto Fax from the Setup menu or press Ctrl-X.
The Auto Fax Settings dialog box appears.
AUTO FAX SETTINGS
2. Enter the following information:
▲ COM Port
Enter the number of the COM port to which your fax modem is connected.
▲ Fax Phone #
Enter the fax number to which you want the data sent.
▲ Modem Class
Select the modem class. Consult your fax modem’s documentation to
determine the correct class. If you are unsure, test the Auto Fax feature
using Modem Class 2.0, then 2, then 1 to determine which class will work
with your modem.
▲ Addressed To Information
Enter any desired addressing information. This information will appear at
the top of the fax.
▲ Modem Initialization String
Enter the desired modem initialization string in the text box. The default
modem initialization string should work in almost all cases. Before changing the modem string, see “Modem String” on page 99 for an explanation
of what each part of the string means.
▲ Fax After Auto Download
To enable Auto Fax, select this check box.
▲ Single Page/Multiple Page
The Auto Fax feature can be set to fax the entire contents of the auto.fax file
(on multiple pages) or it can be set to send you only the most recent data
(as much as will fit on a single page). Choose between these two modes by
selecting the desired option.
3. To test the Auto Fax, choose Test Fax.
The program will attempt to send a fax to the specified fax number. If successful, the program will inform you. If possible, you should also check the fax
itself to make sure it transmitted correctly.
33
USING THE SOFTWARE
Reports Menu
4. When finished, choose OK.
The software saves your Auto Fax settings.
REPORTS MENU
The Reports menu contains commands which allow you
to quickly generate reports using (in most cases) data in
your database. Each of the commands is explained separately below.
Printing Reports
To print any of the reports generated by the software,
choose Print from the File menu, click on the Print icon
in the Toolbar, or press Ctrl-P.
NOAA Setup
The software will automatically generate reports similar to Monthly and Yearly
NOAA (National Oceanic and Atmospheric Administration) ”weather watcher”
reports. Enter all necessary setup information using NOAA Setup, and the reports
can be calculated in seconds.
1. Choose NOAA Setup from the Reports menu.
The NOAA Report Setup dialog box appears.
NOAA REPORT SETUP
2. Enter the following information:
▲ City
Enter the city name into the text box.
34
USING THE SOFTWARE
Reports Menu
▲ State
Enter the state name into the text box. If you wish, enter the country name
as well.
▲ Elevation
Enter the location’s elevation into the text box.
▲ Lat, Long
Enter the location’s longitude and latitude into the text box. When entering latitude, use negative numbers to represent southern latitudes. When
entering longitude, use negative numbers to represent western longitudes.
Note: To enter the symbol for degrees (º) , you can either hold the Alt-key down while
pressing 0176 on the number pad of your keyboard, or you can copy the symbol from
the Character Map (in Start > Program > Accessories) and paste it into the dialog box
using Ctrl+V.
▲ Normal Mean Temp
Enter the normal mean temperature for each month of the year into the
appropriate text box.
▲ Normal Precipitation
Enter the normal mean precipitation for each month of the year into the
appropriate text box.
▲ Cooling Degree-Day Base Temp
Enter the desired cooling degree-day base temperature into the text box.
▲ Heating Degree-Day Base Temp
Enter the desired heating degree-day base temperature into the text box.
▲ Calculate using integration method
Calculate degree-days using integration method rather than averaging
high and low temperature reading for the day. See “Degree-Days” on
page 97 for a description of the two calculation methods.
3. After entering information, choose OK.
The software saves all NOAA report setup information.
NOAA This Month
To quickly generate a NOAA monthly summary (see “NOAA Summarize
Month” below) using all existing data for the current month, choose NOAA This
Month, click on the NOAA icon in the toolbar, or press F7.
35
USING THE SOFTWARE
Reports Menu
NOAA Summarize Month
The software can automatically generate a report similar to monthly NOAA
weather watcher reports using the information in your database and NOAA
Setup information (see “NOAA Setup” on page 34).
1. Choose NOAA Summarize Month from the Reports menu.
The Choose Month dialog box appears.
CHOOSE MONTH
2. Select a month from the list.
3. Enter the desired file name into the Export File text box.
Whenever you create a monthly summary, the software automatically saves
an export file (ASCII text) which contains the report information. You may
enter the desired file name in this text box or you may use the default file
name.
36
USING THE SOFTWARE
Reports Menu
4. Choose OK.
The NOAA Monthly Summary appears.
NOAA MONTHLY SUMMARY
General station information (Station Name, City, State, Units of Measure, etc.)
appears at the top of the report. For each day in the report, you may view the
following information (and a total for the month):
▲ Day
Each row in the report shows information for a single day. The date for
each row appears at the left of the row.
▲ Mean Temp
The mean temperature for the day. At the bottom of the column, the mean
temperature for the month is displayed.
▲ High & Time
The high temperature for the day and the time at which it occurred. At the
bottom of the column, the highest temperature recorded during the month
and the day on which it occurred is displayed.
37
USING THE SOFTWARE
Reports Menu
▲ Low & Time
The low temperature for the day and the time at which it occurred. At the
bottom of the column, the lowest temperature recorded during the month
and the day on which it occurred is displayed.
▲ Heat Deg-Days
The number of heating degree-days accumulated on each day. At the bottom of the column, the total heating degree-days accumulated during the
month is displayed.
▲ Cool Deg-Days
The number of cooling degree-days accumulated on each day. At the bottom of the column, the total cooling degree-days accumulated during the
month is displayed.
▲ Rain
The rainfall accumulated on each day. At the bottom of the column, the
total rainfall accumulated during the month is displayed.
▲ Avg Wind Speed
The average wind speed for each day. At the bottom of the column, the
average wind speed of the month is displayed.
▲ High (Wind Speed) & Time
The high wind speed for the day and the time at which it occurred. At the
bottom of the column, the highest wind speed recorded during the month
and the day on which it occurred is displayed.
▲ Dom Direction
The dominant wind direction for the day. At the bottom of the column, the
dominant wind direction recorded during the month is displayed.
At the bottom of the report, the following monthly information is summarized.
▲ Max >= 90
The number of days on which high temperature was 90° F (32°C) or above.
▲ Max <= 32
The number of days on which high temperature was 32° F (0°C) or below.
▲ Min <= 32
The number of days on which low temperature was 32° F (0°C) or below.
▲ Min <= 0
The number of days on which low temperature was 0° F (-18°C) or below.
▲ Max Rain
The maximum rainfall on any single day during the month.
▲ Days of Rain
The number of days on which rainfall exceeded 0.01" (0.2 mm), 0.1"
(2 mm), or 1" (20 mm) is displayed.
5. To close the report, choose Close from the File menu, press Ctrl-F4, or double-click on
the Control-menu in the upper left corner of the window.
38
USING THE SOFTWARE
Reports Menu
NOAA This Year
To quickly generate a NOAA yearly summary (see “NOAA Summarize Year”
below) using all existing data for the current year, choose NOAA This Year or
press F8.
NOAA Summarize Year
The software can automatically generate a report similar to yearly NOAA
weather watcher reports using the information in your database and NOAA
Setup information (see “NOAA Setup” on page 34).
1. Choose NOAA Summarize Year from the Reports menu.
The Choose Year dialog box appears.
CHOOSE YEAR
2. Select a year from the list.
3. Enter the desired file name into the Export File text box.
Whenever you create a yearly summary, the software automatically saves an
export file (ASCII text) which contains the report information. You may enter
the desired file name in this text box or you may use the default file name.
39
USING THE SOFTWARE
Reports Menu
4. Choose OK.
The NOAA yearly summary appears. General station information (Station
Name, City, State, Units of Measure, etc.) appears at the top of the report.
Below that is the temperature summary section.
NOAA YEARLY SUMMARY (TEMPERATURE)
For each month in the report, you may view the following temperature information (and a total/average for the year):
▲ YR & MO
Each row in the report shows information for a single month. The month
and year appear at the left of the row.
▲ Mean Max
The average of daily maximum temperatures for the month. At the bottom
of the column, the mean maximum temperature for the year is displayed.
▲ Mean Min
The average of daily minimum temperatures for the month. At the bottom
of the column, the mean minimum temperature for the year is displayed.
▲ Mean
The mean temperature for the month. At the bottom of the column, the
mean temperature for the year is displayed.
40
USING THE SOFTWARE
Reports Menu
▲ Dep. From Norm
The amount by which the mean temperature departed from normal for the
month. At the bottom of the column, the amount by which the mean temperature departed from normal for the year is displayed.
Note: For values (other than 0) to appear here, you need to first setup your NOAA report.
See “NOAA Setup” on page 34 for details.
▲ Heat Deg-Days
The number of heating degree-days accumulated during each month. At
the bottom of the column, the total heating degree-days accumulated during the year is displayed.
▲ Cool Deg Days
The number of cooling degree-days accumulated during each month. At
the bottom of the column, the total cooling degree-days accumulated during the year is displayed.
▲ Hi & Date
The highest temperature for the month and the date on which it occurred.
At the bottom of the column, the highest temperature recorded during the
year and the month in which it occurred is displayed.
▲ Low & Date
The lowest temperature for the month and the date on which it occurred.
At the bottom of the column, the lowest temperature recorded during the
year and the month in which it occurred is displayed.
▲ Max >= 90 (32)
The number of days on which high temperature was 90° F (32°C) or above
during the month. At the bottom of the column, the total number of days
on which the high temperature was 90° F (32°C) or above during the year
is displayed.
▲ Max <= 32 (0)
The number of days on which high temperature was 32° F (0°C) or below
during the month. At the bottom of the column, the total number of days
on which the high temperature was 32° F (0°C) or below during the year is
displayed.
▲ Min <= 32 (0)
The number of days on which low temperature was 32° F (0°C) or below
during the month. At the bottom of the column, the total number of days
on which the low temperature was 32° F (0°C) or below during the year is
displayed.
▲ Min <= 0 (-18)
The number of days on which low temperature was 0° F (-18°C) or below
during the month. At the bottom of the column, the total number of days
on which the low temperature was 0° F (-18°C) or below during the year is
displayed.
41
USING THE SOFTWARE
Reports Menu
Below the temperature summary section, the rainfall summary section
appears.
NOAA YEARLY SUMMARY (RAINFALL)
For each month in the report, you may view the following rainfall information
(and a total/average for the year):
▲ YR & MO
Each row in the report shows information for a single month. The month
and year appear at the left of the row.
▲ Total
The total rainfall for the month. At the bottom of the column, the total rainfall for the year is displayed.
▲ Dep. From Norm
The amount by which the total rainfall departed from normal for the
month. At the bottom of the column, the amount by which the total rainfall departed from normal for the year is displayed.
Note: For values (other than 0) to appear here, you need to first setup your NOAA report.
See “NOAA Setup” on page 34 for details.
▲ Max Obs. Day & Date
The highest rainfall total for an single day during the month and the date
on which it occurred. At the bottom of the column, the highest rainfall
total for any single day during the year and the month during which it
occurred are displayed.
▲ Days of Rain Over .01 (0.2)
The number of days on which rainfall exceeded 0.01" (0.2 mm) during the
month. At the bottom of the column, the number of days on which rainfall
exceeded 0.01" (0.2 mm) during the year is displayed.
▲ Days of Rain Over .1 (2)
The number of days on which rainfall exceeded 0.1" (2 mm) during the
month. At the bottom of the column, the number of days on which rainfall
exceeded 0.1" (2 mm) during the year is displayed.
42
USING THE SOFTWARE
Reports Menu
▲ Days of Rain Over 1 (20)
The number of days on which rainfall exceeded 1" (20 mm) during the
month. At the bottom of the column, the number of days on which rainfall
exceeded 1" (20 mm) during the year is displayed.
Below the rainfall summary section, the wind summary section appears.
NOAA YEARLY SUMMARY (WIND)
For each month in the report, you may view the following wind information
(and an average for the year):
▲ YR & MO
Each row in the report shows information for a single month. The month
and year appear at the left of the row.
▲ Avg
The average wind speed for the month. At the bottom of the column, the
average wind speed for the year is displayed.
▲ Hi & Date
The high wind speed for the month and the date on which it occurred. At
the bottom of the column, the highest wind speed recorded during the
year and the month in which it occurred is displayed.
▲ Dom Dir
The dominant wind direction for the month. At the bottom of the column,
the dominant wind direction during the year is displayed.
5. To close the report window, double-click on the Control-menu in the upper left corner
of the window, or press Ctrl-F4.
43
USING THE SOFTWARE
Reports Menu
Yearly Rainfall
You may generate rainfall reports which show rainfall totals for all years in the
database and any years for which you want to enter your own data. The rainfall
report database is kept separate from the station database, so you may alter rainfall information in the rainfall database without affecting the station database.
1. Choose Yearly Rainfall from the Reports menu, click on the Yearly Rain icon in the toolbar, or press Ctrl-R.
The software opens the Yearly Rainfall window.
Note: The first time you open the rainfall report, you will be prompted to confirm that you want
to generate the rainfall database. Choose Yes to generate the rainfall database. Depending on the amount of data in your database, it may take a while to generate the rainfall
report.
YEARLY RAINFALL
2. See “Using the Yearly Rainfall Database” on page 80 for instructions on using the
yearly rainfall report.
44
USING THE SOFTWARE
Reports Menu
Degree-Days
The software can calculate degree-days for an almost infinite number of plants,
pests, etc. See “Degree-Days” on page 97 for a description of degree-days.
1. Choose PC Degree Days from the Reports menu or press Ctrl-G.
The PC Degree Days list box appears.
PC DEGREE DAYS
2. See “Degree-Days” starting on page 84 for instructions on using the degree-day calculation feature.
45
USING THE SOFTWARE
Reports Menu
Temp/Hum Hours
You may track the number of hours temperature is above or below a certain
threshold and humidity is above a certain threshold. See “Temperature/Humidity
Hours” on page 98 for a description of temperature/humidity hours.
1. Choose Temp/Hum Hours from the Reports menu.
The Temp/Hum Hours dialog box appears.
TEMP/HUM HOURS
2. For each temp/hum hour total you wish to track, enter the following:
▲ Name
Enter the name of the crop/pest for which you want temp/hum hours calculated into the text box.
▲ Start Date
Enter the date from which you want temp/hum hours calculated into the
text box.
▲ Temp Threshold
Enter the temperature threshold for this crop/pest into the text box.
▲ Above/Below
Select whether the software should calculate temp/hum hours based on
the number of hours above or below the temperature threshold. (Above
means greater than or equal to, below means less than or equal to.)
▲ Humidity Threshold
Enter the humidity threshold for this crop/pest into the text box.
▲ Development Total
Enter the number of temp/hum hours required for this crop/pest to
develop.
46
USING THE SOFTWARE
Reports Menu
3. After entering all necessary information, choose OK to view the temp/hum hours
report.
The software calculates and displays temp/hum hours information.
TEMP/HUM HOURS REPORT
The temp/hum hours report contains the following information:
▲ Name, Start Date, Thresholds
The report shows the name, start date, and the thresholds you entered.
▲ Days Occurred
The report shows the number of days on which temp/hum hours
occurred.
▲ Total for prior 3 days
The report shows the number of temp/hum hours which occurred on each
of the past 3 days.
▲ Development Total
The reports shows the development total you entered.
▲ Hours to Go
The report shows the total temp/hum hours left before the development
total is reached.
▲ Days to Go
The report shows the expected number of days before the development
total is reached. This calculation is based on the average number of temp/
hum hours during the last three complete days.
47
USING THE SOFTWARE
Reports Menu
Soil Temp. Hours
You may track the number of hours soil temperature is above a certain threshold.
See “Soil Temperature Hours” on page 98 for a description of soil temperature
hours.
1. Choose Soil Temp Hours from the Reports menu.
The Soil Temp Hours dialog box appears.
SOIL TEMP HOURS
2. Enter the following information:
▲ Start Date
Enter the starting date for which you want soil temperature hours calculated into the text box.
▲ End Date
Enter the ending date for which you want soil temperature hours calculated into the text box.
▲ Temp Threshold
Enter the soil temperature threshold above which you want soil temperature hours calculated into the text box.
48
USING THE SOFTWARE
Reports Menu
3. After entering all necessary information, choose OK to view the soil temperature hours
report.
The software calculates and displays soil temperature hours information.
SOIL TEMP HOURS REPORT
The soil temperature hours report contains the following information:
▲ Total
The total number of soil temperature hours which occurred during the
selected period of time.
▲ Start Date, End Date, Threshold
The report shows the start and end dates and the threshold you entered.
▲ Hours for the last 15 days
The report shows the number of soil temperature hours which occurred on
each of the past 15 days.
49
USING THE SOFTWARE
Reports Menu
Chilling Requirement
You may calculate chilling requirements by entering a start and end date and a
temperature threshold. See “Chilling Requirement” on page 97 for a description
of Chilling Requirements.
1. Choose Chilling Requirement from the Reports menu.
The Chilling Requirement dialog box appears.
CHILLING REQUIREMENT
2. Enter the following information:
▲ Start Date
Enter the starting date for which you want chilling requirement calculated
into the text box.
▲ End Date
Enter the ending date for which you want chilling requirement calculated
into the text box.
▲ Temp. below
Enter the temperature below which you want chilling requirement calculated.
3. When finished, choose Calculate.
The software calculates chilling requirement for the selected period and displays that information at the bottom of the dialog box.
CHILLING REQUIREMENT CALCULATED (22.5 HOURS)
4. To exit, choose Done.
50
USING THE SOFTWARE
Reports Menu
Sunrise & Sunset
You may calculate sunrise and sunset times for any location and date.
1. Choose Sunrise & Sunset from the Reports menu or press F2.
The Sunrise & Sunset dialog box appears.
SUNRISE & SUNSET
2. Enter the following information:
▲ Date
Enter the date for the report. If calculating for a day, the software calculates sunrise and sunset for the entered date. If calculating for a month or a
year, the software calculates sunrise and sunset for the month/year during
which the date falls.
▲ Time Zone
Select the appropriate time zone from the drop-down list. Use the time
zone selection to adjust the calculated sunrise/sunset times to the desired
time zone. Note that the software uses the longitude and latitude to actually determine the times; the time zone simply allows it to adjust the time
correctly.
▲ Daylight Savings Time
Select this check box if you are currently on daylight savings time. The
software adjusts the times for daylight savings only if this check box is
selected.
▲ Latitude/Longitude
Enter the latitude and longitude of the location for which you want sunrise and sunset times calculated.
▲ Calculate
Select the length of time for which you want Sunrise and Sunset times calculated by selecting either Day, Month, or Year.
51
USING THE SOFTWARE
Reports Menu
3. After entering all necessary information, choose OK.
The software calculates sunrise and sunset times and displays the information.
SUNRISE & SUNSET REPORT
The report contains the following information:
▲ Latitude/Longitude
The report shows the latitude and longitude setting you entered.
▲ Time Zone
The report shows the time zone you selected.
▲ Greenwich Offset
The number of hours the sunrise/sunset times are offset from Greenwich
Mean Time (due to time zone and daylight savings adjustments) is shown.
▲ Daylight Savings Time
The report shows whether the daylight savings time setting is on or off.
▲ Date
Each row in the report shows the sunrise and sunset times for a single day.
The date for each row appears at the left of the row.
▲ Twilight Times (Morning and Evening)
The report lists twilight times for both morning and evening for each day
in the report. The morning twilight times appear on the left and the
evening twilight times appear on the right. There are three separate twilight times listed for each:
▲ Astronomical Twilight (Astro) is defined as the time at which the
center of the sun is 18° below the horizon.
▲ Nautical Twilight (Naut) is defined as the time at which the center of
the sun is 12° below the horizon.
▲ Civil Twilight (Civil) is defined as the time at which the center of the
sun is 6° below the horizon.
52
USING THE SOFTWARE
Windows Menu
▲ Sunrise
The report lists the time at which sunrise (defined as the time at which the
upper limb of the sun appears) occurs for each day in the report.
▲ Sunset
The report lists the time at which sunset (defined as the time at which the
upper limb of the sun disappears) occurs for each day in the report.
▲ Daylight Hours
The report shows the total hours of daylight for each day in the report.
WINDOWS MENU
The commands in the Windows menu allow you open and use
many of the software’s most important features: bulletin, database browser, plot window, strip charts, and the summary window.
The Windows menu also contains standard commands for closing, cascading, and tiling all open program windows. In addition, the names of open program windows are listed at the
bottom of the menu, allowing you to quickly bring the desired
window to the “front.”
53
USING THE SOFTWARE
Windows Menu
Bulletin
The bulletin provides a graphic representation of current weather conditions
(with the numeric reading displayed as well) which updates in real-time.
BULLETIN
For all bar graphs (outside temperature, for example), highs and lows are represented by yellow lines which appear above the bar (high) or within the bar (low).
When you first open the bulletin window, the software prompts you to indicate
whether you want to download highs and lows from the station. Downloading
highs and lows causes the software to read highs and lows from the weather station and display them on the weather bulletin. If you download highs and lows it
takes a bit longer to open the bulletin window. If you do not download highs and
lows, the highs and lows shown in the bulletin window will only reflect the highs
and lows recorded while the bulletin is open. As long as the bulletin is open, the
software automatically updates highs and lows as they occur. (If a scheduled
Auto Clear occurs while the bulletin is open, any high or low that is cleared on the
console is also cleared on the bulletin.)
The bulletin displays a line graph of barometric pressure over the past six hours.
When you first open the bulletin window, the software graphs the current barometric pressure and any barometric pressure data which exists in your database
for the past six hours. While the bulletin is open, the software plots another point
on this graph every 15 minutes.
54
USING THE SOFTWARE
Windows Menu
▲ To start the bulletin, choose Bulletin from the Windows menu, click on the Bulletin
icon in the toolbar, or press Ctrl-B.
The software prompts you to indicate whether you want to download highs
and lows. Choose Yes or No to continue.
▲ To view the Summary window which lists all current weather information (including the time and date at which highs and lows occurred) press Page Down or right
mouse click in the bulletin window.
▲ To print the bulletin, choose Print from the File menu, click on the Print icon in the
toolbar, or press Ctrl-P.
Set your printer options in the Print dialog box (for best results, be sure to
choose landscape mode) and then choose OK.
▲ To close the bulletin, choose Close from the File menu, double-click on the Controlmenu box in the upper left corner of the window or press Ctrl-F4.
Browse
The Browse window allows you to view the raw data collected by your station. In
addition to viewing data, you may edit records, print data, export data for use in
database or spreadsheet programs, or add notes to individual records.
▲ To open the Browse window, choose Browse from the Windows menu, click on the
Database icon in the toolbar, or press Ctrl-W.
The Browse window appears. For complete instructions on using the Browse
window, see “Using the Browse Window” on page 59.
BROWSE WINDOW
55
USING THE SOFTWARE
Windows Menu
Plot
The WeatherLink software includes a powerful plotting engine which allows you
to plot as many conditions as you want on a single plot. You can also save plots
and plot templates for later viewing.
▲ To plot data, choose Plot from the Windows menu, click on the Plot icon in the toolbar, or press Ctrl-Q.
The Plot window appears. For complete instructions on using the Plot window, see “Using the Plot Window” on page 65.
PLOT WINDOW
Strip Charts
The strip charts offer you 4 line graphs which update in real-time as long as they
are open. You may select the data you want to plot on the strip charts and the
span over which you want it plotted.
56
USING THE SOFTWARE
Windows Menu
▲ To use the strip charts, choose Strip Charts from the Windows menu, click on the
Strip Chart icon in the toolbar, or press Ctrl-S.
The software automatically downloads data from the open station in order to
fill out the entire strip chart. After downloading, the Strip Chart window
appears. For complete instructions on using the Strip Charts, see “Using the
Strip Charts” on page 76.
STRIP CHART
57
USING THE SOFTWARE
Windows Menu
Summary
The summary shows a text table of all current conditions as well as the highs and
lows along with the time and date at which they occurred. The information on the
high/low summary is updated in the same way as the bulletin.
SUMMARY WINDOW
▲ To start the summary, choose Summary from the Windows menu or press Ctrl-Y.
The software prompts you to indicate whether you want to download highs
and lows. Choose Yes or No to continue.
▲ To print the summary, choose Print from the File menu, click on the Print icon in the
toolbar, or press Ctrl-P.
▲ To close the summary, choose Close from the File menu, double-click on the Control-menu box in the upper left corner of the window or press Ctrl-F4.
58
USING THE SOFTWARE
Using the Browse Window
USING THE BROWSE WINDOW
The browse window allows you to view, edit, print, annotate, and export the raw
data collected by the WeatherLink.
BROWSE WINDOW
When the Browse window is active, a Browse menu
appears in the menu bar. The Browse menu contains
commands which enable you to view, edit, print, export,
and copy database information.
Choose Date
You may quickly view the records for any date in the database.
1. To choose a date, click anywhere in the Browse window with the right mouse button,
choose Choose Date from the Browse menu, or press Ctrl-D.
The Choose Date dialog box appears.
CHOOSE DATE
59
USING THE SOFTWARE
Using the Browse Window
2. Select the desired date from the list and choose OK.
The software locates and displays the first record from the selected date.
Make a Note
You may add notes to any record in the database.
Note: The text of database notes are saved in the “DATANOTE” subdirectory for the open station.
The notes are assigned a coded file name which identifies them to the program. Do not
change these file names.
1. To add a note, double-click on the area just to the left of a record’s date (or select the
desired record and choose Make a Note from the Browse menu or press Ctrl-N).
The Note Pad appears.
NOTE PAD
2. Enter the desired text into the note pad.
3. When finished, choose OK.
The software saves the note and returns you to the Browse window. After you
add a note to a record, the software adds a note icon to the left of the record.
NOTE ICON
4. To edit, delete, or add to an existing note, double click on the note icon.
The Note Pad (with the text of previously entered notes) appears. Edit or add
to the note and choose OK to save. Choose Remove to delete the note completely.
60
USING THE SOFTWARE
Using the Browse Window
Edit a Record
You may edit the data contained in any record in your database.
1. To edit a record, double-click on the desired record in the Browse window (or select
the desired record and choose Edit from the Browse menu or press Enter).
The Edit dialog box appears.
EDIT
The date and time of the record appear in the title bar. You may enter or
change any of the record data by simply entering the desired data into the
appropriate text box. Note that you cannot edit temperature/humidity index
data directly because it is calculated ”on the fly” (see “Temperature/Humidity
Index” on page 96). To change temperature/humidity index data, edit the outside temperature or outside humidity data.
2. When finished editing data, choose OK.
The software saves your changes and closes the Edit dialog box. Choose Next
to save your changes and move to the next record in the database. Choose Previous to save your changes and move to the previous record in the database.
Choose Cancel to undo all changes and close the Edit dialog box.
61
USING THE SOFTWARE
Using the Browse Window
Delete a Record
To delete a single record, select the desired record and press Delete or choose
Delete from the Browse menu. The software prompts you to confirm that you
wish to delete the record before it continues.
Copy Records
You may copy all record information for a specific group of records to Windows’
clipboard (from which you may paste the information into most Windows programs).
1. To copy records to the clipboard, choose Copy Records from the Browse menu.
The software prompts you to select the records you want copied.
CHOOSE RECORDS TO COPY
2. Select the desired days, months, or years (you may choose more than one) and choose
OK.
The software copies the selected records to the clipboard.
62
USING THE SOFTWARE
Using the Browse Window
Export Records
You may export record information to a tab delimited export file which can be
used in most database, spreadsheet, or word processing programs.
1. To export records, choose Export from the Browse menu.
The software prompts you to select the records you want exported.
CHOOSE RECORDS TO EXPORT
2. Select the desired days, months, or years (you may choose more than one) and choose
OK.
The software prompts you to enter an export file name.
3. Enter the desired file name and choose OK.
ENTER EXPORT FILE NAME
The software saves all record information for the selected days, months, or
years (in tab delimited format) into the export file. You may use this file to
import data into most popular database, spreadsheet, and/or word processing programs.
63
USING THE SOFTWARE
Using the Browse Window
Delete Records
You may quickly delete a group of records.
1. To delete records, choose Delete Records from the Edit menu.
The software prompts you to select the records you want deleted.
CHOOSE RECORDS TO DELETE
2. Select the desired days, months, or years (you may choose more than one) and choose
OK.
The software prompts you to confirm that you want to delete the records.
3. To delete the records, choose OK.
The software deletes the selected records.
64
USING THE SOFTWARE
Using the Plot Window
USING THE PLOT WINDOW
The software includes powerful plotting capabilities which allow you to view and
compare data in graphical format. The plot interface has been designed so that
almost all plot features may be accessed directly from the plot window. You may
use menu commands if you find it easier, of course. Menu commands are
explained separately below. When the Plot window is active, a Plot menu and a
Color menu are added to the main menu bar and some new commands (Open
Plot, Save Plot, Open Plot Template, and Save Plot Template) are added to the File
menu. The use of the Plot menu, Colors menu, and the Open and Save commands
are explained below.
The three most basic elements of any plot are the variables (the weather conditions you are plotting), the date, and the plot span (the length of time over which
you are plotting those conditions). The software allows you to quickly and simply
select those three elements and also includes many other useful features which
make it easier to view and compare data. Almost all of the plot features may be
accessed directly from the plot window.
PLOT WINDOW
65
USING THE SOFTWARE
Using the Plot Window
Adding and Removing Variables
▲ Variables Box
The variables box at the bottom of the screen makes it possible to add and
remove variable with a click of the mouse. To add or remove a variable from a
plot, click on the box next to the variable’s name in the variables box. When
you add a variable to the plot, the color of that variable fills the box and the
variable is added to the plot. When you remove a variable, the box becomes
white again and the variable is removed from the plot.
To add or remove multiple variables at one time, hold down the Shift key
while clicking on the desired variables. The program will wait until you
release the Shift key before beginning to draw the plot.
▲ Plot Menu
You may also choose variables from the Add/Remove sub-menu in the Plot
menu to add or remove variables. A variable which is already plotted will
have a check mark before its name in the menu.
▲ Keyboard
If you have only one variable plotted, pressing the up and down arrows
quickly scrolls through the available variables. Watch the variables box or the
axis info button to see what variable is being plotted.
Choose Specific Date
You may choose a specific date for plotting.
1. Click on the Date button, press Ctrl-D, click anywhere in the Plot window with the right
mouse button, or choose Choose Date from the Plot menu.
A list of dates in your database appears.
CHOOSE DATE
2. Select the desired date from the list and choose OK.
For plot spans which show more than one day, the date you pick will be plotted on the left side of the axis and the rest of the plot will fill in with subsequent data. The date which appears on the date button always indicates what
data is plotted on the left-most side of the axis.
66
USING THE SOFTWARE
Using the Plot Window
Scroll Through Dates
You may use the scroll bar along the bottom of the strip chart window to scroll
through data.
▲ Click the scroll arrows (or press the right or left arrow keys) to move the plot forward or backward one day at a time.
If the plot span is less than a day, clicking this action moves the plot one span
at a time. If the span is one year, this action moves the plot one month at a
time.
▲ Click the scroll bar to move the plot one plot span at a time.
▲ Drag the scroll box to quickly find a specific date.
As you drag the scroll box, watch the date button of the window until the
desired date appears, then release the scroll box.
Choose Plot Span
To choose a plot span, click on the Span button or choose the Span sub-menu from
the Plot menu. A list containing all available plot spans appears. Choose the
desired plot span from the list.
PLOT SPAN LIST
67
USING THE SOFTWARE
Using the Plot Window
Enter Plot Title
You may enter a plot title into the Plot Title text box at the top of the window. You
may also choose Edit Title from the Options sub-menu in the Plot menu to move
the cursor to the Title text box.
Choose Axis Information
Although you may have as many variables as desired on any plot, each axis (left/
right) on a plot may only display information for one of those variables. To choose
the axis information you want displayed, click on the desired Axis Info button or
choose the desired Variable command from the Options sub-menu in the Plot
menu. A pop-up list appears, containing the name (and color) of the variables on
this plot. Select the desired variable from the pop-up list.
AXIS INFO POP-UP LIST
Choose Line/Bar
A line plot shows a line drawn from one data point to another until the whole plot
span is filled. A bar graph, on the other hand, shows cumulative totals during a
specific interval (each day on week and month plots, each month on year plots).
You may only use bar graphs for rainfall and only on plot spans of a week, month,
or year.
To select either a bar or line graph, click on the Line/Bar button or choose the
Line/Bar option for the desired axis from the Options sub-menu in the Plot menu.
A pop-up list appears next to the Line/Bar button. Choose either Line or Bar from
the list.
LINE/BAR POP-UP LIST
68
USING THE SOFTWARE
Using the Plot Window
Set Axis Min/Max
You may set your own minimum or maximum for each axis by entering the
desired number into the Axis Min/Max text box (the first and last numbers in the
axis. You may also choose the desired Edit Min/Max option from the Options
sub-menu in the Plot menu to move the cursor into the Min/Max text box. Setting
the minimum or maximum automatically “locks” the axis (see below).
AXIS MAXIMUM TEXT BOX
Note: The Min and Max values you specify may not end up being the actual min and max values
used to create the plot. For simplicity, the grid lines on any axis are always multiples of one of
the following numbers: .01, .02, .05, .1, 2, 5, 10, 20, 50, 100, 200, 500, or 1000. The software
will determine the closest possible match to your specified max or min value.
Lock Axis
To lock (or unlock) the axis of a plot, click on the Lock Axis icon for the desired
axis or choose the desired locking option from the Options sub menu in the Plot
menu. Locking the axis will cause subsequent plot spans (when you scroll
through plot spans) to use the same scale as the plot span currently being viewed.
Note: When you move to a date which contains data that falls outside of the plot scale, the software
automatically re-scales so the all of the new data fits on the plot and then locks the scale at
the new settings.
LOCK AXIS ICON
Pause Plot Calculation
You may stop the program from “drawing” a plot at any time by pressing Esc.
The program will stop calculating and drawing the plot as soon as it is possible
and wait for further input before continuing. This feature can be especially useful
on slower machines or larger plot spans when you want to make a change without waiting for the plot to finish drawing.
View Database Information
Double-clicking on any location in a plot will open the Browse window (see
“Using the Browse Window” on page 59) to view the raw data for that time and
date.
69
USING THE SOFTWARE
Using the Plot Window
View Details
Click and drag to select a portion of the plot you wish to see in detail. The software will zoom in on that section of the plot, using the closest possible plot span.
CLICK AND DRAG TO SELECT
Zoom In/Out
To “zoom in” one plot span (for example, to go from a plot span of a Week to a
plot span of 3 Days), click on the Zoom In icon, press F3, or choose Zoom In from
the Plot menu. To “zoom out” one plot span (for example, to go from a plot span
of 3 Days to a plot span of a Week), click on the Zoom Out icon, press F4, or
choose Zoom Out from the Plot menu.
ZOOM IN & ZOOM OUT ICONS
70
USING THE SOFTWARE
Using the Plot Window
Plotting Data From More than One Date (Overlay)
The software features an “overlay” plotting mode which enables you to plot data
from more than one day on a single plot. Overlaying is only possible when you
have a single variable plotted.
1. Choose Overlay from the Plot menu or press F9.
The Overlay dialog box appears. The single date currently plotted appears in
the Plot Dates list. The dates of all data in your database appears in the dates
Available list.
OVERLAY
2. To add a date to the plot, double-click on a date in the Dates Available list or select a
date and choose Add.
All dates which are going to be plotted in the Overlay plot appear in the Plot
Dates list (you may have a maximum of 10 dates plotted). To remove a single
date from the plot, double-click on the desired date in the Plot Dates list (or
select the date and choose Remove). To remove all but the original date from
the Plot Dates list, choose Clear.
3. If you want to select custom colors for overlaid dates, select the desired date in the
Plot Dates List and choose Color.
Windows’ Color dialog box appears. Choose or create the desired color in
which you want the date plotted. Consult your Windows’ documentation for
instructions on choosing or creating colors.
4. To view the Overlay plot, choose OK.
The software plots data for all selected dates. Note that the span button and
the zoom icons disappear (you may not zoom in/out, change plot spans, or
view details while viewing an overlay plot) and the axis info buttons now display date information instead of variable information. While viewing overlay
plots, you may scroll through dates using the scroll bar or left/right arrow
keys; all plotted dates will shift by the same amount as you scroll. You may
also change the variable you are plotting by choosing a new variable from the
variables box or Add/Remove sub-menu, or by pressing the up/down arrow
keys.
71
USING THE SOFTWARE
Using the Plot Window
5. To return to normal plot operation, Choose Overlay from the Plot menu (or press F9) to
open the Overlay dialog box and choose Overlay Off.
The software returns you to the Plot window. The only date plotted will be the
top date from the Plot Dates list.
Plotting Data from the Previous Year (Last Year)
The software can quickly compare plotted data to data for the same period from
the previous year. For example, if you are viewing a 3-day plot span starting on
March 1, 1997, this feature will quickly show you, on the same plot, the data for
March 1, 1996.
Note: Obviously, you cannot use this feature unless you have data from a previous year in your database.
▲ To view previous year’s data, choose Last Year from the Plot menu or press F10.
The software plots data for the previous year. Note that the span button and
the zoom icons disappear (you may not zoom in/out, change plot spans, or
view details while viewing last year’s data) and the axis info buttons now display date information instead of variable information. While viewing last
year’s data, you may scroll the date using the scroll bar or left/right arrow
keys. You may also change the variable you are plotting by choosing a new
variable from the variables box or Add/Remove sub-menu, or by pressing the
up/down arrow keys.
▲ To remove the previous years’ data, choose Last Year from the Plot menu or press
F10 again.
The software removes the second date and returns you to normal Plot operation.
Clear Entire Plot
To clear all variables from the plot (giving you a blank plot to work with), click on
the Clear Plot icon (next to the Title Bar) or choose Clear Plot from the Options
sub-menu in the Plot menu.
Saving and Opening Plots and Plot Templates
The commands added to the File menu when the Plot window is active allow you
to save and open plots and plot templates. When you save a plot, all information
is stored, including the date of the data currently plotted. When you open that
plot, it automatically loads all variables and settings to restore the plot to the exact
way it looked when you saved it. When you save a plot template, all information
except for the date is stored. When you open a plot template, the software loads
all variables and settings, but plots the data from whatever date is currently being
viewed.
▲ Open Plot
To open a previously saved plot, choose Open Plot from the File menu. Select
the desired plot in the Open dialog box and choose OK.
▲ Save Plot
To save a plot, choose Save Plot from the File menu or press Ctrl-S. Enter the
desired file name and choose OK.
72
USING THE SOFTWARE
Using the Plot Window
▲ Open Template
To open a previously saved plot template, choose Open Template from the File
menu. Select the desired plot template in the Open dialog box and choose OK.
▲ Save Template
To save a plot template, choose Save Template from the File menu. Enter the
desired file name and choose OK.
Plot Menu
The commands in the Plot menu allow you to create plots and
set various plot-related options.
▲ Make Default
To make the current plot the default plot (the plot which appears initially
whenever you open the plot window), choose Make Default from the Plot
menu or press Ctrl-M.
▲ Choose Date
To choose a specific date, choose Choose Date from the Plot menu, click on the
date button in the plot window, or right mouse click anywhere in the plot window. The Choose Date dialog box appears. Select the desired date from the list
and choose OK.
▲ Span Sub-Menu
To change the plot span of the plot, select the desired plot span from the Span
sub-menu.
▲ Options Sub-Menu
The commands in the Options sub-menu allow you to set a variety of plot
options.
▲ Left/Right/Time Gridlines
You may turn the gridlines on or off for the left axis, right axis, and time
axis separately. When the gridlines are on, a check mark appears beside
the menu command. To change the gridline setting from on to off (or vice
versa) choose the appropriate command from the Options sub-menu.
▲ Like Variable Same Scale
Turning this option on facilitates comparison of variables which use the
same unit of measure by forcing the software to use the same scale for any
variables which use the same unit of measure. When this option is on, a
check mark appears beside the menu command. To turn this option on or
off, choose Like Variable Same Scale from the Options sub-menu.
▲ Lock Left/Right Scale
To lock (or unlock) the axis of a plot, choose Lock Scale for the desired axis.
73
USING THE SOFTWARE
Using the Plot Window
▲ Choose Left/Right Variable
To choose the information you want displayed on either axis, choose
Choose Variable for the desired axis. A pop-up list appears next to the axis
information button. Select the desired variable from the pop-up list.
▲ Choose Left/Right Line/Bar
To select either a bar or line graph, choose Choose Line/Bar for the desired
axis. A pop-up list appears next to the Line/Bar button. Choose either Line
or Bar from the list.
▲ Edit Title
To edit the plot title, choose Edit Title from the Options sub-menu. The
software moves the cursor to the Plot Title text box.
▲ Edit Left/Right Min/Max
To edit the Min/Max setting for either axis, choose the appropriate command from the Options sub-menu. The software moves the cursor to the
appropriate Min/Max text box.
▲ Hide Variable Box
You may hide the Variables Box in order to maximize the size of your plot.
When the Variables Box is hidden, a check mark appears beside the menu
command. To turn this option on or off, choose Hide Variable Box from the
Options sub-menu.
▲ Clear Plot
To clear all variables from the plot (giving you a blank plot to work with),
choose Clear Plot from the Options sub-menu.
▲ Add/Remove Sub-Menu
To add a variable to the plot, choose the variable you want to add from the
Add/Remove sub-menu. To remove a variable from the plot, choose the variable you want to remove from the Add menu.
Note: Variables which are plotted have check marks next to their name.
▲ Overlay
To plot more than one date on the same plot, choose Overlay. (See “Plotting
Data From More than One Date (Overlay)” on page 71 for details.)
▲ Last Year
To quickly compare plotted data to data for the same period from the previous
year, choose Last Year. (See “Plotting Data from the Previous Year (Last Year)”
on page 72 for details.)
▲ Zoom In/Zoom Out
To “zoom in” one plot span (for example, to go from a plot span of a Week to a
plot span of 3 Days) choose Zoom In from the Plot menu or press F3. To
“zoom out” one plot span (for example, to go from a plot span of 3 Days to a
plot span of a Week) choose Zoom Out from the Plot menu or press F4.
74
USING THE SOFTWARE
Using the Plot Window
Colors Menu
You may change the color scheme used by the software in creating strip charts and plots. To change the color used for the plot
text, plot background, or any of the variables plotted by the software, choose the appropriate command from the Colors menu.
The software opens Windows’ Color dialog box from which you
may select or create a color. Consult your Windows’ documentation for instructions on choosing or creating colors.
COLOR
▲ Make Default
To save the current color scheme as the default, choose Make Default from the
Colors menu. If you make a change to a plot color and don’t choose Make
Default, the program will prompt you to save those color changes before you
close the Plot window.
Note: The strip chart window and the plot window use the same color scheme. Changing the
default color scheme in the one window will change the color scheme used in the the
other.
▲ Load Default
If you have made changes to the color scheme and want to return to a previously saved default color scheme (see above), choose Load Default from the
Colors menu. You can use this to quickly “undo” any changes you don’t like.
▲ Load Program Default
To load the color scheme in which the program originally displayed plots and
strip charts, choose Load Program Default from the Colors menu. To make
this color scheme your default once again, choose Make Default.
75
USING THE SOFTWARE
Using the Strip Charts
USING THE STRIP CHARTS
The strip charts are four line graphs, stacked one on top of another, onto which
you may plot any data contained in your database. Unlike the normal plots, however, strip charts can also be set to update at each archive interval allowing you to
view changes in weather conditions as they occur. Whenever you open the strip
chart window, the software automatically downloads data. Thereafter, as long as
the strip chart is in “auto update” mode, the software will download and update
the strip charts at each archive interval.
When you activate the Strip Chart window, a Strip Chart menu and a Color menu
are added to the main menu bar and two new commands (Open Chart and Save
Chart) are added to the File menu. The use of the Strip Chart menu, Open Chart,
and Save Chart are explained below. The use of the color menu is explained in
“Colors Menu” on page 80.
STRIP CHART WINDOW
76
USING THE SOFTWARE
Using the Strip Charts
Open Strip Chart Window
To open the strip chart window, choose Strip Chart from the Windows menu, click
on the Strip Chart icon in the toolbar, or press Ctrl-S. When you open the strip
chart window, the program automatically downloads any data in the station’s
archive memory.
Add Variable
To add a variable to a strip chart, select the desired chart (top, bottom, etc.) by
clicking anywhere within the chart. Choose Add/Remove from the Strip Chart
menu (to open the sub-menu). Then, choose the variable you want added to the
selected strip chart from the sub-menu. Note that any variables already plotted on
the selected strip chart have check marks next to their name.
Remove Variable
To remove a variable to a strip chart, select the desired chart (top, bottom, etc.) by
clicking anywhere within the chart. Choose Add/Remove from the Strip Chart
menu (to open the sub-menu). Then, choose the variable you want removed from
the selected strip chart from the sub-menu. Note that any variables already plotted on the selected strip chart have check marks next to their name.
Change Axis Information
Although you may have as many variables as desired on any strip chart, the axis
for each strip chart may only display information for one of those variables. To
choose the axis information you want displayed, click on the axis button for the
desired strip chart. A pop-up menu appears, containing the name (and color) of
the variables plotted on this strip chart. Select the desired variable from the popup menu.
AXIS BUTTON POP-UP MENU
Change Plot Span
Choose the desired plot span from the Span sub-menu in the Strip Chart menu. To
“zoom in” one plot span (for example, to go from a plot span of a Week to a plot
span of 3 Days) choose Zoom In from the Strip Chart menu or press F3. To “zoom
out” one plot span (for example, to go from a plot span of 3 Days to a plot span of
a Week) choose Zoom Out from the Strip Chart menu or press F4.
77
USING THE SOFTWARE
Using the Strip Charts
View Historical Data
You may use the scroll bar along the bottom of the strip chart window to view historical data on the strip charts. Clicking on the scroll arrows moves the strip chart
forward or backward one day at a time. Clicking the scroll bar moves the strip
chart one span at a time. Dragging the scroll box allows you to quickly find a specific date. As you drag the scroll box, watch the bottom of the window until the
desired date appears, then release the scroll box.
Note: Viewing historical data takes the strip chart out of auto update mode.
Place the Strip Chart Into Auto Update Mode
When you first open the strip chart window, the strip chart is automatically
placed into auto update mode. It will remain in that mode (downloading and
updating the charts at each archive interval) until you click on the scroll bar (to
view historical data) at which point it is automatically taken out of auto update
mode. To return to auto update mode, choose Auto Update from the Strip Chart
menu. If necessary, the software will download any data in the archive memory
before entering auto update mode. The strip charts will automatically move to the
most current date in the database.
View Database Information
Double-clicking on any location in the strip chart will open the Browse window (see
“Using the Browse Window” on page 59) to view the raw data for that time and date.
View Details
Click and drag to select a portion of the strip chart that you wish to see in detail.
The software will zoom in on that section of the strip chart, using the closest possible plot span.
Saving a Strip Chart Template
Strip chart templates save all information concerning which variables are plotted
on the four strip charts, what information is displayed on the axis for each strip
chart, and the plot span. It does not save any date information and, when opened,
will always show the latest data in your database and be placed into auto update
mode. To save the current strip chart as a template, choose Save Chart from the
File menu. Enter the desired file name and choose OK to save the template.
SAVE STRIP CHART TEMPLATE
78
USING THE SOFTWARE
Using the Strip Charts
Opening a Previously Saved Strip Chart Template
To open a previously saved strip chart template, choose Open Chart from the File
menu and choose the desired strip chart template file.
OPEN STRIP CHART TEMPLATE
Strip Chart Menu
The commands in the Strip Chart menu allow you to create
strip charts and set various strip chart-related options.
▲Make Default
To make the current strip chart the default strip chart (which
appears initially whenever you open the strip chart window), choose Make Default from the Strip Chart menu or
press Ctrl-M.
▲ Auto Update
When in auto update mode, the software downloads data from the archive
memory and updates the strip charts at each archive interval. To change the
auto update status, choose Auto Update from the Options sub-menu. When
the strip charts are in auto update mode, a check mark appears beside the
command name. When you change the auto update status to place the strip
charts into auto update mode, the software automatically downloads all data
in the archive memory and moves to the most current date in the database.
Note: Viewing historical data automatically takes the strip chart sout of auto update mode.
▲ Lock Axes
To lock (or unlock) the axes of all strip charts, choose Lock Axis from the
Options sub-menu. When the strip charts’ axes are locked, a check mark
appears beside the command name. Locking the axes will cause subsequent
plot spans (when viewing historical data) to use the same scale as the plot
span currently being viewed
Note: When you move to a date which contains data that falls outside of the scale, the software
automatically re-scales so the all of the new data fits on the strip chart and then locks
the scale at the new settings.
79
USING THE SOFTWARE
Using the Yearly Rainfall Database
▲ Add/Remove Sub-Menu
To add a variable to any of the strip charts, select the desired strip chart (to
make it active) and then select the variable you want to add from the Add/
Remove menu. To remove a variable from any of the strip charts, select the
desired strip chart (to make it active) and then select the variable you want to
remove from the Add/Remove menu.
Note: Variables which are plotted have check marks next to their name.
▲ Span Sub-Menu
To change the plot span of the strip charts, select the desired span from the
Span sub-menu.
▲ Clear Plots
To clear all variables from the strip charts, choose Clear Plots from the Options
sub-menu. The software prompts you to confirm that you want to clear all
data before it continues.
▲ Zoom In/Zoom Out
To “zoom in” one plot span (for example, to go from a plot span of a Week to a
plot span of 3 Days) choose Zoom In from the Strip Chart menu or press F3. To
“zoom out” one plot span (for example, to go from a plot span of 3 Days to a
plot span of a Week) choose Zoom Out from the Strip Chart menu or press F4.
Colors Menu
You may change the color scheme used by the software in creating strip charts
and plots. For instructions, see “Colors Menu” on page 75.
USING THE YEARLY RAINFALL DATABASE
The WeatherLink software keeps a separate rainfall database which enables you
to view accumulated rainfall totals broken down by month and year. If you have
existing data in your main weather database, the software will create the rainfall
database using the data stored in your main weather database. Once created, the
software updates the rainfall database after each download. It is also possible to
alter any existing entry in the rainfall database and to enter rainfall totals for
months and years which are not contained in your main weather database.
When the Yearly Rainfall window is active, a Rain menu is
added to the menu bar. This menu allows you to start a new
rainfall database, edit data, add years of rainfall data, or
delete years of rainfall data.
80
USING THE SOFTWARE
Using the Yearly Rainfall Database
Viewing the Yearly Rainfall Database
To open the Yearly Rainfall Window, choose Yearly Rainfall from the Reports
menu, click on the Yearly Rainfall icon in the toolbar, or press Ctrl-R.
Note: The first time you attempt to open the rain database, the software will prompt you to indicate
whether you want to create the rainfall database. Choose Yes to create the database (note
that depending on the size of your main weather database and the speed of your computer,
this can take some time).
YEARLY RAINFALL
The top section of the Yearly Rainfall window displays the amount of rainfall each
month for every year in your database and the total rainfall for each year. The bottom section shows the minimum, maximum, and average rainfall amounts for
each month and year in the database.
Note: Dashes indicate that no data exists for a particular month.
81
USING THE SOFTWARE
Using the Yearly Rainfall Database
Editing Yearly Rainfall Data
You may edit the data for any existing year or add entire years of rainfall data.
▲ Edit Data for an Existing Year
To edit data, double-click on any line in the rainfall database (or select the
desired line and press Enter or choose Edit from the Rain menu). The Edit dialog box appears. Change the data in any of the text boxes and choose OK to
save changes.
Note: Changes made to the rainfall database are not reflected in the main weather database
(and vice-versa, unless you start a new database). You must treat rainfall totals in both
databases separately.
EDIT
82
USING THE SOFTWARE
Using the Yearly Rainfall Database
▲ Add Data for an Entire Year
To add a year to the rainfall database, choose Add from the Rain menu. The
Add dialog box appears. Enter the year at the top of the box and the rainfall
amounts for each month into the appropriate text box. When finished, choose
OK to save.
ADD
Deleting Data
To delete an entire year‘s worth data from the rainfall database, select the desired
year and choose Delete from the Rain menu or press Delete. The software will
prompt you to confirm that you wish to delete data before continuing.
CONFIRM DELETION
83
USING THE SOFTWARE
Degree-Days
Start a New Rainfall Database
If you want to start the rainfall database over, choose New from the Rain menu.
You will be prompted to confirm that you want to continue. Your existing rainfall
database will be deleted and a new database constructed using whatever data
exists in your main weather database.
DEGREE-DAYS
The instructions below explain how to use the WeatherLink Software’s degreeday reporting feature to track the development of crops and/or pests. For information on degree-days, see “Degree-Days” on page 97. In order to use degreedays, you must determine the developmental threshold(s) for the desired crop or
pest. The base developmental threshold is the temperature at and below which
development stops. Above the base threshold, development increases until the
temperature reaches the upper threshold, over which development rate remains
constant. Information on degree-day thresholds is available from your county
agricultural agent or university agricultural extension service.
PC DEGREE DAYS
84
USING THE SOFTWARE
Degree-Days
Adding a Degree-Day Total
You need to enter a separate degree-day total for every individual crop, pest, etc.
for which you want to track degree-days.
1. From the PC Degree-Days list box, choose Add.
The PC Degree-Day Definition dialog box appears.
PC DEGREE-DAY DEFINITION
2. Enter the following information for each degree-day total:
▲ Name
Enter the name of the crop, pest, etc. into the text box.
▲ Start Date
Enter the starting date for degree-day calculations into the text box.
▲ Base Temp
Enter the base developmental threshold (the temperature at and below
which development stops) into the text box.
▲ Upper Temp
Enter the upper developmental threshold (the temperature at and above
which development rate remains constant) into the text box.
▲ Development Total
Enter the number of degree-days required for this crop/pest to develop
into the text box.
85
USING THE SOFTWARE
Degree-Days
▲ Degree-Day Calculation Method
Choose the method by which degree-days are calculated.
▲ Growing Degree-Day “Cut-Off” Method
The software uses the highest temperature and the lowest temperature
for a given day to calculate the average temperature for that day. Note,
however, that if the low temperature is below the base threshold, the
software uses the base threshold as the low temperature when determining average temperature for the day. In addition, if the high temperature is above the upper threshold, the software uses the upper
threshold as the high temperature when determining average temperature. For this method, both thresholds must be entered.
The difference between the average temperature and the base threshold is assumed to be the number of degree-days accumulated on that
day. (For example, if the average of the highest and lowerst temperatures was 24˚ above the base threshold, the software would assume 24
degree-days for the entire day.)
Note: Unless 15 hours worth of records exist in the database for a day (through 3pm),
the software will not calculate degree-days for that day.
▲ High/Low Method
The software uses the highest temperature and the lowest temperature
for a given day to calculate the average temperature for that day. Note,
however, that if the high temperature is above the upper threshold the
software uses the upper threshold as the high temperature when determining average temperature for the day. (If no upper threshold is
entered, the high temperature will not be “cut off” in this way.) For
this method, the upper threshold need not be entered.
The difference between the average temperature and the base threshold is assumed to be the number of degree-days accumulated on that
day. (For example, if the average of the highest and lowest temperatures was 24˚ above the base threshold, the software would assume 24
degree-days for the entire day.)
Note: Unless 15 hours worth of records exist in the database for a day (through 3pm),
the software will not calculate degree-days for that day.
▲ Integration Method
The software calculates degree-days using the average temperature for
an interval and the interval time. For example, if the average temperature during a 15 minute interval was 24˚ above the base threshold, the
software would calculate 0.25 degree-days dudring that interval (24˚ *
15 minutes in interval / 1440 minutes per day). The number of degreedays during each interval are added together to arrive at a degree-day
total. This method calculates degree-day totals more accurately than
the high/low method.
86
USING THE SOFTWARE
Degree-Days
3. To add a note to this degree-day total, choose Notes.
The software opens the note file for this degree-day total. You may enter any
desired notes into this file.
NOTE FILE
4. To view total degree-days since the start date, choose Calculate.
The software calculates the total degree-days since the start date and displays
the number of accumulated degree-days and the degree-days left until the
development total is reached.
DEGREE-DAYS CALCULATED
5. After entering all necessary information, choose OK.
The software saves the degree-day information for this crop/pest. Instead of
closing, the PC degree-day definition dialog box remains open so you can
enter information on the next crop/pest. When finished entering information
for all crops/pests, choose Done.
87
USING THE SOFTWARE
Degree-Days
Opening a Degree-Days Total
You may open a previously saved degree-day total to edit information, add notes,
view degree-day totals, etc.
1. To open a degree-day total, double click on the desired total or select it from the list
and choose Open.
The Degree-Day Definition dialog box for that total appears. At the bottom of
the dialog box, the name of the data file for this degree-day totals is displayed.
DEGREE-DAY DEFINITION
2. You may enter or change any information, add notes, or calculate degree-day totals as
explained in “Adding a Degree-Day Total” on page 85.
88
USING THE SOFTWARE
Degree-Days
Deleting a Degree-Day Total
To delete a degree-day total, select it from the list and choose Delete. The software
will prompt you to confirm that you want to delete the total before doing so.
PC Degree-Day Report
The software allows you to create reports on some or all of your degree-day totals.
The report is opened into Windows Notepad from which you may copy or print
the report information.
1. From the PC Degree-Days list, choose Report.
The PC Degree-Day Report dialog box appears.
PC DEGREE-DAY REPORT
2. Set the following report options:
▲ Format
Select either the long or the short report format.
REPORT FORMATS
89
USING THE SOFTWARE
Degree-Days
▲ Sort
Select the sort order. You may sort by the number of degree days remaining until the development total (which will show the totals closest to the
development total at the top of the report) or you may sort by name which
will show totals in alphabetical order.
▲ Degree-Day Selection check box
By selecting this check box and entering a number of degree-days into the
text box, you may choose to include only those crops/pests whose degreeday totals are within the specified number of degree-days of their development total.
3. When finished setting options, choose OK.
The software calculates and displays degree-days information. Depending on
which format you chose (long, short), the report shows you some or all of the
following information for each degree-day total:
▲ Start Date, Base Temp, Upper Temp
The report shows the start date and the base and upper thresholds you
entered.
▲ Total for previous 7 days
The report shows the total degree-days for each of the last 7 days.
▲ Total
The report shows the total degree-days since the start date.
▲ Development Total
The report shows the development total you entered.
▲ Deg-Days Left
The report shows the total degree-days left before the development total is
reached.
▲ Days to Go
The report shows the expected number of days before the development
total is reached. This calculation is based on the average number of
degree-days during the last three complete days.
90
5 TECHNICAL REFERENCE
This chapter covers several technical topics which may help you better understand and use the software.
ARCHIVE MEMORY VS. DATABASE
There are two places where the WeatherLink stores weather data: the archive
memory and the database.
Archive Memory
The archive memory is the weather information storage area in the WeatherLink
itself. At each archive interval the WeatherLink stores one record to archive memory. The WeatherLink has room in the archive memory for approximately 1 day of
weather data for each minute in the archive interval. For example, if you use the 1
minute archive interval, the WeatherLink may store approximately 1 day of data.
If you use the 30 minute archive interval, the WeatherLink may store approximately 30 days of data. If you use the 2 hour archive interval (120 minutes), the
WeatherLink may store approximately 120 days of data.
Note: To aid you in determining when you need to download, the software shows you what percent
of archive memory is full whenever you download data.
When the archive memory “fills” the WeatherLink overwrites old data each time
it stores a new record. Because of this, it is best to select the longest archive interval which suits your purpose. In addition, make sure to download data before
your archive memory fills or you will have gaps in your database.
Database
The database is the permanent record of data stored on disk. When you download, the software transfers all information in the archive memory to the computer and writes the information into the appropriate database files. If you do not
clear the archive memory when downloading data (see “Station Config” on
page 19), the software will incorporate any data that post-dates the existing database. The software will not overwrite existing data. This means that if, for example, your station loses power and, upon power up, begins logging data at the
default date January 1, this data will not make it into an existing database as it will
precede the most recent date.
As the software writes the data to database files, it calculates the average wind
chill and average dew point. The temperature/humidity index, Equilibrium
Moisture Content, and air density, on the other hand, are calculated by the software as needed.
The software stores data to disk in monthly blocks, each of which is a separate
data file in the weather station's directory. The name of the data file indicates the
year and the month of the data and has a three character file extension which indicates the station from which that data came.
91
TECHNICAL REFERENCE
Automatic Download
AUTOMATIC DOWNLOAD
The automatic download feature allows you to specify the times at which you
wish the WeatherLink Software to automatically download data from selected
stations (see “Auto Download” on page 31). As long as the computer is on and the
software is running, the software will prompt you (at the specified times) to indicate whether or not you wish to download data. If you are present, you may
choose OK to download or Cancel to quit the download. If you do not make a
choice within 10 seconds (if your computer is unattended, for example) the software automatically downloads data. If you have a remote connection, the software automatically dials and hangs up the connection for you. An entry is made
in the log file (see “View Log” on page 17) to indicate whether or not the automatic download was successful.
Note: The automatic download procedure is disabled if you are actually connected to a remote station at the automatic download time.
The software checks every 20 seconds to see if an automatic download is scheduled. If you have multiple stations scheduled for download, the software will finish the download of the one and then wait until the next “check point” to start the
download of the next one.
Under certain circumstances, the software will actually download data up to 10
minutes after the automatic download time. This feature allows the software to
automatically download data from a station if you launch the software a little
later than the automatic download time. For example, if a station is set to download at 12:00, and you launch the software at 12:05, the software will still download the station’s data.
Note: If you have set automatic clear and automatic download for the same time, the software performs the automatic download first.
AUTOMATIC CLEAR
The automatic clear feature enables you to specify a time at which you wish the
software to clear selected highs and lows (and rainfall totals) every day (see
“Auto Clear” on page 30).
As long as the computer is on and the software is running, the software will
prompt you (at the specified time) to indicate whether or not you wish to clear
highs/lows. If you are present, you may choose OK to clear or Cancel to quit the
automatic clear. If you do not make a choice within 10 seconds (if your computer
is unattended, for example) the software automatically clears the highs/lows. If
you have a remote connection, the software automatically dials and hangs up the
connection for you. An entry is made in the log file (see “View Log” on page 17) to
indicate whether or not the automatic clear was successful.
If an Auto Clear occurs while the bulletin or summary windows are open, the
software will update the highs and lows displayed in the open windows.
Note: If you have set automatic clear and automatic download for the same time, the software performs the automatic download first.
92
TECHNICAL REFERENCE
Calibration Numbers
CALIBRATION NUMBERS
To increase performance, the software maintains calibration numbers separately
from the weather station. If you do not set calibration numbers from the software,
the weather station and software will not “agree” on what the calibration number
is. Therefore, you must set all calibration numbers (temperature, humidity,
barometer) from the software.
The following explanation of how the station and software determine barometric
pressure may help you understand this better.
The weather station actually reads atmospheric pressure not barometric pressure.
When you set the barometric pressure from the station console, the station automatically calculates the difference between the barometric pressure you enter and
the atmospheric pressure it reads. This difference gets stored as the barometric
pressure calibration number. When displaying the barometric pressure, the station reads atmospheric pressure and adds the calibration number to determine
barometric pressure.
When you enter barometric pressure from the software, the software calculates
the calibration number and stores it in the weather station’s memory (in the same
way it would if you set the barometer from the station console) and in the station’s configuration file. The station calculates barometric pressure normally,
while the software reads atmospheric pressure from the station and the calibration number from the station configuration file in order to determine the barometric pressure.
If you enter barometric pressure (or any calibration number) from the software,
both the software and station will “agree” on the calibration number. If you enter
barometric pressure (or any calibration number) from the weather station console,
nothing gets stored in the station’s configuration file. The calibration number in
the software now differs from the calibration number in the station, and your bulletin readings and database will be incorrect.
Note: The software does not support wind speed calibration numbers.
DATABASE ORGANIZATION
Station Directory
When you create a new station the software creates a station directory (using the
first eight characters of the station name, not including any spaces and punctuation) in the root program directory. Inside of this directory, the software will create
subdirectories to contain station-specific files.
▲ DATANOTE
The DATANOTE directory contains any notes you have entered for database
records. The software assigns its own coded file names to database files. If you
want to delete a note, it is best to do so from the software. Do not rename a
note file.
▲ PLOT
The software automatically creates a PLOT directory into which you may
store plots, plot templates, and strip chart templates. You may, of course, save
plot and strip chart files into any directory you wish.
93
TECHNICAL REFERENCE
Database Organization
▲ DEGDAYS
The software automatically creates a DEGDAYS directory into which it stores
all PC degree-day information.
Station Configuration File
When you add a station, the software creates a station configuration file (called
“station.cfg”) in the station directory. Each station has its own discrete configuration file which saves the following program settings for the appropriate station.
▲ Station Configuration Settings
▲ Serial Port Settings
▲ Calibration Numbers
See “Calibration Numbers” on page 93.
In order to recognize a station, you will need a station configuration file (in the
same directory as the database files). When opening a station, the software locates
station configuration files and reads the station name from them. If you copy
database files (to share or transfer data, for example) make sure to copy the station configuration file with them. As long as the station configuration file is in the
same directory as the database files, you should be able to read the database files
normally.
Database Files
The software stores downloaded data in monthly files. Whenever you download,
the software saves database files into the open station's directory. The database
file name indicates the year and month of the data. The three character file extension indicates the station from which they were downloaded. Database files containing data stored at a 30 minute archive interval require approximately 36K of
disk space per month of data. The file size changes in a linear fashion depending
on the archive interval. For example, data stored at a 1 minute interval requires
approximately 1MB/month while the data stored at a 2 hour interval requires
approximately 9K/month.
You cannot combine database files. For example, if you download half of your
April data to one directory and the other half to another directory, you cannot
combine the two database files into a single file containing all of your April data.
(If you do not clear your archive memory, you may be able to download the data
into the correct file at a later date.) Take care when downloading to make sure the
correct station is the open station.
94
TECHNICAL REFERENCE
Weather Data Calculations
WEATHER DATA CALCULATIONS
The following section details how the software calculates the data for each
weather function to arrive at an entry for the archive memory or database.
Temperature
The Weatherlink samples the temperature reading from the station a number of
times during the interval and then averages all those readings to arrive at the
average temperature for the interval. The number of times the Weatherlink samples the temperature depends on the archive interval.
A RCHIVE I NTERVAL
S AMPLE R ATE
1 minute
every 5 seconds
5 minutes
every 5 seconds
10 minutes
every 5 seconds
15 minutes
every 8 seconds
30 minutes
every 15 seconds
1 hour
every 30 seconds
2 hours
every 60 seconds
High and Low Temperature
The first time the Weatherlink samples outside temperature during the interval it
writes that value into both a high and low register in memory. Every subsequent
time the Weatherlink samples the temperature, it compares the current value to
the value in the registers and if the current value is higher or lower, replaces the
old value with the current value. Whatever value is in the register at the time of
the archive gets written into archive memory.
Barometric Pressure
The Weatherlink samples the barometric pressure at the time of the archive and
writes that value into the archive memory.
Wind Speed
The Weatherlink samples the wind speed reading the same number of times per
interval as temperature and averages the readings together to arrive at the average wind speed for the interval.
High Wind Speed
The Weatherlink is constantly checking for a new high wind speed. The highest
wind speed value recorded during the interval gets written into archive memory.
Wind Direction
The Weatherlink samples the wind direction reading the same number of times
per interval as temperature. If wind speed is greater than 0 when the Weatherlink
samples wind direction, it places a “marker” into one of sixteen “bins” which correspond to the sixteen compass points. At the time of the archive, the Weatherlink
95
TECHNICAL REFERENCE
Weather Data Calculations
determines which bin contains the most markers and writes the corresponding
wind direction to the archive memory as the dominant wind direction.
Note: During intervals with very low wind speed, it is possible for no wind direction to be recorded,
because wind speed was always 0 when direction was sampled. In this case, wind direction
for the interval appears as a pair of dashes (--).
Temperature/Humidity Index
Temperature/humidity index (THI) uses the temperature and the relative humidity to determine how hot the air actually “feels.” When humidity is high (i.e., the
air is saturated with water vapor) the apparent temperature will be higher than
the air temperature because perspiration cannot readily evaporate into the surrounding air. Technically, THI is calculable only when air temperature is above
68° F (20° C) because it is a measure of heat stress, which is not significant at lower
temperatures. If temperature is below 68° F (20° C), the software reports THI as
being equal to outside temperature. Conversely, 125° F (52° C) is the highest T-H
Index for which calculation factors are available.
In terms of storage to the WeatherLink and database, temperature/humidity
index (THI) is a very special case. It is not stored in archive memory or in the database, rather it is calculated “on-the-fly” as necessary (for example, when plotting
or displaying database information). When THI data is needed, the software calculates an average THI for each archive interval based on the temperature and
humidity readings for the archive period.
Wind Chill
Wind chill is not stored in archive memory, rather it is calculated as the data gets
written to the database file. The software calculates wind chill based on the temperature and wind speed readings for the archive period (that is, the average temperature and the average wind speed during the interval).
Dew Point
Dew point is not stored in archive memory, rather it is calculated as the data gets
written to the database file. The software calculates dew point based on the average temperature during the interval and an approximation of the average outside
humidity during the interval. To arrive at an “average” outside humidity reading,
the software averages the outside humidity for the current archive interval and
the previous archive interval (if available). If no earlier entry exists in the archive
memory, the Weatherlink calculates dew point based on the current outside
humidity and the average temperature.
96
TECHNICAL REFERENCE
Weather Data Calculations
Rainfall
In calculating both daily and yearly rainfall totals for the software, the Weatherlink only checks the total rain register on the station. The Weatherlink compares
the current total rain value to the previous total rain entry in the archive memory
to determine the amount of rainfall which occurred during the interval.
▲ Setting or Clearing Total Rain
You must set and clear total rain from the software, not the weather station!
When you set or clear the Total Rain register from the software, the Weatherlink makes an internal note of the change so errors will not occur when calculating daily rainfall for the interval. If, however, you set or clear total rain from
the station, the Weatherlink does not make this internal note and may calculate an inaccurate daily rainfall amount for the interval (often a negative number).
Degree-Days
Because temperature plays an important part in the rate of development of plants
and many pests (especially insects), a measurement which takes into account the
accumulation of heat with passing time is necessary to predict maturation.
Degree-days provide a measure for calculating the effect of temperature on the
development of plants and/or pests. One degree-day is the amount of heat which
accumulates when the temperature remains one degree above the base developmental threshold for 24 hours. One degree-day is also the amount of heat which
accumulates when the temperature remains 24˚ above the base threshold for 1
hour.
Unlike strict time predictions of plant/pest development, degree-day predictions
hold true regardless of location or temperature fluctuations. As long as you know
the number of degree-days necessary for plant/pest development, you may use
degree-days as an accurate predictor. For example, you may know that it takes, in
general, three weeks for a specific pest to develop. What you will find, however, is
that the pest may take 4 weeks to develop in cooler weather and only 2 weeks to
develop in warmer weather. The time prediction can be off by up to a week in this
example, while the degree-day prediction should result in far greater accuracy.
The WeatherLink software uses the outside temperature data in conjunction with
the base and upper thresholds entered for each crop/pest to calculate degreedays. You may choose between three possible methods for calculating degreedays: “cut off,” high/low, or integration. (For a description of these calculation
options, see “Degree-Day Calculation Method” on page 86.)
Chilling Requirement
Certain fruit trees bear best when temperatures drop below specific levels for specific amounts of time during the dormant season. Chilling requirements provide a
measure of this dormancy. For more information, contact your local agricultural
agent or university agricultural extension.
97
TECHNICAL REFERENCE
Weather Data Calculations
Soil Temperature Hours
Soil temperature hours may be used to monitor the relative portion of time that
soil temperature is above freezing (or some other threshold) in order to select a
time to plant. For more information, contact your local agricultural agent or university agricultural extension.
Temperature/Humidity Hours
Certain pests (in particular, some molds) develop most aggressively under specific combinations of temperature and humidity. Each pest can be expected to
emerge when a specific number of temperature/humidity hours has accumulated. Temperature/Humidity hours, therefore, can be used to select the optimum
time for application of preventative measures. The use of pesticides can be minimized and, when needed, used more efficiently and effectively. For more information, contact your local agricultural agent or university agricultural extension.
Air Density
Air Density (the weight of 1 cubic foot of air) is an extremely valuable tool for racing enthusiasts, because it helps determine the optimal jetting under current
weather conditions.
Equilibrium Moisture Content (EMC)
Moisture content in wood affects both the size and strength of lumber. If one
knows the EMC of the storage or manufacturing area (which is derived using
temperature and humidity readings), one can also determine the moisture content
of the wood stored there.
Bad Data
Should a sensor get disconnected or malfunction, the software displays any “bad
data” recorded by that sensor as dashes (--). When you create a plot, the software
ignores “bad data,” and skips that point on the plot. You may enter dashes (--)
into the database using the database record editor (see “Edit a Record” on
page 61) to mark bad data points as well.
Note: A dashed wind direction reading does not indicate bad data. See “Wind Direction” on page 95
for an explanation.
98
TECHNICAL REFERENCE
Modem String
MODEM STRING
The following sections explain the modem initialization strings used by the software and what each part of the string means. Do not change the initialization
strings unless you understand what impact it will have, otherwise the software
may not be able to work with your fax/modem.
Station Modem Initialization String
The software automatically enters the following modem initialization string,
which should work with most modems: AT E Q V X4 S7=60. The individual components of the string have the following meaning.
▲ AT
This string precedes all Hayes commands.
▲ E
Turns echo off.
▲ Q
Tells the modem to return result codes.
▲ V
Tells the modem to return short form result codes.
▲ X4
Enables result codes 0-7 and 10.
▲ S7=60
Tells modem to wait a maximum of 60 seconds for remote modem to answer
and issue a data carrier.
The software can perform some troubleshooting of modem problems in the form
of error messages. In order for the software to provide error messages, any
modem initialization string you enter must contain the E, Q, and V strings.
Note: If you use another communications program after using the modem with the WeatherLink
Software, you may need to re-initialize the modem using the modem string expected by the
other program.
Auto Fax Modem Initialization String
The software automatically enters the following modem initialization string,
which should work with most fax modems: AT H &D0 E0 V1 &H1. The individual components of the string have the following meaning.
▲ AT
This string precedes all Hayes commands.
▲ H
Hangs up the modem if it is still connected.
▲ &D0
Overrides the default response on the data terminal line (DTR).
▲ E0
Disables command echo.
99
TECHNICAL REFERENCE
Command Line Options
▲ V1
Sets the result code to verbal mode.
▲ &H1
Sets the modem for hardware flow control. Note that not all modems support
hardware flow control.
COMMAND LINE OPTIONS
The following command line options allow you to perform specific program functions as the program loads (such as downloading, clearing highs/lows, or opening a specific station. In order to use a command line option, open the Properties
dialog box for the program icon (consult your Windows documentation for
instructions) and enter the command line options after PCLINK.EXE.
▲ Station Directory -o
If you have multiple stations, when the software loads, it also opens the station in the station directory specified.
▲ Station Directory -d
When the software loads, it will automatically download data from the station
in the station directory specified.
▲ Station Directory -c
When the software loads, it will automatically clear data from the station in
the station directory specified. If you have only one station, you do not need to
specify the station directory.
▲ Station Directory -p
Some printers can not print the plot axis labels vertically. We have seen this
on a HP IIP printer at 150 dpi. If you have a printer that is doing this, you can
use this command line option to force the printer to print the axis labels out so
you can read them. This applies to Plots and Strip Charts.
Examples:
▲ PCLINK.EXE Official -o
After loading the software, opens the station contained in the sub-directory
entitled “Official.”
▲ PCLINK.EXE Official -d -c
After loading the software, downloads and clears information from the station
contained in the sub-directory entitled “Official.”
100
TECHNICAL REFERENCE
Importing WeatherLink Data into Other Programs
IMPORTING WEATHERLINK DATA INTO OTHER PROGRAMS
When you create an export file (see “Export Records” on page 63) the software
creates a tab delimited text file. All that means is that the software creates a text
file which places each record on a separate row and inserts a tab between each
piece of data in that row. If you open the file in a text editor, it will look like this:
TAB DELIMITED EXPORT FILE
Most popular spreadsheet and database packages have the ability to open or
import tab delimited text files while maintaining the structure of the original
database. Consult your program’s documentation for instructions on importing
tab delimited text files. You may also open or import the file in most popular
word processor programs as a text file. Because the data columns are separated by
tabs, you may generally choose any desired font.
LEAP YEAR CORRECTION
The weather stations which work with the WeatherLink software do not read February 29 (Leap Day). Therefore, you will need to correct your database during a
leap year. The most important thing to remember is this: do not change the date
on the weather station from the station itself. Instead, follow one of the two procedures below, depending on whether or not your computer keeps track of leap
years (which you can determine by checking the date on your computer after February 29 to see if it has the correct date).
When you are within one week of February 29th in a leap year, the program will
automatically open a help file which informs you of the procedure for correcting
data in a leap year whenever you load the software.
Computer Keeps Track of Leap Years
If your computer keeps track of leap year itself, all you need to do is download on
or after February 29. The program will prompt you to confirm that you want to
correct data as it writes it to your database. Choose Yes to correct the data. When
finished, use the Set Time command to set the station to the correct date.
101
TECHNICAL REFERENCE
Backing Up and Restoring Data
Computer Does Not Keep Track of Leap Years
If your computer does not keep track of leap year itself, follow the procedure
below.
1. DO NOT DOWNLOAD DATA ON FEBRUARY 29.
Both your computer and weather station should read March 1.
2. Anytime after 2-29 you should set the correct date on your PC.
You should use the Window’s Time and Date control panel. Do not set the stations time and date at this time.
3. Download your data from the software.
The software will prompt you to indicate whether you want to correct data for
the leap year.
4. Choose Yes.
The software corrects data as it writes it to your database.
5. Set the correct date on your weather station from the software.
Be sure to clear your archive memory when given the option.
BACKING UP AND RESTORING DATA
Weather data is backed up and restored by dragging and dropping the pertinent
files via File Manager ( Windows 3.1x ) or Windows Explorer ( Win95 ). You may
back up files to a floppy disk, a separate hard disk backup folder, or both.
Note: For information on using File Manager or Windows Explorer, consult your Windows documentation.
Comprehensive Backup
Drag the entire subdirectory folder named after your database to the desired
floppy disk or hard disk backup folder.
Individual Month Backup
Individual months of data are located in the database subdirectory and have the
following format: YYYY-MM with a three letter file extension (the first three lettersof your station name). For example, weather data from a station called “Home”
from January 1997 will be in a file named 1997-01.HOM. (See “Database Files” on
page 94 for more information.)
To backup data from an individual month simply drag the file corresponding to
the desired month(s) to the desired floppy drive or hard disk backup folder.
Restoring Data
Drag and drop the desired file(s) from your floppy disk/backup folder into the
proper folder (the station directory) in the PCLINK4 directory. See “Station Directory” on page 93 for more details.
Alternatively, you may drag and drop the entire station folder from the floppy
disk/backup folder to the PCLINK4 program directory (overwrite all existing
files). Only do this if you are sure the data files on the backup disk/folder are current and
correct.
102
6 TROUBLESHOOTING GUIDE
The following section answers some of the most commonly asked questions about
the WeatherLink Software. Please consult this guide before contacting Customer
Support (510-732-7814). If your problem is not urgent, send us a description via
e-mail ([email protected]) or fax (510-732-9188). You can also check our web
site (www.davisnet.com/support/) for FAQ’s, troubleshooting information, and
a link to tech support.
COMMUNICATIONS PROBLEMS
?
Why can't the WeatherLink Software “communicate” with the WeatherLink?
If you are experiencing difficulty establishing communication between the
weather station and the WeatherLink Software, start by checking the weather
station's own diagnostics. To do this, you must remove all power to the
weather station and then restart the weather station by restoring power (with
the WeatherLink still attached). You should hear three beeps, each of which
occurs when the weather station passes one of its diagnostic tests. The first
beep occurs after approximately one second, the second after approximately 8
seconds, and the third after approximately 22 seconds. If you do not hear one
or more of these beeps, contact Davis Instruments at 510-732-7814.
If you hear all three beeps, see “Finding the Correct Serial Port” on page 12 for
instructions on checking you standard serial ports. If this identifies a serial
port other than the one you selected in station setup, try connecting to the
WeatherLink again.
If you still cannot connect or if the loopback test identifies the serial port you
already have selected, attempt to eliminate the following possibilities. If you
have questions on how to proceed, it is recommended that you contact your
PC vendor or PC technical support.
▲ You have a hardware device conflict.
▲ Your serial port uses a non-standard IRQ line.
▲ Your serial port is defective.
▲ The loopback connector or the WeatherLink adapter plug is bad.
?
How do I select the correct serial port?
If you can use the serial port in question with another program, simply determine the serial port to which that program is set. Otherwise, see “Finding the
Correct Serial Port” on page 12 for instructions.
PROGRAM PROBLEMS
?
Why are the readings on my station and the WeatherLink Software different?
The calibration numbers for the weather station and software may not agree.
Make sure you set all calibration numbers from the software. See “Calibration
Numbers” on page 93 for further explanation.
103
TROUBLESHOOTING GUIDE
Program Problems
?
The barometer graph on the bulletin does not “fill in” completely. Why?
When you first load the bulletin, the only case in which the barometer graph
will fill in completely is when you have data in your database for the span of
the barometer graph (that is, the past six hours). Make sure of the following:
▲ There is data in your database for the span of the barometer graph.
▲ The time and date of the stored barometer data is correct in your database.
▲ The time and date on the PC is correct.
▲ The time and date on the weather station are correct.
?
Why do I get strange daily rainfall readings?
Make sure you set total rainfall from the software (see “Set Total Rain” on
page 27). If you change the total rainfall from the weather station, it is very
likely that you will create an odd daily rainfall amount for the interval during
which you make the change. (see “Rainfall” on page 97.)
?
I have duplicate records in my database. Why?
If you do not download prior to changing the weather station’s time and date
(for a Daylight Savings time change, for example), you may get duplicate
records. Make sure to download before setting time and date. In addition, you
should be aware that the midnight records are duplicated so they appear in
each consecutive day. For example, a midnight record would appear at the
end of the data for November 22 and at the start of the data for November 23.
Using the record editor (see “Edit a Record” on page 61) to change the record
in one day does not change the record in the other day.
?
No wind direction reading (or dashes instead of a reading) appears in my database.
First, make certain that you did not select a Weather Wizard II-S or Perception
(neither of which have wind direction) in your station setup (see “Station Config” on page 19). Otherwise, you should simply be aware that if there is no
wind speed when the direction is being sampled, wind direction is not
recorded. During intervals with very little wind speed, no direction may be
recorded.
Note: Since high wind speed is sampled more often, it is possible to have a high wind speed
but no wind speed or direction.
?
104
My archive memory is empty and I know it should not be. What can I do?
First try using “Set Archive Interval” (page 24) to clear the archive memory
and see if this corrects the problem. You will lose any undownloaded data in
your archive memory, but all of you calibration numbers and alarm settings
will remain intact. If this doesn’t work, “reboot” your weather station (that is,
remove all power and restart the station). All data which has not been downloaded will be lost. You will also have to reset all settings (barometer, calibration numbers, etc.).
TROUBLESHOOTING GUIDE
AutoFax Troubleshooting
?
After successfully downloading, the data does not appear to be in my database. Where
is it?
The most distinct possibility in this case is that the time and date on your
weather station are incorrect (this can often happen if you have a power outage and forget to reset the time and date on the weather station) and therefore
the data was written into the wrong month, day, and/or time. Correctly set
the time and date on your weather station (see “Set Time” on page 23) and all
future data should download correctly.
It is also possible, if you have multiple stations, that you downloaded data
into the wrong station’s database. Make sure the desired station is open before
downloading.
?
When viewing data, dashes appear in place of a value for functions other than wind
direction. Why?
If no data was recorded by a sensor (for example, the sensor was disconnected) or if bad data was recorded for a sensor (for example, the sensor was
malfunctioning), the software dashes out the entry rather than showing
invalid data. You may use the record editor (see “Edit a Record” on page 61) to
correct these entries.
AUTOFAX TROUBLESHOOTING
?
The software is not finding the fax. Why?
Make sure your modem is configured to use COM port 1, 2, 3, or 4. If not, free
one of those COM ports and reconfigure the modem to use it.
If you have installed a modem using Windows 95's Modem Installation Wizard and it has automatically assigned it a COM port of 5 or higher, use the
modem's installation disk to configure the modem. Do not run the Modem
Installation Wizard in the control panel; Windows 95 will add the modem by
itself without allowing you to set the COM port.
?
What “class” should I use?
If your fax modem does not support Class 1, 2, or 2.0 you will not be able to
use the automatic fax feature. You will need to obtain a fax modem which
does support one of these classes. Consult your fax modem’s documentation
to be sure it supports the necessary classes.
Every modem is different (in terms of timing, fax capability, error checking,
etc.). First try faxing using the Class 2 or 2.0 setting if your modem supports it
(most newer modems do). Modems set to these classes will work better with
the Multiple Page option selected.
Note: Some US Robotics modems with defective Class 2.0 chips will not work when Class 2.0 is
selected. Change the setting to Class 1.
If your fax modem has only Class 1 capability (or if you have a slow PC) try
changing the Windows' communication driver. (Sometimes Windows' communication driver is not fast enough and a single page comes out, but the fax
machine times out and does not send appropriate "end of page" signals to the
computer). See “Changing Windows Communications Driver” on page 106
for instructions.
105
TROUBLESHOOTING GUIDE
AutoFax Troubleshooting
Changing Windows Communications Driver
The WFXCOMM.DRV (supplied on the install disk) significantly improves AutoFax performance over the default Windows driver (COMM.DRV) on many systems. This driver tends to produce more readable reports (each record is the same
height), and tends to work more reliably in multiple page mode. If your problem
is one of “readability” or if the multiple page option is not working, install the
WFXCOMM.DRV driver as explained below.
Note: This driver works with other 16 bit serial port applications. It is an improved communications
driver written by someone other than Microsoft.
1. Copy WFXCOMM.DRV from the installation disk to your Windows directory.
The file is also available on the web at: www.kiae.su:8090/kiarchive/windows/drivers/.
2. Edit the "system.ini" file (section: [boot]; line: comm.drv) to read:
comm.drv=wfxcomm.drv.
This line will typically read comm.drv=comm.drv initially. Consult your Windows' documentation for instructions on changing the system.ini file.
3. Reboot your system to make sure the change takes effect.
106
TOOLBAR ICONS
Open
Station
Download
Bulletin
Window
Plot
Window
Strip Chart
Window
Yearly
Rainfall
Database
Window
On-Line
(Hang Up)
This Month’s
NOAA Summary
View
Help
Print
Window
Exit
Program
HOT KEYS
Main Program Window
Strip Chart Window
Ctrl-A . . . . . . .Set Alarms
Ctrl-M . . . . . . Make Default
Ctrl-B . . . . . . .View Bulletin
Ctrl-P . . . . . . Print Strip Chart
Ctrl-C . . . . . . .Station Configuration
F1 . . . . . . . . . Context-Sensitive Help
Ctrl-G . . . . . . .Degree-Days Report
F3 . . . . . . . . . Zoom In
Ctrl-H . . . . . . .Hang Up
F4 . . . . . . . . . Zoom Out
Ctrl-I . . . . . . .Serial Port Settings
Ctrl-J . . . . . . .Automatic Download
Ctrl-K . . . . . . .Walkthrough
Ctrl-L . . . . . . .Download
Ctrl-O . . . . . . .Open Station
Ctrl-P . . . . . . .Print Active Window
Ctrl-Q . . . . . . .Open Plot Window
Ctrl-R . . . . . . .Yearly Rain Report
Ctrl-S . . . . . . .Open Strip Charts
Plot Window
Ctrl-D . . . . . . Choose Date
Ctrl-M . . . . . . Make Default
Ctrl-P . . . . . . Print Plot
F1 . . . . . . . . . Context-Sensitive Help
F3 . . . . . . . . . Zoom In
F4 . . . . . . . . . Zoom Out
F9 . . . . . . . . . Overlay Plots
F10 . . . . . . . . Last Year Plot
Ctrl-T . . . . . . .Set Time
Ctrl-U . . . . . . .Select Units
Database Window
Ctrl-V . . . . . . .View Download Log
Ctrl-D . . . . . . Choose Date
Ctrl-W . . . . . .Browse Database
Ctrl-N . . . . . . Add Note
Ctrl-X . . . . . . .Auto Fax Settings
Ctrl-P . . . . . . Print Records
Ctrl-Y . . . . . . .View Summary
Enter . . . . . . . Edit Record
Ctrl-Z . . . . . . .Close Window
Delete . . . . . . Delete Record
F1 . . . . . . . . . .Context-Sensitive Help
F1 . . . . . . . . . Context-Sensitive Help
F2 . . . . . . . . . .Sunrise/Sunset Report
Yearly Rainfall Window
F7 . . . . . . . . . .NOAA This Month
Enter . . . . . . . Edit Year
F8 . . . . . . . . . .NOAA This Year
Delete . . . . . . Delete Year