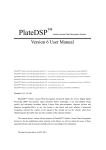
1
Clarity
ClarityStarted
Getting
Getting Started
ENG
Code/Rev.: M006/26A – 15 February 2008
Phone: +420 - 251 013 400
Fax:
+420 - 251 013 401
[email protected]
www.dataapex.com
© DataApex Ltd. 2008
Podohradská 1
155 00 Prague 5
The Czech Republic
®
Clarity®, DataApex® and
are trademarks of DataApex Ltd.
®
TM
Microsoft and Windows are trademarks of Microsoft Corporation.
DataApex reserves the right to make changes to manuals without prior notice.
Updated manuals can be downloaded from www.dataapex.com.
Clarity - Getting Started
Contents
1 Brief Description............................................................6
1.1 Hardware and software requirements....................6
2 Installation ....................................................................8
2.1 Software Installation.............................................8
2.1.1 Windows Vista instalation ...........................9
2.2 Hardware Installation ...........................................9
2.2.1 Hardware key (dongle) installation............. 10
2.2.2 The INT7 Card .......................................... 10
2.2.3 Installation of the U-PAD Converter........... 11
2.3 Device setup and wiring...................................... 11
2.3.1 Standard cable for Clarity station.............. 12
2.3.2 Chromatograph......................................... 12
2.3.3 Autosampler ............................................. 14
2.4 Clarity configuration........................................... 14
3 Qualification procedures .............................................. 17
3.1 Installation Qualification - IQ.............................. 17
3.2 Operational Qualification - OQ............................ 18
3.3 Performance Qualification - PQ ........................... 18
4 Program structure and control ..................................... 19
4.1 Main Clarity window........................................... 19
4.2 Instrument window ............................................ 20
4.3 Method Setup dialog ........................................... 21
4.4 Chromatogram window....................................... 22
4.4.1 Multi-detector chromatograms .................. 24
4.4.2 Summary results table.............................. 24
4.5 Calibration window............................................. 25
4.6 Single Analysis dialog ......................................... 26
4.7 Sequence window ............................................... 27
4.8 Program exit ....................................................... 28
4.9 Data update and consistency .............................. 28
5 First “Analysis” ............................................................ 29
5.1 Program start ..................................................... 29
5.2 Create new project.............................................. 30
5.3 Method development........................................... 31
5.3.1 Measurement and evaluation
parameters ............................................... 32
5.3.2 Create and assign a calibration ................. 33
5.4 Data Acquisition................................................. 33
3
Clarity - Getting Started
Contents
5.4.1 Sample description ................................... 33
5.4.2 Signal monitoring ..................................... 34
5.4.3 Analysis run ............................................. 35
5.4.4 Analysis monitoring .................................. 35
5.4.5 Analysis stop ............................................ 36
5.5 Chromatogram evaluation .................................. 37
5.5.1 Display chromatogram .............................. 37
5.5.2 Chromatogram processing ........................ 38
5.5.3 Chromatogram modifications .................... 39
5.5.4 Saving of a template method ..................... 40
5.6 Calibration ......................................................... 40
5.6.1 Opening a calibration file .......................... 41
5.6.2 Link the calibration file with
chromatogram or template method............ 41
5.6.3 Calibration curve use ................................ 42
5.7 Printing .............................................................. 43
6 Connecting Autosamplers ............................................ 44
6.1.1 AS + GC set – Active Sequence .................. 44
6.1.2 AS + LC set – Active Sequence ................... 47
6.1.3 AS - Passive Sequence (GC or LC).............. 48
6.1.4 AS – Active Sequence + AS Control +
A/D card .................................................. 49
6.1.5 AS – Active Sequence + AS Control +
digital acquisition ..................................... 50
7 Troubleshooting........................................................... 51
7.1 Locate your problem: .......................................... 51
7.2 Problems at station start .................................... 52
7.2.1 DEMO – missing HW Keylock .................... 52
7.2.2 DEMO – Keylock test failed ....................... 53
7.2.3 DEMO - WRONG S/N ............................... 53
7.2.4 DEMO - Trial Expired ............................... 54
7.2.5 DEMO (in the window header) ................... 54
7.3 Problems upon collection of data ........................ 54
7.3.1 Data Acquisition – non-functional ............. 54
7.3.2 Data Acquisition - Simulated .................... 55
7.3.3 Other Error Messages ............................... 56
7.4 Hardware key ..................................................... 57
7.4.1 Rockey USB dongle (re)installation ............ 57
4
Clarity - Getting Started
Contents
7.4.2 Rockey LPT dongle (re)installation ............. 58
7.4.3 Sentinel dongle installation ....................... 58
7.5 System Files (systeminfo.txt file) ......................... 59
7.6 Sleep Mode ......................................................... 60
7.7 Switching Users in Windows OS ......................... 60
5
Clarity - Getting Started
Brief Description
1 Brief Description
Clarity chromatography station is an effective
tool for the acquisition, processing and
evaluation of data from any gas or liquid
chromatograph with analog output and from
selected chromatographs with digital output.
In the maximum configuration, it is possible to
measure on up to four chromatographs
simultaneously, from which, each may be
equipped with up to 12 detectors.
The station is equipped with support tools for
automatic co-operation with chromatographs
and autosamplers.
Clarity supports fulfillment of the requirements of FDA’s directive 21 CFR Part 11.
The Clarity station automatically processes all
data acquired using CSW stations.
1.1
Hardware and software requirements
The Clarity station runs in any language
version of the following systems:
CB20
CB11
Net-PAD
U-PAD2
U-PAD
INT9
INT7
INT5
Check the compatibility of your workstation:
**
MS Windows NT(98/Me*)
MS Windows 2000
MS Windows XP/Vista
* Support for Windows 98/Me ended with Clarity version 2.4.1.
** U-PAD is functional only on MS Windows 98/Me, not on
Windows NT.
Note:
Only 32-bit versions of MS Windows XP and
Vista are supported by the Clarity station.
6
Clarity - Getting Started
Brief Description
PC Configurations:
Minimal
Recommended
MS Windows Vista
the same like MS Vista system requirements
MS Windows 2000/XP
PC Pentium III/700 PC Pentium 4/2 GHz,
MHz, 256 MB RAM
512 MB RAM
MS Windows
NT/(98/Me*)
PC Pentium/200 MHz, PC Pentium/450
32 MB RAM
128 MB RAM
Monitor
Resolution 1024x768,
64K (16 bit High color)
MHz,
Resolution 1280x1024,
64K (16 bit High color)
CD ROM drive, free slot for A/D converer (ISA/
PCI/USB), USB or LPT for a dongle
* Support for Windows 98/Me ended with Clarity version 2.4.1.
Verify that you have:
• A free slot (or port) for your converter:
INT7, INT9, CB20
- PCI slot
U-PAD, U-PAD2
- USB port
Net-PAD
- LAN connection
Note:
A full size PCI 2.0, 32 bit PCI slot is required. Low
profile or PCI Express slots cannot be used.
• A free USB slot or parallel (PRINTER) port for
the hardware key (depending on the type).
Caution!
For Windows NT the printer port hardware key
is necessary, since Win NT does not support
USB.
• A CD ROM drive for software installation
Note:
When utilizing discontinued hardware (e.g. INT5 or
CB11), consult the separate manual for
requirements and compatibility issues.
7
Clarity - Getting Started
Installation
2 Installation
Verify that the package is complete (packing
list).
Caution!
2.1
Install the Clarity before inserting any devices
(INT7, U-PAD, etc.).
Software Installation
Installation of the program requires 50 to 210
MB of free hard disk space depending on the
number of components you want to install.
Caution!
Ensure you have Administrator access rights in
your system before you proceed with the
installation.Clarity users must have read/write
access to the Clarity folders (C:\CLARITY and
all subfolders).
• Insert the CD into the drive.
• If the installation software does not start up on
its own, select the INSTALL.EXE file and run it.
• The software installation wizard will take you
through the installation procedure, including
the creation of a Clarity item in the Start Program menu and a Clarity icon
on the
Desktop.
Note:
If you are only evaluating the program, do not
enter the User Code and press the Skip button.
• During installation of the drivers following
message may occur: "Installation did not pass
Windows Logo testing". If this occurs, select
"Continue Anyway".
8
Clarity - Getting Started
2.1.1
Installation
Windows Vista installation
When installing the Clarity software, Windows
Vista may create a large number of warning
screens (depending on the security levels set).
These should be ignored for Clarity to function
correctly.
Note:
Caution!
2.2
It is highly recommended not to install the Clarity
software into the PROGRAM FILES directory. Also,
the User Account Control (UAC) in Windows
Vista should better be disabled when working in
the Clarity.
If you have already installed an older version of
Clarity software than 2.6, unplug the
hardware key during instalation of the Clarity
2.6 version.
Hardware Installation
The following chapters describe the installation
of a protective Hardware key (dongle) and the
brief installation of the most common
integration converters INT7 and U-PAD.
Caution!
Plug in the USB devices (ROCKEY USB hard
lock or U-PAD) only after the installation of the
Clarity station.
A detailed description of the hardware and its
installation
including
troubleshooting
is
available in separate manuals.
9
Clarity - Getting Started
2.2.1
Installation
Hardware key (dongle) installation
The hardware key needs to be installed and
present in the PC when using the Clarity
Chromatography Station.
The drivers will automatically be installed
during Clarity software installation. If the
installation did not proceed automatically
(older versions of MS Windows), refer to the
chapter 7.4 - Hardware key on pg. 57.
Caution!
Install Clarity software from the CD ROM first
and only then insert the key into the PC.
When you have the Sentinel hardware key,
refer to chapter 7.4.3.
Printer port hardware key (dongle)
Plug the hard lock in the printer port between
the printer port and any potential printer.
2.2.2
The INT7 Card
In Windows 2000/XP/Vista the drivers will be
installed automatically during the installation
of the Clarity software. Install the software
before attaching the device to PCI slot.
Caution!
Install the Clarity before inserting any devices
(INT7, U-PAD, etc.).
• Turn off the PC
• Insert the INT7 card into the PCI slot
• Start up the PC
a) MS Windows 2000/XP and later
In Windows 2000/XP/Vista the drivers were
installed automatically during the installation
of the Clarity software.
b) Previous versions of MS Windows
In
other
systems
then
Windows
2000/XP/Vista follow the procedure described
in the separate INT7 manual.
• The driver is now installed, proceed to setup
and wiring.
Note:
When installing multiple INT7 cards, a PC restart
is recommended after the installation of each card,
10
Clarity - Getting Started
Installation
in order to prevent the reassignment of INT7
acquisition channels between Clarity Instruments.
2.2.3
Installation of the U-PAD Converter
Note:
In Windows 2000/XP/Vista the drivers will be
installed automatically during the installation of
the Clarity software. Install the software before
attaching the device to USB slot.
• Install Clarity software from the CDROM.
• Connect the U-PAD with a cable to a USB port
on the computer.
• After connecting the converter, Windows will
recognize the new Plug and Play device and
will attempt to install a driver. The Found New
Hardware Wizard will appear:
• Select: "No, not this time."
• Select: "Install the software automatically".
• The rest of the installation will be carried out
automatically. In the lower left corner of the
screen, in the Start menu, select Settings –
Control Panel; selecting the System icon, verify
that the Device Manager tab contains a correctly
installed "Universal Serial Bus Controllers" "U-PAD v. 1.3" item.
2.3
Device setup and wiring
The
standard
Clarity
station
package
consisting A/D converter (INT7, U-PAD, NetPAD...) includes a cable set composed of signal,
starting and digital output for connecting the
Clarity station to the chromatograph.
11
Clarity - Getting Started
2.3.1
Installation
Standard cable for Clarity station
• Signal cables
Labelled “DET1” to “DET4” (according to the
number of channels), the cables are supplied
as standard without connectors with only
stripped, tinned endings – red (+), white (-) and
shielding (analogue ground).
• Starting (marker) cables
Labelled “IN1” to “IN4” (according to the
number of channels), ended with CINCH
connector. One cable with free leads [red (+),
shielding (digital ground)] for connection directly to the chromatograph or valve and one
cable ended with a button for cases where
starting contact is not available and it is necessary to perform start manually are supplied
for each starting cable.
• Cables of the digital outputs
Relay contacts labelled, "OUT 1R" to "OUT 4R"
(according to the number of channels), are
ended with free leads. They are used for
synchronizing autosamplers in the active
sequence without an AS Control module.
• At the converter end, the cable is always
ended with CANNON SUB D 37-pin connector.
2.3.2
Chromatograph
Connect cables according to one of the
following diagrams in Fig. 1. Use symmetrical
connection only in the case that you are sure
that the chromatograph/detector is equipped
with symmetrical output – it is necessary to
read through the instructions for the
corresponding chromatograph.
12
Clarity - Getting Started
Installation
Digital output (Relay)
Starting cable
Red
Shielding
Signal cable
Red
White
START (REMOTE, …)
1V (100mV, Hi, +, …)
0
(COM, AGND, …)
Shielding
NONSYMMETRICAL CONNECTION
Digital output (Relay)
Starting cable
Red
Shielding
Red
Signal cable
White
Shielding
SYMMETRICAL CONNECTION
Fig. 1.
START (REMOTE, …)
+
(+1V, Hi, …)
-
(-1V, Lo, …)
COM (0, GND)
Connection of Clarity with chromatograph
All current DataApex A/D Converters INT7,
INT9, U-PAD, U-PAD2 and Net-PAD use the same
standard INT7 Connector.
Note:
The INT5 cable (obsolete type) requires a
reduction to the INT7 card, which can be ordered
separately.
Detailed description of individual connectors
wiring is provided in the Reference Guide in the
chapter Technical Specification.
Principles of connection of signal cables:
Signal inputs of the A/D converters are
symmetrical: + (red), - (white), analogue earth
(copper braiding).
Caution!
Shielding must be connected. It serves not only
as the shielding, but also as the analogue earth
against which measurement takes place. In the
case of asymmetrical output of a detector (only
two connectors) shielding must be connected to
the white lead! No lead of the signal cable may
remain unconnected.
Try to connect to the output of the
chromatograph detector with the largest
possible level of signal, usually indicated as
INTEGRATOR (signal approx. 1V). The level of
the signal on the output marked RECORDER
is usually only approx. 10mV.
13
Clarity - Getting Started
Installation
For easier changing of the wiring we supply
SV8 Terminal board with screw contacts for
INT7 and U-PAD A/D Converters.
Connection of starting cables:
Starting input reacts to a change of the TTL
logical level (5V) or to a connection by any
contact (button, contact of relay).
Input implicitly reacts to a change from HIGH to
LOW (or closing of a contact). The input function
may be changed by switching the Down item of
Ext. Start/Stop section from the Method Setup Measurement dialog accessible from the Instrument
window using the Method - Measurement
command.
2.3.3
Autosampler
The most typical autosampler connections are
described in chapter 6 on pg. 44.
The autosamplers controlled directly using
an AS Control module (p/n A26) are described
in separate manuals.
2.4
Clarity configuration
Note:
Clarity is automatically preconfigured, however it
is recommended to review the following chapter to
assign custom detector names and signal units.
icon on
• Start the Clarity station with the
the desktop.
• Invoke the System Configuration dialog using the
System – Configuration command.
14
Clarity - Getting Started
Installation
Fig. 2.
System Configuration dialog
• Set the number of instruments in the Number
of Instruments field .
Note:
A larger number of instruments can be set than the
amount you have purchased. You will not be able
to measure on the surplus instruments (indicated
by a blue symbol of the curve on the tab), but you
may use them e.g. for “offline” preparation of
methods.
• Set the corresponding type of chromatograph
(GC/LC/EA/GPC...) for each instrument with
the Instrument Type switch .
From the Setup Control Modules list of
installed equipment on the left drag the
equipment according to your configuration into
the selected Clarity Instrument x tab in the righthand section of the dialog using the mouse or
the
button .
Note:
If necessary, add further equipment to the list on
the left using the Add button
in the lower lefthand section of the dialog.
15
Clarity - Getting Started
Installation
• The configuration dialog of the corresponding
card or equipment is displayed with a doubleclick on its icon or using the Setup button:
Fig. 3.
Dialog for setting the converter INT7
• Check that the correct number of channels is
displayed, and, if necessary, perform further
settings (e.g. set the names of the detectors).
Note:
You can change signal units using this dialog.
More accurate description can be found in the
manual of your A/D converter.
• Pres the OK button.
16
Clarity - Getting Started
Qualification procedures
3 Qualification procedures
The quality of analytical data is an issue that has
been gaining increased attention in many
laboratories these days. One of the requirements
for ensuring the reliability of generated results is
the validation of all instrumentation and
procedures that are used to acquire data.
For chromatography data stations usually three
levels of validation (qualification) are relevant:
3.1
Installation Qualification - IQ
Installation Qualification (IQ) is a procedure
confirming that the software was successfully
installed and that the installation contains all
the files of the correct version. Installation qualification is an integral part of the Clarity
software installation procedure.
How to use Installation Qualification?
• Install the Clarity station according to the
instructions of the Installation Wizard.
• After the installation has been completed, open
the Windows Start menu and go to the
Programs – Clarity –
IQ Report item.
• The IQ window will be opened.
• If the installation has been correctly performed
the
status
should
read:
"Installation
Qualification Test: Passed".
Fig. 4.
17
IQ window
Clarity - Getting Started
Qualification procedures
• If the Installation Qualification fails, it is
recommended to uninstall and then re-install
Clarity. If it fails again contact DataApex user
support.
Note:
The most common reason for obtaining a "Failed"
result of the qualification is due to the installation
of the station upgrade over an existing full version
of Clarity. This itself does not produce any errors
but since some of the files are preserved from the
original installation, the checksums will not fit.
• The Installation Qualification report can then
be printed, copied to the MS Windows
Clipboard or sent as an email.
3.2
Operational Qualification - OQ
Operational Qualification (OQ) is a procedure
confirming that the data station is performing
according to the manufacturer’s specification.
The Operation Qualification is provided by
Validation kit, which consists of a precise peak
generator and a set of methods and reports used
in the validation process. SST module, an
optional extension of Clarity, is also necessary.
The Validation kit (p/n: CVK) can be
purchased separately, as well as SST
Extension (p/n: A22).
3.3
Performance Qualification - PQ
Performance Qualification (PQ) is a procedure
confirming that the analytical system is fit for a
given type of analysis. Usually the overall system
performance is tested by this procedure with
respect to the requirements of the desired
application. The evaluation of the system
performance in Clarity is addressed using the
dedicated Extension System Suitability Test
(SST).
The SST module (p/n: A22) can be purchased
separately.
18
Clarity - Getting Started
Program structure and control
4 Program structure and control
The Clarity software has a hierarchic
structure.
After start-up the main Clarity window will be
displayed with the symbols of the configured
instruments.
After
clicking
on
the
chromatograph picture and entering the User
Name (more information on User Names can
be found in the Reference Guide) the Instrument
window will be displayed. This window is used
for acquisition and data processing on the
connected chromatograph.
Note:
4.1
The Clarity station works with so-called
Instruments. All detectors connected to one
Instrument share a common time base.
Main Clarity window
The main Clarity window is designed to set the
station’s configuration, select access rights and
basic directories for saving data.
Open
instrument
symbol
Instrument
name
Closed
instrument
symbol
Username
Fig. 5.
Clarity window
The System Configuration dialog (opened using the
icon or System – Configuration command)
is
where
number
of
connected
chromatographs, their names, the selection of
displayed symbols and the type of directly
controlled equipment are all established.
19
Clarity - Getting Started
Program structure and control
or System –
By setting access rights (
User Accounts command) you will allocate
each user a name and password and you will
determine the extent of authority for individual
operation types (e.g. access to files, possible
modification
of
calibration,
integration
parameters, etc.). Each user can set his/her
own station appearance. For help on how to set
a User Account, see Clarity Reference Manual.
4.2
Instrument window
The Instrument window is used for measuring
and evaluating an analysis from a selected
chromatograph. The window is displayed by
clicking on the symbol of the relevant
chromatograph in the station’s main window.
Depending on the number of the instruments,
up to four independent Instrument windows can
be displayed.
Note:
Instrument
name
As many Instruments must be set and configured in
the Clarity station, as you want to measure
independent analyses.
Displayed method
name
Information table
Sequence table
Chromatogram
name
Single Analsysis
start/stop
Sample description
Used method
name
Data acquisition
conditions
Chromatogram
display
Monitoring
GC/LC status
Calibration curve
creation
Direct GC/LC
control
Analysis conditions
Print
Project name
(=subdirectory)
Status line
Analysis monitoring
Analysis evaluation
conditions
Fig. 6.
Instrument window
Each Instrument window contains an information
table, status line and analysis-processing
20
Clarity - Getting Started
Program structure and control
diagram. Windows are distinguished by line
color in the analysis-processing diagram and
Instrument name in the header.
Windows enabling performance of required
actions on a given Instrument can be displayed
by clicking on individual icons in the diagram
or on commands from the menu.
Caution!
4.3
Certain Clarity windows (e.g. File Open or
parameter setting dialogs) are modal. If a
modal window is invoked you will not be able
to work with any other Clarity window until
you close it. It may seem as if the station does
not react to your commands. Use the MS
Windows shortcut Alt + TAB to switch to the
modal window and close it.
Method Setup dialog
Template method can be edited in the Method
Setup dialog invoked from Instrument window
using the corresponding command from the
Method menu. The parameters determining
and describing conditions for measurement
and evaluation are set in the method and
saved in the template method file.
Fig. 7.
Tabs of Method Setup dialog
The Method Setup dialog is divided into the
following sections accessible through icons
directly from the Instrument window.
Note:
Some tabs (e.g. AS, GC, LC) may not be present
depending on the configuration of the Instrument.
Event Table – with events triggering variety of
actions (digital outputs, run program, etc.)
AS – optional section for direct autosampler
control
Measurement
–
section
describing
measurement conditions and containing
optional setting of measurement duration
21
Clarity - Getting Started
Program structure and control
Acquisition – section of parameters for signal
measurement – voltage range, sampling rate,
…
Integration – section with an integration table
Calculation – section with parameters for
setting the type of calibration calculations
LC/GC– optional section
matograph control
for
direct
chro-
Advanced – section with advanced parameters
for chromatogram calculations
Note:
4.4
Individual instruments may add their own tabs
into the method setup window. Have a look at the
List of Controlled Instruments on the
DataApex website (www.dataapex.com). If you
cannot find your instrument there, please let us
know – the most frequently requested instruments
would be developed first.
Chromatogram window
The central window for display, modification
and evaluation of chromatograms. This window
can be displayed by clicking the
icon. Use
icon to display one of the stored chromatograms.
22
Clarity - Getting Started
Program structure and control
Selection of displayed Switch to instrument or
chromatogram
calibration window
Chromatogram Result table Other table tabs
modifications
Fig. 8.
Work with several
detectors/chromatograms
Splitters
Custom
label
Setting type of res ult
calculation
Chromatogram window
The Result Table for a selected chromatogram
can be found on Results tab. If it is not displayed
automatically, click on the label of the Results
tab in the bottom-left corner of the window or
use command Results - Result Table.
Modifications and evaluation of a chromatogram
can be found in Chapter 5.5.
Caution!
The Chromatogram window (and other Clarity
widows) uses Splitters dividing the window
into panes (graph, table, etc.). A double-click
around the splitter (the cursor changes to
)
enlarges the graph across the whole window.
To restore both panes drag the Splitter to the
desired location with mouse or use the View –
Show Both command.
TIP:
While working with enlarged part of
chromatogram, small orientation graph may be
useful. It can be displayed using Display –
Preview graph command.
23
Clarity - Getting Started
4.4.1
Program structure and control
Multi-detector chromatograms
In the case of multi-detector measurement, all
signals are saved in one chromatogram.
Individual signals from detectors are displayed
as independent curves. To work with individual
signals, it is necessary to select the required
signal from the Chromatogram menu or by
using the coloured symbol in the Overlay
toolbar. Each signal is independently worked
with, just as with a single-detector chromatogram in the Overlay mode.
Caution!
4.4.2
Remember that the Measurement and Calculation
tabs in the Instrument window, and also the
selection of a calibration file, are common for all
detectors. On the other hand, Results,
Performance and Integration tabs belong to each
detector independently.
Summary results table
You will make use of Summary Table
especially for reviewing and processing of
results from sequences. Here, you can easily
display all results from several chromatograms
at once.
24
Clarity - Getting Started
Program structure and control
Note:
Special add on module SST (p/n: A22) is available
for statistical processing of results and monitoring
of selected parameters.
Multiple chromatograms can be opened
simultaneously in the Overlay Mode. To switch
it on/off use the File – Overlay Mode menu
command or
icon.
4.5
Calibration window
The window for creating, modifying and
displaying calibration curves is displayed by
clicking on the
icon.
The Calibration Summary Table and possibly
also the calibration standard chromatogram are
displayed on the Compounds tab.
Calibration
Switch to instrument or
Calibration
Calibration
Global
Calibration
file selection standard display chromatogram window level selection type selection calibration table
Display of global calibration table
and calibration standard
Detailed display of
individual compounds
Fig. 9.
Calibration standard
name
Calibration window
By switching to the individual compounds tabs
you will display their calibration curves.
25
Clarity - Getting Started
Program structure and control
Fig. 10.
Note:
4.6
Individual compound tab
The procedure for creating a simple calibration and
its use is included in Chapter 5.6 on pg. 40.
Single Analysis dialog
The dialog for defining individual analysis
contains fields for sample description, sample
naming wizard and buttons for controlling the
analysis.
Fig. 11.
Single Analysis dialog
26
Clarity - Getting Started
4.7
Program structure and control
Sequence window
The
window
for
defining
sequential
measurement of several samples is displayed
using the
icon in the Instrument window.
Measuring is performed by rows in the table.
Each row can define measuring of a greater
number of samples by the same method or
multiple measurements of one sample.
Fig. 12.
Sequence window
ACTIVE or PASSIVE operation is possible. This
means that the start-up and duration of
individual analyses can be controlled by Clarity
station (ACTIVE Sequence) or by the autosampler
and chromatograph
(PASSIVE
Sequence).
Active sequence:
• Increases reliability of mutual synchronisation
between Clarity, autosampler and chromatograph.
• Is essential for controlling selected autosamplers using AS Control (p/n A26)
• Requires interconnection of a control signal
from the Clarity station to the autosampler.
TIP:
Results of sequential measuring can be displayed
in the Chromatogram window on the Summary tab
using the File - Open Chromatogram from
Sequence command (see ch. 4.4.2 - Summary
results table on pg. 24).
27
Clarity - Getting Started
4.8
Program structure and control
Program exit
Shut down the program using the System Exit command from the main Clarity window.
Before exiting you will always be informed of all
running measurements and unsaved files.
4.9
Data update and consistency
The Clarity station automatically keeps all
data updated and consistent. For example,
modification of the baseline is automatically
manifested in the Result table. A change of
any parameter updates all related calculations
and displayed results. Therefore, the station
does not need to contain such commands as
Integrate, Recalculate, etc.
28
Clarity - Getting Started
First “Analysis”
5 First “Analysis”
Description of an exemplary analysis will
demonstrate basic practical work procedures
with the Clarity station. Naturally, this
description does not exhaust all of the station’s
capabilities.
•
•
•
•
•
•
•
•
5.1
The First Analysis will guide you through
the following steps:
Program Start
Project assignement
Method
development
(data
acquisition
parameters, integration parameters, etc.)
Data acquisition (Sample description, Start,
online data monitoring, etc.)
Chromatogram modification (Integration, etc.)
Calibration (create and assign calibration file)
Creating new Template method
Reporting (Print)
Program start
Comments
One of the Clarity station’s key advantages is
immediate measurement without any lengthy
preparation and setting.
You can immediately run an analysis
measurement by clicking on the
icon in the
Instrument window and using pushbutton Run
in the opened Single Analysis dialog.
Note:
Measurement can also be started immediately
after opening the Instrument window by the start
signal directly from the chromatograph.
Proceed
• Click the
icon on the desktop or select Start
– Programs – Clarity – Clarity Chromatography Station.
Clarity window will appear.
29
Clarity - Getting Started
First “Analysis”
• Click on the picture of the gas or liquid
chromatograph.
5.2
Create new project
Comments
The default projects WORK1 - 4 are predefined
for each Instrument. It is recommended to
create your own new project to store your data.
The Project serves as a base unit to organize
corresponding
methods,
sequences,
chromatograms and calibration files.
Note:
There are several DEMO projects that contain
example data for selected separation techniqes.
These can be used for learning the station
operation. See the DEMO manual (available from
www.dataapex.com or on the installation CD) for
the step by step procedure.
Proceed
• Open the Project Setup dialog using the File –
Projects command in the Instrument window.
button to open New Project
• Click the New
dialog.
and click
• Set the name of your new project
OK.
Note:
The Project Setup dialog now displays the new
project.
• Specify the ANALYSIS
and CALIBRATION
subfolders (we recommend to leave the default
names).
• Click OK.
New MYPROJECT.PRJ
file in PROJECT folder
and corresponding MYPROJECT
folder in the
CLARITY root folder will be created.
30
Clarity - Getting Started
First “Analysis”
Fig. 13.
Creating new project
All template method (*.MET) and sequence
(*.SEQ) files will be stored in the MYPROJECT
folder.
Calibration files (*.CAL) and calibration
standards (*.PRM) will be implicitly stored in
CALIB and Chromatograms (*.PRM) in DATA
subfolders.
folder contains files shared
The COMMON
among projects (e.g. report styles).
5.3
Method development
Comments
Method contains parameters of the acquisition,
integration, device control, calculations, etc.
The template method opened in the Instrument
window will be copied to the chromatogram
after:
a) acquiring new chromatogram
b) reprocessing old chromatograms.
The template method is stored as a *.MET file in
the project directory (by default).
Note:
In our example the template methods will be stored
in the MYPROJECT folder.
Changes applied to the chromatogram copy of
the method (chromatogram method) affect the
respective chromatogram only.
31
Clarity - Getting Started
First “Analysis”
The calibration file (*.CAL) used for identifiing
and quantitating the peaks is linked by its
name
in
the
template
method
and
consequently in the chromatogram method.
In the next step we will prepare template
method for new chromatograms with general
acquisition parameters.
Later, after measuring the chromatogram, we
will modify further parameters (e.g. integration
table) in the chromatogram method.
Finally we will save the changed chromatogram
method as a template method.
5.3.1
Measurement and evaluation parameters
Comments
Certain parameters (voltage range, sampling
rate etc.) must be set prior to measurement.
Caution!
Changing of these parameters is blocked during
measurement because it would render the
measurement void.
Proceed
• Create a new NONAME method using the File New Method in the Instrument.
• Place the cursor over the chromatograph icon
to change the image to four icons.
• Clicking on one of the circled icons will display
the contents of the current template method in
the Method Setup dialog (see Chapter 4.3 Method Setup dialog on pg. 21).
• On the Measurement tab, fill in the description of
the chromatographic conditions and set up the
Enable Autostop, Run Time and External
Start/Stop options.
• On the Acquisition tab, set up the Range and
Sample Rate according to your detector
output and expected peak widths.
Note:
The peaks exceeding the specified range will be
cut and the respective area lost, however lower
32
Clarity - Getting Started
First “Analysis”
Note:
range settings will increase the resolution at the
baseline.
The 10 Hz (10 points per second) Sample Rate is
appropriate for most packed column separations in
GC or HPLC, for capillary GC or CE with peak
widths below 2 sec the 25 or 50 Hz should be
used.
• On the Integration tab, the Global Peak Width
and Global Threshold can be set according to
the expected peaks.
Note:
5.3.2
Default settings can be used in most cases. The
other entries are best modified in the Chromatogram
window on already measured chromatogram using
the graphical tools.
Create and assign a calibration
Comments
• On the Calculation tab, use the New button to
create the new calibration file. This will attach
it to the template method.
You can use the View button to see and modify
the file, especially the settings in the Calibration
Options dialog (Calibration – Options menu).
The calculation type and other settings may be
amended as well.
• The template method is now ready to acquire
the first chromatogram - a calibration standard
preferably.
5.4
Data Acquisition
5.4.1
Sample description
Comments
The
Chromatogram
File
Name
field
determines the chromatogram name.
Here you can use the tool for automatic
chromatogram naming
, e.g. ordinal
number using symbol %n, entering the date
using symbol %d, etc.
33
Clarity - Getting Started
First “Analysis”
It is advisable to include all information that
may be used for searching for the measured
chromatogram later on.
Proceed
• Click on the
icon and fill in the header of
the measured analysis (Sample ID, Amount,
etc.).
Fig. 14.
Single Analysis dialog
• Write the name of the chromatogram in the
Chromatogram File Name field (you can use
the wizard
Note:
5.4.2
icon to add variables).
If a file of the given name already exists, you will
be advised accordingly at the end of the
measurement.
Signal monitoring
Comments
It is possible to see the online signal from
detectors to verify that the detectors are
connected and to check the drift and noise.
Proceed
icon to display actual signal from
• Click the
detectors and check drift and noise (see Fig.
15 on pg. 36).
34
Clarity - Getting Started
First “Analysis”
• Finally, close the window using the
the File - Exit command.
5.4.3
icon or
Analysis run
Comments
Acquisition can be started externaly from the
autosampler or by pressing the Run button.
While running, the current measurement time
and RUNNING inscription will be displayed in
the Instrument window in the Status line under
the diagram.
Proceed
• Run the analysis using the external start or the
Run command in the Single Analysis dialog.
5.4.4
Analysis monitoring
Comment
Clicking on the
icon starts the Data Acquisition
window, which allows the monitoring of the
analysis progress.
Mark the area to be magnified by pressing and
holding the left mouse button and marking the
desired area and releasing the mouse button.
The original display can be returned using
icon or by double-clicking the left mouse
button in the graph area.
Data acquisition can be controlled using following
Single Run,
Sequence Run,
icons:
Sequence Resume,
Snapsot,
Abort and
Stop.
35
Clarity - Getting Started
First “Analysis”
Fig. 15.
Data Acquisition window
The measured chromatogram can be compared
to an already completed chromatogram, e.g.
solvent, calibration standard, etc. Two types of
chromatograms can be displayed in the
background:
• Simply by using the File – Set Background
Chromatogram
command
select
which
chromatogram is to be displayed in the
background.
• Or, if you defined an automatic subtracted
chromatogram in the Method Setup - Advanced
dialog, using the File - Show Subtraction
Chromatogram command will display the
chromatogram chosen for subtraction.
Note:
5.4.5
Any chromatograms in the background are
displayed only during data acquisition.
Analysis stop
The analysis can be stopped either by using
Stop command in the Single Analysis
the
dialog or automatically after the passing of the
Run Time set next to the Enable Autostop
checkbox in the Method Setup – Measurement
dialog.
At this moment the measured data are
integrated, evaluated and saved.
36
Clarity - Getting Started
5.5
5.5.1
First “Analysis”
Chromatogram evaluation
Display chromatogram
Comments
The completed analysis is automatically
displayed
in
the
Chromatogram
window.
Automatic analysis display can be prevented
by switching the
symbol next to the
icon
to the
symbol.
The Chromatogram window can also be displayed
icon.
manually by clicking directly on the
The required chromatogram can be selected
icon.
using the
You can magnify any section of the chromatogram in the same way as in Data Acquisition
window.
Proceed
Note:
If the chromatogram had opened automatically,
skip the next two steps.
• Click the
icon in the Instrument window to
invoke the Chromatogram window.
• Use the File – Open Chromatogram command
to open chromatogram.
• Click the left mouse button, hold it, select the
area and then release the mouse button to
zoom at the part of the chromatogram of
interest.
• Doubleclick in the chromatogram area will
restore the initial zoom.
37
Clarity - Getting Started
5.5.2
First “Analysis”
Chromatogram processing
Comments
After stopping an analysis it is advisable to
check and optimize the integration parameters.
The key parameters are Peak Width
and Threshold. Their simplified definition is:
• The Peak Width parameter determines that all
distinctly narrow peaks, compared to the defined value, will not be integrated.
• The Threshold parameter determines the noise
threshold, which means that only peaks of at
least double the height of the defined value are
detected.
Note:
In reality, however, the situation is more complex
as it always combines the mutual effects of both
parameters and the peak shape.
Fig. 16.
Method Setup - Integration
Both parameters can be applied to the whole
chromatogram (Global) or to a defined interval
(Local).
Global (Local) Peak Width and
The
Global
(Local)
Threshold
interactive
functions in the Chromatogram window will help
38
Clarity - Getting Started
First “Analysis”
to suggest the initial values based on the
narrowest peak of interest (peak width) and
baseline part with no peaks of interest
(threshold).
Proceed
• Switch to the Integration tab in the Chromatogram
window to see the amendments to the
chromatogram method integration table.
• Use the Global Peak Width and Global
Threshold interactive commands to optimize
the integration of peaks.
• Limit the integration only to areas where peaks
of interest are present using the Integration
Interval command
Note:
This will simplify the baseline detection around the
dead volume dips or baseline shifts.
The other integration tools can be used to get
the desired integration, when it is not possible
to do so by the previous parameters (see next
chapter).
5.5.3
Chromatogram modifications
If you wish to edit the automatically generated
baseline, you can manually modify the
chromatogram whenever you like by:
• either interactively using icons from the toolbars located on the left edge of the Chromatogram
window (or corresponding commands from the
submenu Chromatogram - Baseline, Peak
and Integrations). Modifications are saved in
the Integration table on the Integration tab.
• or explicitly enter and change parameters directly in the Integration table on the Integration
tab.
TIP:
The Integration sheet in the Chromatogram window is
used for modifying the current chromatogram. The
Integration sheet in the Method Setup dialog is used
for editing the whole method for newly measured
chromatograms.
39
Clarity - Getting Started
5.5.4
First “Analysis”
Saving of a template method
The changes made to the Integration table
affect only the current chromatogram. To use
those parameters for new chromatograms or
reprocess, the current chromatogram method
has to be saved as a template method using
the command Method - Save as Template.
Note:
5.6
In case the used template method was already
saved, you may need to save it under different
name, as it is not possible to overwrite method
currently opened in the Instrument window (or
elsewhere).
Calibration
Comments
The calibration file (*.CAL) used for identifying
and quantitating the peaks is refered by its
name in the template and consequently in the
chromatogram method.
Creation and use of calibration curves is an
extensive part of the Clarity station.
Calibration curves created from calibration
standards are saved in separate calibration
files. Each file can contain virtually an unlimited number of curves calibrated in up to
twenty concentration levels plus blank.
Acquisition of calibrated results is done by
creating calibration curves, saving them in a
calibration file and subsequent linking of a
calibration file to a chromatogram, and setting
the required type of calculation (external or
internal standard).
Note:
The station also allows for calibration at several
levels and multiple recalibration by optional
algorithm. Once again, all automatically or by
manual selection of individual compounds,
including interactive filling in or control of all data.
For all compounds you can also select the
calibration curve fit, zero type, type of response,
size of identification windows and improved
identification by method of reference peaks.
40
Clarity - Getting Started
5.6.1
First “Analysis”
Opening a calibration file
•
•
•
•
Note:
When a calibration file was specified in the
template method used for acquiring the
chromatogram, you can open it from the
Chromatogram window.
Use the View button in the Chromatogram Results window.
Use the
File - Open Standard (yellow icon)
command to open an integrated chromatogram
representing a calibration standard.
Click the Add All
(blue line) icon to
automatically transfer available data on each
peak to the calibration table.
In the displayed calibration table, modify
compound names in the first column .
Table fields can be edited after clicking on them
with the mouse.
• Fill in the known quantity for each compound
in the Amount column
under the number of
the current calibrated level.
Note:
If you have performed all steps as described, you
should see a straight-line single-point calibration
curve after clicking on the tab of any individual
compound.
• Finally, save the created calibration curves
using the File - Save command.
5.6.2
Link the calibration file with chromatogram or template
method
Comments
The calibration can be attached (applied) to a
chromatogram by selecting its file in the
Chromatogram – Results window (in Calibration
File (Peak Table) field.
41
Clarity - Getting Started
First “Analysis”
It can be also attached to a template method
file to be applied to new chromatograms (or to
reprocess existing ones) in the Method Setup –
Calculation dialog.
5.6.3
Calibration curve use
•
•
•
•
•
The simplest way of verifying the correctness of
the calibration is to link it to the
chromatogram from which it was created.
Move to the Chromatogram window (e.g. by
icon).
clicking on
icon to display the dialog for
Here, use the
chromatogram selection.
Open the chromatogram from which you
created the calibration curves. As calibration
standards are mostly saved in subdirectory
CALIB, first select this calibration subdirectory
(e.g. the
(red) icon in the top-right corner of
the Open Chromatogram dialog). Here, select the
chromatogram from which you created the
calibration curves.
Then set the calculation method:
Display the Chromatogram - Results tab.
In the right-hand section, use the Set button to
select your calibration file and select ESTD in
the Calculation field.
Now the results table should show known
quantities for compounds filled in by you,
including names and percentage ratios.
In the case of peaks for which no calibrated
compound was found based on conformity of
42
Clarity - Getting Started
First “Analysis”
the retention time, the quantity will be zero. If
the calibration compound is found and
allocated, but no calibration curve exists, the
Peak Type column will display the word Error.
Caution!
5.7
The chromatogram typically uses calibration
curves from the calibration file whose name is
shown in the right-hand section of Results tab of
the Chromatogram window. Therefore, this is
calibration by reference. Its advantage lies in
easy recalibration and changes in case of use
of a calibrated file for more chromatograms.
Nevertheless, all calibration curves are simultaneously saved directly in the chromatogram,
including their history. Results according to
these saved calibration curves (including then
valid chromatogram modifications) can be
recalled if you select the relevant method in the
dialog for chromatogram selection - Open
Chromatogram in the Method field.
Printing
Comments
To facilitate the printing, all the important
and
.
windows contain icons
The report style file actually defines the layout
and contents of the printed report.
Information is divided into subsections, corresponding to the displayed tabs. On each tab
you can select a more detailed arrangement.
To include the entire section in the report,
check the Print checkbox in the top-left corner
of the tab. The selected section is marked with
a tick on the tab label.
TIP:
A tab can also be selected by double-clicking the
left mouse button on the tab.
By default there are different report styles
predefined according to the dialog from which
43
Clarity - Getting Started
Connecting Autosamplers
you have invoked the printing commands. The
content relevant in the current window is
printed. You can easily customize the report
styles according to your preference.
Proceed
• Click on icon
in the Chromatogram window.
• Using the Printer command on the right-hand
side of the Report Setup dialog select and set the
printer.
• Modify current report style by selecting options
on the individual tabs. The settings can be
preserved (saved into the report style) using the
Save or Save As commands.
• Using the
icon you can display a print
overview and continue to print using the
icon.
6 Connecting Autosamplers
This chapter describes wiring of the
autosamplers.
The
configuration
varies
depending on the type of chromatograph (GC
or LC), sequence mode (ACTIVE or PASSIVE)
and presence of optional control modules for
direct control of chromatography equipment.
Note:
For detailed information on Clarity sequence
modes see ch. 4.7.
•
•
•
•
•
6.1.1
The typical configurations are:
AS + GC set – ACTIVE sequence
AS + LC set – ACTIVE sequence
AS – PASSIVE sequence (GC or LC)
AS – ACTIVE sequence + AS Control
AS – ACTIVE sequence + AS Control + digital
acquisition
AS + GC set – Active Sequence
With GC combined with Autosampler, the sample
cycle is typically governed by the GC. With the
commonly used temperature gradient, the
necessary cool down of the system takes variable
44
Clarity - Getting Started
Connecting Autosamplers
time. The sampler is thus synchronized with the
GC by a signal wire (READY), alowing next
injection only after the GC gets to the READY
state. The Autosampler performs the injection
and starts the GC using another signal wire
(START). Any autosampler that is used in the
Clarity Active Sequence without an AS Control
module must be synchronized by cable with the
Clarity station as well as with a chromatograph.
The INn starting cable should be plugged into
the synchronization output (INJECTION) of an
autosampler or GC. The OUTnR cable should
be connected to the synchronization input
between GC and autosampler.
Note:
Further information about Active Sequence is
available in chap. 4.3.2.2-3.of the Clarity User
Guide.
All commonly used autosamplers may be divided
in two groups:
• Autosamplers started by closing the contacts
on the input ( READY ).
• Autosamplers started by opening the contacts
on the input (READY).
Variant A - started by closing the contacts
The first scheme displays the wiring of an
autosampler that is preparing to inject after
closing the contact on its input.
45
Clarity - Getting Started
Connecting Autosamplers
Wiring of the autosampler,
that will be started by
closing the contact
at the READY input.
AUTOSAMPLER
READY
INJECTION
PC
INT 7
(U-PAD, INT 5)
OUTPUT
CHROMATOGRAPH
Digital output - OUTnR
READY
START
INPUT
EXT.
START/STOP
Fig. 17.
Starting cable - INn
START
OUTPUT
Wiring of the autosampler – variant A
The injection will start only after both serially
connected contacts (Clarity and the GC) are
closed.
After an injection, the autosampler will close
the INJECTION contact and thus the command
to start the temperature gradient program will
be given. At the same time, the chromatograph
will close the START contact and thus the
command to start the Clarity station
acquisition will be given.
If the chromatograph does not have a START
OUTPUT contact then the starting cable INn
must be connected directly to the INJECTION
output on the autosampler (this way, in fact,
parallel to the START INPUT contact of the
chromatograph).
To have the contact on the INT7 board (INT5 or
U-PAD) opened in the initial state, it is
necessary to set the Output Initial item in the
Digital Output Control dialog (accessible from the
Clarity main window) to HIGH.
Note:
The start output mapping of the Clarity to
individual digital outputs of the A/D converter can
be set in the bottom-right corner of the System
Configuration dialog (see Fig. 2 on pg. 15). A
detailed description of this can be found in the
Reference Guide.
46
Clarity - Getting Started
Connecting Autosamplers
Variant B - started by opening the contacts
In the second scheme there is autosampler
wiring that conversely waits for output
contacts to be opened. This requires different
connection (marked by circle).
The OUTPUT and READY contacts are
connected parallel to each other and the
autosampler will start its operation after both
contacts are opened.
To have the contact on the INT7 board (INT5 or
U-PAD) closed in the initial state, it is
necessary to set the Output Initial item in the
Digital Output Control dialog (accessible from the
Clarity main window) to LOW.
Fig. 18.
Note:
6.1.2
Wiring of the autosampler – variant B
The start output mapping of the Clarity to
individual digital outputs of the A/D converter can
be set in the bottom-right corner of the System
Configuration dialog (see Fig. 2 on p. 15). A
detailed description can be found in the Reference
Guide.
AS + LC set – Active Sequence
In LC systems, the autosampler typicaly governs
the timings. The eventual pump gradient or
detector programs are set independently.
47
Clarity - Getting Started
Connecting Autosamplers
Any autosampler that is used in the Clarity
Active Sequence without an AS Control module
must be synchronized with the Clarity station by
cables. The INn starting cable should be plugged
into the synchronization output (INJECTION)
of an autosampler and the OUTnR cable
plugged into the synchronization input
(READY) of an autosampler.
Note:
Further information about Active Sequence is
available in the Clarity User Guide.
Autosampler wiring in LC set
for Active Sequence
without using the AS Control module.
AUTOSAMPLER
READY
INJECTION
PC
DETECTOR
INT 7
(U-PAD, INT 5)
START
PUMP GRADIENT
OUTPUT
Digital Output - OUTnR
START
OUTPUT 2
OUTPUT 3
Starting cable - INn
Fig. 19.
Note:
Wiring of an autosampler in an LC set
The labels on the input and output contacts may
vary depending on the type of the autosampler.
When using additional devices (Detectors, LC
Pumps, etc.) it is recommended to connect
these devices independently to other digital
outputs of the A/D board. Each device will
then need a dedicated row in the Event table
to be started or stopped.
Note:
6.1.3
When the detector or pump start inputs are
connected in paralel to the Clarity start input,
problems are often encountered due to instrument
grounding.
AS - Passive Sequence (GC or LC)
The autosampler used in the Clarity Passive
Sequence (both GC and LC sets) does not
48
Clarity - Getting Started
Connecting Autosamplers
utilize the OUTnR digital output cable. All
timings are governed by the chromatograph;
Clarity only performs one analysis for each
start signal received. All synchronization only
includes external start up of data acquisition
in Clarity using the INn starting cable.
Fig. 20.
Wiring of an autosampler in Passive Sequence
A Passive Sequence has to be used e.g. in the
sets with Headspace autosamplers (without AS
Control module).
Caution!
Note:
6.1.4
It is not recommended to use the Passive
Sequence together with the Control modules.
Detailed information on using Passive Sequence
can be found in the Clarity User Guide.
AS – Active Sequence + AS Control + A/D card
When using the optional AS Control (p/n A26)
module, all communication is performed through
a separate data cable (usually a serial cable
connected to a COM port).
Caution!
Refer to the corresponding Clarity Control
manual for wiring specific to your control
module.
Following scheme corresponds to the set with
directly controlled autosampler without using the
digital acquisition, when data are acquired using
an A/D converter (INT7, U-PAD).
In such a case do NOT CONNECT the digital
output cable OUTnR.
The starting cable INn MUST BE CONNECTED.
49
Clarity - Getting Started
Connecting Autosamplers
Autosampler wiring in Active Sequence
with AS Control module.
PC
COM
RS 232
INT 7
(U-PAD, INT 5)
AUTOSAMPLER
READY
INJECTION
OUTPUT
Starting cable - INn
Fig. 21.
6.1.5
Wiring of an autosampler with AS Control
module + A/D converter
AS – Active Sequence + AS Control + digital acquisition
When using optional AS Control module in
combination with digital acquisition detectors
(e.g. the Duratec DDT3200 module), the
connection will be following:
Fig. 22.
Caution!
Wiring of the autosampler with AS control
module and digital acquisition
Refer to the corresponding Clarity Control
manual for wiring specific to your control
module.
50
Clarity - Getting Started
Troubleshooting
7 Troubleshooting
If you will not find your answers here, use the
www.dataapex.com website where the Support
menu will navigate you to frequently asked
questions (FAQ), Clarity email conference
archive or contact to DataApex helpdesk.
7.1
Locate your problem:
When troubles occur, the fastest way to find a
solution for it is to search for it in the following
index via the Dialog (window), in which the
problem occured, Error Messages that appear
or according to utilized Hardware. The name of
the window/dialog is visible in its header.
Note:
Names of individual Clarity Instruments appear
in the header instead of the common term
“Instrument”.
Dialog
-
Clarity........................................................ 52, 53, 54, 55
Data Acquisition.......................................................... 55
Instrument .................................................................. 54
Method Setup.............................................................. 54
Sequence .................................................................... 54
Single Analysis ............................................................ 54
System Configuration .............................................54, 55
Error Messages
-
DEMO – Keylock test failed .......................................... 53
DEMO – missing HW Keylock ...................................... 52
DEMO - Trial Expired .................................................. 54
DEMO - WRONG S/N .................................................. 53
DEMO (in the window header) ..................................... 54
Disabled (in the status line) ......................................... 54
Installation did not pass Windows Logo testing .............. 8
Other Error Messages.................................................. 56
Simulated (in Data Acquisition) ................................... 55
-
Hardware key .........................................................52, 53
Hardware
51
Clarity - Getting Started
Troubleshooting
Note:
You may find other Error Messages and solutions
for problems connected to particular hardware in
its respective manuals.
7.2
Problems at station start
7.2.1
DEMO – missing HW Keylock
The Rockey (or Sentinel) protective key (dongle)
must be plugged in either a parallel or USB
port and its driver must be properly installed.
Several problems may cause this error
message:
1.
Solution:
2.
Solution:
Your protective key may not be properly
installed. In the Control Panel select the System
icon, access the Device Manager tab and look for
"Universal Serial Bus Controllers" - "Feitian
Rockey4 USB" item (or "Feitian Rockey4" for
printer port hardlock). It can be also directly in
the root folder. If it is not there:
By using the ROCKINST.EXE program in the
HW_DRIVERS\ROCKEY subdirectory of the Clarity
workstation.
You might have inserted the USB token before
installing the Clarity station. Normally Clarity
station installs proper drivers. In this case, MS
Windows probably automatically installed
incorrect drivers.
In Windows XP it is recommended to use the
System Restore (menu Start – Help and
Support) to uninstall the incorrect drivers.
In older versions of MS Windows it is
necessary to uninstall the incorrect drivers and
manually install the correct one as described
above.
52
Clarity - Getting Started
Troubleshooting
3.
Solution:
Your protective key may not be correctly
connected.
a) For a dongle connected to a parallel port:
• Try to print on the connected printer.
• Ensure that the printing cable is not too long
(>3m).
• Disconnect the printer cable and connect the
dongle directly to the port of the computer.
b) For a USB dongle, check the following:
• A USB dongle may not be used in Win NT
• See whether the USB port is working (e.g. try
to connect a different device, etc.)
• See whether the HW driver is installed. In
this case the green LED on the dongle should
be lit.
7.2.2
DEMO – Keylock test failed
Solution:
7.2.3
Your protective key is probably damaged.
Contact technical support to replace damaged
key.
DEMO - WRONG S/N
Solution:
Note:
The User Code of the workstation does not
match with the code in the protective Hardware
key.
Use the Help – User Code command in the
Clarity window to enter the correct user code to
unlock your station.
The 16-digit User Code can be found on the
installation CD or on the attached CD
package inside one of the guides.
The User Code dialog does not distinguish upper
case and lower case.
If necessary, contact the manufacturer or your
dealer to request this code. You will need to
provide the serial number of the workstation.
TIP:
Be careful not to mix up “I” with “1” on keyboard.
53
Clarity - Getting Started
7.2.4
Troubleshooting
DEMO - Trial Expired
Solution:
7.2.5
DEMO (in the window header)
Solution:
7.3
7.3.1
Grey icon
File CLARITY.SNO is missing from the CLARITY
directory or is empty. It is missing or empty
erroneously or your Clarity station just ended
its trial period.
Copy the file CLARITY.SNO to the main (CLARITY)
folder from the installation CD (it can be
found in the DEMO subdirectory). After starting
up the workstation, enter the correct User
Code using the Help – User Code command.
If you only see the Demo caption in the header
of the main Clarity window without any further
description, you have installed the Clarity
Demo version.
Uninstall the Demo version and install the full
version of Clarity Software.
Problems upon collection of data
Data Acquisition – non-functional
with heading “Disabled” and non-functional command Monitor –
Data Acquisition
Other manifestations of this error are also:
Method Setup - Acquisition tab missing, Method –
Acquisition command non-functional, Run,
Stop, Abort commands non-functional in the
windows Single Analysis and Sequence). Possible
causes are:
a) Detector not allocated to instrument:
Solution:
Open the System Configuration dialog from the
main Clarity window using the command
System - Configuration and check the tab of
the corresponding instrument Instrument x. If it
has no allocated detectors, add them.
In the left-hand list Setup Control Modules
select the correct detector connected to the
A/D card you are using and drag it to the
corresponding instrument on the right.
54
Clarity - Getting Started
Troubleshooting
If your A/D card is not in the left-hand list
Setup Control Modules, add it using the Add
button and repeat the previous step.
Note:
See chapter 2.4 - Clarity configuration on pg. 14 for
detailed description.
b) You have a licence purchased for data collection from a
smaller number of instruments:
Solution:
Open the System Configuration dialog from the
Clarity window using the command System Configuration command and check the tab of
the corresponding instrument – Instrument x. If
the symbol of the curve in the tab header is
blue, this indicates an Instrument not usable
for measuring.
Check your serial number S/N for example
using the command Help - About from the
main window Clarity.
c) You are using Clarity Offline or a DEMO version, which does
not enable the measurement of chromatograms.
Solution:
Check whether there is a blue line with the title
OFFLINE displayed in the main Clarity window
under the symbols of the instruments, or the
title Demo in the window header.
d) There are problems with the A/D converter INT7 or U-PAD.
Solution:
7.3.2
Consult the more detailed troubleshooting
guide concerning the A/D converter in its
corresponding manual.
Data Acquisition - Simulated
The title “Simulated” is displayed in the Data Acquisition window
Solution:
The corresponding instrument only displays
the simulated curve (from the file CHANNX.DTA),
or is allocated as what is known as a DEMO
driver.
Open the System Configuration dialog from the
main Clarity window using the System Configuration command and check the tab of
the corresponding instrument - Instrument x.
55
Clarity - Getting Started
Troubleshooting
From the list of equipment allocated to the
instrument, take the Detector x from DEMO
driver field and draw the correct detector of
the A/D card you are using from the list on the
left.
If you only have Demo detectors in the lefthand Setup Control Modules list and your
A/D card is missing, open the Available Control
Modules dialog and using the Add button add it
to the configuration of the station. Then repeat
the previous step.
7.3.3
Other Error Messages
•
•
•
•
•
•
•
•
•
•
Note:
You can find the description of other Error
Messages and possible problems and solutions
for them in other manuals. Here is the list of
known possible Error Messages with reference
to their descriptions:
Board Malfunction (INT7, INT9)
Cannot create detector (INT7, INT9)
Cannot find driver file \\.\CSWINT70 (INT7)
Cannot find driver file \\.\CSWINT91 (INT9)
Cannot load device driver (U-PAD)
Cannot find first board (INT7, INT9)
Cannot find second board (INT7, INT9)
Card not found (INT7) – only older stations
Error Occurred During Setup (INT7, INT9,
U-PAD)
Cannot
establish
communication
with
DataApex U-PAD (U-PAD)
Some of these error messages can also appear if
using another hardware than it is listed above.
The remedy for such error message should be the
same for any device installed. Actualized versions
of Clarity Hardware manuals can be found on the
DataApex website (www.dataapex.com).
56
Clarity - Getting Started
7.4
Troubleshooting
Hardware key
7.4.1
Rockey USB dongle (re)installation
• Install Clarity software from the CD ROM.
Caution!
Be sure to have suitable drivers at hand before
inserting the USB token into the PC slot for the
first time!
• Connect the USB dongle to a USB port of the
computer.
INSTDRV.EXE
file
from
• Use
the
C:\CLARITY\HW_DRIVERS\ROCKEY\
folder
to
(re)install the Rockey drivers.
• If this did not help,try the following:
• After connecting the token, Windows will
recognize the new Plug and Play device and
will attempt to install a driver. The Found New
Hardware Wizard will appear:
• Select: "Search for a suitable driver for my
device."
• Select: "Specify a location" and then select the
path to the CD drive from which you have
installed the Clarity program, then the
HW_DRIVERS\ROCKEY subdirectory. If you have
installed the workstation before connecting the
device, you will also find an identical
subdirectory in the main directory of the
workstation. The driver is in a file named
ROCKEY4USB.SYS and its information file is
ROCKEY4USB.INF.
• The rest of the installation will be carried out
automatically. In the Start menu at lower left
corner of the screen select, find Settings –
Control Panel. Then, selecting the System
icon, verify that the Device Manager tab has the
correctly installed "Universal Serial Bus
Controllers" - "Feitian Rockey4 USB" item.
57
Clarity - Getting Started
7.4.2
Troubleshooting
Rockey LPT dongle (re)installation
•
•
•
•
•
•
•
•
7.4.3
If you encounter problems with printer port
Rockey hardware key, then:
Verify that the key is properly inserted in the
printer port.
In filemanager (e.g. Windows Explorer) navigate
to C:\CLARITY\HW_DRIVERS\ROCKEY\
Run the INSTDRV.EXE file to invoke the Setup
Wizard.
Select Repair in the first dialog and click Next.
In the second dialog check the "Install parallel
driver" checkbox.
Select the "Detect the parallel business"
radiobutton and click the Next button.
In the third dialog, click the Complete button.
You will be asked to Restart Windows.
Sentinel dongle installation
Untill Clarity 2.4.1 the dongle had to be
installed and present in the PC only when
using either the Clarity Offline version or
when using digital acquisition (e.g. via control
module) without an A/D converter. Later
versions always require dongle.
Printer port dongle
The drivers are automatically installed during
the installation of Clarity station.
Plug in the dongle in the the printer port
(between the printer port and any potential
printer).
USB dongle
Caution!
Do not insert the Sentinel USB token before
prompted to do so by the Sentinel Installer.
• Run the SENTINEL PROTECTION INSTALLER 7.3.2.EXE
program found in the \HW_DRIVERS\SENTINEL
directory of your Clarity CD.
• Connect the USB token to a USB port on the
computer when prompted to do so.
58
Clarity - Getting Started
7.5
Troubleshooting
System Files (systeminfo.txt file)
The C:\CLARITY\SYSTEMINFO.TXT file contains
valuable diagnostic information. Its contents
can also be displayed in the Clarity Help – About
– System Files dialog.
Fig. 23.
Help – About – System Files
The file contains following information (these
are examples of what the listings could look
like. The information in the program section
are visible in the Fig. 23):
System:
Microsoft Windows 2000 version 5.1 Service Pack 2
(Build 2600)
Registered Files:
CSWInt7.dll 11.05.2006 2.4.2.146 C:\Clarity\
Files:
CswAs300.dll 11.05.2006 2.4.2.146 C:\Clarity\
Clarity.exe 11.05.2006 2.4.2.146 C:\Clarity\
Program:
Clarity version 2.4.2.146
...
The last section, Program, shows information
on installed parts of the Clarity station. It
shows the version of Clarity and the date of
59
Clarity - Getting Started
Troubleshooting
the build, serial number of the station, number
of instruments allowed, extensions available,
purchased control modules, type and serial
number of the hardware key and list of
A/D converters/detectors connected to the
computer and configured in the station.
Solution:
7.6
The registered files entries should match the
installed files in version and location. When
there are some discrepancies, it may (but need
not) cause some problems.
If problems occur, use the Remove Clarity item
from Clarity group in Windows Start menu.
After that, reinstall Clarity.
Sleep Mode
Active Clarity station (with Instrument window
opened) prevents PC from entering sleep mode.
This is intentional; otherwise, Clarity will not
be able to ensure reliable data acquisition.
However, certain types of BIOS may cause
problems when the PC enters sleep mode even
when the Clarity Instrument window is closed. In
such case it is recommended to disable the
Power Saving features in both Windows OS (for
all users) and BIOS.
7.7
Switching Users in Windows OS
Switching between User profiles in Windows
may freeze the system.
This
is
caused
by
problems
with
communication between the A/D card and
system kernel. It is recommneded not to switch
users on computer where Clarity is running.
60