1
The Gator Module View
NOTE
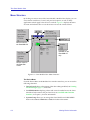
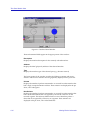
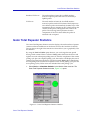
Up to 24 ports can be displayed simultaneously on a module. If a module has a higher port
density than 24 ports, Up and Down arrows will appear at the top and bottom of the port
stack so that you can scroll through the remaining ports.
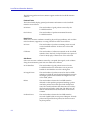
Front Panel Information
The section below the main port display provides the following device
information:
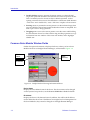
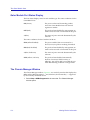
Connection Status
This color-coded icon indicates the current state of communication between
NetSight Element Manager and the Gator Module.
•
Green indicates the Gator Module is responding to device polls (valid
connection).
•
Blue indicates an unknown contact status — polling has not yet been
established with the Gator Module.
•
Red indicates the Gator Module is not responding to device polls (device is off
line, or device polling has failed across the network for some other reason).
UpTime
The amount of time, in a days hh:mm:ss format, that the Gator Module has been
running since the last start-up.
Port Status
If management for your device supports a variable port display (see the Gator
Module Port Status Display, page 2-6), this field will show the display currently
in effect. If only a single port display is available -- or if the default view is in
effect -- this field will state Default.
MAC
The physical layer address assigned to the Gator Module’s Ethernet interface.
MAC addresses are hard-coded in the device, and are not configurable.
Firmware
The revision of device firmware stored in the Gator Module’s FLASH PROMs.
Boot Prom, Time, and Date
These fields are not supported.
IP
The Internet Protocol address assigned to the Gator Module is displayed in the
title bar; this field will display the IP address you have used to create the Gator
Module icon. IP addresses are assigned via Local Management.
Viewing Device Information
2-3