1
HYPERION® ESSBASE® – SYSTEM 9
RELEASE 9.3.1
SPREADSHEET ADD-IN
USER’S GUIDE FOR EXCEL
Essbase Spreadsheet Add-in User’s Guide for Excel, 9.3.1
Copyright © 1989, 2007, Oracle and/or its affiliates. All rights reserved.
Authors: Keely Costedoat
The Programs (which include both the software and documentation) contain proprietary information; they are provided
under a license agreement containing restrictions on use and disclosure and are also protected by copyright, patent, and
other intellectual and industrial property laws. Reverse engineering, disassembly, or decompilation of the Programs, except
to the extent required to obtain interoperability with other independently created software or as specified by law, is
prohibited.
The information contained in this document is subject to change without notice. If you find any problems in the
documentation, please report them to us in writing. This document is not warranted to be error-free. Except as may be
expressly permitted in your license agreement for these Programs, no part of these Programs may be reproduced or
transmitted in any form or by any means, electronic or mechanical, for any purpose.
If the Programs are delivered to the United States Government or anyone licensing or using the Programs on behalf of the
United States Government, the following notice is applicable:
U.S. GOVERNMENT RIGHTS Programs, software, databases, and related documentation and technical data delivered to
U.S. Government customers are "commercial computer software" or "commercial technical data" pursuant to the
applicable Federal Acquisition Regulation and agency-specific supplemental regulations. As such, use, duplication,
disclosure, modification, and adaptation of the Programs, including documentation and technical data, shall be subject
to the licensing restrictions set forth in the applicable Oracle license agreement, and, to the extent applicable, the additional
rights set forth in FAR 52.227-19, Commercial Computer Software--Restricted Rights (June 1987). Oracle USA, Inc., 500
Oracle Parkway, Redwood City, CA 94065.
The Programs are not intended for use in any nuclear, aviation, mass transit, medical, or other inherently dangerous
applications. It shall be the licensee's responsibility to take all appropriate fail-safe, backup, redundancy and other measures
to ensure the safe use of such applications if the Programs are used for such purposes, and we disclaim liability for any
damages caused by such use of the Programs.
Oracle is a registered trademark of Oracle Corporation and/or its affiliates. Other names may be trademarks of their
respective owners.
The Programs may provide links to Web sites and access to content, products, and services from third parties. Oracle is
not responsible for the availability of, or any content provided on, third-party Web sites. You bear all risks associated with
the use of such content. If you choose to purchase any products or services from a third party, the relationship is directly
between you and the third party. Oracle is not responsible for: (a) the quality of third-party products or services; or (b)
fulfilling any of the terms of the agreement with the third party, including delivery of products or services and warranty
obligations related to purchased products or services. Oracle is not responsible for any loss or damage of any sort that you
may incur from dealing with any third party.
Contents
Chapter 1. Introduction to Release 9.3.1 . . . . . . . . . . . . . . . . . . . . . . . . . . . . . . . . . . . . . . . . . . . . . . . . . . 7
Migration to Release 9.3.1 . . . . . . . . . . . . . . . . . . . . . . . . . . . . . . . . . . . . . . . . . . . . . . . . 7
New Features in Release 9.x . . . . . . . . . . . . . . . . . . . . . . . . . . . . . . . . . . . . . . . . . . . . . . . 7
Duplicate Member Name Support . . . . . . . . . . . . . . . . . . . . . . . . . . . . . . . . . . . . . . . 7
Spreadsheet Add-in Registration . . . . . . . . . . . . . . . . . . . . . . . . . . . . . . . . . . . . . . . . 8
New Features in Release 7.x . . . . . . . . . . . . . . . . . . . . . . . . . . . . . . . . . . . . . . . . . . . . . . . 8
Compatibility with Smart View . . . . . . . . . . . . . . . . . . . . . . . . . . . . . . . . . . . . . . . . . 8
Visual Explorer . . . . . . . . . . . . . . . . . . . . . . . . . . . . . . . . . . . . . . . . . . . . . . . . . . . . . 9
Support for Excel 2003 . . . . . . . . . . . . . . . . . . . . . . . . . . . . . . . . . . . . . . . . . . . . . . . 9
Metadata Sampling . . . . . . . . . . . . . . . . . . . . . . . . . . . . . . . . . . . . . . . . . . . . . . . . . . 9
Currency Changes in the Sample Applications . . . . . . . . . . . . . . . . . . . . . . . . . . . . . . 9
Support for Excel 2002 . . . . . . . . . . . . . . . . . . . . . . . . . . . . . . . . . . . . . . . . . . . . . . 10
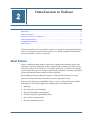
Chapter 2. Introduction to Essbase . . . . . . . . . . . . . . . . . . . . . . . . . . . . . . . . . . . . . . . . . . . . . . . . . . . . . 11
About Essbase . . . . . . . . . . . . . . . . . . . . . . . . . . . . . . . . . . . . . . . . . . . . . . . . . . . . . . . . 11
Typical Users of Essbase . . . . . . . . . . . . . . . . . . . . . . . . . . . . . . . . . . . . . . . . . . . . . . . . 12
Components of the Client-Server Environment . . . . . . . . . . . . . . . . . . . . . . . . . . . . . . . 12
The Server . . . . . . . . . . . . . . . . . . . . . . . . . . . . . . . . . . . . . . . . . . . . . . . . . . . . . . . 13
Essbase Spreadsheet Add-in . . . . . . . . . . . . . . . . . . . . . . . . . . . . . . . . . . . . . . . . . . . 13
The Network . . . . . . . . . . . . . . . . . . . . . . . . . . . . . . . . . . . . . . . . . . . . . . . . . . . . . 13
Essbase Application Products . . . . . . . . . . . . . . . . . . . . . . . . . . . . . . . . . . . . . . . . . . . . . 14
Essbase Spreadsheet Toolkit . . . . . . . . . . . . . . . . . . . . . . . . . . . . . . . . . . . . . . . . . . . 14
Essbase Partitioning Option . . . . . . . . . . . . . . . . . . . . . . . . . . . . . . . . . . . . . . . . . . . 14
Essbase Structured Query Language Interface . . . . . . . . . . . . . . . . . . . . . . . . . . . . . . 14
Essbase Application Programming Interface . . . . . . . . . . . . . . . . . . . . . . . . . . . . . . . 14
Essbase Currency Conversion . . . . . . . . . . . . . . . . . . . . . . . . . . . . . . . . . . . . . . . . . 15
Integration Services . . . . . . . . . . . . . . . . . . . . . . . . . . . . . . . . . . . . . . . . . . . . . . . . . 15
Developer Products . . . . . . . . . . . . . . . . . . . . . . . . . . . . . . . . . . . . . . . . . . . . . . . . . 15
Data Mining . . . . . . . . . . . . . . . . . . . . . . . . . . . . . . . . . . . . . . . . . . . . . . . . . . . . . . 15
The Multidimensional Database . . . . . . . . . . . . . . . . . . . . . . . . . . . . . . . . . . . . . . . . . . 15
Database Outlines . . . . . . . . . . . . . . . . . . . . . . . . . . . . . . . . . . . . . . . . . . . . . . . . . . . . . 17
Dimensions . . . . . . . . . . . . . . . . . . . . . . . . . . . . . . . . . . . . . . . . . . . . . . . . . . . . . . 17
Contents
iii
Members . . . . . . . . . . . . . . . . . . . . . . . . . . . . . . . . . . . . . . . . . . . . . . . . . . . . . . . . 18
Attributes . . . . . . . . . . . . . . . . . . . . . . . . . . . . . . . . . . . . . . . . . . . . . . . . . . . . . . . . 19
Formulas . . . . . . . . . . . . . . . . . . . . . . . . . . . . . . . . . . . . . . . . . . . . . . . . . . . . . . . . 19
Aliases . . . . . . . . . . . . . . . . . . . . . . . . . . . . . . . . . . . . . . . . . . . . . . . . . . . . . . . . . . 19
Consolidations . . . . . . . . . . . . . . . . . . . . . . . . . . . . . . . . . . . . . . . . . . . . . . . . . . . . 19
Chapter 3. Basic Tutorial . . . . . . . . . . . . . . . . . . . . . . . . . . . . . . . . . . . . . . . . . . . . . . . . . . . . . . . . . . . . 21
Getting Acquainted with Spreadsheet Add-in . . . . . . . . . . . . . . . . . . . . . . . . . . . . . . . . . 21
Registering Spreadsheet Add-in . . . . . . . . . . . . . . . . . . . . . . . . . . . . . . . . . . . . . . . . 22
Adding Spreadsheet Add-in . . . . . . . . . . . . . . . . . . . . . . . . . . . . . . . . . . . . . . . . . . . 22
Starting Spreadsheet Add-in . . . . . . . . . . . . . . . . . . . . . . . . . . . . . . . . . . . . . . . . . . 23
Installing the Essbase Toolbar for Excel . . . . . . . . . . . . . . . . . . . . . . . . . . . . . . . . . . 23
Using the Essbase Toolbar . . . . . . . . . . . . . . . . . . . . . . . . . . . . . . . . . . . . . . . . . . . . 24
Accessing Online Help . . . . . . . . . . . . . . . . . . . . . . . . . . . . . . . . . . . . . . . . . . . . . . 26
Enabling Mouse Actions . . . . . . . . . . . . . . . . . . . . . . . . . . . . . . . . . . . . . . . . . . . . . 26
Preparing to Begin the Tutorial . . . . . . . . . . . . . . . . . . . . . . . . . . . . . . . . . . . . . . . . . . . 28
Enabling Compatibility with Hyperion Smart View for Office . . . . . . . . . . . . . . . . . . 28
Setting Essbase Options . . . . . . . . . . . . . . . . . . . . . . . . . . . . . . . . . . . . . . . . . . . . . . 29
Following Guidelines During the Tutorial . . . . . . . . . . . . . . . . . . . . . . . . . . . . . . . . . 32
Reviewing the Sample Basic Database . . . . . . . . . . . . . . . . . . . . . . . . . . . . . . . . . . . . 33
Retrieving Data . . . . . . . . . . . . . . . . . . . . . . . . . . . . . . . . . . . . . . . . . . . . . . . . . . . . . . . 33
Connecting to a Database . . . . . . . . . . . . . . . . . . . . . . . . . . . . . . . . . . . . . . . . . . . . 33
Changing a Password . . . . . . . . . . . . . . . . . . . . . . . . . . . . . . . . . . . . . . . . . . . . . . . 35
Retrieving Data from a Database . . . . . . . . . . . . . . . . . . . . . . . . . . . . . . . . . . . . . . . 35
Canceling a Data Retrieval Request . . . . . . . . . . . . . . . . . . . . . . . . . . . . . . . . . . . . . 37
Restoring the Previous Database View . . . . . . . . . . . . . . . . . . . . . . . . . . . . . . . . . . . 37
Drilling Down to More Detail . . . . . . . . . . . . . . . . . . . . . . . . . . . . . . . . . . . . . . . . . 38
Drilling Up to Less Detail . . . . . . . . . . . . . . . . . . . . . . . . . . . . . . . . . . . . . . . . . . . . 41
Customizing Drill-Down and Drill-Up Behavior . . . . . . . . . . . . . . . . . . . . . . . . . . . . 42
Pivoting, Retaining, and Suppressing Data . . . . . . . . . . . . . . . . . . . . . . . . . . . . . . . . . . . 44
Pivoting Rows and Columns . . . . . . . . . . . . . . . . . . . . . . . . . . . . . . . . . . . . . . . . . . 44
Retaining a Data Subset . . . . . . . . . . . . . . . . . . . . . . . . . . . . . . . . . . . . . . . . . . . . . . 47
Removing a Data Subset . . . . . . . . . . . . . . . . . . . . . . . . . . . . . . . . . . . . . . . . . . . . . 49
Navigating Through the Worksheet Without Retrieving Data . . . . . . . . . . . . . . . . . . 49
Suppressing Missing Values, Zero Values, and Underscore Characters . . . . . . . . . . . . 52
Formatting the Worksheet . . . . . . . . . . . . . . . . . . . . . . . . . . . . . . . . . . . . . . . . . . . . . . . 54
Formatting Text and Cells . . . . . . . . . . . . . . . . . . . . . . . . . . . . . . . . . . . . . . . . . . . . 55
Displaying Aliases for Member Names . . . . . . . . . . . . . . . . . . . . . . . . . . . . . . . . . . . 61
Displaying Both Member Names and Aliases . . . . . . . . . . . . . . . . . . . . . . . . . . . . . . 62
iv
Contents
Repeating Member Labels . . . . . . . . . . . . . . . . . . . . . . . . . . . . . . . . . . . . . . . . . . . . 63
Working with Duplicate Member Names . . . . . . . . . . . . . . . . . . . . . . . . . . . . . . . . . 65
Creating Queries Using Essbase Query Designer . . . . . . . . . . . . . . . . . . . . . . . . . . . . . . . 67
About Creating and Changing Queries . . . . . . . . . . . . . . . . . . . . . . . . . . . . . . . . . . . 68
Creating Queries . . . . . . . . . . . . . . . . . . . . . . . . . . . . . . . . . . . . . . . . . . . . . . . . . . . 68
Saving Queries . . . . . . . . . . . . . . . . . . . . . . . . . . . . . . . . . . . . . . . . . . . . . . . . . . . . 74
Applying Queries . . . . . . . . . . . . . . . . . . . . . . . . . . . . . . . . . . . . . . . . . . . . . . . . . . 76
Deleting Queries . . . . . . . . . . . . . . . . . . . . . . . . . . . . . . . . . . . . . . . . . . . . . . . . . . . 77
Viewing Messages and Confirmations . . . . . . . . . . . . . . . . . . . . . . . . . . . . . . . . . . . 77
Accessing Help . . . . . . . . . . . . . . . . . . . . . . . . . . . . . . . . . . . . . . . . . . . . . . . . . . . . 78
Connecting to Multiple Databases from Essbase Query Designer . . . . . . . . . . . . . . . . 78
Applying Worksheet Options to Essbase Query Designer Results . . . . . . . . . . . . . . . . 79
Selecting Members . . . . . . . . . . . . . . . . . . . . . . . . . . . . . . . . . . . . . . . . . . . . . . . . . . . . 80
Saving and Disconnecting . . . . . . . . . . . . . . . . . . . . . . . . . . . . . . . . . . . . . . . . . . . . . . . 87
Saving a Worksheet . . . . . . . . . . . . . . . . . . . . . . . . . . . . . . . . . . . . . . . . . . . . . . . . . 87
Disconnecting from Essbase . . . . . . . . . . . . . . . . . . . . . . . . . . . . . . . . . . . . . . . . . . 87
Logging Off . . . . . . . . . . . . . . . . . . . . . . . . . . . . . . . . . . . . . . . . . . . . . . . . . . . . . . 88
On to Advanced Tasks . . . . . . . . . . . . . . . . . . . . . . . . . . . . . . . . . . . . . . . . . . . . . . . . . . 88
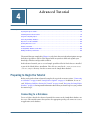
Chapter 4. Advanced Tutorial . . . . . . . . . . . . . . . . . . . . . . . . . . . . . . . . . . . . . . . . . . . . . . . . . . . . . . . . . . 89
Preparing to Begin the Tutorial . . . . . . . . . . . . . . . . . . . . . . . . . . . . . . . . . . . . . . . . . . . 89
Connecting to a Database . . . . . . . . . . . . . . . . . . . . . . . . . . . . . . . . . . . . . . . . . . . . 89
Setting Essbase Options . . . . . . . . . . . . . . . . . . . . . . . . . . . . . . . . . . . . . . . . . . . . . . 91
Performing Advanced Retrieval Tasks . . . . . . . . . . . . . . . . . . . . . . . . . . . . . . . . . . . . . . 94
Filtering Data . . . . . . . . . . . . . . . . . . . . . . . . . . . . . . . . . . . . . . . . . . . . . . . . . . . . . 94
Sorting Data . . . . . . . . . . . . . . . . . . . . . . . . . . . . . . . . . . . . . . . . . . . . . . . . . . . . . . 99
Retrieving Data into Asymmetric Reports . . . . . . . . . . . . . . . . . . . . . . . . . . . . . . . . 101
Drilling Down to a Sample of Members . . . . . . . . . . . . . . . . . . . . . . . . . . . . . . . . . 103
Working with Formatted Worksheets . . . . . . . . . . . . . . . . . . . . . . . . . . . . . . . . . . . 104
Preserving Formulas When Retrieving Data . . . . . . . . . . . . . . . . . . . . . . . . . . . . . . 109
Retrieving a Range of Data . . . . . . . . . . . . . . . . . . . . . . . . . . . . . . . . . . . . . . . . . . 112
Retrieving Data by Using a Function . . . . . . . . . . . . . . . . . . . . . . . . . . . . . . . . . . . 114
Retrieving Dynamic Calculation Members . . . . . . . . . . . . . . . . . . . . . . . . . . . . . . . 117
Specifying the Latest Time Period for Dynamic Time Series . . . . . . . . . . . . . . . . . . . 119
Using Free-Form Reporting to Retrieve Data . . . . . . . . . . . . . . . . . . . . . . . . . . . . . 122
Retrieving Data Using Visual Explorer . . . . . . . . . . . . . . . . . . . . . . . . . . . . . . . . . . 130
Using Linked Reporting Objects . . . . . . . . . . . . . . . . . . . . . . . . . . . . . . . . . . . . . . . . . 133
Linking a File to a Data Cell . . . . . . . . . . . . . . . . . . . . . . . . . . . . . . . . . . . . . . . . . . 134
Linking a Cell Note to a Data Cell . . . . . . . . . . . . . . . . . . . . . . . . . . . . . . . . . . . . . 137
Contents
v
Linking a URL to a Data Cell . . . . . . . . . . . . . . . . . . . . . . . . . . . . . . . . . . . . . . . . . 138
Accessing and Editing Linked Reporting Objects . . . . . . . . . . . . . . . . . . . . . . . . . . . 140
Connecting to Multiple Databases . . . . . . . . . . . . . . . . . . . . . . . . . . . . . . . . . . . . . . . . 144
Ways to View Active Database Connections . . . . . . . . . . . . . . . . . . . . . . . . . . . . . . 145
Ways to Access Linked Partitions . . . . . . . . . . . . . . . . . . . . . . . . . . . . . . . . . . . . . . . . . 145
Updating Data on the Server . . . . . . . . . . . . . . . . . . . . . . . . . . . . . . . . . . . . . . . . . . . . 147
Database Calculation . . . . . . . . . . . . . . . . . . . . . . . . . . . . . . . . . . . . . . . . . . . . . . . . . . 149
Creating Multiple Worksheets from Data . . . . . . . . . . . . . . . . . . . . . . . . . . . . . . . . . . . 150
Working with Currency Conversions . . . . . . . . . . . . . . . . . . . . . . . . . . . . . . . . . . . . . . 155
Retrieving Currency Conversion Data . . . . . . . . . . . . . . . . . . . . . . . . . . . . . . . . . . 155
Connecting to the Sample Currency Databases . . . . . . . . . . . . . . . . . . . . . . . . . . . . 156
Performing Ad Hoc Currency Reporting . . . . . . . . . . . . . . . . . . . . . . . . . . . . . . . . 157
Chapter 5. Using Drill-Through . . . . . . . . . . . . . . . . . . . . . . . . . . . . . . . . . . . . . . . . . . . . . . . . . . . . . . . . 161
About Drill-Through . . . . . . . . . . . . . . . . . . . . . . . . . . . . . . . . . . . . . . . . . . . . . . . . . 161
Before You Start . . . . . . . . . . . . . . . . . . . . . . . . . . . . . . . . . . . . . . . . . . . . . . . . . . . . . 163
Setting Essbase Options . . . . . . . . . . . . . . . . . . . . . . . . . . . . . . . . . . . . . . . . . . . . . 165
About the Samples Used in This Tutorial . . . . . . . . . . . . . . . . . . . . . . . . . . . . . . . . 168
Using Drill-Through . . . . . . . . . . . . . . . . . . . . . . . . . . . . . . . . . . . . . . . . . . . . . . . . . . 169
Accessing Drill-Through Reports from the Spreadsheet . . . . . . . . . . . . . . . . . . . . . . 169
Selecting Drill-Through Reports to View or Customize . . . . . . . . . . . . . . . . . . . . . . 174
Selecting and Ordering Columns . . . . . . . . . . . . . . . . . . . . . . . . . . . . . . . . . . . . . . 179
Ordering Data . . . . . . . . . . . . . . . . . . . . . . . . . . . . . . . . . . . . . . . . . . . . . . . . . . . 180
Filtering Data . . . . . . . . . . . . . . . . . . . . . . . . . . . . . . . . . . . . . . . . . . . . . . . . . . . . 182
Disconnecting from Essbase . . . . . . . . . . . . . . . . . . . . . . . . . . . . . . . . . . . . . . . . . . . . 187
Index . . . . . . . . . . . . . . . . . . . . . . . . . . . . . . . . . . . . . . . . . . . . . . . . . . . . . . . . . . . . . 189
vi
Contents
1
Introduction to Release 9.3.1
In This Chapter
Migration to Release 9.3.1......................................................................................................... 7
New Features in Release 9.x....................................................................................................... 7
New Features in Release 7.x....................................................................................................... 8
This chapter provides compatibility information for Oracle's Hyperion® Essbase® – System 9
Release 9.3.1 and previous releases of Essbase, including migration information and new feature
descriptions and enhancements.
Migration to Release 9.3.1
As you migrate or upgrade from previous releases of Essbase to Release 9.3.1, note that Release
9.3.1 of Essbase Spreadsheet Add-in works with Release 9.3.1 of Essbase Server. If the Essbase
system administrator upgrades Essbase Server to Release 9.3.1, earlier releases of Spreadsheet
Add-in work on a limited basis. Upgrade to Spreadsheet Add-in for Release 9.3.1 as soon as
possible.
See the Hyperion Essbase - System 9 Installation Guide for detailed information about migrating
from previous releases of Essbase.
New Features in Release 9.x
Duplicate Member Name Support
Spreadsheet Add-in Registration
Duplicate Member Name Support
Spreadsheet users may now view duplicate member names in applications. Additionally, you
may opt to view qualified names of members as Excel comments or to display qualified names
on the worksheet. In both cases, the qualified name includes the member name and the names
of its ancestors up to the level that uniquely defines the member.
For example, the member name "Albany" under both New York and California appears in a
Market dimension as well as in a Customer dimension. With duplicate member name support,
Migration to Release 9.3.1
7
you can choose to simply display "Albany" under New York and California in both dimensions,
and view the qualified member name in the cell comment. Alternatively, you can choose to
display the qualified member name for Albany in both dimensions directly on the worksheet.
See “Working with Duplicate Member Names” on page 65 for more information on duplicate
member name support.
Spreadsheet Add-in Registration
The Essbase Spreadsheet Add-in registration utility for Excel registers Essbase Spreadsheet Addin with Excel and includes it in your computer’s registry entries.
You may also unregister Spreadsheet Add-in from Excel. Unregistering is similar to uninstalling
in that it clears the registry entries and removes the Essbase menu from Excel; however, it leaves
the Essbase Spreadsheet Add-in components on your computer. If you want to put the
Spreadsheet Add-in back into Excel, run the register program again.
It is not required that you register Spreadsheet Add-in. If you experience problems with Essbase
Spreadsheet Add-in, it is recommended that you register.
See “Registering Spreadsheet Add-in” on page 22.
New Features in Release 7.x
Release 7.x included the following new features and enhancements:
●
“Compatibility with Smart View” on page 8, included in release 7.1.2
●
“Visual Explorer” on page 9, included in release 7.1
●
“Support for Excel 2003” on page 9, included in release 7.1
●
“Metadata Sampling” on page 9, included in release 7.0
●
“Currency Changes in the Sample Applications” on page 9, included in release 7.0
●
“Support for Excel 2002” on page 10, included in release 7.0
Compatibility with Smart View
Oracle's Hyperion® Smart View for Office can be installed on the same computer as the Essbase
Spreadsheet Add-in. Selecting a new check box, "Limit to Connected Sheets," ensures that
Spreadsheet Add-in functions properly alongside Smart View.
The "Limit to Connected Sheets" check box is part of the Mouse Actions settings located on the
Global tab of the Essbase Options dialog box in Essbase Spreadsheet Add-in.
Currently, when only Spreadsheet Add-in is installed, mouse clicks behave according to the
settings made in the Mouse Actions group, even when the worksheet is not connected to an
Essbase Server application and database. For example, if the Enable Double-Clicking option is
selected, double-clicking in an unconnected worksheet automatically brings up the Essbase
System Login dialog box.
8
Introduction to Release 9.3.1
When the new "Limit to Connected Sheets" check box is selected, the selections you make in the
Mouse Actions group are only valid for Essbase only for worksheets that are connected to an
Essbase application and database. Likewise, if the current worksheet is connected to a different
type of data source, such as a Hyperion Planning data source connected using Smart View, mouse
clicks are ignored by Spreadsheet Add-in.
If you plan to install Oracle's Hyperion® Smart View for Office on the same computer as Essbase
Spreadsheet Add-in, complete the steps in “Enabling Compatibility with Hyperion Smart View
for Office” on page 28.
Visual Explorer
Oracle's Hyperion® Essbase® Visual Explorer is a new tool accessed from the Spreadsheet Addin that helps you to analyze data in an Essbase database. Visual Explorer provides a query and
analysis interface for creating interactive summaries and reports of data in a graphical format.
These graphical summaries answer questions about topics such as totals, comparisons, outliers,
correlations, rankings, and trends—question that you may have about the information in an
Essbase database. You can choose to visualize data in various graphical formats including bars,
lines, Gantt bars, shapes, colors, and tables.
Support for Excel 2003
Essbase Spreadsheet Add-in is supported on Excel 2003, as well as Excel 2002.
Metadata Sampling
Essbase is a multidimensional database engine that provides support for ad hoc analysis. Such
analysis is entirely driven by the intuition of the analyst and can be time-consuming as data
volume increases. Large cubes tend to have more dimensions and sometimes more levels, making
hierarchical navigation very cumbersome.
Metadata sampling enables you to analyze large cubes with a focus on data trends or to
approximate information in the initial stages. Because you query on a “sample” of members,
retrieval is quick. Metadata sampling enables you to drill down on a portion of the vast amount
of members in an Essbase database in a fraction of the time that it usually takes to analyze the
whole database. You can view many samples in a small amount of time and make early decisions.
Later, you can follow with organized data exploration.
With the introduction of Hybrid Analysis, you can store part of an Essbase cube in a relational
database. Metadata sampling enables you to drill down on all of the data that you specify, whether
it is in Essbase or in an underlying relational database.
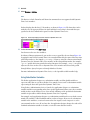
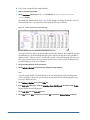
Currency Changes in the Sample Applications
With the introduction of the euro as the official currency of the countries of the European Union,
several currencies that were used in the Essbase sample applications no longer exist. In past
New Features in Release 7.x
9
versions of Essbase, portions of the sample applications used the currencies of Germany, France,
and Spain. References to these currencies have been replaced by references to the euro (EUR),
Swiss franc (CHF), and Swedish Krona (SEK), respectively.
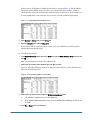
Also, where applicable, the abbreviated names of the currencies used in the sample applications
have been changed to reflect international standards for the representation of currency units.
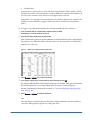
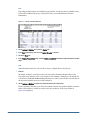
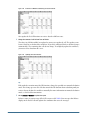
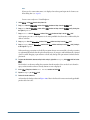
Table 1 is a complete list of the currencies used in the sample application and their respective
abbreviation,
Table 1
Currency Names and Their Abbreviations
Currency Name
Abbreviation
British Pound
GBP
Canadian Dollar
CAD
European Union Euro
EUR
Swedish Krona
SEK
Swiss Franc
CHF
United States Dollar
USD
Support for Excel 2002
Essbase Spreadsheet Add-in is supported on Excel 2002.
10
Introduction to Release 9.3.1
Introduction to Essbase
2
In This Chapter
About Essbase .....................................................................................................................11
Typical Users of Essbase ..........................................................................................................12
Components of the Client-Server Environment..................................................................................12
Essbase Application Products ....................................................................................................14
The Multidimensional Database ..................................................................................................15
Database Outlines .................................................................................................................17
This chapter provides an overview of Essbase and its users. It includes a description of the Essbase
client-server environment and the Essbase product suite. Finally, multidimensional database
concepts and database outlines are discussed.
About Essbase
Essbase is multidimensional database software that is optimized for planning, analysis, and
management-reporting applications. Essbase uniquely blends an innovative technical design
with an open, client-server architecture. The product enables you to extend decision support
systems beyond ad hoc queries and reports on historical performance to dynamic, operational
systems that combine historical analysis and future planning.
By consolidating and staging historical and projected data for detailed analysis, you gain
perspectives about your business that enable you to take appropriate actions.
Essbase provides both power and flexibility. Thus, it can be used for a broad range of online
analytical processing (OLAP) applications, including those in the following list:
●
Budgeting
●
Forecasting and seasonal planning
●
Financial consolidations and reporting
●
Customer and product profitability analysis
●
Price, volume, and mix analysis
●
Executive information systems
About Essbase
11
Essbase enables you and others in the organization to share, access, update, and analyze
enterprise data from any perspective and at any level of detail without learning new tools, query
languages, or programming skills.
Typical Users of Essbase
Essbase can be used in many different applications. Financial analysts have found the product
to be invaluable in budget analysis, currency conversion, and consolidation. Cost accountants
apply its powerful capabilities to evaluate allocation and elimination scenarios. Product
managers and analysts use it to plan and analyze multiple product lines and distribution
channels. You can also use the product as a repository database for spreadsheet data. Anyone
who uses a spreadsheet is a potential user of Essbase.
Because Essbase is applicable to such a broad variety of environments, individuals using it at an
organization may fill one or more roles in implementing and running applications. This guide
refers to specific roles by three titles. A role may be performed, however, by one person or by
several people working collaboratively.
●
System administrator. The Essbase system administrator typically has experience in
networking, installing software packages, and administering system functions. In addition
to installing the Essbase software, the Essbase system administrator may also set up Essbase
user accounts, set up the security system, and maintain the Essbase Server.
●
Application designer. The application designer sets up the Essbase database, creates the
database outline, and develops calculation and report scripts. The responsibilities of the
Essbase system administrator and the application designer may overlap in some areas. The
application designer has probably developed spreadsheet or database applications and
understands the operational problems and the tools being employed to solve them.
●
User. The user interacts with Essbase databases through spreadsheets, using Microsoft Excel
for Windows. Users are typically analysts and managers who use spreadsheet programs as
their primary tool for viewing and analyzing data.
Components of the Client-Server Environment
Client-server computing refers to the architecture in which individual PC workstations are
connected to a powerful server by means of a local area network (LAN). The PC workstation
acts as a client by requesting data from the server. The server processes the request and returns
the desired result to the client.
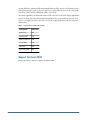
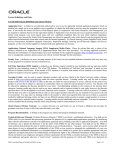
Essbase is built as a client-server system. System performance and multiuser capabilities are
greatly enhanced in the Essbase client-server environment. Figure 1 illustrates the Essbase
components and their relationships.
12
Introduction to Essbase
Figure 1
Essbase Components
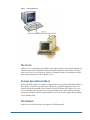
The Server
Essbase Server is a multidimensional database that supports analysis of an unlimited number of
data dimensions and an unlimited number of members within these dimensions, developed
using a true client-server architecture, All data, the database outline, the calculations, and the
data security controls reside on the Essbase Server.
Essbase Spreadsheet Add-in
Essbase Spreadsheet Add-in is a software program that merges seamlessly with Microsoft Excel.
After Essbase is installed, a special menu is added to the spreadsheet application. The menu
provides enhanced commands such as Connect, Pivot, Drill-down, and Calculate. Users can
access and analyze data on Essbase Server by using simple mouse clicks and drag-and-drop
operations. Spreadsheet Add-in enables multiple users to access and to update data on Essbase
Server simultaneously.
The Network
Essbase runs on PC-based LANs that support the TCP/IP protocol.
Components of the Client-Server Environment
13
Note:
Supported network environments and technical requirements are discussed in detail in the
Hyperion Essbase - System 9 Installation Guide, which is included with the Essbase package.
Essbase Application Products
Several optional products, designed to extend and enhance the scope of OLAP applications, can
be implemented using Essbase. The following sections describe these products.
Essbase Spreadsheet Toolkit
EssbaseOracle's Hyperion® Essbase® Spreadsheet Toolkit includes over 20 macro and Visual
Basic for Applications (VBA) functions that enable you to build customized Microsoft Excel
applications. The applications incorporate Essbase commands. Commands such as EssCascade,
EssConnect, and EssDisconnect provide all the functionality of their corresponding Essbase
menu commands. For more information, see the Essbase Spreadsheet Add-in for Excel Online
Help.
Essbase Partitioning Option
Essbase Partitioning option enables you to define areas of data that are shared or linked between
data models. Partitioning can affect the performance and scalability of Essbase applications.
Partitioning provides more effective response to organizational demands, reduced calculation
time, increased reliability and availability, and incorporation of detail and dimensionality. For
more information on partitions, see “Ways to Access Linked Partitions” on page 145.
Essbase Structured Query Language Interface
SQL Interface enables access to PC and structured query language (SQL) relational databases by
making Essbase Server operate as an open database connectivity client. Using SQL Interface,
data can be moved easily from these diverse corporate data sources into Essbase Server for user
access and analysis. For more information SQL Interface, see the Essbase SQL Interface Guide.
Essbase Application Programming Interface
Essbase Application Programming Interface (API) enables application developers to create
custom applications quickly by using standard tools while taking advantage of the robust data
storage, retrieval, and manipulation capabilities of Essbase. API supports Visual Basic and C.
For more information on application programming, see the API Reference.
14
Introduction to Essbase
Essbase Currency Conversion
Essbase Currency Conversion translates, analyzes, and reports on foreign financial data. Any
exchange rate scenario can be modeled, and you can even perform ad hoc currency conversions
of data, directly from the spreadsheet. The Currency Conversion product is compliant with
Financial Accounting Standards Board 52 (FASB52). For more information on conversions, see
“Working with Currency Conversions” on page 155.
Integration Services
Oracle's Essbase® Integration Services works with Essbase and Microsoft Excel. This product is
a suite of tools and data integration services that serve as a bridge between relational, flat file,
and SAP BW data sources and Essbase Server. Integration Server drill-through is one of the tools
of Integration Services. Using Integration Server drill-through, you can view and customize
spreadsheet reports that display data retrieved from relational databases. For more information
on the drill-through tool, see Chapter 5, “Using Drill-Through.”
Developer Products
Essbase developer products enable the rapid creation, management and deployment of tailored
enterprise analytic applications—with or without programming knowledge.
The products (for example, Application Builder, and Oracle's Hyperion® Application
Builder.NET) provide a comprehensive set of application programming interfaces, drag and
drop components and services.
Data Mining
Data Mining—an optional product component of Essbase—shows you hidden relationships
and patterns in your data, enabling you to make better business decisions. Using Data Mining
you can plug in various data mining algorithms, build models, and then apply them to existing
Essbase applications and databases.
The Multidimensional Database
The Essbase multidimensional database stores and organizes data. It is optimized to handle
applications that contain large amounts of numeric data and that are consolidation-intensive
or computation-intensive. In addition, the database organizes data in a way that reflects how
the user wants to view the data.
Definition of Multidimensional
A dimension is a perspective or view of a specific dataset. A different view of the same data is
an alternate dimension. A system that supports simultaneous, alternate views of datasets is
multidimensional. Dimensions are typically categories such as time, accounts, product lines,
The Multidimensional Database
15
markets, budgets, and so on. Each dimension contains additional categories that have various
relationships one to another.
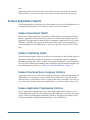
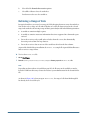
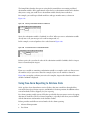
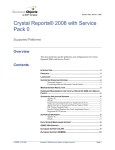
An Essbase application contains an unlimited number of dimensions, so you can analyze large
amounts of data from multiple viewpoints. Figure 2 shows four views of multidimensional data.
You can retrieve and analyze the multidimensional data with the Spreadsheet Add-in software.
Figure 2
Multiple Views from a Five-Dimensional Database
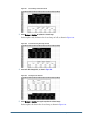
In contrast to the multidimensional view, worksheets stores data in two dimensions, usually
time and accounts, as shown in Figure 3:
Figure 3
16
Introduction to Essbase
Two-Dimensional Representations of Data in a Worksheet
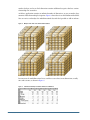
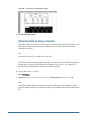
Database Outlines
Understanding the database outline is the key to understanding Essbase. To define a
multidimensional database, you design its database outline. The database outline contains the
database organization (structure), the database members, and the database rules, as shown in
Figure 4:
Figure 4
Essbase Database Outline
The application designer or Essbase system administrator usually creates the database outline.
For more information on creating the database outline, see the Hyperion Essbase - System 9
Database Administrator's Guide.
The components of the database outline are as follows:
●
Dimensions
●
Members
●
Attributes
●
Formulas
●
Aliases
●
Consolidations
Refer to the following topics for descriptions of the outline components.
Dimensions
Dimensions are the most basic categorical definitions of data within the database outline. You
need at least two dimensions to make any meaningful reference to data; for example, a time
Database Outlines
17
dimension and an accounts dimension. Other dimensions may categorize products, markets,
and scenarios. Using dimensional organization, you can define any consolidation structure or
any slice of data that is relevant to the application. Essbase supports an unlimited number of
dimensions.
Members
Members are the names of the elements within a dimension. A dimension can contain an
unlimited number of members. The calculation, reporting, and dimension-building features in
Essbase use the following terms to describe members.
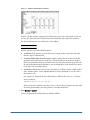
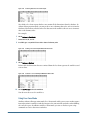
●
Parents. A parent is a member with a consolidation branch below it. Figure 5 shows an
example of Qtr1 as a parent member because below Qtr1 is a branch containing months as
members.
Figure 5
18
Relationships Among Database Members
●
Children. A child is a member with a parent above it. For example, Jan, Feb, and Mar are
children of the parent Qtr1.
●
Siblings. A sibling is a child member of the same parent and on the same branch (same level).
For example, Jan, Feb, and Mar are siblings. Apr is not a sibling of Jan, Feb, or Mar, however,
because it has a different parent, Qtr2.
●
Descendants. A descendant is a member at any level below a parent. For example, each
member that falls in the Year branch is a descendant of Year. The following members are
all descendants of Year: Qtr1, Jan, Feb, Mar; Qtr2, Apr, May, Jun; Qtr3, Jul, Aug, Sep; Qtr4,
Oct, Nov, Dec.
●
Ancestors. An ancestor is a member of a branch above a member. For example, Qtr2 and
Year are ancestors of Apr.
●
Generations. The term generation describes the branch number of a member. Generations
count from the root of the tree (generation 1, which is the dimension name) toward the leaf
node.
●
Levels. The term level describes the branch number of a member. Levels count from the leaf
node (level 0) toward the root (the dimension name).
Introduction to Essbase
Attributes
Attributes describe characteristics of data, such as the size and color of products. Through
attributes, you can group and analyze members of dimensions based on their characteristics.
Attribute dimensions must be associated with base dimensions. For more information, see the
Hyperion Essbase - System 9 Database Administrator's Guide.
Formulas
Each database member can be associated with one or more formulas in the database outline. For
example, the Variance members of the Scenario dimension, as shown in Figure 4 on page 17,
contain formulas. Formulas can be simple or complex. For more information on formulas, see
the Hyperion Essbase - System 9 Database Administrator's Guide.
Aliases
Essbase supports alternative names, or aliases, for database members. Aliases are useful when
various labels are used for the same member in various worksheets. One worksheet, for example,
may refer to Cost_of_Goods_Sold as COGS. Aliases also can be used for reporting in alternative
languages or for more formal output name sets, such as account numbers.
Consolidations
Consolidations in Essbase applications are defined by member branches. The database outline
determines consolidation paths. The determination is based on the location of members within
a dimension. Indentation of one member below another indicates a consolidation relationship.
Indenting members is important for the drill-down capabilities in Spreadsheet Add-in. As you
navigate through data, you can drill down through levels of consolidations. The database
outline is the roadmap that determines the levels of data navigation.
Database Outlines
19
20
Introduction to Essbase
Basic Tutorial
3
In This Chapter
Getting Acquainted with Spreadsheet Add-in ...................................................................................21
Preparing to Begin the Tutorial....................................................................................................28
Retrieving Data .....................................................................................................................33
Pivoting, Retaining, and Suppressing Data......................................................................................44
Formatting the Worksheet .........................................................................................................54
Creating Queries Using Essbase Query Designer................................................................................67
Selecting Members ................................................................................................................80
Saving and Disconnecting ........................................................................................................87
On to Advanced Tasks .............................................................................................................88
When you add Spreadsheet Add-in to Microsoft Excel, most spreadsheet operations remain
unchanged; Spreadsheet Add-in simply adds an Essbase menu and toolbar, and mouse shortcuts
with which you can access Essbase applications and databases.
Basic tasks are described in this tutorial chapter. These are tasks that you probably use often
when working with Essbase. Chapter 4 describes more advanced tasks.
Tasks must be completed in succession as each tutorial task builds upon the previous task.
The examples in this tutorial are based on the Sample Basic database that is included with the
Essbase installation. Contact the Essbase system administrator for information about accessing
the Sample Basic database or about accessing other databases on Essbase Server.
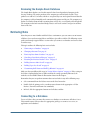
Getting Acquainted with Spreadsheet Add-in
This following topics will help you to get acquainted with Spreadsheet Add-in:
●
“Registering Spreadsheet Add-in” on page 22
●
“Adding Spreadsheet Add-in” on page 22
●
“Starting Spreadsheet Add-in” on page 23
●
“Installing the Essbase Toolbar for Excel” on page 23
●
“Using the Essbase Toolbar” on page 24
●
“Accessing Online Help” on page 26
●
“Enabling Mouse Actions” on page 26
Getting Acquainted with Spreadsheet Add-in
21
Registering Spreadsheet Add-in
You may register Essbase Spreadsheet Add-in for Excel. This registers Essbase Spreadsheet Addin with Excel and includes it in your computer’s registry entries.
Similarly, you may unregister Spreadsheet Add-in from Excel. Unregistering is similar to
uninstalling in that it clears the registry entries and removes the Essbase menu from Excel;
however, it leaves the Essbase Spreadsheet Add-in components on your computer. If you want
to put the Spreadsheet Add-in back into Excel, run the register program again.
It is not required that you register Spreadsheet Add-in. If you experience problems with Essbase
Spreadsheet Add-in, it is recommended that you register.
➤ To register Spreadsheet Add-in:
Select Start > Programs > Hyperion > Essbase > Register Spreadsheet Add-in.
➤ To unregister Spreadsheet Add-in:
Select Start > Programs > Hyperion > Essbase > Unregister Spreadsheet Add-in.
Note:
Unregistering clears the registry entries and removes the Essbase menu from Excel; however, it
leaves the Essbase Spreadsheet Add-in components on your computer. To put the Spreadsheet
Add-in back into Excel, run the register program again.
Adding Spreadsheet Add-in
If you manually update your environment settings or if you have removed Spreadsheet Addin from the Microsoft Excel environment, you must use the spreadsheet’s add-in tool to add
Spreadsheet Add-in to Excel. The Essbase menu is added to the spreadsheet’s menu bar and
points Excel to the Essbase Spreadsheet Add-in file in the \Essbase\bin directory. This file is
on the local drive of your computer, if that is where you installed Spreadsheet Add-in, or on the
network drive if that is where you set up your computer operating environment to run
Spreadsheet Add-in.
➤ To add Spreadsheet Add-in to Excel:
1 In Excel, select Tools > Add-Ins.
2 In Add-ins, click Browse.
Excel displays the Browse dialog box.
3 Locate essexcln.xll and select it.
The file is in the bin directory where you installed Spreadsheet Add-in on your local disk (if you
installed Spreadsheet Add-in there) or in bin where the Essbase system administrator installed
Spreadsheet Add-in on a network drive (if you set up your PC operating environment to run
Spreadsheet Add-in there).
22
Basic Tutorial
4 Click OK twice to close the dialog boxes.
Adding Essbase Spreadsheet Add-in to Excel modifies the Windows Registry to point to where
the Spreadsheet Add-in file is installed.
5 Start Spreadsheet Add-in.
After the Excel startup screen goes away, the Spreadsheet Add-in startup screen is displayed.
If you do not see the Spreadsheet Add-in startup screen or if Excel does not contain an Essbase
menu, see the Hyperion Essbase - System 9 Installation Guide for troubleshooting information.
Starting Spreadsheet Add-in
To use Spreadsheet Add-in software, start Excel.
Ensure that a worksheet is open before attempting to connect to Essbase Server. Attempting to
connect to the server without opening a worksheet results in an error message.
➤ To begin an Essbase session:
1 Start Excel.
After the Excel startup screen goes away, the Essbase Spreadsheet Add-in startup screen is
displayed.
The Essbase menu should appear in the spreadsheet application menu bar. If it does not, you
may need to use the add-in tool to add Essbase Spreadsheet Add-in (see “Adding Spreadsheet
Add-in” on page 22).
In Excel, the Essbase toolbar should also be visible. If you do not see the Essbase toolbar, see
“Installing the Essbase Toolbar for Excel” on page 23 and “Using the Essbase Toolbar” on page
24.
2 From the spreadsheet application menu bar, select Essbase to display the Essbase menu.
Installing the Essbase Toolbar for Excel
In Excel, Spreadsheet Add-in provides a convenient toolbar that displays buttons for accessing
most of the common Essbase commands without having to open the Essbase menu.
Prior to using the Essbase toolbar for Excel, you must install the toolbar by opening an Excel file
that is provided as part of the default Essbase installation. For information on using the toolbar,
see “Using the Essbase Toolbar” on page 24.
➤ To install the Essbase toolbar:
1 Start Excel.
2 Select File > Open.
3 From the \AnalyticServices\client\sample directory, open the esstoolb.xls file.
A blank worksheet opens.
Getting Acquainted with Spreadsheet Add-in
23
Depending on how software is installed on your PC, the file may not be available or may be
located in a different directory. If you cannot locate the file, contact the Essbase system
administrator.
Note:
Upon using Excel, two dialog boxes may be displayed warning that the esstoolb.xls file may
contain macros. If so, click the Enable Macros button on the first dialog box, and click OK on
the second dialog box. The macros must be enabled for the Essbase toolbar to work.
4 Select File > Close to close the esstoolb.xls file.
You do not need to modify or save the file.
You should not have to install the toolbar again unless you delete the Essbase toolbar from the
Toolbars dialog box in Excel. If you delete the toolbar, perform the installation procedure again.
Note:
If you have toolbars turned off in Excel, you do not see the Essbase toolbar immediately. You
must first enable toolbars. For information on enabling the Essbase toolbar, see “Using the
Essbase Toolbar” on page 24.
Using the Essbase Toolbar
Spreadsheet Add-in for Excel features a convenient toolbar that displays buttons for accessing
most of the common Essbase commands without having to open the Essbase menu. You can
view a pop-up description of a button on the toolbar by moving your cursor over the button.
Note:
Before you can view the Essbase toolbar, you must install it. See “Installing the Essbase Toolbar
for Excel” on page 23.
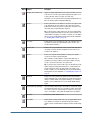
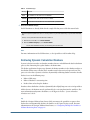
Table 2 lists the buttons on the toolbar. To view the Essbase toolbar, select View > Toolbars >
Essbase from the Excel menu bar. A check box must be displayed next to Essbase in the menu.
Note:
If you select the Essbase check box and click Delete, you must reinstall the toolbar. See “Installing
the Essbase Toolbar for Excel” on page 23 for instructions.
Table 2
Button
24
Basic Tutorial
Essbase Toolbar Buttons
Purpose
Description
Connect
Enables you to connect to an instance of Essbase Server. Click the
Connect button on the toolbar to display the Essbase System Login dialog
box.
Button
Purpose
Description
Navigate with or without data
Toggles the Navigate Without Data feature, which tells Essbase to retrieve
or not to retrieve data when you perform navigational operations, such
as pivot, drill down, drill up, keep only, and remove only.
This button serves the same function as the Navigate Without Data check
box in the Essbase Options dialog box (Global tab).
Retrieve
Retrieves data into the active worksheet. A retrieve request places data
at the beginning of the active worksheet. When you click the Retrieve
button, if you are not already connected to an instance of Essbase Server,
the Essbase System Login dialog box is displayed.
Tip: If you have mouse actions enabled, you can retrieve data by doubleclicking the primary mouse button in any empty cell in the worksheet. To
enable double-click support, select Essbase > Options, select the Global
tab, and select the Enable Double-Clicking option. For more information,
see “Enabling Mouse Actions” on page 26.
Keep only
Retains only the selected member (the active cell) or member range in
the worksheet. Click the Keep Only button to remove all unselected
members from the worksheet.
Remove only
Removes the selected member (the active cell) or member range from
the worksheet. Click the Remove Only button to retain all unselected
members in the worksheet.
Zoom in
Retrieves and expands data from Essbase according to the options
specified in the Essbase Options dialog box.
When sampling is enabled (Essbase > Sample Data (Zoom In)), an
approximate percentage members of the Essbase database that you
specify is queried when you retrieve and expand data.
Tip: If you have mouse actions enabled, you can drill down on data by
double-clicking the primary mouse button in the cell that contains the
member you want to expand. To enable double-click support, select
Essbase > Options, select the Global tab, and select the Enable DoubleClicking option. For more information, see “Enabling Mouse Actions” on
page 26.
Zoom out
Collapses the view according to the options specified in the Essbase
Options dialog box in the cell that contains the member that you want to
collapse. To enable double-click support for drilling up, select Essbase >
Options, select the Global tab, and select the Enable Double-Clicking
option.
Open Essbase Query Designer
Opens the Essbase Query Designer, which makes it easy to define a page
orientation for dimensions and selected database members. You can also
save queries for later use. Query Designer is designed to create report
queries, view attributes, and perform calculations based on attributes.
FlashBack
Restores the previous worksheet view.
Set options
Enables you to set display, zoom, mode, style, and global options for the
active worksheet to customize the behavior of Spreadsheet Add-in
software. Click the Options button to display the Essbase Options dialog
box.
Getting Acquainted with Spreadsheet Add-in
25
Button
Purpose
Description
Select Members
Enables you to select members from the multidimensional database
outline. Click the Member Selection button to display the Essbase
Member Selection dialog box.
Attach Linked Objects
Enables you to attach comments or files to data cells. Click the Attach
Linked Objects button to display the linked objects browser dialog box.
Accessing Online Help
Spreadsheet Add-in includes a context-sensitive online help system. Depending on the type of
information you need, you access the Spreadsheet Add-in online help in one of three ways:
●
In Excel, select Help > Essbase Help to access the entire online help system for browsing or
searching for information.
Browse or search through the system to view general information on Spreadsheet Add-in,
Essbase command descriptions, procedural information for completing tasks, Spreadsheet
Toolkit macros, and Visual Basic for Applications (VBA) function descriptions.
●
In each dialog box in Spreadsheet Add-in click the Help button to access information specific
to the particular dialog box.
The Help buttons enable you to find the information that you need without having to search
the entire help system.
Note:
The Spreadsheet Add-in online help also provides a comprehensive section on Essbase
Spreadsheet Toolkit, which enables you to customize and automate your use of Essbase by
using macros and VBA functions.
●
In the Essbase Query Designer dialog box, click the What’s This? Help button,
, and then
click an item in the dialog box to access information on a specific Essbase Query Designer
function.
You can also click the Help button in the navigation pane,
Designer tutorial and all online help topics.
, to access the Essbase Query
Enabling Mouse Actions
The following terms are used throughout this guide to describe mouse operations:
●
Primary mouse button and secondary mouse button describe the buttons on a two- or threebutton mouse.
Usually, right-handed users configure the left mouse button as the primary button and the
right mouse button as the secondary mouse button. The primary mouse button is the one
that you use to start Windows applications, the secondary mouse button is used for auxiliary
26
Basic Tutorial
operations. Click refers to use of the primary mouse button. The term right-click refers to
use of the secondary mouse button.
●
Select chooses the object that is under the cursor when you press and release the primary
mouse button.
Select a worksheet cell, for example, by moving the cursor to the cell and pressing and
releasing the primary mouse button.
●
Click (that is, both click and right-click) describes a quick press-and-release action on a
command object.
Click a button, for example, to execute a command.
●
Double-click describes two quick press-and-release actions that are executed in rapid
succession.
Double-click an application icon, for example, to start a Windows application.
●
Drag describes a press, hold, and move action.
Place the cursor on an object, press a mouse button, hold the mouse button down as you
move the object, and release the mouse button when you reach your goal. For example, you
can highlight a range of cells in a worksheet by dragging the cursor over the cells.
Note:
Essbase uses a drag operation called a pivot. A pivot requires use of the secondary mouse
button. To execute a pivot, you must press and hold the secondary, rather than the primary,
mouse button while dragging the selection.
Essbase offers enhanced mouse actions in Excel. You can use the mouse to perform any of the
following tasks:
●
Retrieve data
●
Drill down and drill up on database members
●
Pivot (move or transpose) data rows and columns
●
Access linked reporting objects
●
Access linked partitions
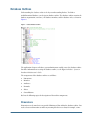
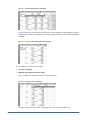
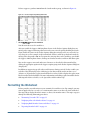
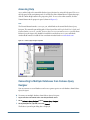
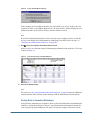
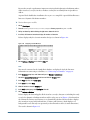
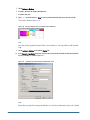
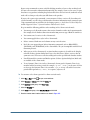
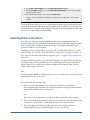
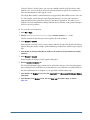
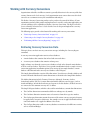
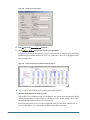
➤ To enable double-clicking to retrieve, drill down, and drill up on Essbase data:
1 Select Essbase > Options.
2 In Essbase Options, select the Global tab.
3 Select Enable Double-Clicking.
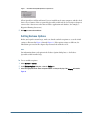
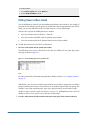
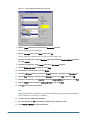
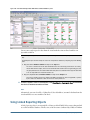
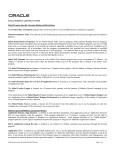
When Enable Double-Clicking is selected, as shown in Figure 6, you can retrieve and drill down
to more detailed data (primary mouse button) and drill up to less detailed data (secondary mouse
button). When double-clicking is enabled, the in-cell editing feature is overridden.
Getting Acquainted with Spreadsheet Add-in
27
Figure 6
Essbase Options Dialog Box—Global Tab
4 Click OK to return to the worksheet.
For information about setting the primary mouse button to display the Linked Objects Browser
dialog box when you double-click a data cell, see the Spreadsheet Add-in online help.
Preparing to Begin the Tutorial
Before you begin the basic tutorial, read the following important topics:
●
“Enabling Compatibility with Hyperion Smart View for Office” on page 28
●
“Setting Essbase Options” on page 29
●
“Following Guidelines During the Tutorial” on page 32
●
“Reviewing the Sample Basic Database” on page 33
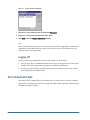
Enabling Compatibility with Hyperion Smart View for Office
If Hyperion Smart View for Office is installed on the same computer as Essbase Spreadsheet
Add-in, complete the following procedure to ensure that Spreadsheet Add-in functions properly
alongside Smart View.
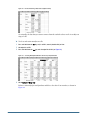
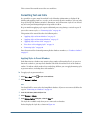
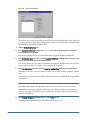
➤ To enable compatibility between Essbase Spreadsheet Add-in and Smart View:
1 If you have not already done so, start Excel.
2 Select Essbase > Options.
3 In Essbase Options, select the Global tab.
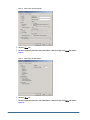
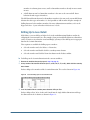
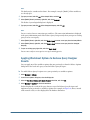
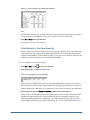
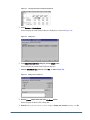
4 Under Mouse Actions, select Limit to Connected Sheets, as shown in Figure 7.
28
Basic Tutorial
Figure 7
Check Box for Compatibility Between Spreadsheets
When Spreadsheet Add-in and Smart View are installed on the same computer, and this check
box is selected, mouse clicks are ignored by Spreadsheet Add-in if the sheet being acted upon is
connected to a data source other than an Essbase application and database (for example, a
Hyperion Planning data source).
5 Click OK to return to the worksheet.
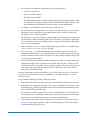
Setting Essbase Options
Before you begin the tutorial steps, make sure that the worksheet options are set to the initial
settings as illustrated in Figure 8 through Figure 11. If the option settings are different, the
illustrations presented in this chapter may not match the worksheet view.
Note:
For information about each option in the Essbase Options dialog box, see the Essbase
Spreadsheet Add-in online help.
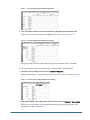
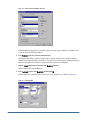
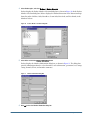
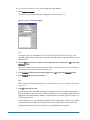
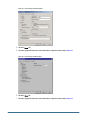
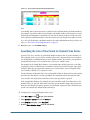
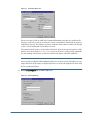
➤ To set worksheet options:
1 Select Essbase > Options.
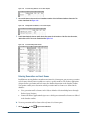
2 In the Essbase Options dialog box, select the Display tab.
3 Select the appropriate check boxes and option buttons so that your display of the Display tab matches
Figure 8.
Preparing to Begin the Tutorial
29
Figure 8
Initial Settings for Display Options
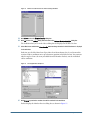
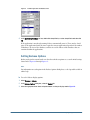
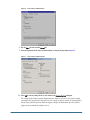
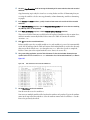
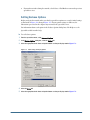
4 Select the Zoom tab.
5 Select the appropriate check boxes and option buttons so that your display of the Zoom tab matches
Figure 9:
Figure 9
Initial Settings for Zoom Options
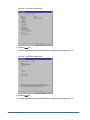
6 Select the Mode tab.
7 Select the appropriate check boxes and option buttons so that your display of the Mode tab matches
Figure 10.
30
Basic Tutorial
Figure 10
Initial Settings for Mode Options
Note:
If you are already connected to an Essbase database, Essbase Options also displays a Style tab.
Skip this tab for now.
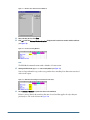
8 Select the Global tab.
9 Select the appropriate check boxes and option buttons so that your display of the Global tab matches
Figure 11.
Figure 11
Initial Settings for Global Options
Preparing to Begin the Tutorial
31
Note:
You should have already selected the appropriate boxes for Mouse Actions, as described in
“Enabling Mouse Actions” on page 26.
10 Click OK to save the settings for this session and close Essbase Options.
Following Guidelines During the Tutorial
Keep in mind the following guidelines during this tutorial:
32
Basic Tutorial
●
Optional tasks that should not be performed as part of the tutorial are displayed in lightshaded boxes. These tasks are included for your future reference. Find more information
on these tasks in the Essbase Spreadsheet Add-in online help.
●
You must be connected to the Sample Basic database during the tutorial. If you are not
connected to this database, the illustrations presented in this chapter will not match the
worksheet view.
●
To access many Essbase commands:
❍
Select the command from the Essbase menu
❍
Click the appropriate button on the Essbase toolbar
❍
For the Zoom In and Zoom Out commands, double-click either the primary or the
secondary mouse button
●
Set the options in the Essbase Options dialog box as described in “Setting Essbase Options”
on page 29. If the option settings are different, the illustrations presented in this chapter
may not match the worksheet view.
●
After you change a worksheet option in the Essbase Options dialog box, you must perform
a retrieval or a drill-down operation to have the new setting take effect.
●
Be sure to follow each step in the tutorial. Each task builds upon the previous task. Do not
skip the final steps at the end of sections, because these steps are often necessary to prepare
you for the next tutorial task.
●
If you make a mistake during the tutorial, you can select Essbase > FlashBack to return to
the previous worksheet view.
●
The values in the Sample Basic database that represent ratios or percentages are calculated
to a very high level of precision (for example, 55.26162826). You can apply a cell format to
control the number of decimal places that are displayed in data values. For details on applying
cell formats, see the Excel documentation.
●
Numeric values shown in the illustrations used throughout this tutorial may not match the
values stored in your database. The values shown in these illustrations reflect a freshly loaded
database.
●
Some worksheet columns have been adjusted for clarity in the illustrations. You do not need
to change the width of columns in the worksheet to follow the tutorial steps. The Adjust
Columns option in the Display tab of the Essbase Options dialog box adjusts columns for
you.
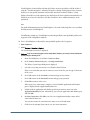
Reviewing the Sample Basic Database
The Sample Basic database used in this tutorial is based on a hypothetical company in the
beverage industry. The major products of the company are various kinds of sodas. These
products are sold in U.S. markets, which are categorized by state and region. Financial data for
the company is collected monthly and is summarized by quarter and by year. The company uses
Essbase to calculate financial and accounting data, such as sales, cost of goods sold, and payroll.
The company tracks both actual and budget data, as well as the variance and percent variance
between the two.
Retrieving Data
Now that you are more familiar with the Essbase environment, you can connect to an instance
of Essbase Server and start using Essbase and Essbase Spreadsheet Add-in. The following section
guides you through a typical Essbase session where you connect to a database and retrieve data
in various ways.
This topic outlines the following basic retrieval tasks:
●
“Connecting to a Database” on page 33
●
“Changing a Password” on page 35
●
“Retrieving Data from a Database” on page 35
●
“Canceling a Data Retrieval Request” on page 37
●
“Restoring the Previous Database View” on page 37
●
“Drilling Down to More Detail” on page 38
●
“Drilling Up to Less Detail” on page 41
●
“Customizing Drill-Down and Drill-Up Behavior” on page 42
Make sure that you followed the steps in “Setting Essbase Options” on page 29. If the settings in
the Essbase Options dialog box are different from the settings previously illustrated, the
worksheet view will differ from the illustrations shown in this chapter.
Remember that you can perform common data retrieval tasks in any of the following ways:
●
Select commands from the Essbase menu on the Excel menu bar
●
Double-click the primary or the secondary mouse button in the appropriate cell (for
Retrieve, Zoom In, and Zoom Out commands)
●
In Excel, click the appropriate buttons on the Essbase toolbar
Connecting to a Database
To access Essbase data, you must first connect to a database on an instance of Essbase Server.
This tutorial assumes that you have the appropriate privileges to connect to a server, an
application, and a database.
Retrieving Data
33
To complete the steps that follow, you need to know the name of the server to which you want
to connect, your username, and your password. If you do not have this information, contact the
Essbase system administrator.
Note:
Essbase does not support multiple instances of Excel.
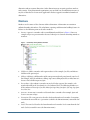
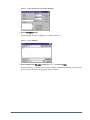
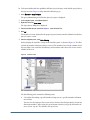
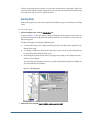
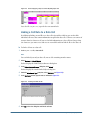
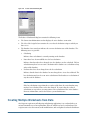
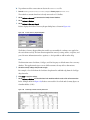
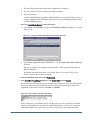
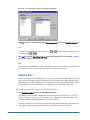
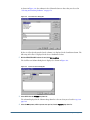
➤ To connect to an Essbase Server, application, and database:
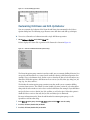
1 Select Essbase > Connect.
The Essbase System Login dialog box is displayed, as shown in Figure 12.
Figure 12
Essbase System Login Dialog Box
2 From the Server list box, select the server that you want to access.
If the server name that you want is not displayed in the list, you can type in the name of the
server that you want to access.
3 Press Tab to move to the Username text box; type your username in the text box.
4 Press Tab to move to the Password text box; type your password in the text box.
Note:
You can change your password when you are connected to a server. To change your password,
see “Changing a Password” on page 35.
5 Click OK to connect to the server.
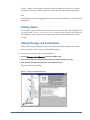
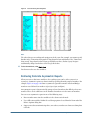
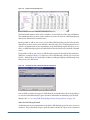
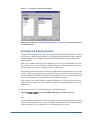
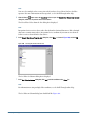
A list of available application/database pairs is displayed in the Application/Database list box.
Figure 13 shows an example of a list of application/database pairs. A single instance of Essbase
Server enables simultaneous access to multiple applications. An application can contain multiple
databases. Only the databases to which you have security access are shown in the list.
34
Basic Tutorial
For this tutorial, you use the Sample Basic database. If the Sample Basic database was installed
as part of the Essbase installation, it is shown in the list. If Sample Basic is not shown in the
Application/Database list box, ask the Essbase system administrator to install it.
Figure 13
Available Application and Database Pairs
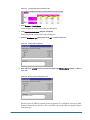
6 In the Application/Database list box, double-click Sample Basic. You can also select Sample Basic from
the list box and click OK.
If the application is not already running, Essbase automatically starts it. There may be a brief
pause as the application loads. The time required to start an application depends on the number
of databases, the sizes of the databases, and the sizes of the indexes of the databases contained
within the application.
Changing a Password
You can change your password only if you are connected to a server.
This task is optional. Optional tasks do not need to be performed as part of the tutorial. They are provided for information
only.
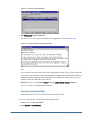
To change your password:
1. In the Essbase System Login dialog box, select the Change Password button.
2. In the Change Password dialog box in the New Password text box, type your new password.
3. In the Confirm Password text box, type the password again.
The passwords must be identical.
4. Click OK to change your password.
5. Click OK again to close the Essbase System Login dialog box.
Retrieving Data from a Database
Each time you retrieve information from an instance of Essbase Server, the following actions
occur:
Retrieving Data
35
●
Spreadsheet Add-in requests data from the server.
●
The server processes the request and prepares the data.
●
The server transmits the data to Spreadsheet Add-in.
●
The spreadsheet application receives the data from Essbase and organizes it in a worksheet.
To help you monitor these operations, Essbase uses three custom cursors, as described in
Table 3.
Table 3
Cursor
Essbase Custom Cursor
When Displayed
Spreadsheet Add-in requests information from Essbase Server.
The server is processing the request.
The server returns the data.
Note:
Small retrieval actions display the cursors very quickly; you may not notice changes in the
direction of the arrow when retrieving small amounts of data.
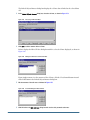
➤ To retrieve data into an empty worksheet:
1 Select File > New or click
to open a new worksheet.
Note:
You should be connected to the Sample Basic database. If you are not connected, follow the steps
in “Connecting to a Database” on page 33.
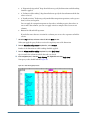
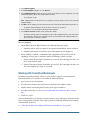
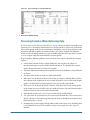
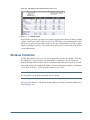
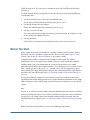
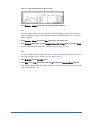
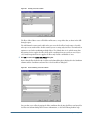
2 Select Essbase > Retrieve.
Essbase retrieves data into the worksheet.
Figure 14
Initial Data Retrieval from Sample Basic
Because you selected the Enable Double-Clicking box in the Essbase Options dialog box (Global
tab) in step 9 on page 31, you can double-click in an empty cell to retrieve data. You can also
click the Retrieve button on the Essbase toolbar.
36
Basic Tutorial
When you retrieve data into an empty worksheet, Essbase returns data from the top levels of
each database dimension. The top level is used as a starting point to navigate, or drill down, into
levels of detailed data. In the Sample Basic database, the following five dimensions are retrieved:
Measures, Product, Market, Scenario, and Year.
Tip:
You can retrieve data by double-clicking in a data cell, selecting Essbase > Retrieve, or by clicking
the Retrieve button on the Essbase toolbar.
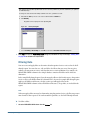
Canceling a Data Retrieval Request
Occasionally, you may want to cancel a retrieval request. For instance, you may want to stop a
request if a retrieval is taking longer than expected or if you mistakenly double-click.
Because Essbase returns data so quickly to the worksheet, you may not be able to cancel a retrieval
before the retrieval is complete. The cancel feature is most useful when you need to stop a large
retrieval request.
To cancel data retrievals, press the Esc key during a retrieval action.
Note:
You can cancel a retrieval only while Essbase is processing in Spreadsheet Add-in. You cannot
cancel a retrieval when Essbase is processing from Essbase Server.
Restoring the Previous Database View
The FlashBack command restores the previous database view. A database view is what you see
in the worksheet after a retrieval or navigation operation. FlashBack is similar to the Edit >
Undo command, which reverses the last action, with the following difference. If you modify
member information between retrieves and then perform a FlashBack, Essbase still flashes back
to the spreadsheet data as it was prior to the last retrieve, in spite of any changes you may have
made to members between retrieves. The FlashBack command uses the memory of your
computer to store the current view before processing an Essbase retrieval request. You can use
FlashBack to undo only the most recent operation. FlashBack cannot undo multiple operations.
Throughout this tutorial, you should follow all steps in the order that they are presented. If you
make a mistake or find yourself out of step with the tutorial, you can use the FlashBack command
from the Essbase menu or toolbar to undo the last command and return to the previous database
view. If you want to start the tutorial over from the beginning, select the entire worksheet and
select Edit > Clear > All. Then press Enter or click OK to empty the worksheet and start again.
You can disable FlashBack during normal operations to conserve memory on your local
machine. Do not disable FlashBack for this tutorial.
This task is optional. Optional tasks do not need to be performed as part of the tutorial. They are provided for information
only.
Retrieving Data
37
To disable Flashback:
1. Select Essbase > Options and click the Global tab.
2. Clear the Enable FlashBack check box.
Drilling Down to More Detail
You can drill down to various levels of multidimensional data in the worksheet. For example, if
you want to view data for a specific quarter or month rather than an aggregate data value for the
whole year, you can drill down on the Year dimension to see more detailed data.
You have three options for drilling down on a member:
●
Select the member and select Essbase > Zoom In.
●
Select the member and double-click the primary mouse button.
●
Select the member and click the Zoom In button on the Essbase toolbar.
➤ To drill down to lower levels of the Year dimension:
1 On Year in cell A2, double-click the primary mouse button.
The drill-down action retrieves data for the level below (the children of) Year: Qtr1, Qtr2, Qtr3,
and Qtr4, as shown in Figure 15.
Figure 15
Result of Drilling Down on the Year Dimension
Note:
For a discussion of the relationships among Essbase database members, see “Database Outlines”
on page 17.
With Essbase, you can retrieve members into columns or rows that are grouped or nested. Row
groups containing more than one level of data are nested within single-member row groups. For
example, a row group containing Qtr1, Qtr2, Qtr3, and Qtr4 may be nested within a singlemember row for a specific region, such as East (see Figure 16). Drilling down to lower levels of
database members is one way to retrieve data into nested groups.
2 In cell D1, double-click to drill down on Market and create nested groups of rows down the worksheet.
38
Basic Tutorial
Figure 16
Result of Drilling Down on the Market Dimension (Nested Rows)
Because worksheets can accommodate more rows than columns, Essbase is preset to retrieve
data into rows when you drill down on a member. You can change this default behavior and
display the results of a drill-down across columns. Drilling across columns applies only to the
top-level member of a dimension (for example, Market or Scenario).
➤ To drill down on Scenario and retrieve its respective members into columns rather than rows:
1 Press and hold down the Alt key.
2 Double-click Scenario (in cell E1).
3 Release the Alt key.
Essbase displays the data in columns across the worksheet, as shown in Figure 17.
Figure 17
Result of Drilling-Down on the Scenario Dimension (Nested Columns)
4 Keep this worksheet open, but do not save it yet.
You use this worksheet again in “Drilling Up to Less Detail” on page 41.
You will open a new worksheet to complete the steps in “Drilling Down on Attribute Members”
on page 39 and “About Drilling Down on Level 0 Attribute Members” on page 40.
Drilling Down on Attribute Members
You can use the Essbase attribute feature to retrieve and analyze in terms of characteristics, or
attributes, of dimensions. For example, you can analyze product profitability based on the
attributes of size or packaging. Attribute dimensions are associated with base dimensions.
You can use an attribute dimension to drill down on the base dimension with which it is
associated. In the Sample Basic database, the Product base dimension is associated with several
attribute dimensions, such as Caffeinated, Ounces, and Pkg_Type. Each attribute dimension
Retrieving Data
39
consists of level 0 attribute members. Level 0 attribute members are the lowest level attributes
that are associated with members of a base dimension. The Pkg_Type attribute dimension, for
instance, has two level 0 members, Bottle and Can.
You can extract information on all products sold in a can by entering manually the name Can
in the worksheet. You can also use Essbase Query Designer or the Essbase Member Selection
dialog box to select the attribute and display it in the worksheet.
➤ To drill down on an attribute dimension:
1 Open a worksheet.
2 Connect to the Sample Basic database.
3 Select Essbase > Retrieve.
4 Select Product and replace it with Can by typing Can manually.
5 Click anywhere outside of cell C1 and select Essbase > Retrieve again.
Figure 18 displays the results:
Figure 18
An Attribute Member in a Report
6 Drill down to all products sold in a can by double-clicking Can in cell C1.
Cola, Diet Cola, and Diet Cream are the members of Product that have the Can attribute.
Figure 19 displays the results:
Figure 19
Result of Drilling Down on an Attribute Member
About Drilling Down on Level 0 Attribute Members
The following description is of the general behavior of Spreadsheet Add-in when you drill down
on a level 0 attribute member:
40
Basic Tutorial
●
If the level 0 attribute member is in a column, a drill-down pivots the attribute to the
innermost row of the worksheet.
●
If the level 0 attribute member is in a row, a drill-down does not change the position of the
attribute in the worksheet.
●
A drill-down on a level 0 attribute member displays the associated base members to the right
of the level 0 attribute.
●
If there is more than one level 0 attribute member in a worksheet, a drill-down on one
attribute displays other attributes to the left of the level 0 attribute member. Level 0 attribute
members in columns pivot to rows, and level 0 attribute members already in rows remain
in rows.
●
A drill-down on non-level 0 attribute members is the same as the current drill- down
behavior for other types of members.
The drill-down behavior for non-level 0 attribute members is the same as the current drill-down
behavior for other types of members. See the Spreadsheet Add-in online help for examples of
drilling down on level 0 attribute members. For more information on attributes, refer to the
Hyperion Essbase - System 9 Database Administrator's Guide.
Drilling Up to Less Detail
With Essbase, you can drill up to higher levels in the multidimensional database outline by
collapsing the current member tree. For example, if you previously drilled down on a dimension,
such as Scenario, to view data for Actual and Budget, you may need to drill up to view aggregate
data for the Scenario dimension.
Three options are available for drilling up on a member:
●
Select the member and select Essbase > Zoom Out.
●
Select the member and double-click the secondary mouse button.
●
Select the member and click the Zoom Out button on the Essbase toolbar.
➤ To drill up on the Scenario dimension in the current worksheet:
1 Return to the worksheet that you kept open in step 4 on page 39
2 On any member of the Scenario dimension (that is, cell C2, D2, E2, F2, or G2), double-click the secondary
mouse button.
Essbase collapses the members of the Scenario dimension. The result is shown in Figure 20:
Figure 20
Result of Drilling Up on the Scenario Dimension
3 In cell A3, double-click the secondary mouse button to drill up on East.
Essbase collapses East, West, South, and Central into the single Market dimension and keeps
the dimension in the A column, as shown in Figure 21.
Retrieving Data
41
Figure 21
Result of Drilling Up on East
Customizing Drill-Down and Drill-Up Behavior
You can customize the behavior of the Zoom In and Zoom Out commands in the Essbase
Options dialog box. The following steps illustrate some drill-down and drill-up techniques.
➤ To retrieve all members of a dimension with a single drill-down operation:
1 Select Essbase > Options and select the Zoom tab.
Essbase displays the Zoom Tab. A portion of the Zoom tab is shown in Figure 22.
Figure 22
Zoom In and Member Retention Option Settings
The Zoom In option group contains items that enable you to customize drilling behavior. You
can specify which members are returned to the worksheet during a drill-down operation. For
example, if you select Bottom Level, Essbase retrieves data for the lowest level of members in a
dimension. With this option, a drill-down on Year retrieves Jan, Feb, Mar, Apr, May, Jun, Jul,
Aug, Sep, Oct, Nov, and Dec.
The Member Retention option group contains items that enable you to customize drilling
retention characteristics. The default selection, Include Selection, retains the selected member
along with the other members retrieved as a result of a drill down. For example, if you drill down
on Qtr1, Essbase retrieves data for Jan, Feb, and Mar, as well as for Qtr1. When this option is
disabled, Essbase retrieves data only for Jan, Feb, and Mar; Qtr1 is eliminated.
For more information on the Zoom In and Member Retention option groups, see the
Spreadsheet Add-in online help.
2 In the Zoom In option group, select the All Levels option and click OK to save the setting.
3 In cell A3, drill down (double-click) on Market.
4 In cell C2, drill down (double-click) on Scenario.
42
Basic Tutorial
Essbase retrieves all members of Market and Scenario, as shown in Figure 23. For the Market
dimension, Essbase drilled down two levels to get to the bottom-most members, which are
individual states. The Scenario dimension contains only one member level, so the members of
Scenario would also be retrieved if you selected Next Level in the Zoom In option group.
Figure 23
Result of Drilling Down to All Member Levels
5 Select Essbase > Options and select the Zoom tab.
6 Return the Zoom In option setting to Next Level.
If you want to drill up on only one quarter of the year, select Within Selected Group in the
Member Retention option group.
➤ To drill up only on Qtr1:
1 In the Member Retention option group on the Zoom tab, click the Within Selected Group check box and
click OK.
Make sure that Include Selection is also still checked.
2 Double-click the secondary mouse button to drill up on Qtr1 in cell B3.
Figure 24 shows that drilling up to the Year dimension affects only New York. All other states
show data for all four quarters.
Figure 24
Result of Drilling Up Within a Selected Group
3 Before moving on with the tutorial, disable the Within Selected Group option:
a.
Select Essbase > Options and select the Zoom tab.
b.
In the Member Retention option group, clear the Within Selected Group check box, and
click OK.
4 Select File > Close to close the worksheet.
Retrieving Data
43
You do not need to save the worksheet.
Pivoting, Retaining, and Suppressing Data
After you retrieve data into the worksheet, you may want to manipulate the data in various ways.
For example, you may want to move rows and columns to different positions in the worksheet,
or you may want to tell Essbase to suppress or to retain specific data during data retrievals.
To help you manipulate worksheet data, this section steps you through the following procedures:
●
“Pivoting Rows and Columns” on page 44
●
“Retaining a Data Subset” on page 47
●
“Removing a Data Subset” on page 49
●
“Navigating Through the Worksheet Without Retrieving Data” on page 49
●
“Suppressing Missing Values, Zero Values, and Underscore Characters” on page 52
Pivoting Rows and Columns
With the Pivot command, you can change the orientation of worksheet data. Use the Pivot
command to perform any of the following tasks:
●
Move a row group to a column group
●
Move a column group to a row group
●
Change the order of row groups
●
Change the order of column groups
You can execute the Pivot command in two ways:
●
Select the member cell that you want to pivot, and select Essbase > Pivot. This method applies
only to moving a row group to a column group or a column group to a row group.
●
Click in the center of the member cell that you want to pivot, press and hold down the
secondary mouse button, and drag the group to the desired location. This method applies
to swapping row and column groups and to changing the order within groups.
➤ To pivot Year data from a row group to a column group:
1 Select File > New or click
to open a new worksheet.
Note:
You should already be connected to the Sample Basic database. If you are not connected, follow
the steps in “Connecting to a Database” on page 33.
2 Select Essbase > Retrieve.
3 Drill down (double-click) on Measures and Product (in cells B1 and C1, respectively).
4 Press and hold down the Alt key, and, in cell E1, drill down (double-click) on Scenario.
44
Basic Tutorial
Figure 25 shows the spreadsheet view before pivoting.
Figure 25
View Before Pivoting
5 In cell C3, select Year and select Essbase > Pivot.
Essbase pivots the Year dimension to a column group next to Market (above the Scenario
members), as shown in Figure 26.
Figure 26
Result of Pivoting a Row Group to a Column Group
6 As another example, in cell C2, select Actual.
7 Right click and drag Actual to product 100 in cell A3.
As Figure 27 shows, the member label box is displayed under the cursor during the pivot
operation, and it displays the names of the members that you are pivoting. The orientation of
the member label box, however, does not determine the orientation of the pivot result. Essbase
determines the data orientation by the location of the destination cell.
Pivoting, Retaining, and Suppressing Data
45
Figure 27
Pivoting a Column Group to a Row Group
Figure 28 shows the result of Essbase pivoting the Scenario members (Actual, Budget, Variance,
and Variance%) from a column group to a row group that is displayed to the left of the Product
members.
Figure 28
Result of Pivoting a Column Group to a Row Group
➤ To transpose the order of row groups:
1 In cell A2, select Actual.
2 Right-click and drag Actual to Profit in cell C2.
Figure 29 shows the spreadsheet before the pivot operation.
Figure 29
Pivoting the Order of Row Groups
The pivot changes the order of the row groups. The result is shown in Figure 30
46
Basic Tutorial
Figure 30
Result of Pivoting the Order of Row Groups
In this example, notice that both the source cell and the destination cell are now members.
Whenever the source cell and the destination cell are members of different row groups, Essbase
exchanges the member groups. You must select a destination cell that contains a member name
to exchange row members. You can also exchange column members by choosing a destination
cell in another column that contains a member name.
Retaining a Data Subset
The Keep Only command retains only selected member rows or columns and removes all other
data from the worksheet view. This command provides a powerful way to remove dimensional
slices without having to delete individual cells.
➤ To keep only Actual and Budget data in the current worksheet:
1 In cell C2, select Actual, and in cell C3, select Budget, as shown in Figure 31.
Figure 31
Selecting Members for the Keep Only Command
2 Select Essbase > Keep Only.
Essbase removes the Variance, Variance%, and Scenario rows from the worksheet and retains
only Actual and Budget data, as shown in Figure 32.
Pivoting, Retaining, and Suppressing Data
47
Figure 32
Result of Retaining a Data Subset (Adjacent Cells)
Occasionally, the data that you want to remove from the worksheet does not lie in an adjacent
range of cells.
➤ To select and retain nonadjacent cells:
1 Press and hold down the Alt key, and, in cell D1, zoom in (double-click) on Year.
2 Select Qtr2 in cell E2.
3 Press and hold down the Ctrl key and select Qtr4 in cell G2 (see Figure 33).
Figure 33
Selecting Nonadjacent Members for the Keep Only Command
4 Select Essbase > Keep Only.
Essbase retains only Qtr2 and Qtr4 data and deletes the other Year members, as shown in
Figure 34.
48
Basic Tutorial
Figure 34
Result of Retaining a Data Subset (Nonadjacent Cells)
Removing a Data Subset
The Remove Only command is the counterpart to the Keep Only command. With Remove Only,
you can remove selected member rows or columns and retain all other data in the worksheet
view.
➤ To remove a data subset from the current worksheet view:
1 In cell B7, select Ratios.
2 Press and hold Ctrl, and, in cell B9, select Measures.
3 Select Essbase > Remove Only.
Essbase removes data for Ratios and Measures but retains data for Profit and Inventory. The
result is shown in Figure 35.
Figure 35
Result of Removing a Data Subset
Navigating Through the Worksheet Without Retrieving Data
With the Navigate Without Data feature, you can perform navigational operations, such as pivot,
zoom in, zoom out, keep only, and remove only, without retrieving any data into the worksheet.
Pivoting, Retaining, and Suppressing Data
49
This feature is especially useful when dealing with dynamic calculation members, which are
usually specified by the application designer. By activating Navigate Without Data, you are
effectively telling Essbase not to calculate values dynamically (that is, calculate the database at
retrieval time) while you are creating the spreadsheet report. Dynamic calculation is discussed
in more detail in “Retrieving Dynamic Calculation Members” on page 117.
➤ To navigate through the worksheet without retrieving data:
1 Select Essbase > Navigate Without Data.
Essbase displays a check mark next to the menu item.
You can also disable Navigate Without Data by clearing the appropriate option in the Global
tab of the Essbase Options dialog box or by clicking the Navigate Without Data button on the
Essbase toolbar.
2 In cell D2, double-click the secondary mouse button to drill up on Qtr2.
Essbase shows the collapsed Year dimension but withholds retrieving any data that is changed
as a result of drilling up. The cells where data would usually be displayed are blank. The result
is shown in Figure 36.
Figure 36
Result of Zooming Out (Navigate Without Data Enabled)
3 In cell D2, drill down (double-click) on Year by pressing and holding down the Alt key.
Essbase drills down without retrieving data.
4 In cell C3, select Actual and select Essbase > Pivot.
Essbase executes the pivot but does not retrieve data. The result is shown in Figure 37.
Note:
You get the same result by pivoting any of the other Scenario members.
50
Basic Tutorial
Figure 37
Result of Pivoting (Navigate Without Data Enabled)
5 In cell G1, click the secondary mouse button on Market and drag Market to product 100 (cell A4).
Essbase executes the pivot without retrieving data. The result is shown in Figure 38.
Figure 38
Result of Pivoting (Navigate Without Data Enabled)
Navigating without data also works with the Keep Only and Remove Only commands.
➤ To navigate without data when using the Keep Only or Remove Only command:
1 Select Qtr1 (cell D2) and Qtr2 (cell E2) and select Essbase > Keep Only.
Essbase retains only the selected members and does not retrieve data, as shown in Figure 39.
Figure 39
Result of Keep Only (Navigate Without Data Enabled)
2 Select products 300 (cell B7), 400 (cell B9), and Diet (cell B11) and select Essbase > Remove Only.
Essbase executes the Remove Only command without actually querying the database for
information, as shown in Figure 40.
Pivoting, Retaining, and Suppressing Data
51
Figure 40
Result of Remove Only (Navigate Without Data Enabled)
➤ To turn off Navigate Without Data when you are ready to retrieve data:
1 Select Essbase > Navigate Without Data.
Essbase removes the check mark next to the menu item.
You can also disable Navigate Without Data by clearing the appropriate option in the Essbase
Options dialog box (Global tab) or by clicking the Navigate Without Data button on the Essbase
toolbar.
2 In cell A3, drill down (double-click) on Market.
Essbase drills down on the Market dimension and also retrieves data into the worksheet. The
result is shown in Figure 41.
Figure 41
Result of Drilling down (Navigate Without Data Disabled)
Note that if you want to retrieve data without changing the current worksheet view, you can also
retrieve data by simply double-clicking in any data cell or by selecting Essbase > Retrieve (after
disabling Navigate Without Data).
Suppressing Missing Values, Zero Values, and Underscore
Characters
Several types of data can be returned to a worksheet view:
52
Basic Tutorial
●
Numeric data values
●
#NoAccess strings, which are displayed when you do not have the proper security access to
view a data value
●
#Missing strings, which indicate that no data exists for that member intersection
●
Zero data values
A missing value is not the same as a zero value that is loaded into the Essbase database. When
data does not exist for a data cell in Essbase, a value of #Missing is returned to the worksheet. If
any cell in a row contains a value, that row is not suppressed on a retrieval.
Using Essbase, you can suppress missing and zero values from the display in the worksheet. In
addition, you can tell Essbase to suppress underscore characters that are in some member
names.
➤ To suppress rows that contain missing values from being displayed in the worksheet:
1 In cell C3, double-click the secondary mouse button to drill up on Profit.
2 Pivot Measures (in cell C3) to Actual (in cell D1).
3 In cell B4, drill down (double-click) on product 100.
In the South member group, the product 100-30 row contains all missing values, indicating that
this product is not sold in the South, as shown in Figure 42. You may need to scroll down the
worksheet to see this row.
Figure 42
Worksheet View Displaying Missing Data Values
4 Select Essbase > Options, and select the Display tab.
5 In the Suppress option group, select the #Missing Rows check box and click OK.
The Suppress #Missing Rows and Zero Rows options are not available when any of the Formula
Preservation options are selected in the Mode tab of the Essbase Options dialog box.
For more information on Formula Preservation, see “Preserving Formulas When Retrieving
Data” on page 109.
6 Select Essbase > Retrieve to update the worksheet.
Note:
After you change a worksheet option in the Essbase Options dialog box, you must perform a
retrieval or drill operation to put the new setting into effect.
Pivoting, Retaining, and Suppressing Data
53
Essbase suppresses product 100-30 from the South member group, as shown in Figure 43.
Figure 43
Result of Suppressing Missing Data Values
7 Select File > Close to close the worksheet.
You do not need to save the worksheet.
After you enable the Suppress #Missing Rows feature in the Essbase Options dialog box, any
missing values suppressed during a data retrieval are not retrieved again by disabling the feature.
If you disable the feature in the Essbase Options dialog box, missing values are retrieved from
only that point on. For example, in this tutorial task, Essbase could not go back and return the
missing values for product 100-30. To return these missing values to the worksheet, you disable
the Suppress #Missing Rows feature, drill up on a Product member, and then drill down again.
You can also suppress zeros and underscore characters as described in this tutorial task by
clicking the appropriate options in the Suppress option group in the Essbase Options dialog box
(Display tab).
In addition to suppressing specific values and characters during retrieval, Essbase enables you
to define a label for missing values (#Missing) or for data to which you do not have access
(#NoAccess). If you define a replacement label for these values, Essbase displays the replacement
labels instead of the default labels. For more information on defining replacement labels for the
#Missing and #NoAccess labels, see the Spreadsheet Add-in online help.
Formatting the Worksheet
Essbase provides you with various ways to customize the worksheet view. For example, you may
want to apply visual cues, or styles, to certain member names or to data cells in the worksheet.
You may want to display alternative names, or aliases, for member names. This topic steps you
through the following formatting procedures:
54
Basic Tutorial
●
“Formatting Text and Cells” on page 55
●
“Displaying Aliases for Member Names” on page 61
●
“Displaying Both Member Names and Aliases” on page 62
●
“Repeating Member Labels” on page 63
This section of the tutorial starts with a new worksheet.
Formatting Text and Cells
In a spreadsheet report, many hierarchical levels of database information are displayed. By
defining and applying visual cues, or styles, to the text and cells in the worksheet, you can easily
keep track of specific database members, dimensions, and cell functions. Styles are an effective
way of viewing and distinguishing data in Spreadsheet Add-in.
Keep in mind that applying styles requires additional processing during a retrieval request. If
you need to remove styles, see “Removing Styles” on page 60.
This portion of the tutorial describes the following tasks:
●
“Applying Styles to Parent Members” on page 55
●
“Applying Styles to Dimension Members” on page 57
●
“Applying Styles to Data Cells” on page 59
●
“Precedence of Overlapping Styles” on page 59
●
“Removing Styles” on page 60
For a discussion of the relationships among Essbase database members, see “Database Outlines”
on page 17.
Applying Styles to Parent Members
Each dimension in a database may contain a large number of hierarchical levels. As you view
data in the worksheet, you may not be familiar with all the hierarchical levels of the database
outline. To indicate which members have underlying children, you can apply formatting styles
to parent members, including those with attributes.
➤ To apply styles to parent members:
1 Select File > New or click
to open a new worksheet.
2 Select Essbase > Retrieve.
Note:
You should still be connected to the Sample Basic database. If you are not connected, follow the
steps in “Connecting to a Database” on page 33.
3 In cell A2, drill down (double-click) on Year.
4 Select Essbase > Options.
5 In the Essbase Options dialog box, select the Style tab.
The Style tab is available only when you are connected to a database.
Essbase displays the Style tab, as shown in Figure 44.
Formatting the Worksheet
55
Figure 44
Essbase Options Dialog Box, Style Tab
In the Members group box, you can define styles for various types of database members, such
as parent, child, and shared members.
6 In the Members group box, select the Parent check box.
Clicking this box defines a font and color style for parent member names. Essbase defines a
default color of navy for all parent members. You can select a font format by clicking the Format
button to the right of the Members group box and using the Font dialog box.
7 Click the Format button that is to the right of the Members group box.
Essbase displays the Font dialog box.
8 In the Font style list box, select Bold Italic and then click OK.
Essbase displays an example of the selected style in the Sample box, as shown in Figure 45.
Figure 45
56
Basic Tutorial
Font Dialog Box
9 Click OK again.
Even though you have defined styles, they are not enabled until you select the Use Styles check
box from the Essbase Options dialog box and refresh the worksheet.
10 Select Essbase > Options, and select the Display tab.
11 In the Cells option group, select the Use Styles check box to enable the styles, and then click OK.
12 Select Essbase > Retrieve to refresh the worksheet and apply the styles.
Essbase displays parent member names in bold, navy font.
13 In cell A2, drill down (double-click) on Qtr1.
Essbase displays Jan, Feb, and Mar in a regular font, because these members do not have
underlying children.
Figure 46
Styles Applied to Parent Members
Applying Styles to Dimension Members
In addition to applying styles to parent members, as you did in the previous exercise, you can
also apply styles to members of a dimension in a database. Applying styles to dimensions makes
it easy to view the various dimension members in Spreadsheet Add-in.
➤ To apply styles to dimensions:
1 Select Essbase > Options and select the Style tab.
2 In the Dimensions group box, select the Year check box.
3 Select the Cell Border check box to create a border around each cell that contains a member from the
selected dimension.
4 From the Background Color drop-down list, select Yellow.
Formatting the Worksheet
57
Figure 47
Selecting a Background Color from the Style Tab
5 Click the Format button that is to the right of the Dimensions group box.
Essbase displays the Font dialog box.
6 From the Font style list box, select Bold, and then click OK.
Essbase displays an example of the selected style in the Sample box.
7 From the list of dimensions, select the Measures dimension, and from the Background Color drop-down
list, select Fuschia.
8 From the list of dimensions, select Product, and clear the Cell Border check box.
9 From the Background Color drop-down list, select Aqua.
10 Scroll down the list of dimensions, and select Market.
11 Select the Cell Border check box, and click the Format button that is to the right of the Dimensions list.
12 When the Font dialog box is displayed, from the Font style list box select Italic, and then click OK.
13 From the list of dimensions, select Scenario, and from the Background Color drop-down list, select Red.
14 Click the Format button, and from the Background Color list box, select White.
15 Click OK twice to return to the worksheet.
Note:
When you define styles, your choices are saved to the Windows Registry on your local computer.
You can define one set of styles per database.
16 In cell D1, drill down (double-click) on Market.
17 Press and hold down the Alt key and drill down (double-click) on Scenario in cell E1.
18 Select Essbase > Retrieve to refresh the worksheet.
58
Basic Tutorial
Essbase redisplays the worksheet and implements the newly defined styles. For example,
members of the Scenario dimension are displayed with a red background.
Figure 48
Dimensions with Styles Applied
Applying Styles to Data Cells
You can apply styles to data cells, such as read-only cells, read/write cells, linked object cells, and
Essbase Integration Server drill-through cells to distinguish them from other cells in the
worksheet. The Sample Basic database that you are using for this tutorial does not contain data
cells with any of these characteristics. In the advanced tutorial presented in Chapter 4, you attach
a linked reporting object to a data cell and apply a style to the cell.
This task is optional. Optional tasks do not need to be performed as part of the tutorial. They are provided for information
only.
In general, to apply styles to data cells, follow these steps:
1. Select Essbase > Options, and select the Style tab.
2. In the Data Cells option group, select the Linked Objects, Integration Server Drill-Through, Read Only, or Read/
Write check box.
3. Click Format.
4. In the Font dialog box, specify the font, font size, font style, color, and effects, and click OK.
An example of the selected style is displayed in the Sample box.
5. Repeat 2 through 4 to set styles for other data cells.
6. Select the Display tab and select the Use Styles check box to apply styles to the worksheet.
7. Click OK to close the Essbase Options dialog box.
8. Select Essbase > Retrieve to display the new styles in the worksheet.
Precedence of Overlapping Styles
Essbase uses the following order of precedence when applying multiple text styles:
Formatting the Worksheet
59
●
Linked object cells
●
Integration Server Drill-Through cells
●
Read-only cells
●
Read/write cells
●
Parent member cells
●
Child member cells
●
Shared member cells
●
Cells containing formulas
●
Dynamic calculation member cells
●
Attribute cells
●
Dimension cells
The only way you can apply a background color to data is to define a style for dimensions. If
dimension styles are defined and the Use Styles setting is turned on, a background color is always
defined for members of a dimension.
The text styles that you can apply to members, dimensions, and data cells are hierarchical and
determine which characteristics are applied. Member styles are at the top of the hierarchy. Thus,
member styles are always applied if styles are turned on. Notice that in Figure 48 on page 59, the
Qtr1 label in cell B6 is in bold italic navy font, and has a yellow background. The navy font comes
from the style defined for parent members, and the yellow background comes from the style
defined for Year.
If you want to see a child member style, make sure that the parent member style is turned off.
If you want to see a shared member style, make sure that both parent and child member styles
are turned off.
Removing Styles
Styles can be very helpful tools for keeping track of data in Spreadsheet Add-in. Applying styles,
however, involves additional processing time during a retrieval request. This additional
processing has a slight impact on the speed of Essbase retrievals.
If you do not want to apply styles to the worksheet view, you can clear them. You can also turn
off styles so that they are not displayed when you refresh the view (by selecting Essbase > Retrieve,
for example). So that the worksheet matches the illustrations presented in the following tasks,
do not remove styles if you are going through the tutorial.
If styles are applied to the worksheet and you execute the FlashBack command, these styles are
temporarily removed from the current view. The styles are reapplied whenever you initiate a
retrieval.
This task is optional. Optional tasks do not need to be performed as part of the tutorial. They are provided for information
only.
To remove all styles from a worksheet:
60
Basic Tutorial
1. Select all cells in the worksheet.
2. From the Excel menu bar, select Edit > Clear > Formats.
To turn off styles:
1. Select Essbase > Options and, select the Display tab.
2. In the Cells option group, clear the Use Styles check box, and click OK.
Note:
If you turn styles off without clearing them from the worksheet, the styles remain in the current
worksheet view when you refresh the view. The styles remain to avoid removing any styles that
you may apply to individual cells using native worksheet formatting options.
Displaying Aliases for Member Names
An alias is alternate name for a database member. You can create reports that use the database
member name, which is often a stock number or a product code, or an alias name, which can
be more descriptive. Aliases are defined by the Essbase application designer. Each database can
contain one or more alias tables.
For example, members of Product in the Sample Basic database are defined as codes, such as
100 and 200. A descriptive alias for each member of Product, such as Colas and Root Beer, is
defined in an alias table. In some cases, alias names may vary depending on the combination of
other database members. For example, a Product member may have a different alias for each
market in which it is sold. For more details about member names and aliases, see the Spreadsheet
Add-in online help or the Hyperion Essbase - System 9 Database Administrator's Guide.
➤ To display the alias of a member rather than its database name:
1 In cell C2, double-click the secondary mouse button to drill up on Actual.
2 Press and hold down the Alt key and drill down (double-click) on Product in cell D1.
3 Select Essbase > Options, and select the Display tab.
4 In the Aliases option group, select the Use Aliases check box to display member aliases.
5 Select Default from the Alias drop-down list, as shown in Figure 49.
Formatting the Worksheet
61
Figure 49
Enabling Aliases in the Essbase Options Display Tab
6 Click OK.
7 Select Essbase > Retrieve to refresh the worksheet and display the alias names.
The result is shown in Figure 50. Essbase changes the Product codes (100, 200, and so forth) to
their predefined aliases (Colas, Root Beer, Cream Soda, and so forth). In the Sample Basic
database, Product is the only dimension with predefined aliases.
Figure 50
Result of Displaying Aliases
Notice that Essbase is still displaying the styles that you created and applied in the previous
sections.
Displaying Both Member Names and Aliases
In addition to displaying aliases for database members, you can also configure Essbase to display
both aliases and database member names in Spreadsheet Add-in.
62
Basic Tutorial
➤ To display the name and alias of a member:
1 In cell B8, double-click the secondary mouse button to drill up on Qtr2.
2 In cell C2, select Colas, and then select Essbase > Pivot.
3 In cell C3. select Year, and then select Essbase > Pivot.
4 Select Essbase > Options, and select the Display tab.
5 In the Aliases option group, select the check box for Use Both Member Names and Aliases for Row
Dimensions.
Be sure that Use Aliases is already checked.
6 Click OK to return to the worksheet, and select Essbase > Retrieve.
The result is shown in the section called “Starting Spreadsheet Add-in”. Essbase displays both
member names and their aliases for row dimensions. Because the only row dimension in this
example that has preassigned aliases is Product, only the Product members display their aliases.
Region members simply repeat the member name instead of displaying an alias.
Figure 51
Result of Displaying Both Member Names and Aliases
Repeating Member Labels
By default, Essbase displays member labels only once for each nested row and column group. If
you are connected to a large database when using Spreadsheet Add-in, you may have to scroll
down or across the worksheet to see additional data rows and columns.
In some cases, as you scroll down or across, member labels disappear from view. Essbase provides
a feature for repeating member labels in each row or column cell that represents a data point,
so that you can always see a member label in the worksheet view.
➤ To repeat member labels down and across the worksheet:
1 Select Essbase > Options, and select the Display tab.
2 In the Aliases option group, clear the Use Both Member Names and Aliases for Row Dimensions check
box, as shown in Figure 52.
3 In the Cells option group, select the Repeat Member Labels check box, and then click OK.
Formatting the Worksheet
63
Figure 52
Enabling the Repeat Member Labels Option
4 In cell E1, drill down (double-click) on Year.
Essbase displays a member label in every column and row cell, as shown in Figure 53. For the
Sample Basic database that you are using for this tutorial, repeating member labels is probably
not necessary because the database is relatively small. This feature is particularly helpful for
keeping track of member labels when scrolling through large worksheets.
Figure 53
Result of Repeating Member Labels
You may notice that even if you clear the Repeat Member Labels check box in the Essbase Options
dialog box, Essbase retains the repeated member labels in the worksheet view. To remove the
repeated labels, you need to perform one of these tasks:
●
Clear the check box and open a new worksheet
●
Clear the check box and pivot the row group to a column group and then pivot it back to a
row group (or the reverse, from a column group to a row group, and back)
●
Select Essbase > FlashBack and clear the check box
5 Before returning to the tutorial, complete the following actions:
64
Basic Tutorial
a.
Select Essbase > Options, and select the Display tab.
b.
In the Cells option group, clear the Repeat Member Labels check box, and then click
OK.
c.
Select File > Close to close the worksheet.
You do not need to save the worksheet.
Working with Duplicate Member Names
An Essbase database may contain duplicate member names.
Users can view the qualified name of a member either directly on a worksheet or by using the
Comment functionality of Excel. The qualified name includes the member name and the names
of its ancestors up to the level that uniquely defines the member.
The qualified member name is displayed in the following format:
[DifferentiatingAncestor].[Ancestors...].[Member]
The number of members in the qualified member name depends on the number of levels needed
to uniquely define the duplicate member.
You can choose to display the qualified member name as a cell comment. If a member is a
duplicate, the cell contains a cell comment indicator. Hover over the comment indicator to view
the qualified member name. You may also opt to display the qualified member name directly
on the sheet.
Note that in the Essbase Member Selection dialog box in the Spreadsheet Add-in, if duplicate
members are selected, you can hover over the duplicate member names in the Rules list box to
view the qualified member name. This is true regardless of the comment settings made in Excel.
When viewing the qualified member name as a cell comment, you will see the qualified member
name between the <esskey></esskey> identifier; for example:
<esskey>[East].[New York]</esskey>
After a Save or Save As operation, the qualified member name in the cell comment field is
displayed between the <esskey></esskey> and <essdisp></essdisp> identifiers; for
example:
<esskey>[East].[New York]</esskey><essdisp>[East].[New York]</essdisp>
Do not edit the text between the <esskey></esskey> identifier or the <essdisp></
essdisp> identifier (which appears after a save operation until the next Retrieve). These
identifiers appear in the comment field regardless of the Qualified Member Name display settings
you make. Changing the text between the identifiers may invalidate the worksheet.
Note that you can type comments before or after the identifiers and that these comments are
retained by Essbase with each retrieval.
Formatting the Worksheet
65
An Example Scenario
For this example, the member name “Albany” appears under both the New York and California
members in a Market dimension as well as in a Customer dimension. With duplicate member
name support, Essbase can simply display “Albany” under New York and California in both
dimensions. Depending on the options you select, the qualified member name can be shown as
an Excel comment,
For this example, only the “Show Qualified Member Names as Comments” check box has been
selected in the Display tab of the Essbase Options dialog box.
In the spreadsheet, using the example of the duplicate name “Albany,” if the user hovers over
the indicator for Albany, New York, in the Market dimension, the cell comment reads:
<esskey>[Market].[New York].[Albany]</esskey>
If the user hovers over the indicator for Albany, New York, in the Customer dimension, the cell
comment reads:
<esskey>[Customer].[New York].[Albany]</esskey>
Further, if the user hovers over the indicator for Albany, California, in the Customer dimension,
the cell comment reads:
<esskey>[Customer].[California].[Albany]</esskey>
In a complex spreadsheet, the cell comment allows the user to easily pinpoint a member
combination.
In the above examples, if the “Show Qualified Member Names on Sheet” check box is selected,
for the instances of Albany in the Customer and Market dimensions, the qualified member name
is displayed directly on the worksheet.
Note:
To show qualified member names as comments, you must enable the “Comment Indicator only”
option in Microsoft Excel.
This task is optional. Optional tasks do not need to be performed as part of the tutorial. They are provided for information
only.
In Spreadsheet Add-in, to display duplicate member names:
1. Select Essbase > Options.
2. In the Display tab, select one or both of the following options from the Duplicate Members group:
●
Show Qualified Member Names on Sheet to view the qualified member name on the sheet.
●
Show Qualified Member Names as Comments to view the qualified member name when the cursor is hovered
over the comment indicator in a cell. When you use this option, ensure that the Comment indicator only
option of Excel is selected.
3. Click OK to close the dialog box.
66
Basic Tutorial
Creating Queries Using Essbase Query Designer
So far, you have discovered how to retrieve data and navigate through Spreadsheet Add-in in
an ad hoc fashion. Essbase also provides a query designer so that you can define a database query
for retrieving dimensions and database members into the worksheet.
Before Essbase actually retrieves data, Essbase Query Designer provides a series of panels so that
you can request the data that you want to view in the worksheet. It is particularly helpful when
you know exactly which data you want to retrieve from the server. In addition, you can save a
query and use it again.
The Essbase Query Designer window (shown in Figure 54 on page 69) consists of the following
panels:
●
The navigation panel at the left of the window provides access to the various features in
Essbase Query Designer. You can display all the dimensions used in a particular query and
access the various properties of each dimension member.
●
The hint panel at the top right of the window provides a brief description of the feature that
is selected from the navigation panel.
●
The properties panel at the bottom right of the window provides access to the following
functions:
❍
Layout: Design the layout of the spreadsheet report. To change the default layout, select
a dimension tile and drag it to one of the other dimension boxes. To access the member
select panel and to define a member for a query, double-click a dimension tile.
❍
Member Select: Select members that you want to display in the rows of the spreadsheet
report. To select a member, right-click the member, and select Add to Selection Rules.
You can also double-click a member to add it to the selection rules.
❍
Member Filter: Filter the member selection by attribute, generation name, level name,
pattern string, or UDA.
❍
Data Filter: Retrieve rows of data. The retrieval is based on the ranking of the rows within
certain columns. Use this panel to access the data restriction panel.
❍
Data Restriction: Filter data by comparing it to a fixed data value (including a negative
value), a set of data values, or #Missing data values.
❍
Data Sort: Sort rows in ascending or descending order. The sort is based on column data
values.
❍
Messages and Confirmation: Turn on and turn off certain messages from Essbase Query
Designer.
❍
Help: Access documentation about Essbase Query Designer.
See “About Creating and Changing Queries” on page 68 for an overview of Essbase Query
Designer. The portions of the tutorial that follow step you through the following query design
procedures:
●
“Creating Queries” on page 68
●
“Saving Queries” on page 74
●
“Applying Queries” on page 76
Creating Queries Using Essbase Query Designer
67
●
“Deleting Queries” on page 77
●
“Viewing Messages and Confirmations” on page 77
●
“Accessing Help” on page 78
Note:
Excel query functionality is not supported in Spreadsheet Add-in. Use the Essbase Query
Designer to define database queries.
About Creating and Changing Queries
To access any of the Essbase Query Designer panels, select the appropriate feature listed in the
navigation panel.
As you create a query or make changes to an existing query, the changes are reflected in the
navigation panel. To view a dimension or a member of an open query, click on the specific
dimension or member in the query outline that is displayed in the navigation panel. Selected
members are displayed in the member selection panel on the right.
You can also revise an existing query in the member selection panel. For example, you can delete
a member or add a member to the query by selecting a member in the navigation panel and
making the appropriate changes in the properties panel.
Note:
Files created using the obsolete Retrieval Wizard feature can be opened in Essbase Query
Designer. If, however, a query contains more than two member filters per selection rule or more
than two data restrictions, the member filters may be out of order. To ensure correct results,
rearrange the member filters in the navigation panel, if necessary.
For complete information on Essbase Query Designer options, see the Spreadsheet Add-in online
help.
Caution!
Manipulation of worksheets in VBA such as naming worksheets or moving worksheets may not
work when EQD is running.
Creating Queries
➤ To create a query using Essbase Query Designer:
1 Select Essbase > Query Designer.
Essbase displays the Essbase Query Designer welcome panel, as shown in Figure 54.
68
Basic Tutorial
Figure 54
Essbase Query Designer Displaying Welcome Panel
2 In the navigation panel, select [Book1]Sheet1, right-click, and select New > Query.
The layout panel of Essbase Query Designer is displayed, as shown in Figure 55.
Figure 55
Essbase Query Designer Displaying Layout Panel
3 Define the worksheet layout by dragging the dimension tiles in the properties panel as follows:
a.
Drag Market and Product to the Row location.
b.
Drag Measures to the Page location.
c.
Drag Scenario below Year (in the Column location).
Figure 56 shows the results of dragging the dimension tiles in the properties panel.
Creating Queries Using Essbase Query Designer
69
Figure 56
Changing the Worksheet Layout
4 In the navigation panel, select the Measures dimension by selecting the Measures icon. Alternatively, doubleclick the Measures tile in the layout panel.
The member select properties panel, where you can select a member from the Measures
dimension, is displayed.
Note:
You can select only one member from the dimension in the Page location.
5 In the Members list box, select Profit, right-click, and select Add to Selection Rules.
Alternatively, double-click Profit to add it to the selection rules.
Profit is displayed in the Selection Rules list box.
70
Basic Tutorial
Figure 57
Essbase Query Designer Displaying the Member Select Panel
Note:
In Essbase Query Designer, after you make your selections, you do not need to confirm them;
for example, you do not have to click OK. If you do not select members from any given
dimension, Essbase uses the top member of the dimension.
6 Select members of the Year dimension as follows:
a.
In the navigation panel, click the Year icon. Alternatively, double-click the Year tile in the
layout panel.
The member select properties panel for the Year dimension is displayed.
b.
In the Members list box, select Qtr1, right-click, and select Add to Selection Rules.
c.
Add Qtr2, Qtr3, and Qtr4 to the selection rules in the same manner.
Because Year is in a Column location, you can select one or more members.
The result is shown in Figure 58.
Creating Queries Using Essbase Query Designer
71
Figure 58
Adding Members to the Selection Rules
7 Select members of the Scenario dimension as follows:
a.
In the navigation panel, select Scenario. Alternatively, double-click the Scenario tile in the
layout panel.
The members of the Scenario dimension are displayed in the member select properties
panel.
b.
Select Actual, right-click, and select Add to Selection Rules.
Actual is added to the Selection Rules list box.
c.
In the same manner, add Budget to the Selection Rules list box.
8 Select members of the Product dimension as follows:
a.
In the navigation panel, select Product. Alternatively, double-click the Product tile in the
layout panel.
The members of the Product dimension are displayed in the member select properties
panel.
b.
Select product code 100, right-click, and select Add to Selection Rules.
c.
Repeat the process for product codes 200, 300, and 400.
d.
In the Selection Rules list box, select product code 100, right-click, and then, from the
popup menu, choose Select > Children.
This action selects all children of 100. Essbase displays All Children next to 100 in the
Selection Rules list box, as shown in Figure 59
e.
In the Selection Rules list box, select product code 400, right-click, and choose Select >
Descendants.
Essbase displays All Descendants next to 400 in the Selection Rules list box.
72
Basic Tutorial
Figure 59
f.
Selecting Members of Product
To view the list of all product codes that will be retrieved into the worksheet, select any of
the entries in the Selection Rules list box (for example, 200), right-click, and select
Preview.
Essbase displays the Member Selection Preview dialog box, as shown in Figure 60, with
the selected product dimensions listed.
Figure 60
g.
Selected Members of Product Dimension
Click Close to close the Member Selection Preview dialog box.
9 Select members of the Market dimension as follows:
a.
In the navigation panel, select Market. Alternatively, double-click the Market tile in the
layout panel.
The members of the Market dimension are displayed in the member select properties panel.
b.
In the Members list box, select East, right-click, and select View by > Generation.
Creating Queries Using Essbase Query Designer
73
c.
To pick the second generation of the Market dimension, in the Member list box, select
Region, right-click, and select Add to Selection Rules. Alternatively, double-click Region
to add it to the selection rules.
Region is displayed in the Selection Rules list box.
d.
To view the list of members that will be retrieved into the worksheet, in the Selection
Rules list box, select Region, right-click, and select Preview.
As shown in Figure 61, Essbase displays East, West, South, and Central, which are members
of generation two in Market, in the Member Selection Preview dialog box.
Figure 61
e.
Generation Name Selection
Click Close to close the Member Selection Preview dialog box.
You have now defined a basic query. The outline of the query is displayed in the navigation
panel.
The next topic describes how to save this query.
Saving Queries
➤ To save a query in Essbase Query Designer:
1 In the navigation panel, select [Book1]Sheet1, Query1, and then right-click and select Save Query.
The Essbase Query Designer Save As Query dialog box is displayed, as shown in Figure 62. You
can save your query to the server or to your own client machine. To save to the server, you must
have a security level of database designer or higher. Contact the Essbase system administrator
for more information.
2 In the Location group box, select Client.
74
Basic Tutorial
Figure 62
Essbase Query Designer Save As Query Dialog Box
3 Click the File System button.
Essbase displays the Save As dialog box, as shown in Figure 63.
Figure 63
Save As Dialog Box
4 Select a location, in the File name text box, type Basic1 and then click Save.
As shown in Figure 64, Essbase Query Designer displays information about the query that you
just saved. You will use the Basic1 query again in Chapter 4.
Creating Queries Using Essbase Query Designer
75
Figure 64
Essbase Query Designer Displaying Query Information Panel
The next topic describes how to apply this query.
Applying Queries
➤ To apply a query in Essbase Query Designer:
1 In the navigation panel, select [Book1]Sheet1, Basic1.
2 Right-click the Basic1 query, and select Apply Query.
The result of the query is displayed in the worksheet, as shown in Figure 65.
Figure 65
Results of an Essbase Query Designer Query
In the Display tab under Essbase > Options, if you select Use Styles and Use Sheet Options with
Query Designer, the styles you selected for dimension members will be applied to the initial
query results. If you do not select Use Sheet Options with Query Designer, even if you have
selected Use Styles, they will not be applied to the initial query results. To apply styles, select
76
Basic Tutorial
Essbase > Retrieve. When Essbase returns the data to the worksheet, you are free to further
investigate the data by performing Zoom, Keep Only, Remove Only, and Pivot operations.
Note:
The XLS file that results from applying the query can be saved for possible use as an Essbase data
load data file.
Deleting Queries
You can delete a query only from the location where you saved that query. For example, if you
save a query in the /AnalyticServices/client/sample directory, you can delete the query
from within the sample directory. You cannot delete the query from within Essbase Query
Designer.
Viewing Messages and Confirmations
Essbase Query Designer displays messages and confirmations about certain actions, such as
moves and deletes, in the messages and confirmations panel.
➤ To turn on or turn off messages and confirmations:
1 Select the Messages and Confirmations icon in the navigation panel.
2 Select the check box that is displayed next to that message to turn on (enable) a message.
3 Select the check box again to turn off (make it inaccessible) a message.
This action clears the check box.
Figure 66
Messages and Confirmations Panel
Creating Queries Using Essbase Query Designer
77
Accessing Help
Access online help or the tutorial for Essbase Query Designer by using the help panel. To access
the help panel, in the navigation panel, select Help. For more information on a particular topic,
click the Online Help button in the properties panel. To access the online tutorial, click the
Tutorial button in the properties panel (shown in Figure 67).
Note:
The Tutorial button launches ssxleqd.pdf, which links to the tutorial for Essbase Query
Designer. The tutorial is part of this guide, Essbase Spreadsheet Add-in for Excel User's Guide, and
is located in the essexcel.pdf file. To access the ssxleqd.pdf and essexcel.pdf files from
Essbase Query Designer, they should be installed in $ARBORPATH/docs/pdf and Adobe
Acrobat Reader must be installed. You can obtain Acrobat Reader at www.adobe.com.
Figure 67
Essbase Query Designer Help Panel
Connecting to Multiple Databases from Essbase Query
Designer
You can connect to several databases and create separate queries on each database from Essbase
Query Designer.
➤ To connect to multiple databases from Essbase Query Designer:
1 Log on to Essbase and connect to the server that you want to access.
2 Select Essbase > Query Designer to open Essbase Query Designer.
3 Select [Book1]Sheet1, right-click, and select Connect.
The Essbase System Login dialog box is displayed.
78
Basic Tutorial
Note:
The book may be a number other than 1. For example, it may be [Book5], if four worksheets
are already open.
4 Type your password, and click OK. Select Sample Basic, and click OK.
5 Select [Book1]Sheet2 (or Sheet3), right-click, and select Connect.
The Essbase System Login dialog box is displayed.
6 Type your password, and click OK. Select Samppart Company, and click OK.
Note:
You are restricted to one connection per worksheet. The connection information is displayed
in the query information panel of the Essbase Query Designer only when you open an existing
query or create a new query.
7 Select [Book1]Sheet1, right click, and select New > Query to create a new query based on Sample Basic.
8 Select [Book1]Sheet2, right-click, and select New > Query to create a new query based on Samppart
Company,
9 To open an existing query, right click, and select Open Query.
You are now ready to create queries or to open existing queries.
Applying Worksheet Options to Essbase Query Designer
Results
You can apply any of the worksheet options that you previously set from the Essbase Options
dialog box to the results of a query created in Essbase Query Designer.
➤ To enable Essbase Query Designer to use your previously set worksheet options:
1 Select Essbase > Options.
2 In the Essbase Options dialog box, select the Display tab.
3 Select the Use Sheet Options with Query Designer check box, and select OK.
4 Select Essbase > Retrieve to refresh the worksheet.
Essbase displays the results of the query that you created in Essbase Query Designer and
implements your previously set worksheet options. For example, in Figure 68, aliases, instead
of the numeric codes, are now displayed for the Product dimension.
Creating Queries Using Essbase Query Designer
79
Figure 68
Results of Query with Options Applied
5 Select File > Close to close the worksheet.
You do not need to save the worksheet.
Selecting Members
An Essbase database may contain hundreds or even thousands of members, making it difficult
to remember each member name. You can use the Essbase Member Selection dialog box to find
and select members and to define the layout of members in the worksheet. In addition, you can
use Boolean operators, such as AND, OR, and NOT, or other search parameters to specify criteria
and conditions that members must meet for the member selection. Member selection is an
important method of creating a spreadsheet report for the data that you want to retrieve.
For complete information on the Essbase Member Selection dialog box, see the Spreadsheet
Add-in online help.
➤ To view specific members from the Product dimension:
1 Select File > New or click
to open a new worksheet,
Note:
You should be connected to the Sample Basic database. If you are not connected, follow the steps
in “Connecting to a Database” on page 33.
2 Select Essbase > Retrieve.
3 Select Product and select Essbase > Pivot to display Product as a row, rather than a column, dimension.
Figure 69
80
Basic Tutorial
Initial Worksheet for Member Selection
4 Select Product again, and select Essbase > Member Selection.
Essbase displays the Essbase Member Selection dialog box, as shown in Figure 70. In the Essbase
Member Selection dialog box, Essbase displays the Product dimension in the Dimension dropdown list and its children, Colas, Root Beer, Cream Soda, Fruit Soda, and Diet Drinks, in the
Members list box.
Figure 70
Essbase Member Selection Dialog Box
5 Select Colas and click the Member Information button.
Essbase displays the Member Information dialog box, as shown in Figure 71. The dialog box
provides information about the selected member, such as dimension, generation, level, storage
setting, formula, UDAs, and member comments.
Figure 71
Member Information Dialog Box
6 Click OK to close the Member Information dialog box.
Selecting Members
81
7 In the Essbase Member Selection dialog box, click Add to add Colas to the Rules list box.
Alternatively, you can double-click an item in the Members list box to add the item.
8 Select Product, and click the Find button.
Essbase displays the Find Member dialog box (see Figure 72).
In the Find Member dialog box, you can do pattern-match searches for members in the selected
dimension. You can use wildcard patterns—trailing asterisk *, and single-character match, ?.
Essbase locates the members that match the text string and groups them in outline order, so that
they can be selected as a group.
Note:
You can use the trailing asterisk wildcard and single-character wildcard in the text string. The *
wildcard replaces a string of characters, and the ? wildcard replaces a single character. J?n and
100* are examples of valid wildcard strings; *-10 and J*n are examples of invalid wildcard strings.
9 In the Find Member dialog box, type D* in the text box, as shown in Figure 72.
Figure 72
Find Member Dialog Box
10 Click Find to locate all members that match D*.
Essbase selects the first descendent in the dimension whose name begins with the letter D.
11 Click Find Next.
The next member in the Product dimension whose name begins with the letter D is selected.
12 Continue to click Find Next until all members and descents of the Product dimension whose names begin
with the letter D are selected.
13 Click Close to close the Find Member dialog box.
14 Click Diet Cream once to clear all other selected members and descendants and then click Add.
Essbase displays Colas and the new selection, Diet Cream, in the Rules list box.
15 In the Essbase Member Selection dialog box, select Colas in the Rules list box, right-click, and from the
pop-up menu, select All Children and Member.
Essbase displays All Children and Member next to Colas in the Selection Rules list box.
16 In the Selection Rules list box, select Colas, All Children and Member, and then right-click again.
17 From the pop-up menu, select Subset.
Essbase displays the Subset Dialog box, where you can further define conditions for the selected
member (see Figure 73). You can define a maximum of 50 conditions in the Subset Dialog box.
82
Basic Tutorial
18 In the Subset Dialog box, in the first drop-down list, select Caffeinated. In the second drop-down list, select
Is. In the third drop-down list, select Caffeinated_True.
19 Click the Add as AND Condition button.
Essbase displays Caffeinated = Caffeinated_True in the Conditions list box, as shown in
Figure 73.
Figure 73
Subset Dialog Box (Before Adding Conditions)
When you use Add as AND Condition, the subsetting condition in the Conditions list box is
evaluated using AND logic. AND logic means that the selection must meet the current condition
and the condition that follows it in the Conditions list box.
20 In the first drop-down list, select Ounces. In the second drop-down list, select the logical operator “=”. In
the third drop-down list, select Ounces_12.
21 Click the Add as AND Condition button.
Essbase displays Ounces = Ounces_12 in the Conditions box.
22 In the first drop-down list, select Ounces. In the second drop-down list, select the logical operator “<=”. In
the third drop-down list, select Ounces_32.
23 Click the Add as OR Condition button.
Essbase displays Ounces <= Ounces_32 in the Conditions box.
When you use Add as OR Condition, the subsetting condition in the Conditions list box is
evaluated using OR logic. OR logic means that the selection must meet the current condition
or the condition that follows it in the Conditions list box.
24 In the first drop-down list, select Pkg Type. In the second drop-down list, select Is. In the third drop-down
list, select Bottle.
25 Click the Add as AND Condition button.
Essbase displays Pkg Type = Bottle in the Conditions list box.
26 In the Conditions box, select Ounces <= Ounces_32, and then click the Add ( button.
27 Select Pkg Type = Bottle, and click the Add ) button.
Selecting Members
83
The Add ( and Add ) buttons add a left parenthesis and right parenthesis, respectively, to selected
items. Use parentheses for grouping multiple subsetting conditions to determine the order of
priority for analyzing the conditions.
Each item in the Conditions list box can have either the left or right parenthesis, but not both.
In this example, Essbase first evaluates members that are less than or equal to 32 ounces and are
packaged in a bottle. Essbase then evaluates the results from this condition against members that
are 12 ounces.
Note:
Use the Remove ( ) button to remove an individual group of parentheses from a selected item
in the Conditions list box. Use the Remove All ( ) button to remove all parenthetical groupings
from the Conditions list box.
The Subset Dialog box is displayed as shown in Figure 74.
Figure 74
Subset Dialog Box (After Adding Conditions)
28 Click Preview to open the Member Preview dialog box.
In the Member Preview dialog box, as shown in Figure 75, you can view the resulting member
selection from the conditions that you defined.
84
Basic Tutorial
Figure 75
Member Selection That Results from Subsetting Conditions
29 Click Close to close the Member Preview dialog box.
30 Click OK to close the Subset dialog box and return to the Essbase Member Selection dialog box.
The conditions that you set in the Subset dialog box are displayed in the Rules list box.
31 Select Diet Cream and click the Move Item Up button to change the order in which Diet Cream is displayed
in the worksheet.
Each time you click the Move Item Up or Move Item Down button, the selected item and its
associated subset conditions move up or down one position in the Rules list box. You can move
only the top-level item (the item you added from the Members list box), not the individual
subset conditions.
Figure 76
Selecting Members Completed
32 Click Preview to preview the members that will be retrieved in the worksheet.
Essbase displays the Member Preview dialog box, as shown in Figure 77.
Selecting Members
85
Figure 77
Members to be Retrieved in the Worksheet
33 After previewing the list, click Close.
34 Click OK to close the Essbase Member Selection dialog box and insert the new members into the worksheet
(see Figure 78).
Figure 78
Result of Selecting Members
Note:
The FlashBack command cannot undo a Member Selection action.
35 Starting with Diet Cream, type Year next to each product (see Figure 79).
You need to perform this step so that every product has a matching Year dimension associated
with it in the report.
Figure 79
Worksheet After Adding the Year Dimension to All States
36 Select Essbase > Retrieve to update the values in the worksheet.
Essbase retrieves data for the members that you selected and also applies the styles that you
previously set. The result is shown in Figure 80.
86
Basic Tutorial
Figure 80
Result After Retrieving with Member Selection
Saving and Disconnecting
After performing basic retrieval, navigation, and formatting tasks, you can save worksheets and
disconnect from Essbase. This section instructs you in the following procedures:
●
“Saving a Worksheet” on page 87
●
“Disconnecting from Essbase” on page 87
●
“Logging Off” on page 88
Saving a Worksheet
At any point during the Essbase session, you can save the active worksheet with the commands,
File > Save or File > Save As. Thus, you can keep a personal library of database views. You can
open the worksheet during a later session and retrieve the latest data values to update the view.
Note:
To save the Essbase option settings in a worksheet, you must explicitly go to the Essbase Options
dialog box and set the options prior to saving the worksheet. Otherwise, when you open the
same worksheet in a new Spreadsheet Add-in session, the options settings for the current session
will override any previous settings for the worksheet. Make sure that the worksheet for which
you option settings saved is not a protected worksheet. Essbase cannot save option settings for
a protected worksheet.
Disconnecting from Essbase
When you finish retrieving and navigating through data, disconnect from the server to decrease
user count and to make a port available on the server for other Spreadsheet Add-in users.
➤ To disconnect from the server:
1 Select Essbase > Disconnect.
Essbase displays the Essbase Disconnect dialog box, where you can disconnect any worksheet
that is connected to a database.
Saving and Disconnecting
87
Figure 81
Essbase Disconnect Dialog Box
2 From the list, select a worksheet name, and then click Disconnect.
3 Repeat step 2 until you have disconnected all active sheets.
4 Click Close to close the Essbase Disconnect dialog box.
Note:
You can also disconnect from the server by closing the spreadsheet application. An abnormal
shutdown of a Spreadsheet Add-in session, such as a power loss or system failure, does not
disconnect your server connection.
Logging Off
Essbase provides two administrative features that control user connections:
●
Forced Logout, where an administrator disconnects users at any point in time. This logout
usually occurs when maintenance operations are performed on databases.
●
Auto Logout, where Essbase automatically disconnects users that are inactive for a timed
interval specified by an administrator.
On to Advanced Tasks
Now that you have completed the basic tutorial, you are ready to move on to more complex
tasks. In the next chapter, you will use the sample spreadsheet files to perform advanced tasks
in Essbase Spreadsheet Add-in.
88
Basic Tutorial
4
Advanced Tutorial
In This Chapter
Preparing to Begin the Tutorial....................................................................................................89
Performing Advanced Retrieval Tasks ............................................................................................94
Using Linked Reporting Objects ................................................................................................ 133
Connecting to Multiple Databases ............................................................................................. 144
Ways to Access Linked Partitions............................................................................................... 145
Updating Data on the Server.................................................................................................... 147
Database Calculation............................................................................................................ 149
Creating Multiple Worksheets from Data ...................................................................................... 150
Working with Currency Conversions ............................................................................................ 155
The tutorial that you completed in Chapter 3 teaches basic data retrieval and navigation concepts
for Essbase Spreadsheet Add-in. This chapter builds on your basic skills and expands your
knowledge of Essbase and Spreadsheet Add-in.
In this advanced tutorial, you use several sample spreadsheet files for Excel that were installed
as part of the default Essbase installation. These files are stored in the \AnalyticServices
\client\sample directory. You also reconnect to the Sample Basic database.
Preparing to Begin the Tutorial
Before you begin the advanced tutorial, complete the steps in the next two sections, “Connecting
to a Database” on page 89 and “Setting Essbase Options” on page 91. In addition, be sure to
read “Following Guidelines During the Tutorial” on page 32 and “Reviewing the Sample Basic
Database” on page 33 for important information about what you should expect as you perform
the tutorial steps.
Connecting to a Database
To access Essbase data for the advanced tutorial, first connect to the Sample Basic database on
the server. This tutorial assumes that you have the appropriate privileges to connect to a server,
an application, and a database.
Preparing to Begin the Tutorial
89
➤ To connect to an Essbase Server, Essbase application and database:
1 Select Essbase > Connect.
The Essbase System Login dialog box is displayed, as shown in Figure 82.
Figure 82
Essbase System Login Dialog Box
Note:
To complete the steps that follow, you need to know the name of the Essbase Server, your
username, and your password. If you do not have this information, contact the Essbase system
administrator.
2 From the Server drop-down list, select the server that you want to access and then press Tab to move to the
Username text box.
If the server name that you want is not shown in the list, type the name of the server that you
want to access in the Server text box and press Tab.
3 In the Username text box, type your username and then press Tab to move to the Password text box.
4 In the Password text box, type your password.
Note:
You can change your password when you are connected to a server. See “Changing a Password”
on page 35.
5 Click OK to connect to the server.
Essbase displays a list of available application and database pairs in the Application/Database
list box. An instance of Essbase Server enables simultaneous access to multiple applications. An
application can contain multiple databases. Only the databases to which you have security access
are displayed in the list.
For this tutorial, you use the Sample Basic database. If the Sample Basic database was installed
as part of the Essbase installation, it is shown in the list. If Sample Basic is not shown in the
Application/Database list box, ask the Essbase system administrator to install it.
90
Advanced Tutorial
Figure 83
Available Application and Database Pairs
6 In the Application/Database list box, double-click Sample Basic, or select Sample Basic and then click
OK.
If the application is not already running, Essbase automatically starts it. There may be a brief
pause as the application loads; the time required to start an application depends on the number
of databases, the sizes of the databases, and the sizes of the indexes of the databases that are
contained within the applications.
Setting Essbase Options
Before you begin the tutorial, make sure that the worksheet options are set to the initial settings
shown in the Figure 84 through Figure 87.
Note:
For information on each option in the Essbase Options dialog box, see the Spreadsheet Add-in
online help.
➤ To set the Essbase display options:
1 Select Essbase > Options.
2 In the Essbase Options dialog box, select the Display tab.
3 Select the appropriate check boxes and option buttons so that your display matches Figure 84.
Preparing to Begin the Tutorial
91
Figure 84
Initial Settings for Display Options
4 Select the Zoom tab.
5 Select the appropriate check boxes and option buttons so that your display matches Figure 85.
Figure 85
Initial Settings for Zoom Options
6 Select the Mode tab.
7 Select the appropriate check boxes and option buttons so that your display matches Figure 86.
92
Advanced Tutorial
Figure 86
Initial Settings for Mode Options
8 Skip the Style tab and select the Global tab.
9 Select the appropriate check boxes and option buttons so that your display matches Figure 87.
Figure 87
Initial Settings for Global Options
10 Select OK to save the settings for this session and close the Essbase Options dialog box.
The settings in the Essbase Options dialog box may change as you access the various sample
spreadsheet files as part of the tutorial. Leave the settings as they are unless the tutorial advises
you to change them. If you have different option settings, the illustrations presented in this
chapter may not match the worksheet view.
Preparing to Begin the Tutorial
93
Performing Advanced Retrieval Tasks
The tutorial in Chapter 3 describes how to perform basic data retrieval and navigation tasks in
Spreadsheet Add-in. These are the advanced retrieval tasks discussed in this chapter:
●
“Filtering Data” on page 94
●
“Sorting Data” on page 99
●
“Retrieving Data into Asymmetric Reports” on page 101
●
“Drilling Down to a Sample of Members” on page 103
●
“Working with Formatted Worksheets” on page 104
●
“Preserving Formulas When Retrieving Data” on page 109
●
“Retrieving a Range of Data” on page 112
●
“Retrieving Data by Using a Function” on page 114
●
“Retrieving Dynamic Calculation Members” on page 117
●
“Specifying the Latest Time Period for Dynamic Time Series” on page 119
●
“Using Free-Form Reporting to Retrieve Data” on page 122
●
“Retrieving Data Using Visual Explorer” on page 130
Remember that you can perform common data retrieval tasks in any of the following ways:
●
Selecting commands from the Essbase menu on the spreadsheet application menu bar
●
Clicking the appropriate buttons on the Essbase toolbar
●
Double-clicking the primary or the right-mouse button in the appropriate cell (for Retrieve,
Zoom In, and Zoom Out commands only, and the Linked Objects command, if you have
enabled that option).
Filtering Data
Despite the ease and speed with which you can navigate through large Essbase databases, it is
not practical to use the capabilities of the spreadsheet application to filter and sort very large
databases; however, Essbase includes powerful data filtering and sorting capabilities.
In Chapter 3, you learned to use Essbase Query Designer to define a dimensional layout and to
select members to view. Essbase Query Designer also provides a powerful tool to define
conditional retrievals.
Note:
If you skipped the tutorial in Chapter 3, follow the steps in “Creating Queries Using Essbase
Query Designer” on page 67 to create and save the Basic1 query.
94
Advanced Tutorial
➤ To become familiar with the capabilities of Essbase Query Designer, work with the query, Basic1,
that you saved in Chapter 3, and perform the following steps:
1 Select Essbase > Query Designer.
The query information panel of Essbase Query Designer is displayed.
2 In the navigation panel, select [Book1]Sheet1.
3 Right-click and select Open Query.
The Open Query dialog box is displayed.
4 From the location that you specified in Chapter 3, select the Basic1 file.
5 Click OK.
The member selection, displayed in the properties panel, remains unaltered from the last Essbase
Query Designer session.
6 From the navigation panel, select Data Filtering.
Essbase displays the data filter settings in the data filter panel, as shown in Figure 88. The filter
controls the number of data rows that are retrieved. The number is based on the column criteria
that you define. You can define data filtering criteria on data values that reside in one or more
columns of the view.
Figure 88
Data Filter Panel
The data filtering panel contains the following items:
●
A check box for ranking a specified number of top rows or a specified number of bottom
rows of data.
You can select the highest or lowest rows. Your selection is based on previously selected row
dimension members. When using the top or bottom criterion, you specify the number of
rows, such as “top 10.” The default is the top 25 rows.
Performing Advanced Retrieval Tasks
95
●
A “Dimension being ranked” drop-down list box to specify the dimension to which ranking
should be applied.
●
A “Column used for ranking” drop-down list box to specify the data column on which data
values are based.
●
A “Data Restrictions” list box to specify standard data comparison operations, such as greater
than, less than, and equal to.
You can apply the comparison operator to data values, including negative data values, in
one or more data columns; you can even apply criteria to compare values between two
columns.
●
Buttons for OR and AND operators.
If you define more than one criterion for a column, you can use these operators to link the
criteria.
7 Select the Top check box, and enter a value of 30 in the Rows text box.
When you apply the query, Essbase retrieves the top thirty rows of the dimension.
8 From the Dimension being ranked drop-down list, select Product.
Product is the dimension to which ranking should be applied.
9 From the Column used for ranking drop-down list, select Qtr1, Actual.
Qtr1, Actual is the column on which data values are based.
10 In the navigation panel, select the Data Filtering icon. Right-click and select Apply Query.
Your query results should look like Figure 89.
Figure 89
96
Advanced Tutorial
Data Filtering Query Results
You can further filter the data output by specifying data comparison operations in the Data
Restrictions list box.
11 In the navigation panel, select the Data Filtering icon.
The data filters that you specified are displayed in the properties panel.
12 In the Data Restrictions list box, double-click.
The data restriction settings are displayed in the properties panel.
13 Select the A value of option and type 500 in the value text box.
Observe that the “is” option in the Data drop-down list box changed to =.
14 Click the down arrow of the Data drop-down list box and select <=.
15 Click the down arrow of the Column used for filter drop-down list box and select Qtr1, Actual.
16 In the navigation panel, select the Data Filtering icon, right-click, and select Apply Query.
Notice that the query results now reflect only Actual and Budget data that are less than or equal
to 500.
17 In the navigation panel, select the Data Filtering icon to display the data filter setting in the properties
panel.
18 In the Data Restrictions list box, select Qtr1, Actual <= 500, right-click, and select New Data
Restriction.
19 In the Data drop-down list box, click the down arrow and select <.
20 Select the option, the data values in, and from the drop-down list, select Qtr2, Actual.
21 Under Combined With Other Restrictions, select the Or option.
22 In the navigation panel, click the Data Filtering icon to access the data filter panel.
23 In the Data Restrictions list box, double-click to create a new data restriction.
24 In the Data drop-down list box, click the down arrow and select is not.
25 Click the button for the #Missing Value option.
This option instructs Essbase to discard data that have #Missing values.
26 In the Column used for filter drop-down list, select Qtr1, Actual.
27 Under Combined With Other Restrictions, select the And option.
28 In the navigation panel, click the Data Filtering icon to access the data filter panel.
The data restrictions should be displayed as shown in Figure 90:
Performing Advanced Retrieval Tasks
97
Figure 90
Data Filtering
29 Select the Data Filtering icon, right-click, and select Apply Query.
Essbase retrieves data for all the quarters. Notice that the retrieved data for Qtr1, Actual is less
than or equal to 500 or is less than Qtr2, Actual. The results should be displayed as shown in
Figure 91:
Figure 91
Data Filtering Results
If you wanted to delete all data restrictions, select the Data Filtering icon in the navigation panel,
right-click, and select Delete All Data Restrictions. Alternatively, select any data restriction in
the Data Restriction box, right-click, and select Delete All Data Restrictions.
98
Advanced Tutorial
To delete a particular data restriction, select the data restriction in the query outline, right-click,
and select Delete Data Restriction. Alternatively, select the data restriction in the Data Restriction
box, right-click, and select Delete Data Restriction.
Sorting Data
In the data sort panel, you can sort the output from the Basic1 query in ascending or descending
order.
➤ To sort the query:
1 From the navigation panel, select the Data Sorting icon.
As shown in Figure 92, the data sorting settings are displayed in the properties panel. You can
specify data sorting criteria that affect the order in which the selected rows are retrieved in the
data sorting panel.
The data sorting panel contains the following items:
●
A “Dimension being sorted” drop-down list box that lists the dimensions specified in row
format in the query.
●
A “Column used for sort” drop-down list box where you select one or more dimensions to
be specified in column format in the query.
●
An Ordering drop-down list box where you apply an ascending or descending sort order
for the selected column.
You can also specify sorting to occur over a specific row dimension group. For example, you
can sort by Product or by Market.
Figure 92
Data Sorting Panel
2 Double-click on the statement (double click to create a new sort rule).
Performing Advanced Retrieval Tasks
99
The selection defaults to Qtr1, Actual. The sort order defaults to Ascending in the Ordering list
box.
3 Click Ascending.
A down arrow is displayed next to Ascending.
4 Click the down arrow next to Ascending.
Descending is displayed below Ascending, as shown in the properties panel in Figure 93.
5 In the Ordering drop-down list, select Descending.
Figure 93
Specifying Data Sorting Order
6 Double-click on the statement (double click to create a new sort rule).
A new data sorting rule is added. The new selection defaults to “Qtr1, Actual.”
7 Click the down arrow next to Qtr1, Actual and select Qtr1, Budget.
Observe that the order in the Ordering list box has defaulted to Ascending.
8 In the navigation panel, under Data Sorting, select Ascending, Qtr1, Budget, right-click, and select Delete
Sorting Rule.
The “Ascending, Qtr1, Budget” sorting rule is deleted from the query.
9 In the navigation panel, select the Data Sorting icon, right-click, and select Apply Query.
Essbase returns the results sorted in descending order for each quarter, as shown in Figure 94:
100 Advanced Tutorial
Figure 94
Result of Filtering and Sorting Data
Note:
The values that you are ranking and sorting must be the same. For example, you cannot specify
Product in the “Dimension being ranked” drop-down list box and Market in the “Dimension
being sorted” drop-down list box. If you specify different values, Essbase Query Designer
automatically changes both values to the last specified value.
10 To close the worksheet, select File > Close.
You do not need to save the worksheet.
Retrieving Data into Asymmetric Reports
When you retrieve data into a worksheet, the resulting report can be either symmetric or
asymmetric. Symmetric reports are characterized by repeating identical groups of members. For
example, Figure 94 on page 101 shows a symmetric report that contains Actual and Budget
members nested below Year members (Qtr1, Qtr2, Qtr3, and Qtr4).
An asymmetric report is characterized by groups of nested members that differ by at least one
member. There can be a difference in the number of members or in the names of members.
You can create asymmetric reports in one of the following ways:
●
Enter member names into the worksheet in free-form retrieval mode.
●
Use a drill action with the Within Selected Group option selected from the Zoom tab of the
Essbase Options dialog box.
●
Suppress rows that contain missing values, zero values, or underscore characters during data
retrievals.
Performing Advanced Retrieval Tasks 101
If you retrieve data into an asymmetric report, Essbase must perform additional internal
processing to maintain the asymmetric layout. This processing may increase the retrieval time
on large reports. For more information regarding optimizing reports, see the Hyperion Essbase
- System 9 Database Administrator's Guide.
As part of the default Essbase installation, the Asymm.xlsl sample file is provided that illustrates
how to create asymmetric reports.
➤ To view the sample file, Asymm.xls:
1 Select File > Open.
2 From the \AnalyticServices\client\sample directory, open the Asymm.xls file.
Depending on how software is installed on your PC, the file may not be available or may be
located in a different directory. Contact the Essbase system administrator for more information.
Figure 95
Asymmetric Report
The sample file row and column dimension groups are asymmetric. Thus, the nested member
groups from the Product dimension differ in member content within respective markets. For
example, Colas and Fruit Soda are included in East but not in West. In addition, Actual data is
displayed for Qtr1, whereas Budget data is displayed for Qtr2, Qtr3, and Qtr4. Also notice that
the sample file displays styles for members of the Scenario and Year dimensions.
3 Leave the sample file open for the next tutorial task.
Pivoting in Asymmetric Reports
When you pivot a group of members in an asymmetric report, Essbase keeps only unique
members from dimensions that are not involved in the pivot.
➤ To use the open Asymm.xls file to illustrate this point:
1 Using the right-mouse button, drag East to the cell below Qtr1.
The result is shown in Figure 96.
102 Advanced Tutorial
Figure 96
Result of Pivoting in an Asymmetric Report
Essbase combines the Product members into all unique members. For example, Root Beer, which
is displayed twice in Figure 95 on page 102, is displayed only once in the current view. Colas,
which is displayed in only one market in Figure 95, now is displayed in East and West.
Essbase also removes the blank line between Product row groups. A pivot action always
eliminates any rows or columns in which all cells are empty.
2 Close the sample file without saving the changes.
Drilling Down to a Sample of Members
Essbase is a multidimensional database engine that provides support for ad hoc analysis. Such
analysis is entirely driven by the intuition of the analyst and can be time-consuming as data
volume increases. Large cubes tend to have more dimensions and sometimes more levels, making
hierarchical navigation very cumbersome.
By drilling down to a portion of the members in an Essbase database, you can quickly analyze a
large multidimensional database with a focus on data trends. This type of drilling down is also
called “metadata sampling.”
Metadata sampling enables you to analyze on large cubes with a focus on data trends or to
approximate information in the initial stages. Because you query on a “sample” of the members,
retrieval is quick. Metadata sampling enables you to drill down to a portion of the vast number
of members of an Essbase database in a fraction of the time that it usually takes to analyze the
entire Essbase database. You can view many samples in a small amount of time and make early
decisions. Later, you can follow up with organized data exploration.
With the introduction of Hybrid Analysis, you can store part of an Essbase cube in a relational
database. Metadata sampling enables you to drill down on all members that you specify, whether
they reside in Essbase or in an underlying relational database.
To drill down to a sample of members, you must to connect to a server, an application, and a
database. Next, enable sampling in the Spreadsheet Add-in for Excel and set a percentage amount
of data to query when drilling down to more detail (performing a Zoom In operation).
This task is optional. Optional tasks do not need to be performed as part of the tutorial. They are provided for information
only.
In Spreadsheet Add-in, to drill down to a sample of members:
1. Select Essbase > Sample Data (Zoom In) to enable sampling.
A check mark displayed next to the Sample Data (Zoom In) menu command indicates that sampling is
enabled.
Performing Advanced Retrieval Tasks 103
2. Select Essbase > Options.
3. In the Essbase Options dialog box, select the Zoom tab.
4. In the Sampling Percentage text box, type an integer between 1 and 100 to represent the approximate percentage
amount of the Essbase cube to query during a Zoom In operation.
The default value is 100.
Note: If Hybrid Analysis is enabled and in use, the sampling percentage also applies to queries on the underlying
relational database.
5. Click OK to save the sampling percentage integer that you entered and any other Zoom options that you have set.
The Essbase Options dialog box is closed and you are returned to the spreadsheet.
6. In the spreadsheet, select the member on which you want to drill down.
7. Select Essbase > Zoom In or double-click the primary mouse button.
For example, if you typed 50 in the Sampling Percentage text box, approximately 50 percent of the members
from your Essbase database and, if applicable, from the specified columns of the relational database are
queried when you select Essbase > Zoom In.
Notes on Sampling
●
●
When drilling down on Hybrid Analysis, the following limitations apply:
❍
Sampling with the All Levels option is not supported with Hybrid Analysis members.
❍
Sampling with Same Level and Same Generation options are not supported.
When sampling is enabled, a combination of the algorithms used by Essbase and the
sampling percentage you set sometimes makes the following scenarios possible:
❍
During a Zoom In operation, no members are retrieved. This can happen in some cases
where a dimension is small.
❍
During a Zoom In operation, all members are retrieved. This can happen in some cases
where the sampling percentage is very small.
Working with Formatted Worksheets
In addition to providing flexible, ad hoc retrievals, Essbase supports retrieving data into
formatted worksheets. A worksheet can contain the following formats:
●
Spaces between rows and columns
●
Cell values that contain text or data that is not defined in the database outline
●
Member names in noncontiguous locations at the top of a worksheet
●
Spreadsheet formulas (see also “Preserving Formulas When Retrieving Data” on page
109)
●
Visual cues (styles)
After you format and save a worksheet, you may want to retrieve and navigate through new data
in the existing worksheet format. These topics provide the following information on working
with formatted worksheets:
●
104 Advanced Tutorial
“Observing the Rules for Working with Formatted Worksheets” on page 105
●
“Retrieving Data into Formatted Worksheets” on page 105
●
“Pivoting Data on Formatted Worksheets” on page 107
Observing the Rules for Working with Formatted Worksheets
Observe the following rules when retrieving data into a formatted worksheet:
Rule 1
In the worksheet, no numeric cells can be located before the first Essbase data cell. For example,
in Figure 97 on page 106, the first Essbase data cell is B6. Neither any cell in rows 1 through 5
nor cell A6 can contain numeric values. Also, these cells cannot contain formulas that resolve
to numeric values.
Rule 2
A cell that lies within a row or column of Essbase data cannot contain text or numeric values.
For example, in Figure 97 on page 106, the cells in columns B, C, D, and F and rows 6 through
9 and 11 through 14 cannot contain any nondata text or numbers, for such values may be
overwritten, or emptied, by the retrieved data. These cells can contain formulas, however, if
Formula Preservation options are used. For more information on Formula Preservation options,
see “Preserving Formulas When Retrieving Data” on page 109.
Tip:
If you need to preserve text in a cell, define that text or value as a spreadsheet formula, and use
the Formula Preservation options.
Rule 3
The Pivot command is not available when the Retain on Retrieval check box is selected in the
Mode tab of the Essbase Options dialog box.
Rule 4
The Pivot command removes all cells that contain text other than database member names.
Retrieving Data into Formatted Worksheets
As part of the default Essbase installation, the P&l.xls sample file is provided that illustrates
how to retrieve data into a formatted worksheet. The sample file illustrates how to retrieve data
into a worksheet that contains formatted text, formulas, and protected cells.
➤ To view the P&l.xls worksheet:
1 Select File > Open.
2 From the \AnalyticServices\client\sample directory, open the P&l.xls file.
An example of the worksheet is shown in Figure 96.
Performing Advanced Retrieval Tasks 105
Note:
Depending on how software is installed on your machine, the file may not be available or may
be located in a different directory. Contact the Essbase system administrator for more
information.
Figure 97
A Sample Formatted Worksheet
3 Select Essbase > Options and select the Display tab.
4 In the Cells option group, make sure that Adjust Columns is checked.
5 Select the Mode tab.
6 In the Formula Preservation group, select the Retain on Retrieval check box to enable Formula Preservation
mode.
Note:
When Retain on Retrieval is selected, there may be a slight delay in retrieval time.
7 Click OK.
By default, an Essbase retrieval overwrites the spreadsheet formula with data values in the
retrieval area of a worksheet. The retrieval process also eliminates formulas in cells outside the
retrieval area. The Retain on Retrieval option, however, enables you to define retrievals that do
not overwrite formulas in any area of the worksheet.
8 Select Essbase > Retrieve to update the worksheet with the latest data values.
Essbase determines that some text cells in the worksheet do not correspond to database member
names. When Essbase is unable to resolve text in the worksheet, the message shown in
Figure 98 is displayed:
106 Advanced Tutorial
Figure 98
Essbase Unknown Member Message
In this example, the first unknown member detected is Market: (in cell A1). Essbase does not
recognize the colon (:) that follows Market in the cell. If you click Yes, Essbase displays the next
unknown member; if you click No, Essbase continues with the retrieval.
Note:
If you work with formatted worksheets often, you may want to configure Essbase so that this
message is not displayed. For information on configuring to avoid the Essbase message, see
“Pivoting Data on Formatted Worksheets” on page 107.
9 Click No to close the dialog box and continue with the retrieval.
Essbase retrieves new data but retains the formatting and formulas in the worksheet. The result
is shown in Figure 99.
Figure 99
Result of Retrieving on a Formatted Worksheet
10 Close the file without saving it.
Note:
The section on “Preserving Formulas When Retrieving Data” on page 109 provides additional
tutorial tasks that show you how to take advantage of all the Formula Preservation options.
Pivoting Data on Formatted Worksheets
Using the Pivot command, you can produce ad hoc reports in both formatted and unformatted
worksheets. A formatted worksheet, however, may contain labels and formulas that make the
result of a pivot operation ambiguous. The pivot is designed to compress and retain only the
Performing Advanced Retrieval Tasks 107
database elements represented in the worksheet. The worksheet also retains labels in areas that
are not overwritten by pivoted data.
Note:
Essbase prevents pivot operations on worksheets that contain formulas when Formula
Preservation mode is active.
As part of the default Essbase installation, the Inv.xls sample file is provided which illustrates
how to pivot data in a worksheet. The sample file was saved with the Retain on Retrieval option
disabled so that you can pivot on its worksheets.
➤ To view the Inv.xls worksheet:
1 Select File > Open.
2 From the \AnalyticServices\client\sample directory, open the Inv.xls file.
An example of this worksheet is shown in Figure 100.
Note:
Depending on how software is installed on your PC, the file may not be available or may be
located in a different directory. Contact the Essbase system administrator for the location of the
file.
Figure 100
Formatted Worksheet Before Pivoting
3 Select Essbase > Options and select the Global tab.
4 In the Display Messages group box, clear the Display Unknown Members check box to avoid seeing the
Essbase messages when working with formatted worksheets, and click OK.
5 Using the right-mouse button, drag Sales (in cell A5) to the cell nested below Jan (C4).
Essbase pivots the Sales member group so that it is nested below the monthly members. During
the pivot, however, Essbase retains only database elements. For example, all data for Stock to
Sales and Adjusted for Audit is deleted during the pivot.
The result is shown in Figure 101.
108 Advanced Tutorial
Figure 101
Result of Pivoting on a Formatted Worksheet
6 Close the file without saving it.
Preserving Formulas When Retrieving Data
In “Retrieving Data into Formatted Worksheets” on page 105, you used the Retain on Retrieval
option to preserve formatting and formulas in an existing worksheet. Collectively, the Formula
Preservation options enable you to retain formulas during data retrievals, keep and remove only
operations, and drill operations. In addition, Essbase can replicate formulas for additional
members retrieved into the worksheet as part of a drilling operation. This topic shows you how
to create a report using all of the Formula Preservation options.
Keep in mind the following guidelines and restrictions when using the Formula Preservation
options:
●
On the Mode tab of the Essbase Options dialog box, you must have the Advanced
Interpretation option selected to enable Retain on Retrieval. The Formula Preservation
options do not work with free-form retrieval mode.
●
You must enable Retain on Retrieval to enable Retain on Keep and Remove Only and Retain
on Zooms.
●
You must enable Retain on Zooms to enable Formula Fill.
●
When you select the Retain on Retrieval check box, the Suppress #Missing Rows and Zero
Rows options on the Display tab are not selectable. If you have selected either of the Display
options, the Formula Preservation options become unselectable automatically.
●
When you select the Retain on Zooms check box, the Remove Unselected Groups option
on the Zoom tab is not selectable. When you enable the Remove Unrelated Groups option,
Retain on Zooms becomes unselectable automatically.
●
When Retain on Retrieval is selected, retrieval time may be slightly delayed.
●
As a general rule, insert a blank row as the last row in the formula range. This action ensures
that the cell range in the formula expands properly when you drill down on members when
Retain on Zooms is selected.
●
Formula arrays are not supported in Spreadsheet Add-in when the preserve formula option
is on. If formula arrays are in the worksheet, Essbase does not preserve these types of
formulas.
Performing Advanced Retrieval Tasks 109
➤ To preserve formulas when retrieving or retaining data:
1 Select File > New or click
to open a new worksheet.
2 Select Essbase > Retrieve.
3 In cell A2, drill down (double-click) on Year.
4 Press and hold down the Alt key and, in cell E1, drill down (double-click) on Scenario.
5 Select cell G3 and enter the following formula in the cell: =B3/B$7*100, as shown in Figure 102.
The $ in front of the 7 anchors the formula to the Year member.
Figure 102
Entering a Formula into a Cell
6 Press Enter.
The spreadsheet calculates the formula that you entered in cell G3 and now reflects Qtr1 as a
percentage of Year. The result is shown in Figure 103.
Figure 103
Result of Calculated Formula with Essbase Data
7 Select Essbase > Options and select the Mode tab.
8 In the Formula Preservation group box, select the check boxes for Retain on Retrieval and Retain on Keep
and Remove Only, and click OK.
9 In cells D2, E2, and F2, respectively, select Variance, %Variance, and Scenario.
10 Select Essbase > Remove Only.
Essbase removes the selected columns but retains the formula that you entered, keeping it with
the retained dataset. The result is shown in Figure 104.
110 Advanced Tutorial
Figure 104
Result of Removing Columns With Retain on Keep and Remove Only Selected
11 Select Essbase > Options and select the Mode tab.
12 In the Formula Preservation group box, select the check box for Retain on Zooms and click OK.
13 In cell A3, drill down (double-click) on Qtr1.
Essbase drills down on Qtr1 and moves the formula down with the Qtr1 member. The result is
shown in Figure 105.
Figure 105
Result of Drilling Down with Retain on Zooms Enabled
14 Select Essbase > FlashBack.
15 Select Essbase > Options and select the Mode tab.
16 In the Formula Preservation group box, select the Formula Fill check box and click OK.
17 In cell A3, drill down (double-click) on Qtr1.
Essbase drills down on Qtr1 and replicates the formula for each member of Qtr1 (Jan, Feb, and
Mar). To view the replicated formulas, click in cells D3, D4, D5, and D6 and look at the new
syntax in the spreadsheet formula bar. The result is shown in Figure 106.
Figure 106
Result of Drilling Down with Formula Fill Enabled
18 Before moving on with the tutorial, complete each of the following tasks:
a.
Select Essbase > Options and select the Mode tab.
Performing Advanced Retrieval Tasks 111
b.
Clear all of the Formula Preservation options.
c.
Select File > Close to close the worksheet.
You do not need to save the worksheet.
Retrieving a Range of Data
In a typical worksheet, you can select a range of cells by dragging the mouse across the worksheet.
You can also select a range of cells and tell Essbase to restrict the data retrieval to the selected
range in the worksheet. Retrieving a range of data is particularly useful in the following situations:
●
A worksheet contains multiple reports.
●
A worksheet contains extraneous information that is not supported in a formatted report
retrieval.
●
You need to retrieve only a small subset of values from the server, thus dramatically
decreasing retrieval time for large datasets.
●
You need to retrieve data to an area of the worksheet other than the first column.
As part of the default Essbase installation, the Profit.xls sample file is provided that illustrates
how to retrieve a range of data.
➤ To view the Profit.xls file:
1 Select File > Open.
2 From the \AnalyticServices\client\sample directory, open the Profit.xls file.
Note:
Depending on how software is installed on your PC, the file may not be available or may be
located in a different directory. Contact the Essbase system administrator for the location of the
file.
As shown in Figure 107, when you open Profit.xls, the range of cells from B2 through F9
has already been selected for you.
112 Advanced Tutorial
Figure 107
Selected Range of Cells for Retrieval
3 Select Essbase > Retrieve to update the selected range.
Essbase updates only the data in the selected range of cells, as shown in Figure 108.
Figure 108
Result of Retrieving First Range of Data
4 Select cells B12 through G16, as shown in Figure 109.
Figure 109
Selecting Cells for Retrieval
5 Select Essbase > Retrieve once again to update the selected range.
Essbase updates the data in the selected range, as shown in Figure 110.
Performing Advanced Retrieval Tasks 113
Figure 110
Result of Retrieving Second Range of Data
6 Close the file without saving it.
Retrieving Data by Using a Function
The Essbase cell retrieve function, EssCell, retrieves a single database value into a worksheet cell.
Enter an EssCell function directly into a worksheet or select an EssCell function from the
spreadsheet menu bar.
Note:
You must be connected to a database to use EssCell.
EssCell retrieves data when you perform an Essbase retrieval or when you recalculate a worksheet
through Excel. As part of the default Essbase installation, the Summary.xls sample file is
provided with EssCell functions already set in cells B16 and B17.
➤ To view the Summary.xls file:
1 Select File > Open.
2 From the \AnalyticServices\client\sample directory, open the Summary.xls file.
Note:
Depending on how software is installed on your PC, the file may not be available or may be
located in a different directory. Contact the Essbase system administrator for the location of this
file.
114 Advanced Tutorial
Figure 111
Worksheet Containing EssCell Functions
In Excel, cells B16 and B17 contain the EssCell function. If you select either of these cells, you
can view the syntax for the EssCell function in the formula bar at the top of the worksheet.
The EssCell function in Excel is defined in a cell as follows:
=EssCell(mbrList)
In Excel, mbrList is one of the following factors:
●
A null value. If the parameters of the function are empty, Essbase returns the data value
from the top of each dimension.
●
A comma-delimited list of member names. Member names must be enclosed in double
quotation marks, with only one member per dimension allowed. If you list no members
from a particular dimension, the function returns the data value from the top member of
the unspecified dimension. Furthermore, you can include aliases in the member list, subject
to the same rules as member names.
●
A worksheet cell reference. The reference must point to a cell that contains a valid member
name. Member names, such as 200 and 300-10, need to be formatted as text cells, rather
than numeric cells.
For example, the syntax for the EssCell function in cell B16 in the Summary.xls file for
Excel is as follows:
=EssCell("Sales", A1, A2, B4, F5)
When you open the worksheet, the values in these cells are #N/A. To update the values with
the data in your database, you must perform a retrieval from Essbase.
3 Select Essbase > Retrieve.
Essbase calculates the EssCell functions in cells B16 and B17.
Performing Advanced Retrieval Tasks 115
Figure 112
Retrieval on a Worksheet Containing the EssCell Function
Now update the EssCell functions to retrieve data for a different state.
4 Change the contents of cell A2 from Texas to Florida.
The values in cells B16 and B17 are updated as soon as you update the cell. The update occurs
because Excel has recalculated the worksheet (if you have configured Excel to calculate changes
automatically). The remaining data cells do not change. To completely update the worksheet,
you must retrieve data from the server.
Figure 113
Updating the EssCell Function
Tip:
If the worksheet contains many EssCell functions, change the spreadsheet to manual calculation
mode. This change prevents the cells that contain EssCell functions from calculating until you
retrieve data or calculate the worksheet manually. For more information on manual calculation
mode, see the Excel documentation .
5 Select Essbase > Retrieve to update the report.
Essbase returns an error message if EssCell is unsuccessful. Table 4 lists messages that Essbase
displays in the EssCell cell and explains the conditions that cause the messages:
116 Advanced Tutorial
Table 4
EssCell Messages
Message
Reason
#N/A
The worksheet is not connected to a database.
#VALUE!
A member name in the list or reference is invalid.
#NAME?
A text name in the function does not contain double quotation marks.
6 Close the file without saving it.
EssCell functions are already defined in the sample file that you used for this tutorial task.
This task is optional. Optional tasks do not need to be performed as part of the tutorial. They are provided for information
only.
In Excel, to enter your own EssCell function into a worksheet:
a. From the Excel menu bar, select Insert > Function.
b. From the Function Category list, select Essbase Add-in.
The Excel Function Wizard instructs you in defining the EssCell function.
Note:
For more information on EssCell functions, see the Spreadsheet Add-in online help.
Retrieving Dynamic Calculation Members
Dynamic calculation members are database members that are excluded from the batch calculation
process, thus shortening the regular database calculation time.
The Essbase application designer tags dynamic calculation members in the database outline so
that Essbase knows not to calculate those members until a data retrieval requests them. This
process is referred to as dynamic calculation. Dynamically calculating database members benefits
Essbase Server in the following ways:
●
Reduced disk usage
●
Reduced database restructuring time
●
Reduced time to back up the database
Database values thatEssbase calculates dynamically take slightly longer to retrieve in Spreadsheet
Add-in because calculations must be performed before retrieving data into the worksheet. For
more information on dynamic calculation, see the Hyperion Essbase - System 9 Database
Administrator's Guide.
Tip:
Enable the Navigate Without Data feature while you arrange the spreadsheet report so that
Essbase does not dynamically calculate the database as the report is being created. For more
information on the Navigate Without Data feature, see “Navigating Through the Worksheet
Without Retrieving Data” on page 49.
Performing Advanced Retrieval Tasks 117
Because there may be a performance impact on retrieving data for dynamic calculation members,
define visual cues, or styles, for these members so that you can identify them in Spreadsheet
Add-in.
As part of the defaultEssbase installation, the Asymm.xls sample file is provided that illustrates
how to use Dynamic Calculation members.
➤ To view the Asymm.xls file:
1 Select File > Open.
2 From the \AnalyticServices\client\sample directory, open the Asymm.xls file.
3 Drill up on Actual by double-clicking the right-mouse button in cell C3.
4 In cell C3, drill down on Scenario to display all members of Scenario.
Essbase displays only the Scenario members for Qtr1, as shown in Figure 114.
Figure 114
Displaying Scenario Members
5 Select Essbase > Options and select the Style tab.
Note:
You must be connected to the Sample Basic database to display the Style tab. For more
information on connecting to a database, see “Connecting to a Database” on page 89.
6 In the Members group box, scroll down until you see Dynamic Calculations.
7 Select the Dynamic Calculations check box and click the Format button.
8 In the Font style list, select Bold Italic.
9 In the Color list, select Gray.
10 Click OK and then select the Display tab.
11 In the Cells option group, click Use Styles. Click OK.
12 Select Essbase > Retrieve.
Essbase displays the data and applies all the visual cues, or styles, that you set, including the newly
set styles for dynamic calculation members and the styles you set in Chapter 3. You know that
the columns for Variance and Variance% are dynamically calculated because Essbase displays
these members in gray, bold, italicized font. (Variance and Variance% both display a red
background because that style was previously set for all members of the Scenario dimension.)
The result is shown in Figure 115.
118 Advanced Tutorial
Figure 115
Result of Retrieving Dynamic Calculation Members
Note:
Occasionally, other styles that you have set will override a style for dynamic calculation members.
For example, if a parent member is also a dynamic calculation member, and if you have set styles
for both parent and dynamic calculations, the style for the parent member overrides the style
for the dynamic calculation member. You must remove the style for parent members in order
to see the style for dynamic calculation members. For more information on the precedence of
styles, see “Precedence of Overlapping Styles” on page 59.
13 Close the Asymm.xls file without saving it.
Specifying the Latest Time Period for Dynamic Time Series
Dynamic Time Series members are predefined database members that are used in dynamic, todate reporting, such as year-to-date or month-to-date values. Dynamic Time Series members
are not displayed as individual members in the database outline; instead, they correspond to a
generation name that uses a key term for time, such as year, month, or day.
For example, in the Sample Basic database, a generation name called Quarter was created for
generation 2 in the Year dimension. Generation 2 includes the members for Qtr1, Qtr2, Qtr3,
and Qtr4. When the generation name Quarter was created, Essbase created a Dynamic Time
Series member called Q-T-D, or quarter-to-date.
To take advantage of Dynamic Time Series in Spreadsheet Add-in, choose the latest time period
for which you want data in a to-date calculation. The calculated value of the Dynamic Time
Series member is derived when you define the latest time period to be reported.
In the Sample Basic database, for example, the level 0 members of the Year dimension are the
months of the year: Jan, Feb, Mar, and so on. If the current month is August and you want to
know the sales data for the quarter up to the current month, a quarter-to-date calculation gives
you the sales data for the months of July and August.
➤ To illustrate the concept of Dynamic Time Series:
1 Select File > New or click
to open a new worksheet.
2 Select Essbase > Options and select the Zoom tab.
3 In the Zoom In option group, select Next Level.
4 Clear the Within Selected Group check box and click OK.
Performing Advanced Retrieval Tasks 119
5 Select Essbase > Retrieve.
6 In cell B1, drill down on (double-click) Measures.
7 In cell B2, click Year.
8 Type Q-T-D in cell B2 and press Enter to enter a predefined Dynamic Time Series member (Q-T-D).
The result is shown in Figure 116.
Figure 116
Entering a Dynamic Time Series Member into a Worksheet
Note:
For a list of other possible Dynamic Time Series members, see the Spreadsheet Add-in online
help.
9 Select Essbase > Options and select the Display tab.
10 In the Dynamic Time Series group box, select the Latest Time Period check box and from the drop-down
list box, select May, as shown in Figure 117.
Figure 117
Specifying Latest Time Period in a Dynamic Time Series
Note:
If you do not specify a latest time period,Essbase uses the first level 0 member (Jan) as the default.
120 Advanced Tutorial
11 Click OK.
12 Select Essbase > Retrieve.
Note:
The Retrieve & Lock, Zoom In, and Zoom Out commands are not supported with Dynamic
Time Series members.
Essbase displays data for the Q-T-D member, as shown in Figure 118. The data values in the
worksheet are the aggregated values for April and May, because May is the month that you
specified as the latest month in the quarter-to-date Dynamic Time Series.
Figure 118
Result of Specifying Latest Time Period in a Dynamic Time Series
13 To close the worksheet, select File > Close.
You do not need to save the worksheet.
In Advanced Interpretation mode, you can also create a report like the one shown Figure 118
by typing the name of the Dynamic Time Series member followed by the name of the latest time
period in parentheses (for example Q-T-D(May)). If you are using Free-Form retrieval mode,
you must enter the Dynamic Time Series member enclosed in quotation marks (for example,
"Q-T-D") and the latest time period also enclosed in quotes (for example, ("May")) in separate,
adjacent cells. You can also select a Dynamic Time Series member and a latest time period
through Essbase Query Designer or through Member Selection.
For more information on Dynamic Time Series, see the Spreadsheet Add-in online help.
Using Substitution Variables
The Essbase application designer uses substitution variables to define global variables to
represent values that are specific to Essbase. For example, Latest can be a substitution variable
representing the latest time period in a Dynamic Time Series.
Using Essbase Administration Services Console, the application designer sets substitution
variables and their corresponding values for a specific application. Essbase stores these variables
and their values on the Essbase Server. You can take advantage of the predefined substitution
variables in Spreadsheet Add-in during Dynamic Time Series reporting.
For example, say the application designer sets a substitution variable on the server for the current
month. The variable is called CurMnth and has a value of August. If you use the substitution
variable in the worksheet, a retrieval returns values for August, because August is set as the
current month on the server. If, at a later date, the application designer changes the value of the
CurMnth substitution variable to October, a retrieval returns data for October.
Performing Advanced Retrieval Tasks 121
The Sample Basic database that you are using for this tutorial does not contain predefined
substitution variables. If the application designer had set a substitution variable in the database
that you are using, you could enter a substitution variable directly into a worksheet.
For example, you could open a blank worksheet and type member names, as shown in
Figure 119.
Figure 119
Entering a Substitution Variable in a Worksheet
Notice the substitution variable (CurMnth) in cell A2. When you enter a substitution variable
directly into a cell, you must precede it with an ampersand (&).
In this example, a retrieval produces the results shown in Figure 120.
Figure 120
Result of Retrieval on a Substitution Variable
Essbase queries the server for the value of the substitution variable CurMnth, which is August.
Data is returned only for August.
Note:
If you save a worksheet containing a substitution variable as a template, make sure that you save
the worksheet before you retrieve data. For example, if you save the worksheet shown in
Figure 120 as a template, each time you retrieve the template, August rather than the substitution
variable CurMnth is displayed.
Using Free-Form Reporting to Retrieve Data
So far, you have been shown how to retrieve Essbase data into a worksheet through ad hoc
retrieval, Essbase Query Designer queries, and Member Selection operations. In addition to these
retrieval methods, Essbase supports free-form reporting.
Free-form reporting enables you to tell Essbase specifically what you want to retrieve by typing
data into the worksheet. This free-form of reporting is especially useful when you are familiar
with the dimensions and members in the database outline.
Essbase provides two different retrieval modes for free-form reporting:
●
Advanced Interpretation
●
Free-Form
122 Advanced Tutorial
In both retrieval modes, enter member names directly into the worksheet. The following sections
describe the similarities and differences between the two modes.
Using Advanced Interpretation Mode
Essbase Server server contains an advanced spreadsheet interpretation engine that scans a
worksheet and interprets its content when fulfilling retrieval requests. When you construct a
report by entering names directly into a worksheet in Advanced Interpretation retrieval mode,
Essbase interprets the member names and creates a default view that is based on the location of
the labels.
Keep in mind the following guidelines when you are working in Advanced Interpretation mode:
●
Precede all member names that consist of numbers with a single quotation mark. For
example, for Product dimension member 100, type '100 in the worksheet.
●
If you define a report that does not contain all the database dimensions, you may need to
enter a dummy value, such as 0, in the first data cell. Essbase overwrites this value with the
contents of the database cell upon retrieval. Be sure to use a numeric value as the dummy
value.
➤ To construct a free-form report in Advanced Interpretation retrieval mode:
1 Select File > New or click
to open a new worksheet.
2 Select Essbase > Options and select the Mode tab.
3 In the Retrieval option group, select Advanced Interpretation (the default setting) and click OK.
4 Enter member names and data as shown in Figure 121.
Note:
If a member name consists of a number, such as 100, you must precede the member name with
a single quotation mark (for example, '100). This rule also applies to member names with spaces
between words.
Figure 121
Creating a New Free-Form Report
5 Select Essbase > Retrieve or double-click a data cell.
Essbase retrieves data for the members that you entered into the free-form report and
implements the Use Aliases option that you set in the Essbase Options dialog box in “Setting
Essbase Options” on page 91.
Performing Advanced Retrieval Tasks 123
Figure 122
Retrieving Data into a Free-Form Report
Now define a free-form report that does not contain all the dimensions from the database. In
Advanced Interpretation mode, you may need to enter a dummy data value, such as 0, into the
first data cell to indicate to Essbase where the data starts in the worksheet. Be sure to use a numeric
value as the dummy value.
For example:
6 Select Essbase > FlashBack.
7 Delete cells A1, B1, and C1.
8 In cell B4, type 0 to provide Essbase with a data cell reference point.
Figure 123
Defining a Free-Form Report Without All Dimensions
9 Select Essbase > Retrieve.
Essbase adds the dimensions that were omitted from the free-form report to the worksheet and
retrieves data.
Figure 124
Retrieval in a Free-Form Report Without All Dimensions
10 Select File > Close to close the worksheet.
You do not need to save the worksheet.
Using Free-Form Mode
Similar to Advanced Interpretation mode, Free-Form mode enables you to enter member names
into any location in a worksheet and then interprets the contents of the worksheet when fulfilling
the retrieval request. In addition, with Free-Form mode, you can use Essbase report script
commands to retrieve data into a worksheet.
124 Advanced Tutorial
Report script commands are most useful for defining member references that can bring back
the most current member information dynamically. For example, if you need to create a report
that shows every product, including the products added since the last retrieval, standard retrieval
mode reflects changes only when you drill down on the product.
If you use the report script command <IDESCENDANTS, Essbase retrieves all descendants of a
specified member, as well as the specified member. For more information on the syntax of report
script commands and on guidelines for developing reports, see the Essbase Technical Reference
and the Hyperion Essbase - System 9 Database Administrator's Guide.
Keep in mind the following guidelines when working in Free-Form retrieval mode:
●
You must precede all member names that consist of numbers with a single quotation mark.
For example, for the Product dimension member 100, you must type '100 in the worksheet.
●
You cannot cancel a retrieve in Free-Form mode.
●
You cannot apply Essbase styles in Free-Form mode.
●
Essbase removes blank rows and columns on any retrieval action.
●
Excel does not support Report Writer formatting commands, such as {BRACKETS},
{DECIMAL}, and {EUROPEAN} in Free-Form mode. They are incompatible with the Excel
formatting features.
●
When you are in Free-Form mode, an Auto Sort Rows option is selectable in the Display
tab of the Essbase Options dialog box. If you select this feature, Essbase retrieves data in
symmetric rows. The rows are sorted according to the order specified in the database outline.
●
Not all Formula Preservation and Modes options (Essbase Options dialog box, Mode tab)
are available in Free-Form mode.
●
To use Dynamic Time Series in Free-Form mode, do not put the Dynamic Time Series
member and the latest time period (for example, "Q-T-D" ("Feb")) in the same cell. You
need to type the Dynamic Time Series member, "Q-T-D" in one cell, and the latest time
period within parentheses, ("Feb"), in a separate, adjacent cell.
➤ To construct a free-form report in Free-Form retrieval mode:
1 Select File > New or click
to open a new worksheet.
2 Select Essbase > Options and select the Mode tab.
3 In the Retrieval option group, select Free Form.
4 Select the Display tab.
5 In the Cells option group, select Auto Sort Rows and click OK.
6 Enter the member names into the worksheet as shown in Figure 125.
Performing Advanced Retrieval Tasks 125
Figure 125
Typing Member Names In a Free-Form Report
7 Select Essbase > Retrieve.
Essbase retrieves data for the members and creates a default view according to the location of
the labels. Note that in Figure 126, three members were pivoted from row groups to column
groups.
Figure 126
Result of Retrieving in Free-Form Retrieval Mode
8 Select File > Close to close the worksheet.
You do not need to save the worksheet.
➤ To create a report by entering member names and a report script command:
1 Selecting File > New or click
to open a new worksheet.
2 Enter the member names into the blank worksheet as shown in Figure 127.
Figure 127
Typing Member Names in a Free-Form Report
3 In cell A3, type <IDESCENDANTS Product and press Enter.
Figure 128
Typing a Report Script Command in a Free-Form Report
4 Select Essbase > Retrieve.
Essbase retrieves data into the worksheet for all descendants of Product and for the members
that you entered in the worksheet. The result is shown in Figure 129.
126 Advanced Tutorial
Figure 129
Result of a Retrieve with a Report Script Command
Note:
When Essbase completes the retrieval, the report script command is overwritten by the data it
returns. You can use FlashBack to restore the previous view in Free-Form mode.
5 Select File > Close to close the worksheet.
You do not need to save the worksheet.
Using Attributes in Free-Form Reporting
Essbase enables you to retrieve data selectively by specifying attributes that are associated with
a base dimension. For example, in the Sample Basic database, the Product base dimension is
associated with attributes such as packaging and size. You can enter an attribute name into the
worksheet to retrieve data that is associated with that attribute.
➤ To use attributes in a free-form report:
1 Select File > New or click
to open a new worksheet.
2 Enter member names as shown in the Figure 130.
Figure 130
Using Attributes in Free-Form Reports
Caffeinated is an attribute dimension associated with the Product base dimension. Bottle is a
level 0 member of the Pkg_Type attribute dimension. The Pkg_Type dimension is associated
with the Product base dimension. A level 0 member is the lowest level member in a dimension.
3 Click any empty cell and select Essbase > Retrieve or double-click an empty data cell.
Essbase retrieves information on profits for the first quarter of the year for all members of the
Product base dimension that are associated with both the level 0 attribute members of the
Caffeinated attribute dimension (Caffeinated_True and Caffeinated_False) and the level 0
member Bottle of the Pkg_Type attribute dimension. The results should look like Figure 131.
Performing Advanced Retrieval Tasks 127
Figure 131
Result of Using Attributes in Free-Form Reports
4 You can drill down to data on the level 0 attribute members of the Caffeinated attribute dimension. The
results should look like Figure 132.
Figure 132
Drilling Down on Attributes in Free-Form Reports
5 To drill down further for data on profits for the first quarter for all members of the East base dimension,
double-click cell E1. The results should look like Figure 133.
Figure 133
Result of Drilling Down on East
Entering Generation and Level Names
In addition to entering database member names into a free-form report, you can enter generation
or level names directly into a worksheet to retrieve specific members. The Essbase application
designer defines generation and level names for database dimensions in the database outline.
Two options enable you to determine which generation and level names are defined in the
database:
●
View generation and level names in the Essbase Member Selection dialog box or through
Essbase Query Designer.
●
Contact the Essbase application designer to see which generation and level names are defined
in the database outline.
➤ To enter generation and level names directly into a free-form report:
1 Select File > New or click
128 Advanced Tutorial
to open a new worksheet.
2 Select Essbase > Options and select the Mode tab.
3 In the Retrieval option group, select Advanced Interpretation. Click OK.
4 Enter member names as shown in Figure 134.
Figure 134
Entering Member Names in a Free-Form Report
5 Enter a generation name as shown in Figure 135.
Family is a generation name in the Product dimension. The name is already defined in the Sample
Basic database.
Figure 135
Entering a Generation Name in a Free-Form Report
6 Select Essbase > Retrieve.
Essbase retrieves data for the member and generation names that you entered. The Family
generation name expands to its individual members. The result is shown in Figure 136.
Figure 136
Result of Free-Form Retrieval with Generation Name
7 Change Year to a level name (Lev0,Year) as shown in Figure 137.
Figure 137
Entering a Level Name in a Free-Form Report
Note:
Do not insert a space between the comma after 0 and the word Year. Generation and level names
that are entered directly into a worksheet must be precise.
8 Select Essbase > Retrieve.
Performing Advanced Retrieval Tasks 129
As shown in Figure 138, Essbase retrieves data for the level 0 members of the Year dimension,
which are the individual months (Jan, Feb, Mar, and so forth).
Figure 138
Result of Free-Form Retrieval with Level Name
9 Select File > Close to close the worksheet.
You do not need to save the worksheet.
Retrieving Data Using Visual Explorer
Visual Explorer provides Essbase users with powerful analytics in a highly graphical format. It
enables users to unlock the information stored in multidimensional databases using a free-form
canvas for exploring and analyzing data. The Visual Explorer user interface is shown in
Figure 139.
Figure 139
130 Advanced Tutorial
Elements of the Visual Explorer User Interface
Visual Explorer is launched directly from the Essbase menu in Spreadsheet Add-in for Excel,
using the “Visualize & Explore” command. Using the technique of dragging interface elements,
Essbase users can quickly summarize and visualize data from an Essbase database. Visual
Explorer then offers users the option to pass data back to the Excel worksheet from which it was
launched, or to insert the data into a new Excel worksheet where additional analysis can be
performed.
Note:
For detailed information on using Visual Explorer, refer to the online help that is accessed from
the Help menu in Visual Explorer.
The following example uses Visual Explorer to identify quickly the most profitable product sales
by quarter in the Sample Basic database.
➤ To use Visual Explorer to identify the most profitable product sales by quarter:
1 Open a worksheet.
2 Select Essbase > Visualize & Explore.
The Visual Explorer interface is displayed.
3 Optional: If you are not already logged in to the Sample Basic database, you can log in from Visual Explorer
by completing the following tasks:
a.
From Visual Explorer, select Data > Connect to Data.
b.
In the Connect to Data dialog box, select Hyperion Essbase.
The Essbase System Login dialog box is displayed.
c.
Select the server that you want to access from the Server list box.
If the server name that you want to connect to is not in the list, you can type in the name
of the server.
d.
Press Tab to move to the Username text box and type your username.
e.
Press Tab to move to the Password text box and type your password.
f.
Click OK to connect to the server.
When your server connection is complete, a list of available Application and Database
pairs is displayed in the Application/Database list.
g.
Double-click the application and database pair that you want to connect to in the
Application/Database list box. Alternatively, you select the application and database pair
and click OK.
h.
In Name Connection, click OK to save the Server-Application-Database name of this
connection for future use.
You can also rename the connection to a name to a user-friendly name.
i.
Click Yes at the prompt if you want to save the connection name.
Performing Advanced Retrieval Tasks 131
Note:
If you save the connection name, it is displayed on subsequent logins in the Connect to
Data dialog box (see step 3.b.
You are now ready to use Visual Explorer.
4 Under Marks, select Bar from the drop-down list.
5 Drag Year from the Dimension section of the Data window and drop it on the Column shelf.
6 Drag Sales from the Measures section of the Data window and drop it on the Column shelf, placing it to
the right of Quarter.
7 Drag Profit % from the Measures section of the Data window and drop it on the Color shelf.
At this point, you can see which quarter is the most profitable based on sales as indicated by the
darkest color bar.
8 Drag Region from the Dimension section of the Data window and drop it on the Row shelf.
9 Drag Category from the Dimension section of the Data window and drop it on the Row shelf, placing it
to the right of Region.
When you drag a generation to a shelf, all generations that are ancestors of the selected generation
are automatically included in this placement. However, if you press and hold down the Control
(Ctrl) key while dragging a generation to a shelf, only that specific generation is included in the
placement.
10 To ignore the Diet Drinks alternate rollup in this analysis, right-click Category in the Row shelf and select
Filter.
Diet Drinks is an alternate rollup that contains shared members. You can deselect it from the
query so that members that are already shown are not redisplayed.
11 In the Filter dialog box, clear the Diet Drinks member and click OK.
12 Expand Category on the Row shelf.
13 Review the visual worksheet.
As shown by the dark green bars in Figure 140, Colas in the East is the most consistently profitable
product based on sales.
132 Advanced Tutorial
Figure 140
Bar Chart Showing Product 100-10 East as Most Profitable by Sales
You are now ready to pass the data from the visual worksheet into an Excel worksheet in
Spreadsheet Add-in.
This task is optional. Optional tasks do not need to be performed as part of the tutorial. They are provided for information
only.
In Visual Explorer you can further analyze the data in the Sample Basic database by completing any of the following
tasks:
●
Drag State from the Database Schema and drop it on the Page shelf.
The view is recalculated to view the data for individual states. The Current Page shows that we are viewing
data for New York. For example, hover over the bar for Cola in New York in the East region during Qtr1, and
the popup shows that the Sales total for New York in that quarter is $1,998.00. Click the right direction arrow
or use the drop-down to view data from another sate.
●
Drag Gen3, Population from the Database Schema and drop it on the Groups shelf.
The view is recalculated so that each column is now broken into market size based on population, separated
by lines. Hover over individual sections and view Sales data by market size.
14 In Oracle's Hyperion® Essbase® Visual Explorer, select File > Export > Cross-tab to Excel to transfer data
from the visual worksheet to worksheet in Excel.
Note:
Alternatively, you can select File > Update Excel (New Worksheet) to transfer the data from the
visual worksheet to a new worksheet in Excel.
Using Linked Reporting Objects
A linked reporting object is an external file, cell note, or World Wide Web resource that you link
to a cell in an Essbase database. The file, note, or Web resource (indicated by a URL, or Uniform
Using Linked Reporting Objects 133
Resource Locator) can then be retrieved by the Spreadsheet Add-in users who have access to the
database.
Note:
If your organization has licensed and implemented the Essbase Partitioning option, you can also
access linked partitions from cells in Spreadsheet Add-in. For more information on linked
partitions, see “Ways to Access Linked Partitions” on page 145.
In this topic, the following procedures are discussed:
●
“Linking a File to a Data Cell” on page 134
●
“Linking a Cell Note to a Data Cell” on page 137
●
“Linking a URL to a Data Cell” on page 138
●
“Accessing and Editing Linked Reporting Objects” on page 140
For additional information on using linked reporting objects, see the Spreadsheet Add-in online
help.
Linking a File to a Data Cell
Using the linked reporting objects feature, you can link an external file to a data cell in
Spreadsheet Add-in. Essbase stores the file on the Essbase Server. Users who have access to the
database can then retrieve the file and view the data contained in the cell.
The following example uses the Asymm.xls sample worksheet with data from the Sample Basic
database. It links a sample file, Budasmp.txt, to a cell containing the Budget figure.
Budasmp.txt details the budgetary assumptions for the current year.
➤ To link a file to a data cell:
1 Select File > Open.
2 From the \AnalyticServices\client\sample directory, open the Asymm.xls file.
3 Make sure that you are connected to the Sample Basic database.
If you are not connected, see “Connecting to a Database” on page 89.
4 Select cell D5, as shown in Figure 141.
Note:
You can link objects only to data cells, not to cells containing member names.
134 Advanced Tutorial
Figure 141
Selecting a Data Cell for Linking an External File
5 Select Essbase > Linked Objects.
Essbase displays the Linked Objects Browser dialog box, as shown in Figure 142.
Figure 142
Linking a File
6 In the Linked Objects Browser dialog box, click the Attach button.
Essbase displays the Attach Linked Object dialog box.
7 Under the Attachment Type group box, select File, as shown in Figure 143.
Figure 143
Linking a File to a Data Cell
8 Click the Browse button located next to the File Name text box.
Essbase displays the Browse Files dialog box.
9 Go to the \AnalyticServices\client\sample directory and select the Budasmp.txt file.
Using Linked Reporting Objects 135
10 Click Open.
11 Under File Description, enter a brief description for the file as indicated in Figure 144.
Figure 144
Selecting and Describing a File to Link
Note:
Entering text in the File Description text box is optional.
12 Click OK to close the dialog box and link the file to the cell.
Essbase copies the file to the server and establishes a link to the current data cell.
13 Click Close to close the Linked Objects Browser dialog box.
Do not close the Asymm.xls file. You use the file in the next tutorial task.
To recognize cells that have linked reporting objects attached to them, you may want to apply
a visual cue, or style, to the cells.
➤ To apply styles:
1 Select Essbase > Options and select the Style tab.
2 In the Data Cells area, select Linked Objects.
3 Click Format.
4 From the Font style list box, select Italic.
5 From the Color list box, select Purple. Click OK.
6 Select the Display tab.
7 In the Cells option group, select the Use Styles box and click OK.
8 Select Essbase > Retrieve to refresh the worksheet and apply the styles.
Cell D5 (the cell to which you just attached the linked file) is now displayed in purple, italic font,
as shown in Figure 145. Essbase also refreshes the worksheet with the other options set in the
Essbase Options dialog box.
136 Advanced Tutorial
Figure 145
Result of Applying a Style to a Linked Reporting Object Cell
Leave the file (Asymm.xls) open for the next tutorial task.
Linking a Cell Note to a Data Cell
In addition to linking external files to a data cell in Spreadsheet Add-in, you can also link
individual cell notes that contain information on particular data cells. Cell notes can consist of
no more than 599 characters. If you need to link information to a data cell that is longer than
599 characters, you must create and save an external file and then link the file to the data cell.
➤ To link a cell note to a data cell:
1 In the Asymm.xls file, select cell C5.
Note:
You can link objects only to data cells, not to cells containing member names.
2 Select Essbase > Linked Objects.
Essbase displays the Linked Objects Browser dialog box.
3 In the Linked Objects Browser dialog box, click Attach.
Essbase displays the Attach Linked Object dialog box.
4 Under the Attachment Type group box, select Cell Note (see Figure 146).
5 In the Cell Note text box, type the note as indicated in Figure 146.
Figure 146
Creating a Cell Note to Link
6 Click OK to close the dialog box and link the cell note.
Using Linked Reporting Objects 137
Essbase copies the note to the server and establishes a link to the current data cell.
7 Click Close to close the Linked Objects Browser dialog box.
8 Select Essbase > Retrieve to refresh the worksheet and apply the style that you defined for linked objects.
Now Essbase displays two data cells (C5 and D5) in purple, italic font to represent a cell that
contains a linked reporting object. The result is shown in Figure 147.
Figure 147
Result of Creating a Linked Cell Note
Leave the Asymm.xls file open for the next tutorial task.
Linking a URL to a Data Cell
A URL is an address string that identifies resources on the World Wide Web, such as documents,
images, and downloadable files. With the linked reporting objects feature, you can link a URL
to a data cell so that users who have access to the database can link directly to the specified URL.
When you access the cell from Spreadsheet Add-in, your default Web browser opens and displays
the specified URL.
Note:
For more information on URL syntax, see the Spreadsheet Add-in online help.
➤ If you have a Web browser and Internet access, follow these steps to link a data cell to the
Hyperion Web site:
1 In the Asymm.xls file, select cell E5, as shown in Figure 148.
Note:
You can link objects only to data cells, not to cells containing member names.
138 Advanced Tutorial
Figure 148
Selecting a Data Cell for Linking to a URL
2 Select Essbase > Linked Objects.
Essbase displays the Linked Objects Browser dialog box.
3 In the Linked Objects Browser dialog box, click Attach.
Essbase displays the Attach Linked Object dialog box.
4 Under the Attachment Type option group, select URL, as shown in Figure 149.
Figure 149
Linking a URL to a Data Cell
5 Enter a URL in the Location text box and a brief description in the URL Description text box, as shown in
Figure 150.
Figure 150
Entering and Describing a URL to Link
Entering text in the URL Description text box is optional. The text field for entering the URL
location is limited to 512 characters. The text field for entering the URL description is limited
to 80 characters.
Using Linked Reporting Objects 139
6 Click OK to close the dialog box and link the URL to the cell.
Essbase copies the URL string to the server and establishes a link to the current data cell.
Note:
The syntax for the URL is not checked at the time of creation; Essbase checks the syntax when
the user accesses the URL from the worksheet. The default Web browser checks for the existence,
or validity, of the URL.
7 Click Close to close the Linked Objects Browser dialog box.
8 Select Essbase > Retrieve to refresh the worksheet and apply the style that you defined for linked objects.
Leave the Asymm.xls file open for the next tutorial task.
The following topics explain how to access linked reporting objects from Spreadsheet Add-in.
Accessing and Editing Linked Reporting Objects
Two options are available for accessing and editing a linked reporting object that is attached to
a data cell:
●
Select the cell (as identified by the style applied to it) and select Essbase > Linked Objects.
●
Enable double-clicking for linked object browsing.
Note:
If you enable double-clicking for linked object browsing, double-clicking behavior changes
for retrieving data and performing drill actions. For more information on these changes,
see the Spreadsheet Add-in online help.
For this tutorial, you access the linked reporting objects that you created in the previous sections
by using the Essbase menu item instead of the double-clicking action.
Accessing a Linked File
Sometimes you want to check an external file that is linked to a data cell.
➤ To access the external file that you previously linked to a data cell:
1 In the Asymm.xls file, select cell D5.
2 Select Essbase > Linked Objects.
3 In the Linked Objects Browser dialog box, select the Budasmp.txt file, as shown in Figure 151.
140 Advanced Tutorial
Figure 151
Accessing a Linked External File
4 Click View/Launch to view the linked file.
The Budasmp.txt file is opened from the source application, as shown in Figure 152.
Figure 152
Viewing the Contents of a Linked External File
Note:
You can edit the contents of a file in the source application. After the edits are made and the file
is saved, you can re-attach the edited file by clicking the Edit button in the Linked Objects Browser
dialog box. Essbase displays the Re-attach Linked Object dialog box, which you can use to reattach, or relink, the edited file to the data cell.
5 Close the Budasmp.txt file and click Close to close the Linked Objects Browser dialog box.
Leave the Asymm.xls file open for the next task.
Accessing a Linked Cell Note
Sometimes you have to edit a cell note that was previously created.
➤ To access and edit the cell note that you previously created:
1 In the Asymm.xls file, select cell C5.
2 Select Essbase > Linked Objects.
Using Linked Reporting Objects 141
The Linked Objects Browser dialog box displays the cell note that is linked to the selected data
cell.
3 In the Linked Objects Browser dialog box, select the cell note, as shown in Figure 153.
Figure 153
Accessing a Linked Cell Note
4 Click Edit to edit the contents of the cell note.
Essbase displays the Edit Cell Note dialog box with the selected cell note displayed, as shown in
Figure 154.
Figure 154
Editing the Contents of a Linked Cell Note
If you simply want to view the contents of the cell note, click the View/Launch button instead
of the Edit button in the Linked Objects Browser dialog box.
5 Edit the contents of the cell note as indicated in Figure 155.
Figure 155
Result of Editing Cell Note Contents
6 Click OK to close the Edit Cell Note dialog box and save the edits you made to the note.
142 Advanced Tutorial
Essbase saves the edits to the cell note on the server.
7 Click Close to close the Linked Objects Browser dialog box.
Leave the file (Asymm.xls) open for the next tutorial task.
Accessing a Linked URL
If you followed the steps in “Linking a URL to a Data Cell” on page 138, you can access and edit
the URL that you created.
➤ To access the URL:
1 In the Asymm.xls file, select cell E5.
2 Select Essbase > Linked Objects.
The Linked Objects Browser dialog box displays the URL that is linked to the selected data cell.
3 In the Linked Objects Browser dialog box, select the URL, as shown in Figure 156.
Figure 156
Accessing a Linked URL
4 Click View/Launch to view the linked URL.
Essbase checks the syntax of the URL. If there are syntax errors, Essbase displays an error message.
If the URL syntax is correct, the default Web browser launches and connects to the specified site.
In this case, the syntax for the URL is correct, so the default Web browser launches and connects
to the Hyperion Web site.
5 Close the Web browser.
➤ To edit the URL:
1 In the Linked Objects Browser dialog box, select the URL.
2 Click Edit.
Essbase displays the Edit URL dialog box with the selected URL displayed in the Location text
box, as shown in Figure 157.
Using Linked Reporting Objects 143
Figure 157
Preparing to Edit the Contents of a Linked URL
3 Edit the URL location and description as shown in Figure 158.
Figure 158
Editing the Contents of a Linked URL
4 Click OK to close the Edit URL dialog box and save the edits that you made.
Essbase saves the edits to the URL on the server.
5 Click View/Launch to view the new URL.
The Web browser launches and connects to the new URL.
6 Close the Web browser.
7 Click Close to close the Linked Objects Browser dialog box.
8 Close the Asymm.xls file without saving it.
Connecting to Multiple Databases
Essbase supports simultaneous access to multiple databases. The databases can be in different
applications and can be stored on different servers. In the spreadsheet application, you can open
multiple worksheets, each of which can be connected to a different database. An individual
worksheet can access only one database at a time. Use the Connect command from the Essbase
menu to switch the connection between databases.
Note:
Depending on the status of production applications at your site, you may not have access to
additional applications or databases. Contact the Essbase system administrator if you need access
to other applications.
For this tutorial, you do not need to connect to another database.
144 Advanced Tutorial
This task is optional. Optional tasks do not need to be performed as part of the tutorial. They are provided for information
only.
To access multiple databases:
1. Select Essbase > Connect.
2. In the Essbase System Login dialog box, select the server that you want to access from the Server list box (or
type in the name of the server).
3. Press Tab to move to the Username text box and type your username.
4. Press Tab to move to the Password text box and type your password.
5. Click OK to connect to the server.
When the server connection is complete, a list of available application and database pairs is displayed in
the Application/Database list.
6. Double-click the Application/Database pair that you want to connect to in the Application/Database list.
Alternatively, you can select the Application/Database pair and click OK.
If the application is not already running, Essbase automatically starts it. There may be a brief pause as the
application loads; the time required to start an application depends on the number of databases, the sizes
of the databases, and the sizes of the indexes of the databases contained within the application.
7. Open a new worksheet and repeat the steps to connect to additional databases. You can open one database at
a time per worksheet.
For information on connecting to multiple databases from Essbase Query Designer, refer to
Chapter 3.
Ways to View Active Database Connections
If you frequently connect to multiple databases, you may need to check the active database for
each worksheet. You can view the database connection status in two ways:
●
The Style tab of the Essbase Options dialog box contains a Connection Information text
box. This box displays connection information for the active worksheet.
●
The Essbase Disconnect dialog box lists all active worksheets and their connection
information. This dialog box also enables you to disconnect one or more worksheets from
their respective databases.
Ways to Access Linked Partitions
Linked partitions are part of the Essbase Partitioning product. They provide the ability to link
Essbase databases that contain different dimensions without losing access to all dimensions of
both databases. If your organization has purchased and implemented the partitioning product,
you can take advantage of its capabilities. The Hyperion Essbase - System 9 Database
Administrator's Guide describes how to design and implement a linked partition. The Essbase
application designer usually sets up partitioning.
Ways to Access Linked Partitions 145
Note:
The Partitioning product also enables the Essbase application designer to set up transparent or
remote partitions. For more information on partitioning, see the Hyperion Essbase - System 9
Database Administrator's Guide.
You can set visual cues, or styles, for cells tagged as linked objects. These cells are access points
to the linked partition within the linked database. Two options are available for accessing a linked
partition from a data cell in Spreadsheet Add-in:
●
Select the cell and select Essbase > Linked Objects.
●
Enable double-clicking for linked object browsing.
If you enable double-clicking for linked object browsing, double-clicking behavior changes
for retrieving data and performing drill actions. For more information on these changes,
see the Spreadsheet Add-in online help.
When you select Essbase > Linked Objects from a linked partition cell, Essbase completes the
following actions:
●
Essbase displays the Linked Objects Browser dialog box, which contains a list of possible
partitions which you can access. From this dialog box, select the partition to connect to.
The Linked Objects Browser dialog box may also contain a list of linked reporting objects,
such as cell notes and external files. For more information on linked objects, see “Using
Linked Reporting Objects” on page 133.
●
After you select a partition, Essbase creates a new worksheet that contains corresponding
members and dimensions for the cell in the linked partition.
Note:
Essbase does not preserve formulas across partitions.
●
Essbase retrieves data values from the linked partition.
You can now perform operations such as drill down and drill up to get more information on
the new worksheet.
Note:
The Sample Basic database that you are using for this tutorial does not contain a linked partition.
However, the instructions for accessing a linked partition are shown as an optional task in the
light-colored box below.
This task is optional. Optional tasks do not need to be performed as part of the tutorial. They are provided for information
only.
To access a linked partition in Spreadsheet Add-in if the Essbase application designer has set up a linked partition:
1. Locate a linked object cell, as indicated by the style applied to the cell.
2. Access the Linked Objects Browser dialog box in either of these ways:
146 Advanced Tutorial
●
Select Essbase > Linked Objects to open the Linked Objects Browser dialog box.
●
In the Essbase Options dialog box, select the Enable Linked Object Browsing check box to enable doubleclicking to view linked objects.
3. Select the partition that you want to connect to and click View/Launch.
Essbase creates a new worksheet that contains the dimensions and members for the cell in the linked
partition.
You need the proper privileges to access a linked partition. If your user account and password
match the account information for the linked partition, Essbase establishes a connection with
the linked partition. Otherwise, Essbase displays the Essbase System Login dialog box for you to
enter the user account and password manually.
Updating Data on the Server
Data values are changed frequently in applications that involve planning, budgeting, and
forecasting. After you retrieve data into the worksheet, you can use Spreadsheet Add-in to change
values, enter formulas, and format data. Essbase is also designed to permit multiple-user,
concurrent database access and update.
Depending on your security privileges, you may be able to modify all data values or a certain
subset of values. To recognize cells to which you have read/write access, apply a visual cue, or
style, to the cells. For more information on applying styles, see “Applying Styles to Data Cells”
on page 59.
To update data from a worksheet, you must lock the database area that contains the values that
you want to change. Locking prohibits other users from changing the data that you want to
update. Other users can retrieve locked data but cannot lock or change the data. You have
exclusive update rights to that area.
Note:
You cannot update attribute-related data on the server because attribute data is always calculated
dynamically and, hence, is not saved.
You can lock data values in three ways:
●
The Retrieve & Lock command retrieves data into the worksheet while locking
the corresponding data area on the server. When you perform a subsequent retrieval, Essbase
automatically unlocks the previous data values.
Note:
The Retrieve & Lock command is not supported with Dynamic Time Series members.
●
The Lock command locks information that you have already retrieved. When you perform
a subsequent retrieval, Essbase automatically unlocks the previous data values.
●
The Update Mode check box in the Mode tab of the Essbase Options dialog box
automatically locks the corresponding database area for each retrieval.
Updating Data on the Server 147
To update the server with data values from the worksheet, use the Send command on the Essbase
menu. After updating the server, the Send command automatically unlocks data (unless you are
in Update Mode). You must clear Update Mode to stop the automatic locking of blocks.
You can unlock data blocks in two ways:
●
The Unlock command unlocks all blocks that you have locked.
●
The server automatically unlocks data blocks that have been locked for the maximum time
allowed as defined by the Essbase system administrator. Automatic unlock ensures that
blocks are not locked for extended periods of time.
The P&l.xls file is installed as part of the default Essbase installation. This file illustrates how
to update data on the server.
➤ To view the P&l.xls worksheet:
1 Select File > Open.
2 From the \AnalyticServices\client\sample directory, open the P&l.xls file.
3 Select Essbase > Retrieve & Lock.
Essbase retrieves data and locks the appropriate area of the database, as shown in Figure 159.
Figure 159
P&L Worksheet After Retrieve & Lock
4 Change the value for Sales in Jan (cell B12) to 4000 and press Enter.
Essbase changes the affected data values.
5 Select Essbase > Send to update the server with the new values.
Essbase updates the server and unlocks the data blocks.
148 Advanced Tutorial
Figure 160
P&L Worksheet After Sending New Values to the Server
6 Close P&l.xls without saving it.
Essbase Essbase provides a spreadsheet sheet update logging feature that tracks and logs all data
updates sent from Spreadsheet Add-in to the server. The Essbase system administrator enables
this feature for extra protection against data loss. For more information on spreadsheet update
logging, see the Hyperion Essbase - System 9 Database Administrator's Guide or contact the Essbase
system administrator.
Database Calculation
Sending updated data to the server does not automatically recalculate the database. If you have
the appropriate security privileges to perform database calculations, you can calculate the
database from Spreadsheet Add-in with the Calculation command. For this tutorial, you will
not actually calculate the Sample Basic database. For more information on Essbase calculations,
see the Hyperion Essbase - System 9 Database Administrator's Guide.
Caution!
Do not perform any calculation operations for this tutorial.
When you select Essbase > Calculation, Essbase displays the Essbase Calculation dialog box, as
shown in Figure 161.
Database Calculation 149
Figure 161
Essbase Calculation Dialog Box
The Essbase Calculation dialog box contains the following items:
●
The Connection Information text box displays the active database connection.
●
The Select Calc Script list box contains the server-based calculation scripts to which you
have access.
●
The Database State status box indicates the current calculation state of the database. The
following states are possible:
❍
Calculating
Indicates that a calculation is currently running on the database.
❍
Data values have been modified since the last calculation
Indicates that data values have changed since the database was last calculated. The last
calculation may have been an entire calculation of the database or a calculation of any
subset of the database.
❍
No data values have been changed since the last calculation
Indicates that the data in the database has not changed since it was last calculated. The
last calculation may have been an entire calculation of the database or a calculation of
any subset of the database.
Caution!
If the last calculation was performed on a subset of the data, the entire database may
not have been calculated since values last changed. To ensure that the results of
calculations are up-to-date, you may want to run a calculation of the entire database.
For more information, contact the Essbase system administrator.
Creating Multiple Worksheets from Data
One frequent requirement of budgeting and planning applications is to send worksheets to
various functional areas of an organization. After the worksheets have been distributed, the
recipients can review the contents, make modifications, and send updates back to the distributor.
150 Advanced Tutorial
Using the Essbase Cascade feature, you can create multiple worksheet files based on a single
database view. You can specify at what level of detail you want to replicate the worksheets to
tailor the information to each recipient’s needs.
The Sample Basic database contains data for beverage products sold in different states across the
U.S. For example, assume that you want all product managers to review and respond to a
proposed budget and to return their changes to the finance department. You must create a
worksheet for each combination of budget and P&L data to distribute to the product managers
for their respective products.
➤ To create this set of worksheets:
1 Select File > Open.
2 From the \AnalyticServices\client\sample directory, open the P&l.xls file.
This file contains the data that you need to replicate for each worksheet.
3 Select Essbase > Retrieve.
Notice that the retrieval uses the Use Aliases option, which is already set for this file in the Essbase
Options dialog box. In this example, product 200 changes to Root Beer, which is its preassigned
alias.
4 Select Central (in cell B1) and Root Beer (in cell B2) as the members to be represented in the resulting
worksheets.
5 Select Essbase > Cascade.
Essbase displays the Essbase Cascade Options dialog box.
6 Click the Cascade Information tab.
The Cascade Information page contains the list of members that you selected and the options
for specifying the level at which the selected members are retrieved into the cascaded worksheets.
For more information on each option, see the Spreadsheet Add-in online help.
7 Select Central in the Member list box, and select Same level in the Choose Level for Selected Member
option group.
8 Select Root Beer in the Member list box, and select Next level (the default setting), as shown in
Figure 162.
Creating Multiple Worksheets from Data 151
Figure 162
Cascade Information Tab
The replicated, or cascaded, spreadsheet reports now provide data for members at the same level
as Central (East, West, and South) and for members at the level below Root Beer (Old Fashioned,
Diet Root Beer, Sarsaparilla, and Birch Beer).
9 Click the Destination Options tab.
10 In the Destination Directory text box, type C:\temp as the name of the directory where you want the
cascaded worksheets to be stored.
You can also click Browse to select a destination directory from the Browse dialog box.
11 In the Destination Types group box, select the Separate Workbooks option (the default setting) to create
separate spreadsheet files for each cascaded worksheet.
You can also choose to create only one workbook with separate worksheets for each cascaded
report, or you can choose to send the cascaded reports to the printer.
12 In the File Information group box, select the Overwrite Existing Files check box (the default setting).
When this check box is selected, Essbase overwrites any cascaded worksheets with the same file
name.
You can also select the Open Created Files check box to open each cascaded file in the spreadsheet
as it is created.
Caution!
Depending on the number of replicated worksheets that you want to create, the Cascade
command can create more worksheets than can be stored in the memory of your computer.
Therefore, the Open Created Files option should not be used when you are replicating large
numbers of worksheets.
13 In the Naming Information group box, type BUD in the Prefix text box.
The completed Destination Options tab should look like Figure 116.
152 Advanced Tutorial
Figure 163
Destination Options Tab
When you assign a prefix or suffix in the Naming Information group box, the worksheet files
that are generated as a result of executing the Cascade command are named with the prefix or
suffix that you specify. The default is to generate worksheet names that are numbered 1 through
n, where n is the total number of worksheets created.
The syntax for the file names is PrefixnSuffix.xls for Excel. If you do not specify a prefix or suffix,
Essbase creates the worksheets 1.xls, 2.xls, and so on. If you are creating a single workbook,
the same naming convention is used for the worksheet tab names within the workbook.
Caution!
Do not specify a prefix and suffix combination that leaves no characters free for Essbase to create
unique file names. If file names are duplicated, Essbase overwrites the duplicate file name with
the last cascaded worksheet.
14 Click the Format Options tab, as shown in Figure 169.
Figure 164
Format Options Tab
Creating Multiple Worksheets from Data 153
15 Select the Copy Formatting check box to copy the formatting of the source worksheet into each cascaded
worksheet.
Copy formatting copies only the visual cues set using Essbase and the cell formatting that you
set using the worksheet. It does not copy formulas, column formatting, worksheet formatting,
or graphs.
16 In the Header and Footer text boxes, specify a header or footer name to be used for all of the cascaded
worksheets.
17 In the Sheet Formatting group box, select the Suppress Missing Rows check box so that rows containing
only #Missing values are not replicated.
18 In the Table of Contents group box, select the Include Table of Contents check box.
This creates a Table of Contents text file that lists all replicated worksheets, their creation dates,
and their member content. By default, Essbase names the Table of Contents file with the
extension .lst.
19 Click OK to create the cascaded worksheets.
Essbase rapidly creates the cascaded worksheets. As each worksheet is created, it is automatically
saved, closed, and logged in the Table of Contents. Each individual file is saved in the directory
that you specified, named Bud1.xls through Bud10.xls. When the Cascade is completed,
Essbase returns you to the original worksheet view (that is, the source file).
20 Using a text editing application, open the Table of Contents file from the destination directory that you
specified earlier. This file is named BUD0.LST and contains a list of all cascaded worksheets, as shown in
Figure 165.
Figure 165
Table of Contents File for Cascaded Worksheets
21 Select File > Close to close the worksheet.
You do not need to save the worksheet.
You can create multiple worksheet files based on the attributes of a product. Type in the attribute
names in the top row of the worksheet. Select the attribute names and select Essbase > Cascade.
Proceed as previously described.
154 Advanced Tutorial
Working with Currency Conversions
Organizations with offices in different countries generally do business in the currency of the host
country (known as the local currency). Such organizations must convert data entered in local
currencies to a common currency for consolidation and analysis.
The Essbase Currency Conversion product can be purchased separately for Essbase. If your
organization purchased this product and implemented a currency conversion application, you
can take advantage of the capabilities of Essbase Currency Conversion. The Hyperion Essbase System 9 Database Administrator's Guide describes how to design and implement a currency
conversion application.
The following topics provide a brief tutorial for working with currency conversions:
●
“Retrieving Currency Conversion Data” on page 155
●
“Connecting to the Sample Currency Databases” on page 156
●
“Performing Ad Hoc Currency Reporting” on page 157
Retrieving Currency Conversion Data
This topic focuses on basic currency conversion concepts, including the Currency Report
command.
A currency conversion application consists of two databases:
●
A main database that contains data in local and converted values
●
A currency rates database that contains exchange rates
Apply exchange rates from the currency rates database to local values from the main database
to derive converted values. The Essbase Server product installation includes a sample currency
conversion application (installation options) that consists of two sample databases: a main
database called Interntl and a currency rates database called Xchgrate.
The Sample Interntl database consists of five dimensions: Year, Measures, Product, Market, and
Scenario. All but the Market and Scenario dimensions are identical to the Sample Basic database.
The Market dimension includes Toronto, Vancouver, Montreal, Germany, Sweden,
Switzerland, and the UK. The Scenario dimension handles different currency types (such as
Actual and Budget) in both local and converted currencies. In this database, all local currencies
are converted to the common currency of U.S. dollars.
The Sample Xchgrate database, which is a subset of the main database, contains four dimensions:
●
The CurTime dimension accommodates different exchange rates by month.
●
The CurName dimension contains names of currencies from their respective markets.
●
The CurCategory dimension contains the names of the various currency categories that may
be applied to the categories of Measures. For example, one rate is applied to Profit and Loss
items and another rate is applied to Balance Sheet items.
●
The CurType dimension enables a currency database to contain rates for different scenarios,
such as Actual and Budget.
Working with Currency Conversions 155
Connecting to the Sample Currency Databases
To complete the following exercises, the Sample Interntl and Sample Xchgrate databases must
be installed on the server. Contact the Essbase system administrator if these application and
database pairs are unavailable.
➤ To retrieve data from the Sample Interntl database:
1 Select Essbase > Connect.
2 Select the Sample Interntl database and click OK to complete the connection.
The Essbase installation also includes sample spreadsheet files that illustrate currency conversion
concepts.
3 From the \AnalyticServices\client\sample directory, open Local.xls.
The worksheet contains actual (Act) and budget (Bud) data entered in local currencies for New
York and Germany, as shown in Figure 166.
Figure 166
Retrieving Local Data
4 From the \AnalyticServices\client\sample directory, open Convert.xls.
5 Select Essbase > Retrieve.
The worksheet contains values for Actual and Budget as they are displayed after conversion.
Figure 167
156 Advanced Tutorial
Retrieving Converted Data Values
The worksheet contains data that is converted to U.S. dollars. Values for New York remain the
same, but German values are converted. Essbase converts the values by using the exchange rates
from the Sample Xchgrate database.
6 From the \AnalyticServices\client\sample directory, open Rates.xls.
7 Connect to the Sample Xchgrate database.
8 Select Essbase > Retrieve.
The portion of the result is shown in Figure 168.
Figure 168
Retrieving Exchange Rates from a Currency Database
The worksheet contains all possible combinations of exchange rate scenarios, categories, and
types by month. Because this example converts to U.S. dollars (USD), the sample file contains
a base rate of 1 for USD. Therefore, the local and converted figures remain the same for New
York. Essbase converts the figures for Germany, however, by using data values in the currency
database, as follows:
●
Essbase divides data values from Actual by values in the Act xchg currency type.
●
Essbase divides data values from Actual @ Bud xchg by values in the Bud xchg currency type.
●
Essbase divides data values from Budget by values in the Bud xchg currency type.
●
Essbase bases all figures in Convert.xls on the CurCategory of P&L and the CurTime of
Jan.
Note:
A conversion can be defined as a multiplication or division operation on exchange rates.
The definition is determined by the application designer.
Performing Ad Hoc Currency Reporting
A main database, such as Sample Interntl, usually contains values that are converted and stored
in the database. You may want to perform currency conversions dynamically, as well. Essbase
provides this capability with the Currency Report command. This command enables you to
interactively change the currency rates and types applied to the retrieval.
Working with Currency Conversions 157
➤ To perform an ad hoc conversion on data in the Convert.xls file:
1 From the \AnalyticServices\client\sample directory, open Convert.xls.
The worksheet contains data that is already converted to U.S. dollars.
2 Select Essbase > Connect and connect to the Sample Interntl database.
3 Select Essbase > Retrieve.
4 Select Essbase > Currency Report.
Essbase displays the Essbase Currency Report dialog box, as shown in Figure 169.
Figure 169
Essbase Currency Report Dialog Box
The Essbase Currency Report dialog box enables you to modify the exchange rates applied to
the retrieval interactively. The box contains options for currency settings, names, categories, and
years. For more information on these options, see the Spreadsheet Add-in online help.
Note:
The dimension names CurName, CurType, and CurCategory are default names for a currency
database. The application designer can use different names for any of these dimensions.
5 Select the currency settings that you want to apply.
For example, select CAD from the CurName drop-down list and Bud xchg from the CurType
drop-down list.
6 Click Apply to apply the settings.
7 Select Essbase > Retrieve to refresh the data in the worksheet with the results of the ad hoc conversion.
In the example shown in Figure 170, Essbase converted the New York and Germany figures to
Canadian dollars (CAD).
Figure 170
158 Advanced Tutorial
Performing an Ad Hoc Currency Conversion
8 Click the Clear button in the Essbase Currency Report dialog box to make currency reporting unavailable
and return to standard retrieval mode.
Performing a currency report retrieval does not change values in the database. The process
performs a temporary conversion as part of the retrieval. Converted data values may not always
balance, because the ad hoc conversion is performed on values that were previously calculated
or previously consolidated in another currency.
If values must balance and be verified, they must be converted to the target currency in the
database, calculated, and retrieved. This procedure differs from the ad hoc currency conversion
retrievals described in this section.
Working with Currency Conversions 159
160 Advanced Tutorial
Using Drill-Through
5
In This Chapter
About Drill-Through .............................................................................................................. 161
Before You Start.................................................................................................................. 163
Using Drill-Through............................................................................................................... 169
Disconnecting from Essbase .................................................................................................... 187
Integration Services is a product that works with Essbase and Spreadsheet Add-in for Microsoft
Excel. Essbase is a suite of tools and data integration services that serves as a bridge between
relational data sources and Essbase Server. Drill-through is one of these tools. Drill-through
enables you to view and customize spreadsheet reports that display data retrieved from relational
databases. Your organization must license Essbase for you to use the drill-through tool.
This chapter provides a brief overview of drill-through and a tutorial that guides you through
tasks for using drill-through. It also include a description of the sample database, spreadsheet
file, and drill-through report used in the tutorial.
About Drill-Through
Despite the benefits of the multidimensional database for storing analytic data, some data
elements required for analysis are better suited to the relational structure of a relational database.
The scope of data residing in an Essbase database is typically at a summary level, where data is
summarized and calculated for planning and analysis. Detailed, transactional data usually is not
examined during the planning and analysis of a business.
For example, you might use Essbase to analyze retail sales for the first quarter in the Eastern
region. Detailed data, such as a list of customers who purchased a particular product in a
particular size, is unnecessary during the normal course of analyzing business performance. As
you analyze sales results, however, you may want to view more detailed information. Drillthrough enables you to drill from the summarized and calculated data stored in Essbase Server
of your organization into detailed data stored in a relational database.
The database administrator predefines a data mapping for you from Essbase to the relational
source. For example, the Essbase members East, West, South, and Central might map to a field
called Region in a relational database. As you navigate through data in the spreadsheet, Essbase
can detect how the current data maps to the relational source. For example, suppose you select
cell G4 in Figure 171.
About Drill-Through 161
Figure 171
Example of a Drill-Through Sheet
The dimensional attributes of the cell are as follows: Actual, Profit, New York, Feb, and Product.
The combination of one or more of these attributes becomes the basis for a drill-through query
that returns data from the relational source.
From Spreadsheet Add-in, you can access a predefined drill-through report that is based on the
dimension or member intersections of Essbase data cells in the sheet. Using Integration Services
Console, an administrator at your organization sets up drill-through reports for you to access;
that is, each drill-through report is already defined in terms of what to retrieve from the relational
source.
In Spreadsheet Add-in, you can access drill-through reports from the Linked Objects Browser
dialog box, as shown in Figure 172. When you select a drill-through cell in the sheet and select
Essbase > Linked Objects, the Linked Objects Browser dialog box displays a drill-through entry
that you can select and launch.
Figure 172
Linked Objects Browser Dialog Box with Drill-Through Entry
You can define a style for cells tagged as “drill-through” to identify which cells in the spreadsheet
are associated with drill-through reports. For more information on definining styles for drillthrough cells, see “Accessing Drill-Through Reports from the Spreadsheet” on page 169.
About the Drill-Through Wizard
An administrator at your organization can predefine drill-through reports for you to view or to
customize. The person who develops a report determines whether the report can be customized
162 Using Drill-Through
by drill-through users. If a report can be customized, you use the Drill-Through Wizard to
customize it.
The Drill-Through Wizard is a graphical user interface that steps you through the following
customization tasks:
●
Selecting columns to retrieve from the relational data source
Decide which columns from the predefined report you need to see.
●
Selecting the display order for columns
Change the default display order of columns across the sheet.
●
Selecting a sort order for data
Select an ascending or descending sort order for a particular column; for example, sort a list
of store managers in alphabetical order.
●
Selecting data filters
Define a filter on a column so that only data meeting certain criteria is retrieved.
Before You Start
Before starting the tutorial, you should have a working familiarity with the Essbase product
through the use of the Spreadsheet Add-in interface. Review in this guide Chapter 3, “Basic
Tutorial” and Chapter 4, “Advanced Tutorial” as prerequisite reading.
A sample Essbase database is the basis for the examples in this tutorial. The database
administrator creates this sample Essbase database using the sample metaoutline supplied
withIntegration Services. For information on creating the Integration Services sample
application, which includes the sample metaoutline, see the Integration Services Console online
help. A sample spreadsheet file, Essdt.xls, contains a sheet with the appropriate member
intersections for the sample drill-through report. For more information on the sample database,
spreadsheet file, and drill-through report, see “About the Samples Used in This Tutorial” on
page 168.
If you plan to follow the examples in a live working session, check with the person at your
organization who installs theIntegration Services product family for information on the sample
database that you need for drill-through, and to which instance of Essbase Server you should
connect.
Note:
The Essdt.xls file also contains sample results of the drill-through reports when you run them
without customizing the reports. The results are provided in separate sheets in the workbook so
that you can see the sample report results without working through the tutorial. For more
information about the sample reports, see “About the Samples Used in This Tutorial” on page
168.
Before starting the tutorial, make sure you meet the following requirements:
Before You Start 163
●
You must install the following components on your client computer:
❍
A 32-bit version of Excel
❍
Essbase Spreadsheet Add-in
❍
The Drill-through module
The drill-through module is installed automatically when you install Spreadsheet Addin. This module is transparent until you invoke it from the Linked Objects Browser. For
more information on installation, contact the Essbase system administrator.
●
The Essbase system administrator must install the Essbase Server.
●
You must have access to Integration Services and to an instance of Essbase Server. For more
information, contact the Essbase system administrator or the person who administers
Integration Services at your organization.
●
You must have access to the underlying relational database (typically using a username and
password that are different from those that you use for Essbase). To obtain the appropriate
access, contact the Essbase system administrator or the person who administers Integration
Services at your organization.
●
Make sure that the Essdt.xls sample drill-through report spreadsheet is available in the
\AnalyticServices\client\sample directory.
●
To use the Essdt.xls sample drill-through report spreadsheet, you need to log in to a
computer with both Essbase Server and Integration Services installed. You must perform a
member and data load and calculate the data for the sample Essbase database that you will
access from Spreadsheet Add-in.
●
The sample database that contains the drill-through report must be set up and running. The
sample drill-through reports used in this tutorial (called “Market Detail,” “Measures Detail,”
and “Product Detail”) are available with the sample spreadsheet files. Contact the person at
your organization who installs Integration Services to find out the name of the sample
database to use for drill-through.
For more information on Essbase installations, see the Essbase Integration Services Installation
Guide. For more information on Essbase installations, see the Hyperion Essbase - System 9
Installation Guide.
Keep in mind the following guidelines during the tutorial:
●
Each tutorial task builds upon the previous one, and tasks must be followed in succession.
●
Optional tasks are displayed in gray boxes. These tasks are included for your reference only
and should not be performed as part of the tutorial. You can find more information on these
tasks in the Drill-Through online help.
●
The examples used in this tutorial are based on the sample database that is included with
the Integration Services installation. Contact the person at your organization who installs
Integration Services for information about accessing the sample database.
●
Set the options in the Essbase Options dialog box as described in “Setting Essbase Options”
on page 165. If the option settings are different, the illustrations presented in this chapter
may not match the spreadsheet view.
164 Using Drill-Through
●
If you make a mistake during the tutorial, select Essbase > FlashBack to return to the previous
spreadsheet view.
Setting Essbase Options
Before you begin the tutorial, make sure that the spreadsheet options are set to the initial settings,
as illustrated in Figure 173 through Figure 177. If your option settings are different, the
illustrations presented in this chapter may not match the spreadsheet view.
For information about each option in the Essbase Options dialog box, click Help to see the
Spreadsheet Add-in online help.
➤ To set Essbase options:
1 From the spreadsheet menu, select Essbase > Options.
2 In the Essbase Options dialog box, select the Display tab.
3 Select the appropriate check boxes and option buttons so that your display matches Figure 173.
Figure 173
Initial Settings for Display Options
4 Select the Zoom tab.
5 Select the appropriate check boxes and option buttons so that your display matches Figure 174.
Before You Start 165
Figure 174
Initial Settings for Zoom Options
6 Select the Mode tab.
7 Select the appropriate check boxes and option buttons so that your display matches Figure 175.
Figure 175
Initial Settings for Mode Options
8 Select the Style tab.
9 Select the appropriate check boxes and option buttons so that your display matches Figure 176.
166 Using Drill-Through
Figure 176
Initial Settings for Style Options
10 Select the Global tab.
11 Select the appropriate check boxes and option buttons so that your display matches Figure 177.
Figure 177
Initial Settings for Global Options
12 Click OK to save the settings for this session and close the Essbase Options dialog box.
Before You Start 167
About the Samples Used in This Tutorial
The sample database used for this tutorial contains the following dimensions: Scenario, Product,
Market, Measures, and Year. The sample spreadsheet file shown in Figure 178 provides a
particular view from the sample database.
Figure 178
View from Sample Database
For this spreadsheet view, detail-level data exists in a relational data source—data that is not
available from Essbase. For example, the relational source contains columns of data for market
detail, measures detail, and product detail. This steps in this tutorial walk you through a sample
drill-through session, where you will drill down from the data shown in Figure 178 into the detail
data from the relational source.
This tutorial uses two sample drill-through reports, “Measures Detail” and “Market Detail.” As
with all drill-through reports, these reports have been predefined to retrieve specific columns
from the relational source. You will use the Drill-Through Wizard to customize the report,
“Measures Detail.”
Note:
The sample file also contains two more sample reports called “Product Detail” and “Two reports”
that you can use for drill-through practice. In “Two reports,” select the drill-through cell B3 to
select from two drill-through reports, “Product Detail” and Market Detail, select cell B6 to view
“Market Detail,” and cell G3 to view “Product Detail.”
In addition to the sample drill-through reports, the Essdt.xls file provides sample results of
the drill-through reports. The following list describes the drill-through results that are provided:
●
The Market Detail drill tab displays the results for Market Detail when you run a drillthrough report on cell G4 without customizing the report.
●
The Measures Detail drill1 tab displays the results for Measures Detail when you run a drillthrough report on cell C4 without customizing the report.
●
The Measures Detail drill2 tab displays the results for Measures Detail when you run a drillthrough report on cell G6 without customizing the report.
168 Using Drill-Through
●
The Product Detail drill tab displays the results for Product Detail when you run a drillthrough report on cell D5.
Using Drill-Through
Drill-through consists of these tasks as discussed in the following topics:
●
“Accessing Drill-Through Reports from the Spreadsheet” on page 169
●
“Selecting Drill-Through Reports to View or Customize” on page 174
●
“Selecting and Ordering Columns” on page 179
●
“Ordering Data” on page 180
●
“Filtering Data” on page 182
Accessing Drill-Through Reports from the Spreadsheet
Using Spreadsheet Add-in, you can access detail-level drill-through reports that are based on
the member intersections of Essbase data cells in the sheet.
Each drill-through report has been predefined by an administrator at your organization; that is,
each drill-through report is already set up to retrieve specific columns from the relational source
and to sort and filter data in these columns in specific ways. Using the Drill-Through Wizard,
you can customize these predefined drill-through reports to retrieve only the data that you want,
displayed in a specific way.
To access the predefined drill-through report, double-click a drill-through cell in the spreadsheet
(or select a range of cells and select Essbase > Linked Objects). You can set styles for cells tagged
as “drill-through” to help identify which cells in the sheet are associated with drill-through
reports.
When you double-click a drill-through cell, Essbase displays the Linked Objects Browser dialog
box, which displays a drill-through report entry. A single cell can be associated with multiple
reports. The Linked Objects Browser dialog box also displays entries for linked partitions and
other linked object types, such as cell notes, URLs, and application files.
After you view or customize the drill-through report, Integration Services retrieves data from
the relational source and displays the results in a new spreadsheet.
➤ Before starting the drill-through tutorial, perform the following tasks:
1 Open the sample Essdt.xls file.
The sample spreadsheet file contains the appropriate member intersections from the sample
database for the drill-through report. This file is provided as part of the default Essbase
installation.
2 Set a style for data cells that are associated with drill-through reports.
Using Drill-Through 169
➤ To access the sample file and sample database:
1 Start the spreadsheet application.
2 Select File > Open and open the Essdt.xls file from the \AnalyticServices\client
\sample directory.
The sample file should look like Figure 179. In this example, the Market Detail tab is selected.
The default tab that is selected when you first open the file may be different.
Figure 179
Sample Spreadsheet File for Drill-Through
The sample file shows data for specific members of an Essbase database. This sample file contains
the following three predefined drill-through reports, indicated by the tabs of the spreadsheet:
“Market Detail,” “Measures Detail,” and “Product Detail.” Using drill-through, you can access
these reports and customize them so that Integration Services retrieves only the data that you
need and displays it in the desired format.
3 Select the Market Detail tab on the spreadsheet.
4 Select Essbase > Connect and connect to the appropriate sample database.
Note:
A specific sample database for drill-through is not automatically provided with Integration
Services or Essbase. Contact the person at your organization who installs Integration Services
to set up a database for you.
5 Select Essbase > Options and select the Style tab.
6 In the Data Cells option group, select the Integration Server Drill-Through check box and click Format.
Essbase displays the Font dialog box.
7 Select Bold Italic from the Font style list box.
8 Select Blue from the Color drop-down list, and click OK to return to the Essbase Options dialog box.
170 Using Drill-Through
Figure 180
Font Dialog Box Selection
In the Essbase Options dialog box, Essbase displays an example of the selected style in the Sample
box.
Figure 181 shows how the Essbase Options Style tab looks with the style for drill-through cells
defined.
Figure 181
Sample Style for Drill-Through Data Cells
9 In the Essbase Options dialog box, select the Display tab, and then select the Use Styles check box, as
shown in Figure 182.
Using Drill-Through 171
Figure 182
Setting the Use Styles Option
10 Click OK to close the Essbase Options dialog box.
11 Select Essbase > Retrieve to display the new style in the spreadsheet.
In Figure 183, the sample drill-through report is associated with the data cells for Actual, Profit,
and Product at the month and Eastern state levels, so that these data cells are displayed in blue,
bold, and italic font.
Figure 183
Sample Spreadsheet File with Drill-Through Style Applied
➤ To access the sample drill-through report from Spreadsheet Add-in:
1 Select any drill-through cell; for example, cell G4.
You can also select a continuous range of cells from the same parent in one dimension to display
all drill-through reports associated with the cells that you select. In this example, there is only
one drill-through report attached to the range of cells.
In order for Integration Server to return a valid drill-through report when multiple cells are
selected, all members selected for multi-cell drill-through must come from:
172 Using Drill-Through
●
The same physical table and column in the relational source database
●
The same member level in the underlying OLAP metaoutline
●
The same hierarchy
A multi-cell drill-through operation is valid only if all three criteria noted above are met. A
message is displayed if the combination of cells you select is not valid for performing a multicell drill-through operation.
2 Access the Linked Objects Browser in either of these ways:
●
Select Essbase > Linked Objects to open the Linked Objects Browser dialog box, as shown
in Figure 184.
Figure 184
●
Linked Objects Browser Dialog Box with Drill-Through Entry Selected
In the Essbase Options dialog box (Global tab), select the Enable Linked Object Browsing
check box.
This process enables you to double-click a linked object cell to open the Linked Objects
Browser dialog box.
This option works only with single-cell selection. If you select a range of cells, use the
Essbase > Linked Objects menu command.
3 Select the drill-through report entry and click View/Launch.
4 In the Select Drill-Through Report dialog box, select Market detail and click Execute.
The results of the drill-through report are displayed in a spreadsheet. The results of the Market
Detail report shows that the regional director for the East region is John West and that the
population for New York is between 18,000,001-21,000,000.
Figure 185
Results of Market Detail Drill-Through Report
If there is only one report available for the cells that you select in the spreadsheet and if that
report is not designed to be customized, the drill-through process generates the report and
immediately displays the results in the spreadsheet. The person at your organization who
Using Drill-Through 173
develops drill-through reports specifies whether you can customize a report and whether you
need to log in to access the drill-through report and the relational data source.
5 Follow the steps in “Selecting Drill-Through Reports to View or Customize” on page 174 to select a report
to customize.
Selecting Drill-Through Reports to View or Customize
After you launch the drill-through process from the Linked Objects Browser dialog box,
Integration Services displays the Select Drill-Through Report dialog box under one or the other
of the following conditions:
●
More than one drill-through report exists for the cell or cell range that you select in the
spreadsheet.
●
Only one report exists, but you have the option of customizing it using the Drill-Through
Wizard.
The Select Drill-Through Report dialog box displays the list of drill-through reports available
for the cells that you select in the spreadsheet. Depending on how a report is defined in
Integration Services Console, you may have access only to view, not customize, the report.
Note:
Tasks that you should not perform as part of the tutorial are shown in light colored boxes.
This task is optional. Optional tasks do not need to be performed as part of the tutorial. They are provided for information
only.
The sample report used for this tutorial is the Measures Detail report. You will use the Drill-Through Wizard to customize
this sample report.
To execute a predefined drill-through report without customizing it, perform these tasks:
1. Select the report that you want to view from the Available Reports list box.
2. Click Execute.
Integration Services retrieves the data from the relational source and displays the results in a new spreadsheet. The
new sheet is added before the current sheet.
➤ To customize the sample drill-through report:
1 In the Essdt.xls file, select the Measures Detail tab, as shown in Figure 186.
174 Using Drill-Through
Figure 186
Initial Drill-Through Report for Measures Detail
2 Select Essbase > Connect and connect to the appropriate sample database.
Note:
A specific sample database for drill-through is not automatically provided with Integration
Services. Contact the person at your organization who installs Integration Services to set up a
database for you.
3 Select Essbase > Options and select the Style tab to define styles for this sheet.
4 In the Data Cells option group, select the Integration Server Drill-Through check box and click Format.
Essbase displays the Font dialog box, as shown in Figure 180 on page 171.
Note:
The style for drill-through cells may already be set as blue, bold, and italic because you set the
style in the previous exercise. If this is the case, then go to step 7.
5 Select Bold Italic from the Font style list box.
6 Select Blue from the Color drop-down list, and click OK to return to the Essbase Options dialog box.
In the Essbase Options dialog box, Essbase displays an example of the selected style in the Sample
box, as shown in Figure 187.
Using Drill-Through 175
Figure 187
Sample Style for Drill-Through Data Cells
7 In the Essbase Options dialog box, select the Display tab and select the Use Styles check box, as shown
in the Cells group box in Figure 188.
Figure 188
Setting the Use Styles Option
8 Click OK to close the Essbase Options dialog box.
9 Select Essbase > Retrieve to display the new style in the spreadsheet.
In this example, the sample drill-through report is associated with every member intersection
at the state level in the East region, so that all data cells associated with an Eastern state and
children of Cola are now displayed in blue, bold, and italic font.
176 Using Drill-Through
Figure 189
Sample File with Drill-Through Style Applied
➤ To access the sample drill-through report from Spreadsheet Add-in:
1 Select any drill-through cell; for example, cell G6, as shown in Figure 190.
Figure 190
Selecting the Drill-Through Cell for the Measures Detail Report
If Integration Services is not running, the drill-through process does not launch properly. If
drill-through is not launching properly, contact the Essbase system administrator.
If you are prompted with the Drill-Through Login dialog box to connect to Integration Server
and the relational data source, enter the appropriate connection information. The person at
your organization who administers Integration Services and develops drill-through reports
should provide you with this information.
2 Access the Linked Objects Browser in either of these ways:
●
Select Essbase > Linked Objects to open the Linked Objects Browser dialog box, as shown
in Figure 184.
●
In the Essbase Options dialog box (Global tab), select the Enable Linked Object Browsing
check box.
This process enables you to double-click a linked object cell to open the Linked Objects
Browser dialog box.
This option works only with single-cell selection. If you select a range of cells, use the Essbase
> Linked Objects menu command.
3 Select the drill-through report entry and click View/Launch.
The Select Drill Through Report dialog box is displayed.
Note:
In the Select Drill Through Report dialog box, if the Customize button is selectable, then you
can customize the report. If more than one drill-through report is displayed, then you can select
from the different drill-through reports. In this tutorial, only one report, “Measures detail,” is
displayed and customizable.
Using Drill-Through 177
4 Select the Measures detail report in the Available Reports list, as shown in Figure 191.
Figure 191
Selecting the Sample Drill-Through Report
5 Click Customize.
Note:
The Customize button may or may not be selectable for any given report, depending on how
the report was defined in Integration Services Console.
Integration Services displays the first screen of the Drill-Through Wizard, as shown in
Figure 192.
Figure 192
Drill-Through Wizard Dialog Box, Introductory Screen
6 Click Next to display the Select Columns and Display Order dialog box, as shown in Figure 193.
178 Using Drill-Through
Figure 193
Select Columns and Display Order Dialog Box
7 Follow the steps in the topic, “Selecting and Ordering Columns” on page 179, to select and order rows for
the customized report.
Selecting and Ordering Columns
Using the Drill-Through Wizard, you can customize predefined drill-through reports. The first
task in using the Drill-Through Wizard is selecting and ordering columns to retrieve from the
relational database. These columns contain detailed information that is not available in the
Essbase database.
In the Select Columns and Display Order dialog box, you can select which columns you want
Integration Services to retrieve from the relational data source. From this dialog box, you can
also specify how the columns are displayed in the resulting report.
The Available Columns list consists of columns available from the relational data source for this
report (as defined in Integration Services Console). The Selected Columns list box consists of
the columns from the Available Columns list in expanded form. You can remove columns from
the Selected Columns list to exclude them from the drill-through report.
In this example, the columns from the Available Columns list are selected for inclusion in the
sample Measures detail report. These columns are displayed in expanded form in the Selected
Columns list.
➤ To remove one of the selected columns from the drill-through report:
1 From the Selected Columns list, select the MARKET.STATE column., as shown in Figure 194.
Note:
To select multiple columns in the list that are not adjacent to each other, hold down the Ctrl key
and select each column. To select a range of columns, hold down the Shift key and click the first
and last columns in the list, which also selects all columns in between them.
Using Drill-Through 179
Figure 194
2 Click
Selecting Columns to Remove from the Drill-Through Report
to move the selected column from the Selected Columns list back to the Available Columns list.
Note:
To move a column from one list to another, click
to another, click
or
or
. To move all columns from one list
.
3 Click Next to display the Select Data Sort Order dialog box, and follow the steps in the topic, “Ordering
Data” on page 180 to further customize the report.
Note:
When you finish customizing the report, click Finish at any time to generate the report and view
the results in a new sheet. The new sheet is placed before the current sheet.
Ordering Data
In the Select Data Sort Order dialog box, you can select an ascending or descending sort order
for the data in a column. Sort order determines the order in which rows will be displayed in the
drill-through report. For example, you can sort the contents of the Time.TRANSDATE column,
which represents the transaction dates, in ascending order in the drill-through report.
➤ To define the sort order of rows in the drill-through report:
1 In the Available Columns list, select the Time.TRANSDATE column.
The columns in the Available Columns list box are those that you selected in “Selecting and
Ordering Columns” on page 179. The columns in the Column list are those for which a sort
order has already been defined in Integration Services Console.
If a data sort order was selected when the report was created in Integration Services Console, the
Order By list displays that selection. Otherwise, the default sort order is Ascending.
180 Using Drill-Through
2 Click
to move the Time.TRANSDATE column to the Column list, as shown in Figure 195, so that you can
define a sort order for the column.
Note:
To move a column from one list to another, click
to another, click
Figure 195
or
or
. To move all columns from one list
.
Moving a Column to the Column List for Sorting
3 In the Column list, double-click the Time.TRANSDATE column to change the data sort order from Ascending
to Descending, as shown in Figure 196.
This action causes transaction date values to be displayed in reverse chronological order in the
drill-through report.
Figure 196
Selecting the Data Sort Order
Using Drill-Through 181
Note that this task is optional. Optional tasks do not need to be performed as part of the tutorial. They are provided
for information only.
To change the data sort order for multiple columns at one time, perform these tasks:
a. Hold down the Ctrl key and select the desired columns from the Column list.
b. Click Order By.
Integration Services displays the Order By dialog box.
Figure 197
Order By Dialog Box
c. Select Ascending or Descending and click OK to return to the Select Data Sort Order dialog box.
4 Click Next to display the Select Data Filters dialog box, and follow the steps in the topic, “Filtering Data”
on page 182 to customize the report further.
Filtering Data
You can create and apply filters to determine what Integration Services retrieves for the drillthrough report. You can also save, edit, and delete the filters that you create. For any given
column, you may want to retrieve only data that meets certain conditions. For example, the
MEASURES.CHILD column in the sample database contains all children of the Measures
dimension.
In the sample drill-through report, if you do not apply a filter to this list of measures, Integration
Services retrieves all children from the relational source, because the sample drill-through report
applies to all children of Measures. In this section, you will apply a filter to the
MEASURES.CHILD column so that all children of Measures, except Misc, are included in the
report.
Note:
When you apply a filter on a non-level 0 member using Integration Services, the filter may return
more members than expected. To work around this problem, use the Drill-Through Wizard.
➤ To define a filter:
1 Select the MEASURES.CHILD column from the Column list.
182 Using Drill-Through
As shown in Figure 198, the columns in the Column list box are those that you selected in
“Selecting and Ordering Columns” on page 179.
Figure 198
Select Data Filters Dialog Box
If there is a filter already attached to the column, it is displayed in the Condition column. The
full string of the filter is displayed in the lower Condition text box.
2 With the MEASURES.CHILD column selected, click Add condition.
The Set Filter on Column dialog box is displayed, as shown in Figure 199.
Figure 199
Set Filter on Column Dialog Box
3 Select CHILD from the Column drop-down list.
The column displayed in the Column drop-down list is the one that you selected in step 1 on
page 182.
4 Select the < > operator, which represents not equal to, from the Operator drop-down list.
Using Drill-Through 183
Note:
You can select multiple values at one time only if you have selected In or Not In as the filter
operator. For more information on filter operators, see the Drill-Through online help.
5 Click the Browse
button next to the Condition text box to open the Select Filter Values from the List
dialog box, which lists all possible values for that column.
The Select Filter Values from the List dialog box is displayed.
Note:
Integration Services retrieves these values directly from the relational data source. If the relational
data source contains many values, Integration Services confirms if you want to view them all
before it retrieves them from the data source.
6 In the Select Filter Values from the List dialog box, select Misc, as shown in Figure 200, and click OK.
Figure 200
Selecting Filter Values from the List
The Set Filter On Column dialog box is displayed.
7 In the Set Filter On Column dialog box, click Add to add the condition to the Filters list.
Note:
For information on using multiple filter conditions, see the Drill-Through online help.
The Set Filter on Column dialog box should look like Figure 201.
184 Using Drill-Through
Figure 201
Defining a Filter for a Column
The filter defined above causes all children of Measures, except Misc data, to show in the drillthrough report.
The Add button becomes unselectable after you create the first filter, but becomes selectable
when you create another filter. In this tutorial, you are creating only one filter. The And and Or
options are used when combining multiple filters. The default value is Or, which means that
Integration Services applies the filter if any of the conditions that you specify are met. If you
select And, Integration Services applies the filter only if all the conditions are met.
8 Click OK to return to the Select Data Filters dialog box.
Notice that the filter defined in the Set Filter on Column dialog box is displayed in the Condition
column and the Condition text box of the Select Data Filters dialog box.
Figure 202
Result of Defining a Filter for a Column
You can also create a filter by typing the filter conditions directly into the Filters text box of the
Set Filter on Column dialog box. For more information, see the Drill-Through online help.
Using Drill-Through 185
To clear a filter for a selected column, select the filter and click Clear. To clear all filters for all
columns, click Clear All.
You can save the filter that you just created and then apply it to the MEASURES.CHILD column,
so that all children of Measures, except Misc, are included in the report.
➤ To save the filter that you just created:
1 In the Select Data Filters dialog box, click Add new filter.
The Filter Name dialog box is displayed.
2 In the Name text box of the Filter Name dialog box, type the name for the filter that you are creating.
For this tutorial, type All Children of Measures except Misc, as shown in Figure 203.
Figure 203
Naming a Filter in the Filter Name Dialog Box
3 Select the Copy definition of current filter check box.
Selecting Copy definition of current filter gives the filter the same description and conditions as
the filter currently selected in the Select Data Filters dialog box.
4 Click OK.
The filter is added to the list of saved filters in the Filter drop-down list of the Select Data Filters
dialog box.
Optional: If you want to describe the filter, type a short description for the filter in the Description
text box.
5 Click Save Filters.
6 Click Finish to apply the filter to the MEASURES.CHILD column, so that all children of Measures, except
Misc, are included in the report.
Note:
You can also delete or rename filters. See the Spreadsheet Add-in online help for information.
Oracle's Essbase® Integration Services generates the customized drill-through report and
displays the results in a new spreadsheet. The new spreadsheet is added to the workbook before
the current spreadsheet.
186 Using Drill-Through
Figure 204
Customized Drill-Through Report
In this sample, the customized drill-through report reflects the specifications that you set using
the Drill-Through Wizard:
●
The Time.TRANSDATE column is sorted in descending order, displaying the transaction
dates in reverse chronological order.
●
All children of Measures, Additions, COGS, Marketing, Payroll, Sales, and Opening
Inventory, except Misc, are displayed as you specified in the filtering part of the DrillThrough Wizard.
Disconnecting from Essbase
When you finish using drill-through, disconnect from Essbase to make a port available on the
server for other Spreadsheet Add-in users.
➤ To disconnect from the server:
1 Select Essbase > Disconnect.
Essbase displays the Essbase Disconnect dialog box, where you can disconnect any spreadsheet
that is connected to a database, as shown in Figure 205.
Figure 205
Essbase Disconnect Dialog Box
Disconnecting from Essbase 187
Oracle's Hyperion® Essbase® – System 9 may return an error message when you attempt to
disconnect after using drill-through. If an error message is returned, select Essbase > Retrieve
from the sheet and then disconnect.
2 Select a sheet name from the list and click Disconnect.
3 Repeat step 2 until you have disconnected from all active sheets.
4 Click Close to close the Essbase Disconnect dialog box.
Note:
You can also disconnect from the server by closing the spreadsheet application. An abnormal
shutdown of a Spreadsheet Add-in session, such as a power loss or system failure, does not
disconnect your server connection.
188 Using Drill-Through
A
B
C
D
E
F
G
H
I
K
L
M
N
O
P
Q
R
S
T
U
V
W
X
Z
Index
Symbols
#Missing strings, suppressing, 53
#NoAccess strings, suppressing, 53
* wildcard character, 82
? wildcard character, 82
A
access
to databases, 33, 89
to Essbase data, 33, 89
to linked partitions, 145
to linked reporting objects, 140
to multiple applications, 34
to multiple databases, 144
to online help, 26
using drill-through reports, 169
using Essbase commands, 32
ad hoc reports, 11, 35, 107, 157
Add button, 183
Add-in Manager, 22
adding members. See members, adding
adjusting columns. See columns, adjusting width. See
columns, adjusting width
administrators, 12
advanced interpretation engine, 123
Advanced Interpretation mode, 123, 128
aliases
definition of, 61
displaying
process of, 61
with member names, 62
with Query Designer results, 79
in tables, 61
alternate dimensions. See dimensions, alternate
alternate names. See aliases
Analytic Services. See Essbase
ancestors, definition of, 18
AND operators, 80
API, 14
application designer, 12
application partitions. See linked partitions
application programming interface, 14
applications/databases
Sample Basic, 21, 33, 35, 90
sample for drill-through, 168
Sample Interntl, 155
Sample Xchgrate, 155
applying queries, 76
ascending sort order
in drill-through reports, 180
IN Query Designer, 99
asymmetric reports
definition of, 101
pivoting, 102
retrieving data into, 101
Attach Linked Object dialog box, 135, 137, 139
attaching reporting objects to cells. See linking
attaching to databases. See connecting
attributes, drill down, 39
auditing updates, 149
auto logouts, 88
Auto Sort Rows option, 125
B
blank
columns, 104
rows, 104
blocks, locking data, 147
Boolean operators, 80, 83
C
Calculation command, 149
Calculation dialog box, 149
calculations
Index 189
A
B
C
D
E
F
G
H
I
database status, 150
databases, 117, 149
dynamic, 117
reducing calculation time, 117
scripts, 150
specifying latest time period, 119
substitution variables, 121
with Dynamic Time Series, 119
with EssCell, 116
canceling data retrievals, 37
Cascade command, 150
Cascade Information page, 151
Cascade Options dialog box, 151
cascading sheets
creating table of contents, 154
destination, 152
format, 153
level of detail, 151
names, 152
output type, 152
cell notes
accessing linked, 141
linking to cells, 137
cell ranges
keeping, 47
removing, 49
retrieving, 112
selecting nonadjacent, 48
with drill-through, 172
cells
accessing linked partitions, 145
applying styles, 55, 59
attaching reports. See linking
attaching URLs. See linking
EssCell function in, 114
formatting, 55, 59, 136
in data cells, 59
of dimension members, 57
of Dynamic Calculation members, 118
of parent members, 55
formulas in, 104, 106, 109, 114
linked reporting objects, 134, 138
linking files to, 134
linking notes to, 137
linking URLs to, 138
retrieving a range of, 112
retrieving single values, 114
190 Index
K
L
M
N
O
P
Q
R
S
T
U
V
W
X
Z
selecting nonadjacent, 48
with nondatabase values, 104
Change Password dialog box, 35
changing
passwords, 35
row and column orientation, 44
spreadsheet format, 54
styles, 55
children (defined), 18
Clear All button, 186
Clear button, 186
Clear command, 37
clearing styles, 60
click (defined), 27
client
components, 12
software, 21
upgrading with server, 7
client-server environment, 12
collapsing data views. See drill
colors, setting, 55
columns
adjusting width, 32, 106
blank, 104
displaying as rows, 44
displaying selected, 47
filtering by, 96
keeping selected, 47
nested, 38
pivoting, 44
removing selected, 49
retrieving into, 39
columns, drill-through
choosing, 179
selecting display order, 179
selecting for retrieval from relational source, 179
sorting, 180
commands
Calculation, 149
Cascade, 150
Clear, 37
Connect, 34, 90, 144
Currency Report, 155, 158
Disconnect, 87
FlashBack, 37
Keep Only, 47
Linked Objects, 134, 138
A
B
C
D
E
F
G
H
I
K
L
Lock, 147
Member Selection, 81
Navigate Without Data, 49, 52
Pivot, 44
Remove Only, 49
Retrieve, 36
Retrieve & Lock, 147
Send, 148
Undo, 37
Unlock, 148
Zoom In, 38
Zoom Out, 41
comparison operators, 80, 96
compatibility with Hyperion Smart View for Office,
8, 28
concurrent
database access, 34, 144
updates to server, 147
conditional retrievals, 94
Connect button, 24
Connect command, 34, 90, 144
connecting, 33. See also disconnecting
to a database, 33, 89
to a relational data source, 161, 169, 177
to Essbase, 34, 90
to Integration Server, 169, 177
to multiple databases, 144
viewing current connections, 145
Connection Information text box, 145, 150
consolidations (defined), 19
conversions, currency, 155
creating queries, 68
creating reports. See reports, creating
Currency Conversion product, 15
currency conversions
modifying exchange rates, 158
reporting, 157
sample databases, 156
settings, 158
Currency Report command, 155, 158
Currency Report dialog box, 158
current time period. See Dynamic Time Series
cursors (Essbase), 36
custom applications, 14
Customize button, 178
customizing drill-through reports, 174
M
N
O
P
Q
R
S
T
U
V
W
X
Z
D
data
calculating, 149
changing orientation, 44
comparison operators, 96
displaying, 16, 36
dynamically calculating, 117
filtering, 94
filtering, in drill-through reports, 185
formatting, 54
locking, 147
missing, 53
modifying, 147
navigating, 19, 49
pivoting, 44
relational, and drill-through reporting, 161
removing subsets, 49
retaining subsets, 47
retrieving. See retrieving
sorting, 94
unlocking, 148
updating, 147, 149
data sort order, and drill-through reporting, 180
data source, relational, 177
databases
calculating. See calculations
concurrent access, 34
connecting. See connecting
consolidations, 19
defined, 15
dimensions, 17
disconnecting from, 87
linked. See linked partitions
loading, 35, 91
locking, 147
members, 18
organization, 17
outlines, 19
queries. See queries
restoring previous views, 37
rules, 17
sample, 33, 155, 168
selecting. See connecting
switching, 144
viewing connections, 145
deleting
filters, in drill-through reports, 186
Index 191
A
B
C
D
E
F
G
H
I
K
L
selected members, 49
styles, 60
descendants (defined), 18
descending sort order
in drill-through reports, 180
with Query Designer, 99
Destination Options page, 152
destinations
cascaded sheets, 152
Query Designer queries, 74
detaching. See disconnecting
dialog boxes, Help buttons, 26
dimensions
alternate, 15
applying styles, 57
currency conversion and, 155
described, 15, 17
drilling down on, 38, 39
drilling up on, 41
naming elements, 17
pivoting, 44
disabling data retrieval. See navigating without data
Disconnect
command, 87
dialog box, 87
disconnecting
forced logouts, 88
from Essbase, 87
from Integration Server, 187
discontinuous rows and columns, 48
disk space, effect on Dynamic Calculation, 117
display
options, 54
order of columns in drill-through reports, 179
Display page (Essbase Options dialog box), 29, 165
Display Unknown Member option, 106, 108
displaying data, 16, 36
distributed sheets. See cascading sheets
double-clicking
defined, 27
enabling
for drilling, 27
for linked object browsing, 140, 146, 173, 177
drag, defined, 27
drag-and-drop operations, 44
drill
by double-clicking, 27
192 Index
M
N
O
P
Q
R
S
T
U
V
W
X
Z
down on attributes, 39, 40
down on consolidations, 19
down to sample of members, 103
Formula Fill, 109
retain formulas during, 109
to less detail, 41
drill-through
accessing, 162, 169
cells, defining styles for, 169
described, 161
installing, 164
multiple cell selection, 172
multiple reports, 162
sample
database, 168
drill-through report, 168
file, 169, 170
saving filters, 186
styles for cells, 162
tutorial guidelines, 164
tutorial requirements, 163
Drill-Through Wizard
dialog box, 178
introductory screen, 178
duplicate member names
enabling display of qualified member name as
comment, 66
enabling display of qualified member name on
sheet, 66
example scenario, 66
qualifed member name, defined, 65
working with, 65
duplicating sheets. See cascading sheets
Dynamic Calculation members, applying styles to,
118
Dynamic Time Series
defined, 119
specifying latest time period, 120, 121
E
Edit Cell Note dialog box, 142
Edit menu, 37
Edit URL dialog box, 143
editing
cell notes, 141
linked files, 141
URLs, 143
A
B
C
D
E
F
G
H
I
K
L
M
Enable Hybrid Analysis option in Zoom page (Essbase
Options dialog box), 30
enabling
compatibility with Hyperion Smart View for Office,
28
Essbase toolbar, 23
FlashBack setting, 38
mouse actions, 27, 140, 146
Navigate Without Data, 50
Essbase
architecture, 12
Cascade Options dialog box, 151
connecting to. See connecting
Disconnect dialog box, 87
disconnecting from. See disconnecting
intended audience, 12
Member Selection dialog box, 81, 85
Member Selection dialog box, from Query
Designer, 70
menu, 23
migration information, 7
Options dialog box, 29, 91, 165
products of, 14
starting a session, 23
System Login dialog box, 34, 90
toolbar
described, 24
installing, 23
upgrades, 7
Essbase Application Programming Interface (API),
14
Essbase Integration Server drill-through. See drillthrough
EssCell function, 114
error messages, 116
syntax, 115
Excel
clearing formats, 37, 61
mouse actions, 27
sample tutorial files, 89
exchange rates, 155
Execute button, 178
executing drill-through reports, 173, 174
expanding data views. See drill down
expanding formulas when drilling, 109
external files, 133
N
O
P
Q
R
S
T
U
V
W
X
Z
F
files
accessing linked, 140
destinations, cascaded sheets, 152
linking to data cells, 134
sample for tutorial, 89
filtering data, 94
filters
in drill-through reports, 185
operators, 184
saving in drill-through reports, 186
Find Member dialog box, 82
finding members, 80, 82
FlashBack button, 25
FlashBack command, 37
font
formats, 56
style list, 56
Font dialog box, 56
forced logouts, 88
formatted sheets
pivoting in, 107
retrieving data into, 104
formatting
data cells
linked objects, 136, 146
read-only, 59
read/write, 59
dimension members, 57
displaying aliases, 61
displaying aliases and names, 62
Dynamic Calculation members, 118
enabling styles, 57
linked object cells, 136, 146
options for cascaded sheets, 153
parent members, 55
repeating member labels, 63
spreadsheets, 54
text and cell styles, 59
Formula Fill option, 109, 111
Formula Preservation mode
Formula Fill, 109
pivoting in, 108
restrictions with, 108, 109
Retain on Keep and Remove Only, 109
Retain on Retrieval, 106, 109
formulas
Index 193
A
B
C
D
E
F
G
H
I
K
L
M
EssCell, 114
expanding when drilling, 109
in cells, 104, 109
preservation
effects on other operations, 109
enabling, 106, 109
restrictions with, 108
free-form reporting
entering generation and level names in, 128
in Advanced Interpretation mode, 123
in Free-Form mode, 124
retrieving data, 122
Free-Form retrieval mode, 124
Free-Form retrieval mode guidelines, 125
functions. See macro functions
G
generations
defined, 18
entering names in spreadsheet, 128
Global page (Essbase Options dialog box), 27
H
Help buttons, 26
Help, accessing, 26
Hybrid Analysis, enabling in the Zoom page (Essbase
Options dialog box), 30
Hyperion Visual Explorer
creating a visual worksheet, 133
importing visual worksheet data into Excel, 133
logging into Essbase Server, 131
user interface described, 130
Visualize & Explore command, 131
I
in-cell editing, 27
installation, drill-through, 163
installation, toolbar, 23
Integration Server, 15, 161
Integration Server drill-through. See drill-through
Internet, linking cells to URLs, 138
Interntl sample database, 156
K
Keep Only button, 25
194 Index
N
O
P
Q
R
S
T
U
V
W
X
Z
Keep Only command
described, 47
in Formula Preservation mode, 109
L
labels
applying styles, 57
displaying with aliases, 62
entering in spreadsheet, 122, 124
member names. See member names
repeating, 63
Latest Time Period option, 120
latest time period, specifying, 119
levels
cascading by, 151
defined, 18
drilling down, 42
drilling in, 42
entering names, 128
linked objects
partitions. See linked partitions
reporting objects. See linked reporting objects
Linked Objects Browser dialog box, 144, 146, 173,
177
LROs, 134
Linked Objects command, 135, 137, 139
linked partitions
access privileges, 147
accessing from spreadsheet, 145
cells, applying styles, 146
Linked Reporting Objects
accessing from spreadsheet, 140
applying styles, 136
cell notes, 137
creating, 133
external files, 134
URLs, 138
linking
cell notes, 137
external files, 134
partitions, 145
URLs to data cells, 138
list, cascaded sheets, 154
Lock command, 147
locking data blocks, with multiple users, 147
logging
off of Essbase. See disconnecting
A
B
C
D
E
F
G
H
I
on to a relational data source, 177
on to Essbase. See connecting
on to Integration Server, 177
logging data updates from spreadsheet, 149
logical operators, 83
logouts, forced or auto, 88
M
macro functions
EssCell, 114
Spreadsheet Toolkit, 14, 26
main menu (Essbase), 23
manual calculation mode, 116
Member Information dialog box, 81
member names
aliases for, 61
alternate. See aliases
applying styles, 55
displaying with aliases, 62
entering in spreadsheet, 122, 124
formatted sheets, 104
indenting, 19
repeating, 63
with EssCell function, 115
Member Preview dialog box, 84, 85
Member Retention option, 42
Member Selection button, 26
Member Selection command, 81
Member Selection dialog box, 81
Member Selection Preview dialog box, 73
Member Selection, with Query Designer, 70
members
adding, 70
aliases for, 61
ancestors, 18
applying styles, 55, 57
children, 18
collapsing, 41
defined, 18
deleting, 49
descendants, 18
deselecting, 86
drilling down on, 38, 39
drilling up on, 41
Dynamic Calculation, 117
Dynamic Time Series, 119
finding, 80, 82
K
L
M
N
O
P
Q
R
S
T
U
V
W
X
Z
generations, 18
levels, 18
names. See member names
parents, 18
retaining, 47
selecting, 70, 80
siblings, 18
menu, Essbase, 23
messages (Essbase)
database calculation status, 150
display options, 108
EssCell, 116
unknown member, 106
metadata sampling, 103
migrating to current release, 7
missing values, suppressing, 53
disabled, 109
in cascaded sheets, 154
option unavailable, 109
Mode page (Essbase Options dialog box), 30, 93, 109
money. See currency conversions
mouse actions, enabling, 26
moving
rows and columns. See pivot
through worksheets, 49
multi-cell selection, with drill-through, 172
multidimensional databases. See databases
multiple cell selection, with drill-through, 172
multiple filter conditions, in drill-through reports,
184
N
names
alternate. See aliases
applying styles, 55
displaying with aliases, 62
entering generation, 128
entering level, 128
repeating, 63
Navigate With or Without Data button, 25
Navigate Without Data command, 49, 52
nested columns or rows, 38
networks, 13
Next Level option, 42, 151
nonadjacent cells, 48
notes, linking to data cells, 137
null values, 115
Index 195
A
B
C
D
E
F
G
H
I
numeric values, preserving, 105
O
ODBC clients, 14
OLAP
defined, 11
server. See server
online analytical processing, 11
online help
displaying for spreadsheet, 26
opening
Spreadsheet Add-in, 23
operators, comparison, 80, 96
options
Cascade, 151
Display, 29, 91, 165
Global, 27, 31, 93, 167
Mode, 30, 92, 109, 166
settings for advanced tutorial, 91
settings for basic tutorial, 29
settings for drill-through tutorial, 165
Style, 55
Zoom, 30, 42, 92, 165
Options button, 25
Options dialog box, 29, 165
OR operators, 80
Order By dialog box, 182
ordering
columns in drill-through reports, 179
rows in drill-through reports, 180
outlines
consolidations, 19
described, 17
dimensions, 17
Dynamic Calculation members, 117
Dynamic Time Series members, 119
members, 18
output, cascaded sheets, 151
overlapping styles, 60
P
parent members
applying styles to, 55
defined, 18
Partitioning product. See linked partitions
partitions. See linked partitions
196 Index
K
L
M
N
O
P
Q
R
S
T
U
V
W
X
passwords
changing, 35
entering, 90
pattern matching, 83
pivot
asymmetric reports and, 102
by dragging, 44
described, 27, 44
effect on text, 105
formatted sheets and, 107
formula preservation and, 108
rows or columns, 44, 103
unavailable, 105
without retrieving data, 50
Pivot command, 44
power loss, effect of abnormal shutdown, 88
preferences. See options
preserving formulas, 106, 112
primary mouse button, 26
printer destination, cascaded sheets, 152
programming interface, 14
Q
queries
applying, 76
applying styles, 76
creating, 68
defining, 67
deleting, 77
retrieving, 67
saving, 74
Query Designer
applying option settings, 79
connecting to multiple databases, 78
creating queries, 69
data filtering panel, 95
data sorting panel, 99
filtering data, 94
hint panel, 67
layout panel, 69
messages, 101
messages and confirmations, 77
navigation panel, 67
properties panel, 67
save as query dialog box, 74
sorting data, 99
Query Designer icon, 25
Z
A
B
C
D
E
F
G
H
I
K
L
R
read-only cells, 59
read/write cells, 59
registering Spreadsheet Add-in, 22
relational data source, 177
relational databases, accessing using drill-through,
161
remote databases . See linked partitions
Remove Only button, 25
Remove Only command
described, 49
in Formula Preservation mode, 109
Remove Unselected Groups option, 109
removing. See deleting
Repeat Member Labels option, 63
report script commands, 125, 127
reports
ad hoc, 35, 107
ad hoc currency, 157
asymmetric, 101
creating multiple, 150
formatted, 104
free-form, 122
saving, 87
reports, creating
ad hoc, 35, 157
Cascade, 150
Member Selection, 80
Query Designer, 67
reports, drill-through
accessing, 169
customizing, 162, 174
disconnecting from, 187
executing, 173
selecting to view or customize, 174
restoring database views, 37
restrictions, with Formula Preservation, 109
Retain on Keep and Remove Only option, 109
Retain on Retrieval option
disabled, 109
enabled, 106, 109
Retain on Zooms option, 109, 111
retaining
data subsets, 47
formulas, 104, 105
when drilling, 109
when retaining data, 109
M
N
O
P
Q
R
S
T
U
V
W
X
Z
when retrieving, 106, 109
selected members, 47
Retrieve & Lock command, 147
Retrieve button, 25
Retrieve command, 36
retrieving
Advanced Interpretation mode and, 123
canceling, 37
conditional, 94
currency conversion, 155
cursors, 36
data, 33
Dynamic Calculation members, 117
formula preservation and, 109
Free-Form mode and, 125
functions, 114
increasing speed, 60, 102, 112, 117
into asymmetric reports, 101
into columns, 39
into formatted sheets, 104
rules for, 105
into rows, 39
less detail, 41
modes, 122
more detail, 38
performance impact, 60, 102, 117
range of cells, 112
retaining formulas and, 106, 109
selected cells, 112
starting process and, 35
suppressing data and, 49
reverting to previous database view, 37
rows
blank, 104
deleting during pivot, 103
displaying as columns, 44
displaying selected, 47
filtering by, 95
keeping discontinuous, 48
nested, 38
pivoting, 44
removing selected, 49
retrieving into, 39
sorting within, 99
suppressing values in, 53, 154
Index 197
A
B
C
D
E
F
G
H
I
K
L
S
sample
databases
connecting to, 35, 156
described, 33, 155
in drill-through, 168
files for tutorial, location, 89
Sample Basic
connecting to, 35
described, 33
Sample Data (Zoom In) command, 103
Sample directory, 89
sampling, 103
Save As command, 87
Save command, 87
saving
drill-through filters, 186
queries, 74
worksheets, 87
saving queries, 74
secondary mouse button, 26
select (defined), 27
Select Calc Script option, 150
Select Columns and Display Order dialog box, 179
Select Data Filters dialog box, 183
Select Data Sort Order dialog box, 180
Select Drill-Through Report dialog box, 174, 178
Select Filter Values from the List dialog box, 184
selecting
cells to keep, 47
cells to remove, 49
latest time period, 119
members, 80
multiple cells, with drill-through, 172
nonadjacent cells, 48
range of cells for retrieval, 112
Send command, 148
sending
data to server, 147
log file, 149
server, 12
changing password, 35
client-server environment, 12
connecting to, 34, 90
described, 13
disconnecting from, 87
Essbase Integration Server, 161
198 Index
M
N
O
P
Q
R
S
T
U
V
W
X
Z
Essbase Integration Services, 15
Essbase Server, described, 13
logging updates to, 147
migrating to current release, with client, 7
name, 34, 90
on network, 13
sending data to, 147
Set Filter on Column dialog box, 183
shared members, applying styles to, 56
sheet destination, Cascade option, 152
sheets. See worksheets
shortcuts, mouse actions, 27
shortcuts, toolbar buttons, 24
shutdown, abnormal, 88
siblings (defined), 18
sort order
in drill-through, 180
in Query Designer, 99
sorting criteria, 94
Spreadsheet Add-in
accessing drill-through from, 169
compatibility with Hyperion Smart View for Office,
8, 28
installing toolbar, 23
logging data updates, 149
registering, 22
retrieval cursors, 36
starting, 23
users, described, 12
Spreadsheet Toolkit product, 14
spreadsheets
applying styles, 55
cascading, 150
creating multiple, 150
data update log file, 149
described, 16
displaying aliases, 61, 62
displaying member names, 62
distributing, 150
drilling options, 42
global options, 27, 38, 108
mode options, 109, 122
preserving formulas, 109
repeating member labels, 63
retrieving data, 33
saving, 87
setting options, 29
A
B
C
D
E
F
G
H
I
style options, 55
suppressing missing and zero values, 53
zoom options, 42
SQL Interface, 14
starting
data retrieval, 36
drill-through, 169
Essbase, 23
Spreadsheet Add-in, 23
status of database connections, 145
Style page (Essbase Options dialog box), 55
styles
applying
to data cells, 59
to dimension members, 57
to dimensions, 57
to drill-through cells, 169
to linked partition cells, 146
to linked reporting object cells, 136
to members, 55
to parent members, 55
to Query Designer results, 79
to shared members, 56
clearing, 61
defining, 55
hierarchy of, 60
overlapping, 60
removing, 60
selecting members, 56
stored in ESSBASE.INI, 58
turning off, 61
turning on, 57
Subset dialog box, 82, 84
subsets
defining members, 82
removing, 49
retaining, 47
substitution variables, 121, 122
suppressing
data retrieval, 49
missing and zero values, 53
option disabled, 109
underscore characters, 53
symmetric reports, 101
system administrator, 12
system failure, 88
K
L
M
N
O
P
Q
R
S
T
U
V
W
X
Z
T
table of contents, with Cascade, 154
TCP/IP protocol, 13
terminating database connections. See disconnecting
termination, abnormal, 88
text
entering free-form, 122
formatting, 56
hierarchy of styles, 60
pivoting. See pivot
preserving formatted, 105
time periods, 119
title members, with drill-down, 39
to-date calculations, specifying, 119
toolbar (Essbase), 26
buttons on, 24
installing, 23
tracking data updates, 149
transaction-level data, accessing with drill-through,
161
transparent partitions. See linked partitions
transport protocol, 13
tutorial
basic tasks, 21
guidelines, 32
preparing for, 28
U
underscore characters, suppressing, 54
Undo command. See FlashBack command
undoing actions, 37
Unlock command, 148
unlocking data blocks, 148
up-to-date calculations, 119
Update Mode, 148
updating
data, 147
log file, 149
upgrading, 7
URLs
accessing linked, 143
editing, 143
length limits, 139
linking to data cells, 138
Use Aliases option, 61
Use Both Member Names and Aliases option, 63
Use Sheet Options with Query Designer option, 79
Index 199
A
B
C
D
E
F
G
H
I
Use Styles option, 57
username, entering, 90
users, 12
V
V2.x mode, 125
viewing
active connections, 145
aliases, 61
aliases and names, 62
data in spreadsheet, 36
Dynamic Calculation members, 118
Essbase menu, 23
Essbase toolbar, 23
fewer members. See drill
linked partitions, 145
linked reporting objects, 140
more members. See drill
multidimensional data, 16
online help, 26
repeated member labels, 63
spreadsheet without data, 49
styles, 57
toolbar, 23
views, restoring, 37
visual cues. See styles
Visualize & Explore command, 131
W
Web resources, linking to data cells, 138
wildcard characters, 82
Windows NT Registry, changes to, 23
Within Selected Group option, 43, 101
worksheets
formatting, 54
navigating without data in, 49
World Wide Web, linking to data cells, 138
X
Xchgrate sample database, 156
Z
zero values
suppressing, 53, 54
suppressing options disabled, 109
200 Index
K
L
M
N
O
P
Q
R
S
T
U
V
W
X
Z
Zoom commands, customizing, 42
Zoom In button, 25
Zoom In command
drilling down options, 38
selecting levels, 42
Zoom Out button, 25
Zoom Out command, drilling up options, 41
Zoom page (Essbase Options dialog box), 30, 42
Enable Hybrid Analysis option, 30