1
Dell DR Series System
Administrator Guide
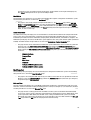
Notes, Cautions, and Warnings
NOTE: A NOTE indicates important information that helps you make better use of your computer.
CAUTION: A CAUTION indicates either potential damage to hardware or loss of data and tells you how to avoid the
problem.
WARNING: A WARNING indicates a potential for property damage, personal injury, or death.
© 2013 Dell Inc.
Trademarks used in this text: Dell™, the Dell logo, Dell Boomi™, Dell Precision™ , OptiPlex™, Latitude™, PowerEdge™, PowerVault™,
PowerConnect™, OpenManage™, EqualLogic™, Compellent™, KACE™, FlexAddress™, Force10™ and Vostro™ are trademarks of Dell
Inc. Intel®, Pentium®, Xeon®, Core® and Celeron® are registered trademarks of Intel Corporation in the U.S. and other countries. AMD®
is a registered trademark and AMD Opteron™, AMD Phenom™ and AMD Sempron™ are trademarks of Advanced Micro Devices, Inc.
Microsoft®, Windows®, Windows Server®, Internet Explorer®, MS-DOS®, Windows Vista® and Active Directory® are either trademarks
or registered trademarks of Microsoft Corporation in the United States and/or other countries. Red Hat® and Red Hat®
Enterprise Linux® are registered trademarks of Red Hat, Inc. in the United States and/or other countries. Novell® and SUSE® are
registered trademarks of Novell Inc. in the United States and other countries. Oracle® is a registered trademark of Oracle Corporation
and/or its affiliates. Citrix®, Xen®, XenServer® and XenMotion® are either registered trademarks or trademarks of Citrix Systems, Inc. in
the United States and/or other countries. VMware®, Virtual SMP®, vMotion®, vCenter® and vSphere® are registered trademarks or
trademarks of VMware, Inc. in the United States or other countries. IBM® is a registered trademark of International Business Machines
Corporation.
2013- 01
Rev. A04
Contents
Notes, Cautions, and Warnings...................................................................................................2
1 Introduction to the DR Series System......................................................................................9
About the DR Series System GUI Documentation....................................................................................................9
Other Information You May Need.............................................................................................................................9
Source Code Availability.........................................................................................................................................10
2 Understanding the DR Series System....................................................................................11
About the DR Series System...................................................................................................................................12
Drive and Available Physical Capacities................................................................................................................12
Internal Drive Capacity.....................................................................................................................................13
External Drive Capacity ...................................................................................................................................13
Data Storage Terminology and Concepts...............................................................................................................13
Data Deduplication and Compression..............................................................................................................16
Replication........................................................................................................................................................17
Reverse Replication.........................................................................................................................................18
Reverse Replication: Alternate Method...........................................................................................................19
Supported File System Protocols............................................................................................................................19
NFS...................................................................................................................................................................19
CIFS..................................................................................................................................................................20
CIFS ACL Support.............................................................................................................................................20
Access Control List Support in Containers......................................................................................................20
Existing Containers (Pre–1.1 Release).............................................................................................................21
Unix Permissions Guidelines............................................................................................................................22
Windows Permissions Guidelines....................................................................................................................22
OpenStorage Technology (OST): DR Series System...............................................................................................23
OpenStorage Technology (OST) API................................................................................................................24
Software Components and Operational Guidelines.........................................................................................25
DR Series System and Data Operations.................................................................................................................26
DR Series Expansion Shelf...............................................................................................................................27
Understanding About Adding a DR Series Expansion Shelf............................................................................28
Supported Software and Hardware........................................................................................................................28
Terminal Emulation Applications......................................................................................................................28
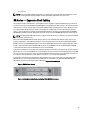
DR Series — Expansion Shelf Cabling...................................................................................................................29
Adding a DR Series System Expansion Shelf.........................................................................................................30
3 Setting Up the DR Series System...........................................................................................33
Interacting with the DR Series System...................................................................................................................33
Networking Preparations for the DR Series System........................................................................................33
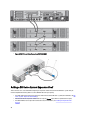
Connections for Initializing a DR Series System.....................................................................................................34
Initializing the DR Series System............................................................................................................................34
Default IP Address and Subnet Mask Address................................................................................................35
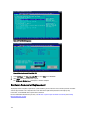
Local Console Connection................................................................................................................................36
iDRAC Connection............................................................................................................................................37
Logging in and Initializing the DR Series System.............................................................................................38
Accessing iDRAC6/iDRAC7 Using RACADM..........................................................................................................39
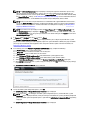
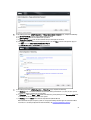
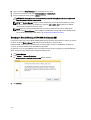
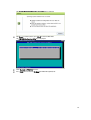
Logging in Using a Web Interface..........................................................................................................................39
Registering a DR Series System.......................................................................................................................44
Enabling Active Scripting in Windows IE Browsers........................................................................................45
Disabling the Compatibility View Settings........................................................................................................46
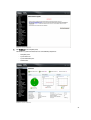
Dashboard Page and Options.................................................................................................................................46
Understanding the Dashboard Options............................................................................................................47
Displaying System Alerts.................................................................................................................................47
Events...............................................................................................................................................................47
Health...............................................................................................................................................................48
Usage...............................................................................................................................................................51
Viewing the Latest Range.................................................................................................................................51
Viewing a Specific Time Range........................................................................................................................52
System Usage...................................................................................................................................................52
Statistics: Container Page................................................................................................................................53
Statistics: Replication Page.............................................................................................................................57
Storage Page and Options......................................................................................................................................58
Understanding the Storage Options.................................................................................................................59
Containers........................................................................................................................................................59
Replication Page..............................................................................................................................................60
Compression Level...........................................................................................................................................60
Clients...............................................................................................................................................................60
About the Schedules Page and Options.................................................................................................................62
Setting a Replication Schedule........................................................................................................................62
Setting a Cleaner Schedule..............................................................................................................................63
About the System Configuration Page and Options...............................................................................................63
System Configuration Page and Options..........................................................................................................64
Understanding the System Configuration Page Options..................................................................................66
Support Page and Options......................................................................................................................................66
Understanding the Support Page Options........................................................................................................67
4 Configuring the DR Series System Settings..........................................................................71
Configuring Networking Settings............................................................................................................................71
Networking Page and Ethernet Port Values....................................................................................................74
Managing the DR Series System Password...........................................................................................................75
Modifying the System Password......................................................................................................................75
Resetting the Default System Password..........................................................................................................75
Shutting Down the DR Series System.....................................................................................................................76
Rebooting the DR Series System............................................................................................................................76
Configuring Compression Level Settings................................................................................................................76
Configuring Active Directory Settings....................................................................................................................77
Configuring Local Workgroup Users Settings........................................................................................................78
Configuring Email Alert Settings.............................................................................................................................79
Adding a Recipient Email Address...................................................................................................................79
Editing or Deleting a Recipient Email Address.................................................................................................79
Sending a Test Message..................................................................................................................................80
Configuring Administrator Contact Information.....................................................................................................80
Adding Administrator Contact Information......................................................................................................80
Editing Administrator Contact Information.......................................................................................................81
Configuring an Email Relay Host.............................................................................................................................81
Adding an Email Relay Host.............................................................................................................................81
Editing an Email Relay Host..............................................................................................................................82
Configuring System Date and Time Settings..........................................................................................................82
Editing System Date and Time Settings...........................................................................................................83
Creating Containers................................................................................................................................................84
Configuring Share-Level Security...........................................................................................................................84
5 Managing DR Series Storage Operations.............................................................................87
Managing Container Operations............................................................................................................................87
Creating Storage Containers............................................................................................................................87
Editing Container Settings................................................................................................................................90
Deleting Containers..........................................................................................................................................91
Moving Data into a Container..........................................................................................................................92
Displaying Container Statistics........................................................................................................................92
Managing Replication Operations..........................................................................................................................94
Creating Replication Relationships..................................................................................................................94
Editing Replication Relationships.....................................................................................................................96
Deleting Replication Relationships..................................................................................................................96
Starting and Stopping Replication...................................................................................................................96
Setting the Replication Bandwidth...................................................................................................................97
Displaying Replication Statistics......................................................................................................................97
Creating a Replication Schedule......................................................................................................................98
6 Monitoring the DR Series System........................................................................................101
Monitoring Operations Using the Dashboard Page..............................................................................................101
System Status Bar..........................................................................................................................................101
DR Series System and the Capacity-Storage Savings-Throughput Panes....................................................102
System Information Pane...............................................................................................................................102
Monitoring System Alerts.....................................................................................................................................103
Using the Dashboard Alerts Page..................................................................................................................103
Viewing the System Alerts.............................................................................................................................103
Monitoring System Events....................................................................................................................................104
Using the Dashboard to Display System Events............................................................................................104
Using the Dashboard Events Option...............................................................................................................105
Using the Event Filter......................................................................................................................................105
Monitoring System Health....................................................................................................................................106
Using the Dashboard Page to Monitor System Health..................................................................................106
Using the Dashboard Health Options.............................................................................................................107
Monitoring System Usage....................................................................................................................................108
Displaying Current System Usage..................................................................................................................109
Setting a Latest Range Value.........................................................................................................................109
Setting a Time Range Value ..........................................................................................................................109
Monitoring Container Statistics............................................................................................................................110
Displaying the Statistics: Container Page......................................................................................................110
Monitoring Replication Statistics.........................................................................................................................111
Displaying the Statistics: Replication Page....................................................................................................112
Displaying Replication Statistics Using the CLI.............................................................................................113
7 Using the DR Series System Support Options....................................................................115
Support Information Pane.....................................................................................................................................115
Diagnostics Page and Options..............................................................................................................................115
Generating a Diagnostics Log File .................................................................................................................116
Downloading Diagnostics Log Files...............................................................................................................117
Deleting a Diagnostics Log File......................................................................................................................118
DR Series System Software Upgrade...................................................................................................................118
Software Upgrade Page and Options...................................................................................................................118
Verifying the Current Software Version ........................................................................................................119
Upgrading the DR Series System Software...................................................................................................119
Restore Manager (RM).........................................................................................................................................120
Downloading the Restore Manager...............................................................................................................121
Creating the Restore Manager USB Key........................................................................................................121
Running the Restore Manager (RM)..............................................................................................................121
Resetting the Boot LUN Setting in H700 BIOS After Running RM..................................................................122
Hardware Removal or Replacement.....................................................................................................................124
DR Series System: Proper Shut Down and Start Up......................................................................................125
DR Series System NVRAM.............................................................................................................................125
8 Configuring and Using OST....................................................................................................127
Understanding OST...............................................................................................................................................127
OpenStorage Technology (OST) API....................................................................................................................128
OST Guidelines.....................................................................................................................................................129
OST Terminology...................................................................................................................................................129
Supported OST Software and Components..........................................................................................................130
Supported OST Software and Components...................................................................................................130
OST Required Configurations...............................................................................................................................131
Best Practices: OST and the DR Series System...................................................................................................131
Setting Client-Side Optimization...........................................................................................................................131
Configuring an LSU...............................................................................................................................................131
Installing a Dell OST Plug-In.................................................................................................................................132
Understanding the Dell OST Plug-In (Linux)...................................................................................................132
Understanding the Dell OST Plug-In (Windows)............................................................................................133
Installing the OST Plug-In for Backup Exec on Windows..............................................................................133
Installing the OST Plug-In for NetBackup on Windows.................................................................................134
Uninstalling the Dell OST Plug-In for Windows.............................................................................................134
Installing the OST Plug-In for NetBackup on Linux........................................................................................135
Uninstalling the Dell OST Plug-In for Linux....................................................................................................136
Configuring DR Series System Information Using NetBackup.............................................................................136
Using NetBackup CLI to Add DR Series System Name (Linux)......................................................................137
Using NetBackup CLI to Add DR Series System Name (Windows)...............................................................137
Configuring NetBackup for the DR Series System.........................................................................................137
Creating Disk Pools from LSUs.......................................................................................................................138
Creating Storage Units Using the Disk Pool...................................................................................................139
Backing Up Data from a DR Series System (NetBackup).....................................................................................139
Restoring Data from a DR Series System Using NetBackup.........................................................................139
Duplicating Backup Images Between DR Series Systems Using NetBackup...............................................140
Using Backup Exec with a DR Series System (Windows)....................................................................................140
OST Plug-In and Supported Versions.............................................................................................................140
Installation Prerequisites for the OST Plug-In for Backup Exec....................................................................141
Configuring the DR Series System Using the Backup Exec GUI....................................................................141
Creating Backups on the DR Series System Using Backup Exec..................................................................142
Optimizing Duplication Between DR Series Systems Using Backup Exec....................................................142
Restoring Data from a DR Series System Using Backup Exec......................................................................143
Understanding the OST CLI Commands................................................................................................................143
Supported DR Series System CLI Commands for OST...................................................................................144
Understanding OST Plug-In Diagnostic Logs.......................................................................................................145
Rotating OST Plug-In Logs for Windows........................................................................................................145
Collecting Diagnostics Using a Linux Utility.........................................................................................................145
Rotating OST Plug-In Logs for Linux...............................................................................................................146
Guidelines for Gathering Media Server Information............................................................................................146
NetBackup on Linux Media Servers..............................................................................................................146
NetBackup on Windows Media Servers........................................................................................................147
Backup Exec on Windows Media Servers.....................................................................................................147
9 Troubleshooting and Maintenance......................................................................................149
Troubleshooting Error Conditions.........................................................................................................................149
DR Series System Alert and Event Messages......................................................................................................150
About the Diagnostics Service.............................................................................................................................167
Understanding Diagnostics Collection...........................................................................................................168
About the DR Series System Maintenance Mode................................................................................................168
About the DR Series System Support Mode.........................................................................................................170
Scheduling DR Series System Operations............................................................................................................170
Creating a Cleaner Schedule................................................................................................................................171
Displaying Cleaner Statistics.........................................................................................................................172
10 Getting Help............................................................................................................................173
Before Contacting Dell Support............................................................................................................................173
Contacting Dell.....................................................................................................................................................174
11 Supported Ports in a DR Series System............................................................................175
Introduction to the DR Series System
1
The DR Series system documentation contains topics that explain how to use the Dell DR Series system to perform data
storage operations and manage storage and replication containers. The DR Series system topics introduce and describe
the DR Series system graphical user interface (GUI) that you can use to manage your backup and replication operations.
A comprehensive set of GUI-based procedures allow you to access all management features and capabilities using a
supported web browser. If any important administrative task or operation is not supported from the DR Series system
GUI, this guide provides and describes the corresponding command line interface (CLI) commands. For more information
about the DR Series system CLI commands, see the Dell DR Series System Command Line Reference Guide.
About the DR Series System GUI Documentation
The DR Series system documentation describes how to use the graphical user interface (GUI) and its menus, tabs, and
options to perform a wide variety of data storage operations, and to manage the related storage and replication
containers.
The documentation is written for an administrator end-user and introduces and provides procedures for using the DR
Series system GUI elements to easily manage your backup and deduplication operations. A comprehensive set of GUIbased procedures allow you to access all of the key management features and capabilities using a supported webbrowser.
If any important administrative task or operation is not supported from the DR Series system GUI, the documentation
provides and describes the corresponding DR Series system command line interface (CLI) commands.
NOTE: For information about the supported web browsers you can use with the DR Series system, see the Dell DR
Series System Interoperability Guide available at support.dell.com/manuals.
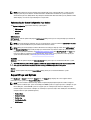
Other Information You May Need
WARNING: See the safety and regulatory information that shipped with your system. Warranty information may be
included within this document or as a separate document.
•
The Dell DR Series System Owner's Manual provides information about solution features, describes how to
troubleshoot the system, and how to install or replace DR Series system components. This document is available
at support.dell.com/manuals.
•
The Dell DR Series System Command Line Reference Guide provides information about managing DR Series
system data backup and replication operations using the DR Series system command line interface (CLI). This
document is available at support.dell.com/manuals.
•
The Dell DR Series System Getting Started Guide provides an overview of setting up your DR Series system, and
includes technical specifications. This document is available at support.dell.com/manuals.
•
The Setting Up Your Dell DR4100 System provides information about network, initial setup, and user account
settings needed to initialize the Dell DR4100 system. This document is available at support.dell.com/manuals
•
The Dell DR Series System Interoperability Guide provides information on the supported hardware and software
that can be used with the DR Series system. This document is available at support.dell.com/manuals.
•
The Dell PowerVault MD1200 and MD1220 Storage Enclosures Hardware Owner's Manual provides information
on the supported external data storage expansion shelf hardware (enclosures) that can be used with the DR
Series system. This document is available at support.dell.com/manuals
9
•
Any media that ships with your system that provides documentation and tools for configuring and managing your
system, including those pertaining to the operating system, system management software, system updates, and
system components that you purchased with your system.
NOTE: Always check for documentation updates on support.dell.com/manuals and read the documentation
updates first because they often supersede information in other documents, and contain the latest updated
versions of the documents.
NOTE: Always check for release notes on support.dell.com/manuals and read the release notes first because they
contain the most recently documented information about known issues with a specific product release.
Source Code Availability
A portion of the DR Series system software may contain or consist of open source software, which you can use under
the terms and conditions of the specific license under which the open source software is distributed.
Under certain open source software licenses, you are also entitled to obtain the corresponding source files. For more
information about this or to find the corresponding source files for respective programs, see the Dell
opensource.dell.com website.
10
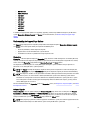
Understanding the DR Series System
2
The DR Series system is a high-performance, disk-based backup and recovery appliance that is simple to deploy and
manage, and offers unsurpassed Total Cost of Ownership benefits. Features such as innovative firmware and an allinclusive licensing model ensure optimal functionality and the assurance of no hidden costs for desired future features.
NOTE: Unless otherwise noted, later references to "the system" or "DR Series system" are used interchangeably to
represent the Dell DR Series system.
The DR Series system has a simple installation process with full, intuitive remote setup and management capabilities. It
is available in the following drive capacities—2.7 Terabytes (TB), 5.4 TB, 9 TB, 18 TB, and 27 TB (the 27 TB drive capacity
was added in Release 2.0), and is ideal for both small enterprise and remote office environments. The DR Series system
and corresponding drive capacities are as follows:
•
300 Gigabyte (GB) drive capacity: 2.7 TB system (this system version does not support the addition of expansion
shelf enclosures)
•
600 GB drive capacity: 5.4 TB system
•
1 TB drive capacity: 9 TB system
•
2 TB drive capacity: 18 TB system
•
3 TB drive capacity: 27 TB system
NOTE: To better understand the drive capacity and the available physical capacity for the drive types available in
the DR Series system, see Drive and Available Physical Capacities.
NOTE: Release 2.0 also supports using an external data storage expansion shelf (also known as expansion
enclosures). The DR Series system supports up to two expansion enclosures per system. An added expansion shelf
enclosure must be equal to or greater than each DR Series system internal drive slot capacity (0–11). For more
information about expansion enclosures, see Installing an Expansion Shelf License, DR Series System - Expansion
Shelf Cabling, and Expansion Shelf Licenses.
NOTE: The 300 Gigabyte (GB) drive capacity (2.7 TB) version of the DR Series system does not support the addition
of expansion shelf enclosures.
Using Dell deduplication and compression algorithm technology, this system can achieve data reduction levels ranging
from 10:1 to 50:1. This reduction in data results in less incremental storage needs and a smaller backup footprint. By
removing redundant data, the system provides deduplication and compression that delivers:
•
Fast, reliable backup and restore functionality
•
Reduces media usage and power and cooling requirements
•
Improves overall data protection and retention costs
The benefits of data deduplication can be extended across the enterprise—through the deduplicated replication
function—to provide a complete backup solution for multi-site environments.
The shorter Recovery Time Objectives (RTO) and more attainable Recovery Point Objectives (RPO) can also be assured
as critical backup data remains on disk and online longer. Capital and administrative costs are diminished at the same
time as internal service level agreements (SLAs) are more easily met.
The DR Series system includes the following:
•
Advanced data protection and disaster recovery
11
•
Simple management interface (using the system GUI)
•
Wide variety of data backup installations and environments
The Dell DR Series system contains data backup and management software preinstalled on a Dell hardware appliance,
which provides you with a robust disk-based data backup capability installed on a deduplication-enabled appliance.
The system supports two interface types, and the system software manages the storage containers using the following
interfaces:
•
A command line interface (CLI)
•
A graphical user interface (GUI)
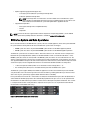
About the DR Series System
The Dell DR Series system is a solution designed to reduce your backup data footprint using a number of comprehensive
backup and deduplication operations that optimize storage savings. Collectively, the DR Series system comes in two
types:
•
DR4000 system: this is preinstalled DR4000 system software on a Dell R510 appliance platform
•
DR4100 system: this is preinstalled DR4000 system software on a Dell R720xd appliance platform
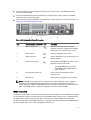
The DR Series system consists of the following components:
•
Software—the system software supports record linkage and context-based lossless data compression
methods.
•
Hardware—there are two appliance types that support the DR Series:
–
DR4000 system: includes twelve 3.5-inch SAS or Nearline SAS chassis drives that are hot-swappable,
two power supplies for power redundancy, and two cabled 2.5-inch SAS drives for the operating
system. The operating system is installed on two 2.5–inch internal drives that are in a RAID 1
configuration in the DR4000 system.
–
DR4100 system: includes twelve 3.5-inch SAS or Nearline SAS chassis drives that are hot-swappable,
two power supplies for power redundancy, and includes two 2.5-inch drives that are hot-pluggable in
the rear.
NOTE: For slot locations for the twelve 3.5–inch drives in the DR Series system types, see DR Series
System and Data Operations.
•
Expansion shelf—the system appliance supports the addition of up to two external Dell PowerVault MD1200
data storage expansion shelf enclosures. Adding an expansion shelf provides additional data storage for the DR
Series system and also requires a license. Each added expansion shelf enclosure must be equal to or greater
than each DR Series system internal drive slot capacity (0–11).
NOTE: The 300 Gigabyte (GB) drive capacity (2.7 TB) version of the DR Series system does not support the
addition of expansion shelf enclosures.
For more information, see Expansion Shelf Licenses. For more general information about the supported storage
enclosures, see “DR Series Expansion Shelf” in DR Series System and Data Operations, and support.dell.com/
manuals.
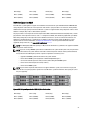
Drive and Available Physical Capacities
Table 1 defines the internal system drive capacity and available physical capacity (in decimal and binary values) in the
Release 1.0.1.2 and later releases of DR4000 system. Starting with the 2.0 release, the DR Series system comes in two
types:
•
12
DR4000 system—which consists of preinstalled DR4000 system software on an modified Dell R510 appliance
platform.
•
DR4100 system—which consists of preinstalled DR4000 system software on an modified Dell R720xd appliance
platform.
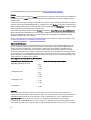
Internal Drive Capacity
The capacity values listed in Table 1 represent the internal drive and available physical capacities that have been
adjusted for the associated overhead in the DR4000/DR4100 system releases.
NOTE: In Table 1, the abbreviations TB and GB represents Terabytes and Gigabytes in decimal values, and the
abbreviation TiB represents Tebibytes in binary values. Tebibytes are a standards-based binary multiple of the
byte, a unit of digital information storage.
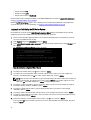
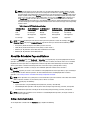
Table 1. Internal Drive Capacity and Available Physical Capacity
DR Series System Drive Capacity
Available Physical Capacity (Decimal)
Available Physical Capacity (Binary)
3 TB (DR4100 system only)
26.79 TB
23.8 TiB
2 TB
17.9 TB
15.9 TiB
1 TB
8.89 TB
7.9 TiB
600 GB
5.29 TB
4.6 TiB
300 GB
2.47 TB
2.2 TiB
For more general information about the external data storage capacity supported by the expansion shelf enclosures, see
the “DR Series Expansion Shelf” section in DR Series System and Data Operations.
External Drive Capacity
The capacity values listed in Table 2 represent the additional storage capacity in the external drives that are available
when you add the supported expansion shelf enclosures to a DR4000 or DR4100 system. Additional data storage can be
added using the expansion shelf enclosures in 1 Terabyte (TB), 2 TB, or 3 TB capacities. For more information on the
expansion shelf enclosures, see Adding a DR Series System Expansion Shelf, Installing an Expansion Shelf License, and
DR Series System - Expansion Shelf Cabling.
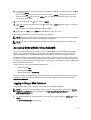
Table 2. External Drive Capacity and Available Physical Capacity
DR Series System Drive Capacity
Available Physical Capacity (Decimal)
Available Physical Capacity (Binary)
1 TB
8.89 TB
7.9 TiB
2 TB
17.89 TB
15.9 TiB
3 TB
26.79 TB
23.8 TiB
Data Storage Terminology and Concepts
This topic presents several key data storage terms and concepts that help you to better understand the role that the DR
Series system plays in meeting your data storage needs.
Data Deduplication and Compression: The DR Series system design draws upon a wide variety of data-reduction
technologies that include the use of advanced deduplication algorithms, in addition to the use of generic and custom
compression solutions that are effective across a large number of differing file types. The system uses a concept of
content-awareness where it analyzes data to better learn and understand the structure of your files and data types.
Once this is learned, it uses this method to improve your data reduction ratios while reducing resource consumption on
the host. The system uses block deduplication to address the increasing data growth, and this is well suited to providing
13
the best results for routine and repeated data backups of structured data. Block-level deduplication works efficiently
where there are multiple duplicate versions of the same file. This is because it looks at the actual sequence of the data–
the 0s and 1s–that comprise the data.
Whenever a document is repeatedly backed up, the 0s and 1s stay the same because the file is simply being duplicated.
The similarities between two files can be easily identified using block deduplication because the sequence of their 0s
and 1s remain exactly the same. In contrast to this, there are differences in online data. Online data has few exact
duplicates. Instead, online data files include files that may contain a lot of similarities between each file. For example, a
majority of files that contribute to increased data storage requirements come pre-compressed by their native
applications, such as:
•
Images and video (such as the JPEG, MPEG, TIFF, GIF, PNG formats)
•
Compound documents (such as .zip files, email, HTML, web pages, and PDFs)
•
Microsoft Office application documents (including PowerPoint, MS-Word, Excel, and SharePoint)
NOTE: The DR Series system experiences a reduced savings rate when the data it ingests is already
compression-enabled by the native data source. It is highly recommended that you disable data
compression used by the data source, and especially for first-time backups. For optimal savings, the native
data sources need to send data to the DR Series system in a raw state for ingestion.
Block deduplication is not as effective on existing compressed files due to the nature of file compression because its 0s
and 1s change from the original format. Data deduplication is a specialized form of data compression that eliminates a
lot of redundant data. The compression technique improves storage utilization, and it can be used in network data
transfers to reduce the number of bytes that must be sent across a link. Using deduplication, unique chunks of data, or
byte patterns, can be identified and stored during analysis. As the analysis continues, other chunks are compared to the
stored copy and when a match occurs, the redundant chunk is replaced with a small reference that points to its stored
chunk. This reduces the amount of data that must be stored or transferred, which contributes to network savings.
Network savings are achieved by the process of replicating data that has already undergone deduplication.
By contrast, standard file compression tools identify short repeated substrings inside individual files, with the intent of
storage-based data deduplication being to inspect large volumes of data and identify large amounts of data such as
entire files or large sections of files that are identical. Once this has been done, this process allows for the system to
store only one copy of the specific data. This copy will be additionally compressed using single-file compression
techniques. For example, there may be cases where an email system may contain 100 or more emails where the same 1
Megabyte (MB) file is sent as an attachment and the following shows how this is handled:
•
Without data deduplication, each time that email system is backed up, all 100 instances of the same attachment
are saved, which requires 100 MB of storage space.
•
With data deduplication, only one instance of the attachment is actually stored (all subsequent instances are
referenced back to the one saved copy), with the deduplication ratio being approximately 100 to 1). The unique
chunks of data that represent the attachment are deduplicated at the block chunking level.
NOTE: The DR Series system does not support deduplication of any encrypted data, so, there will be no
deduplication savings derived from ingesting encrypted data. The DR Series system cannot deduplicate
data that has already been encrypted because it considers that data to be unique, and as a result, cannot
deduplicate it.
In cases where self encrypting drives (SEDs) are used, when data is read by the backup application, it is decrypted by
the SED or the encryption layer. This works in the same way as if you were opening an MS-Word document that was
saved on a SED. This means that any data stored on a SED can be read and deduplicated. If you enable encryption in the
backup software, you will lose deduplication savings because each time the data is encrypted, the DR Series system
considers it to be unique.
Replication: Replication is the process by which the same key data is saved from multiple storage devices, with the goal
of maintaining consistency between redundant resources in data storage environments. Data replication improves the
level of fault-tolerance, which improves the reliability of maintaining saved data, and permits accessibility to the same
stored data. The DR Series system uses an active form of replication that lets you configure a primary-backup scheme.
14
During replication, the system processes data storage requests from a specified source to a specified destination (also
known as a target) that acts as a replica of the original source data.
NOTE: Starting with Release 2.0, the DR Series system software includes version checking that limits replication
only between other DR Series systems that run the same system software release version (DR Series systems
running Release 2.0.x software can only replicate with other DR Series systems that run the same release system
software). For example, Release 2.0.x systems will not be able to replicate with Release 2.1 or Release 3.0 systems,
but can replicate with systems running Release 2.0.0.1 or 2.0.0.2.
NOTE: It is important to distinguish the difference between data that has been processed by backup and data that
has been processed by replication, since backup saves a copy of data that remains unchanged for a long period of
time.
Targets with replica data are read-only, and are updated with new or unique data during scheduled or manual
replications. The DR Series system can be considered to act as a form of the storage replication where the backed up
and deduplicated data is replicated in real-time or via a scheduled window. In a replication relationship between two DR
Series systems, this means that a relationship exists between a pair of systems, one acting as the source and the other
as a target in the replication pair (for example, with acme-west and acme-east). When this type of replication
relationship exists between distinct containers on two distinct DR Series systems, it can be considered bidirectional in
the sense that:
•
West1 container on the acme-west source system can replicate data to a separate East1 container on the
acme-east target system.
•
The East2 container on the target acme-east system can also replicate data back to the West2 container on the
source acme-west system.
This form of replication involves separate containers on two distinct DR Series systems. Target containers in replication
must always act as read-only, while source containers can act as read-write. Unlike NFS and CIFS containers, OST
container replication is handled by the two supported Data Management Applications (DMAs) on media servers. For
details, see Understanding OST.
This release of the DR Series system supports the 32:1 replication of data, whereby up to 32 source DR Series systems
can write data to different individual containers on a single, target DR Series system. This supports the use case where
branch or regional offices can each write their own data to a separate, distinct container on a main corporate DR Series
system.
NOTE: Be aware that the storage capacity of the target DR Series system is directly affected by the number of
source systems writing to its containers, and by the amount being written by each of the source systems.
If the source and target systems in a replication pair reside in different Active Directory (AD) domains, then the data that
resides on the target DR Series system may not be accessible. When AD is used for authentication for DR Series
systems, the AD information is saved with the file. This can serve to restrict user access to the data based on the type of
AD permissions that are in place.
NOTE: This same authentication information is replicated to the target DR Series system when you have replication
configured. To prevent domain access issues, ensure that both the target and source systems reside in the same
Active Directory domain.
Reverse Replication: The concept of reverse replication is not supported on DR Series systems. This is because replica
containers are always in a R-O (read-only) mode on the DR Series system, thus making write operations a nonsupported operation. Under very specific conditions, it might be possible for replica containers to support a type of write
operation whose sole function is to restore data from an archival target. For example, data could be replicated back to
the remote site where a data management application (DMA), also known as backup software, is connected to allow
this data to be restored directly.
This specific case applies only to configurations where data is backed up from a remote location to a local container,
and then replicated over a WAN to a replica container that is backed up to tape. The data needs to be restored from the
15
tape backup to the original location; first, restore the data back to a DR Series system replica container, and then
restore it back to the original source location of the data on the other side of the WAN link.
NOTE: If you choose to use this alternate workaround method, you must set up a new data storage unit in the DMA
and import the images before a restore to the original location can occur.
To support this effort to leverage deduplication across the WAN to allow this scenario, complete the following:
1. Make sure that the replication operation has completed (between source and target).
2. Delete current replication relationship, and re-create replication relationship (reversing the source and target
roles).
3. Restore data to the original source container (now the target).
4. Make sure that the replication operation has completed.
5. Delete replication relationship and re-create replication relationship (restoring original source and target
destinations).
Under this scenario, a fraction of the data to be recovered is sent across the WAN link. This could speed up a remote
restore significantly. However, there are some downsides to this type of scenario:
•
If step 1 is not followed correctly, any changes not fully replicated are lost.
•
During steps 2 and 3, any data that is written to the original DR Series system source container may be lost.
•
During step 4, if the data is not fully replicated back before the switch is made, it may be lost.
Alternatively, you still could support this effort by completing the following:
1. Create a new container on the target DR Series system.
2. Set up replication from this container back to the source DR Series system container.
3. Set up a new disk storage unit in the DMA and make sure that the DMA is aware of any new images.
4. Import the old images back into the DMA from the target DR Series system (the original source location).
5. Use a new disk storage unit in the DMA, and then restore the data back to the original client.
Data Deduplication and Compression
The DR Series system design uses a variety of data-reduction technologies, including advanced deduplication
algorithms, in addition to the generic and custom compression solutions that prove effective across a large number of
differing file types. Data deduplication and compression is addressed in the following areas:
•
DR4000/DR4100: these DR Series system backup and recovery appliances provide both efficient and highperformance disk-based data protection to leverage the advanced deduplication and compression capabilities
in the DR Series system software. Based on technology that is now part of the Dell Fluid Data Architecture, the
DR Series systems provide a key component that performs backup, recovery, and data protection operations.
•
Deduplication: this technology eliminates redundant copies of data and in the process it decreases disk
capacity requirements and reduces the bandwidth needed for data transfer. Deduplication can be a major asset
for companies that are dealing with increasing data volumes and require a means for optimizing their data
protection.
•
Compression: this technology reduces the size of data that needs to be stored, protected, and transmitted.
Compression helps companies improve their backup and recovery times while helping reduce infrastructure and
network resource constraints.
In general, DR Series systems (DR4000 and DR4100) are disk-based data protection appliances that offer advanced
deduplication and compression capabilities to reduce the time and cost associated with backing up and restoring data.
Based on deduplication and compression technology, the DR Series systems eliminate the need to maintain multiple
copies of the same data. This lets customers keep more data online longer and reduce the need for tape backup
dependency.
16
Using its deduplication and compression technology, DR Series systems can help achieve an expected data reduction
ratio of 15:1. Achieving this reduction in data means that you need fewer incremental storage operations to run and it
provides you with a smaller backup footprint. By removing redundant data, DR Series systems deliver fast reliable
backup and restore functionality, reduce media usage and power and cooling requirements, and improve your overall
data protection and retention costs.
You can extend the benefits of data deduplication across the enterprise as well–using the DR Series system
deduplication replication function–to provide a complete backup solution for multi-site environments. With 32:1
deduplicated replication, up to 32 nodes can be replicated simultaneously to separate, individual containers on one
node. The DR Series systems use compression with replication to shrink the data that is needed to be moved across the
wire to a container.
Replication can be scheduled based on your settings to occur during non-peak periods. The replication schedule you
create can be set and prioritized to ingest data over replication data to ensure the most optimal back up windows based
on your needs. The DR Series systems are Symantec OpenStorage Technology (OST) certified to provide tight
integration with its NetBackup and Backup Exec DMA products to allow them to control when backup images are
created, compressed, duplicated, and deleted, so that customers using these products can leverage the DR Series
system appliance as a disk.
The DR Series systems also provide seamless integration with a number of data management applications (DMA),
including CommVault replicated disk libraries, IBM Tivoli Storage Manager (TSM), EMC Networker, ARCserve, and
Veeam backup software applications. Ideal for both small-sized and medium-sized companies as well as remote offices,
the DR Series system provides data deduplication and compression support for four data capacity points: 35 Terabytes
(TB), 70 TB, 130 TB, or 270 TB.
NOTE: For a complete list of supported DMAs in the 2.0 release of the DR Series system, see the Dell DR Series
System Interoperability Guide for details.
NOTE: The DR Series system does not support deduplication of any encrypted data. So, there will be no
deduplication savings derived from ingesting encrypted data. The DR Series system cannot deduplicate data that
has already been encrypted because it considers that data to be unique, and as a result, it cannot deduplicate it.
Replication
Replication is the process by which the same key data is saved from multiple storage locations, with the goal being to
maintain its consistency between redundant resources in data storage environments. Data replication improves the
level of fault-tolerance, which improves the reliability of maintaining saved data, and permits accessibility to the same
stored data. The DR Series system uses an active form of replication that lets you configure a primary-backup scheme.
During replication, the system processes data storage requests from a specified source to a specified destination (also
known as a target) that acts as a replica of the original source data.
NOTE: Starting with Release 2.0, the DR Series system software includes version checking that limits replication
only between other DR Series systems that run the same system software release version (DR Series systems
running Release 2.0.x software can only replicate with other DR Series systems that run the same release system
software). For example, Release 2.0.x systems will not be able to replicate with Release 2.1 or Release 3.0 systems,
but can replicate with systems running Release 2.0.0.1 or 2.0.0.2.
NOTE: It is important to distinguish the difference between data that has been processed by backup, and data that
has been processed by replication. This is because backup saves a copy of data that generally remains unchanged
for a long period of time.
Targets with replication data are read-only, and are updated with new or unique data during scheduled or manual
replications. The DR Series system can be considered to act as a form of a storage replication process in which the
backup and deduplication data is replicated in real-time or via a scheduled window in a network environment. In a
replication relationship between two DR Series systems, this means that a relationship exists between a pair of systems.
17
One system acts as the source and the other as a target in this replication pair (for example, acme-west and acme-east).
When this type of relationship exists between distinct containers on two distinct DR Series systems, it can be
considered bidirectional in the sense that:
•
The West1 container on the acme-west source system can replicate data to a separate East1 container on the
acme-east target system.
•
The East2 container on the target acme-east system can also replicate data back to the West2 container on the
source acme-west system.
This form of replication involves separate containers on two distinct DR Series systems. Target containers in replication
must always act as read-only, while sources containers can act as read-write. Unlike NFS and CIFS containers, OST
container replication is handled by the supported Data Management Applications (DMAs) on the corresponding media
servers. For details, see Understanding OST.
The DR Series system supports the 32:1 replication of data, whereby up to 32 source DR Series systems can write data
to different individual containers on a single, target DR Series system. This supports the use case where branch or
regional offices can each write their own data to a separate, distinct container on a main corporate DR Series system.
NOTE: Be aware that the storage capacity of the target DR Series system is directly affected by the number of
source systems writing to its containers, and by the amount being written by each of the source systems.
However, if the source and target systems in a replication pair are in different Active Directory (AD) domains, then the
data that resides on the target system may not be accessible. When AD is used to perform authentication for DR Series
systems, the AD information is saved with the file. This can act to restrict user access to the data based on the type of
AD permissions that are in place.
NOTE: This same authentication information is replicated to the target DR Series system when you have replication
configured. To prevent domain access issues, ensure that both the target and source systems reside in the same
Active Directory domain.
Reverse Replication
The concept of reverse replication is not a supported operation on DR Series systems. This is because replica
containers are always in a R-O (read-only) mode on the DR Series system, thus making write operations a nonsupported operation.
Under very specific conditions, it might be possible for replica containers to support a type of write operation whose
sole function is to restore data from an archival target. For example, data could be replicated back to the remote site
where a data management application (DMA), or backup software, is connected to allow this data to be restored
directly.
This specific type of case applies only to configurations where data is backed up from a remote location to a local
container, and then replicated over a WAN to a replica container that is backed up to tape. The data needs to be
restored from the tape backup to the original location; first back to a DR Series system replica container, and then back
to the original source location of the data on the other side of the WAN link.
NOTE: If you choose to use this alternate workaround method, you must set up a new data storage unit in the DMA,
and import the images before a restore to the original location can occur.
To leverage this type of deduplication across the WAN, complete the following:
1.
Make sure that the replication operation has completed (between source and target).
2.
Delete the current replication relationship, and re-create a replication relationship (reversing the source and target
roles).
3.
Restore data to the original source container (now the target).
4.
Make sure that the replication operation has completed.
18
5.
Delete the replication relationship and re-create a replication relationship (restoring original source and target
destinations).
Under this scenario, a fraction of the data to be recovered is sent across the WAN link. This could speed up a remote
restore significantly. However, there are some downsides to this type of scenario:
•
•
•
If step 1 is not followed correctly, any changes not fully replicated are lost.
During steps 2 and 3, any data that is written to the original DR Series system source container may be lost.
During step 4, if the data is not fully replicated back before the switch is made, it may be lost.
Alternatively, you could still support this type of effort by completing the following:
1. Create a new container on the target DR Series system.
2. Set up replication from this container back to the source DR Series system container.
3. Set up a new disk storage unit in the DMA and make sure that the DMA is aware of any new images.
4. Import the old images back into the DMA from the target DR Series system (the original source location).
5. Use a new disk storage unit in the DMA, and then restore the data back to the original client.
Reverse Replication: Alternate Method
To support an alternate method of reverse replication, complete the following:
1.
Create a new container on the target DR Series system.
2.
Set up replication from this container back to the source DR Series system container.
3.
Set up a new disk storage unit in the DMA and make sure that the DMA is aware of any new images.
4.
Import the old images back into the DMA from the target DR Series system (the original source location).
5.
Use a new disk storage unit in the DMA, and then restore the data back to the original client.
Supported File System Protocols
The DR Series system supports the following file system protocols:
•
•
•
Network File System (NFS)
Common Internet File System (CIFS)
OpenStorage Technology (OST)
NOTE: The DR Series system supports three container connection types: NFS, CIFS, and OST. OST provides a
logical disk interface that can be used with network storage devices to store data and support data storage
operations.
For more information on OST, see Understanding OST, Creating an OST Connection Type Container, and Creating an NSF
or CIFS Connection Type Container.
For more information on NFS and CIFS, see NFS, and CIFS.
NFS
The Network File System (NFS) is a file system protocol that is designated to be a file server standard, and its protocol
uses the Remote Procedure Call (RPC) method of communication between computers. Clients can access files via the
network similar to the way that local storage is accessed.
NFS is a client-server application in which a client can view, store, and update files on a remote system just like they are
working on a local system. System or Network Administrators can mount all or a portion of a file system, and the file
19
system (or portion) that is mounted can be accessed using the privileges assigned to each file. The NFS protocol
supports Unix, Macintosh, OpenVMS, and the Microsoft Windows operating systems.
CIFS
The Common Internet File System (CIFS) remote file access protocol is one supported by the DR Series system, and is
also known as a Server Message Block (SMB). SMB occurs more commonly than the Network File System (NFS)
protocol on systems that run the Microsoft Windows operating system. CIFS allows programs to request files or services
on remote computers.
CIFS also uses the client-server programming model, whereby the client requests access to a file or passes a message
to a program running on the server. Servers review all requested actions and return a response. CIFS is a public (or
open) variation of the SMB that was originally developed and used by Microsoft.
NOTE: The DR Series system does not currently support the Server Message Block (SMB), version 2.0.
NOTE: For details on CIFS feature restrictions, see the Dell DR Series System Interoperability Guide, at
support.dell.com/manuals.
CIFS ACL Support
Starting with the DR4000 system Release 1.1, the DR Series system software supports the use of access control lists
(ACLs) for CIFS and share-level permissions. By definition, an ACL is simply a list of permissions that can be associated
with any network resource.
Each ACL can contain access control entries (ACEs) that define or describe the permissions for an individual user or a
group of users. An ACL can consist of zero (meaning that all users have access) or a number of ACEs that define specific
permissions on a per-user or per-group basis.
NOTE: If an ACE list is empty (meaning that it contains zero entries), this means that all access requests will be
granted.
An ACL describes the entities that are allowed to access a specific resource. ACLs are a built-in access control
mechanism in the Windows operating systems. The ACL support in the DR Series system is differentiated by how it
affects the following two container types:
•
New containers
•
Existing containers
NOTE: The DR Series system supports setting up share-level permissions for a CIFS share using a Microsoft
Windows administrative tool. Share-level permissions let you control access to shares. For more information, see
Configuring Share-Level Security.
NOTE: Any user that is part of BUILTIN\Administrators can edit ACLs on CIFS shares. The local DR Series system
administrator is included in the BUILTIN\Administrators group. To add additional domain groups to the BUILTIN
\Administrators group, you can use the Computer Manager tool on a Windows client to connect to the DR Series
system as Domain administrator and add any groups you want. This capability allows users other than the Domain
administrator to modify an ACL as needed.
Access Control List Support in Containers
All containers created with the 1.1 release and later versions of the DR4000 system software (or pre–1.1 version system
software that was upgraded to 1.1 or later), applies a default Access Control List (ACL) at the root of the container. This
20
default ACL is the same as that which would be created by a Microsoft Windows 2003 Server. Therefore, these new
containers with the default ACL support the following permission types:
NOTE: Any user that is part of BUILTIN\Administrators can edit ACLs on CIFS shares. The local DR Series system
administrator is included in the BUILTIN\Administrators group. To add additional domain groups to the BUILTIN
\Administrators group, you can use the Computer Manager tool on a Windows client to connect to the DR Series
system as Domain administrator and add any groups you want. This capability allows users other than the Domain
administrator to modify an ACL as needed.
•
•
•
•
•
•
•
BUILTIN\Administrators:
–
Allows: full access, object inherit, and container inherit.
–
Applies to: this folder, subfolders, and files.
CREATOR OWNER:
–
Allows: full access, inherit only, object inherit, and container inherit.
–
Applies to: subfolders and files only.
EVERYONE:
–
Allows: traverse folders, execute files, list folders, read data, read attributes, and read extended
attributes.
–
Applies to: this folder only.
NT AUTHORITY\SYSTEM:
–
Allows: full access, object inherit, and container inherit.
–
Applies to: this folder, subfolders, and files.
BUILTIN\Users:
–
Allows: create folders and append data, inherit-only, and container inherit.
–
Applies to: this folder, subfolders, and files.
BUILTIN\Users:
–
Allows: read and execute, and container inherit.
–
Applies to: this folder, subfolders, and files.
BUILTIN\Users:
–
Allows: create files and write data, object inherit, and container inherit.
–
Applies to: subfolders only.
NOTE: If these permissions are unsuitable for your needs, you can modify the default ACL to suit your own
requirement using the Windows ACL Editor (for example, using Properties → Security from Windows Explorer).
NOTE: Beginning with the 1.1 release, the system does not understand the Owner Rights permission and sets the
owner of new files/folders created by the Domain Administrators as DOM\Administrator rather than as BUILTIN
\Administrators.
Existing Containers (Pre–1.1 Release)
Starting with Release 1.1, the DR Series system software supports the use of access control lists (ACLs) for CIFS and
share-level permissions. An ACL is a list of permissions that can be associated with any resource. Each ACL can contain
access control entries (ACEs) that define or describe the permissions for an individual user or a group of users. An ACL
can consist of zero (all access) or a number of ACEs that define specific permissions on an per-user or per-group basis.
21
For any existing containers that were created prior to Release 1.1, all files are accessible to any user that logs in to the
designated DR Series system. The associated ACL in these existing pre–1.1 release containers support only the
following permissions:
•
Everyone:
•
– Allows: Full Access
– Applies to: This folder, subfolders, and files
BUILTIN\Administrators:
–
–
Allows: Full Access, Object Inherit, and Container Inherit
Applies to: This folder, subfolders, and files
However, you can also apply your own ACLs to existing containers if desired. You can do this by navigating to the root of
the share for the designated container, and then flow an ACL down the directory tree. Be aware that the time required
for this to complete is dependent upon the number of files and folders that reside in the container.
If you create local users, they will be added to BUILTIN\Users. Because the administrator account is a member of
BUILTIN\Administrators, if you do experience any problems with ACLs on a container (for example, an ACL was applied
that locks themselves or domain administrators out), you can connect via a client as MACHINE\Administrator.
At this point, you can edit the ACL (the BUILTIN\Administrators account has TakeOwnership privilege). Be aware that
large ACLs can consume additional inodes on the container, which can cause problems if there are a large number of
files and folders in the container. Small ACLs (with up to 10 ACEs) can reside in the spare space in the inode, while
larger ones can consume an additional inode. Inodes functions as data structures on a Linux (or Unix-like operating
system) filesystem where all the information about a file except its name and its actual data are stored.
NOTE: Dell recommends that administrators apply a set of permissions to existing containers that are similar to the
way defaults are set for new containers. However, careful consideration needs to be given about granting access
that addresses any specific security needs for individual users.
Unix Permissions Guidelines
For a user to create, delete, or rename a file or a directory requires Write access to the parent directory that contains
these files. Only the owner of a file (or the root user) can change permissions.
Permissions are based on the user IDs (UIDs) for the file Owner and group IDs (GIDs) for the primary Group. Files have
owner IDs and group owner IDs. To enable Unix access, the DR Series system supports three levels of users:
•
•
•
Owner (of the file)
Group (group in which the owner belongs)
Other (other users with an account on the system)
Each of these three user types support the following access permissions:
•
•
•
Read (read access that allows user to read files)
Write (write access that allows user to create or write to a file)
Execute (access that allows user to execute files or traverse directories in the filesystem)
NOTE: A root user has all levels of permission access, and a user can be a member of a single group or of multiple
groups (up to 32 groups are allowed in Unix).
Windows Permissions Guidelines
To enable Windows access, the DR Series system supports access control lists (ACLs) that contain zero or more access
control entries (ACEs), and an empty ACE list grants all access requests. The Windows New Technology File System
22
(NTFS) uses ACLs as part of the security descriptor (SD) process, which requires permissions to access such filesystem
objects as files and directories. ACLs support two levels of users:
•
Owners
•
Groups
Both Owners and Groups have Security IDs (SIDs) that define and identify an object owner or the group owning an
object. ACEs in an ACL consist of a SID, a specific permission that either allows or denies access and also defines
which of the following inheritance settings apply:
•
IO—inherit-only: not used for access checking.
•
OI—object inherit: new files get this ACE added.
•
CI—container inherit: new directories get this ACE added.
Windows NTFS ACLs include the following read, write, append, execute, and delete permissions that allow users to:
•
Synchronize access
•
Read data or list the directory
•
Write data or add a file
•
Append data or add a folder
•
Read Extended Attributes (EAs)
•
Write EAs
•
Execute file or traverse folders
•
Delete child or delete folders
•
Delete a file
The Owner user type has two default permissions:
•
Write discretionary ACL
•
Read control
OpenStorage Technology (OST): DR Series System
OpenStorage Technology (OST), was developed by Symantec and provides a logical disk interface for use with network
storage devices. The DR Series system appliance can use OST via plug-in software to integrate its data storage
operations with a number of data management applications (DMAs).
OST allows for better coordination and integration between DR Series system backup, restore, and optimized duplication
operations and the following supported DMA types:
•
NetBackup
•
Backup Exec
Integration is done via a Dell OST plug-in developed for the DR Series system, through which NetBackup and Backup
Exec can control when the backup images are created, duplicated, and deleted. The major benefit of OST is that it
allows the deduplication and compression operations to happen on the client-side so that network traffic can be
reduced.
OST via the Dell OST plug-in allows NetBackup and Backup Exec to take full advantage of such DR Series system
features as data deduplication, replication, and energy efficiency. DR Series systems can access the OpenStorage API
code through the plug-in, which can be installed on the media server platform choice you make (Windows or Linux). The
OST protocol allows the supported backup applications to communicate directly with the DR Series system and
determine whether a specific chunk of data already exists on the system. This process means that if the data already
23
exists, only the pointers need to be updated on the DR Series system, and the duplicate chunk of data does not need to
be transferred to the system. This process provides two benefits: it improves the overall backup speed, and also reduces
the network load.
When OST is used with the DR Series system, it offers the following benefits:
•
•
•
•
OST protocol provides faster and improved data transfers:
–
Focused on backups with minimal overhead
–
Accommodates larger data transfer sizes
–
Provides throughput that is significantly better than CIFS or NFS
OST and DMA integration:
–
OpenStorage API enables the DMA-to-media server software communications
–
DR Series system storage capabilities can be used without extensive changes to DMAs
–
Backup and replication operations are simplified by using built-in DMA policies
DR Series System and OST:
–
Control channel uses TCP port 10011
–
Data channel uses TCP port 11000
–
Optimized write operations enable client-side deduplication
Replication operations between DR Series systems:
–
No configuration required on source or target DR Series systems
–
Replication is file-based, not container-based
–
Triggered by DMA optimized duplication operation
–
DR Series system transfers the data file (not the media server)
–
After duplication, DR Series system notifies DMA to update its catalog (acknowledging the second
backup)
–
Supports different retention policies between source and replica
NOTE: This capability to use OST, also known as DR Rapid Data Access within Dell, adds tighter integration with
backup software applications, such as the two Symantec OpenStorage-enabled backup applications supported in
this release: NetBackup and Backup Exec.
OpenStorage Technology (OST) API
The OpenStorage Technology (OST) API is an application programming interface that allows disk-based devices like the
DR Series system to natively integrate with the two supported Symantec Data Management Applications (DMA),
NetBackup and Backup Exec. For example, because the DR Series system supports both data deduplication and
replication, the OST API allows these supported DMAs to use the DR Series system appliance features and duplicate the
optimized data from one storage appliance to another.
The OST API enables the writing of data to disk and is illustrated in the following example where NetBackup (the DMA)
interacts with the DR Series system (the data backup and deduplication device) using the OST API:
24
•
NetBackup needs to store a file to disk. To do this it notifies the DR Series system via the OST API which file it
needs to backup and what to name this file.
•
DR Series system accepts this file, backs it up, and stores it in its filesystem.
•
NetBackup can perform one of three subsequent operations with this specific stored file:
–
Expire it
–
Restore from it
–
Copy or duplicate it
•
If NetBackup, using the OST API, directs the DR Series system to expire a stored file, it deletes it from its
filesystem.
•
Similarly, if NetBackup, using the OST API, wants to restore from a stored file, it directs the DR Series system
which file to restore, which then delivers the stored file to NetBackup for the restore.
NOTE: OST contains a feature called optimized duplication. For example, in optimized duplication, the DMA
(NetBackup) directs device A to perform an optimized duplication with device B. Device A and B communicate and
determine which data segments of the file need to be replicated from A to B for device B to ensure that device B
contains a full and complete duplicate data file. Once successful, the DMA now knows about both copies of this
data file, and can use this file on device B as it would any other data file that resides there.
Software Components and Operational Guidelines
To better coordinate and integrate OpenStorage Technology (OST) with the DR Series system data storage operations,
the following guidelines list the supported software, required components, optimal performance, and supported
operations:
•
•
OST Media Server Component:
–
An OST server component resides on the DR Series system
–
For Linux media server installations, use the Linux OST plug-in and the Red Hat Package Manager (RPM)
installer
–
For Windows media server installations, use the Windows OST plug-in and the Microsoft (MSI) installer
Supported Windows-based OST plug-in releases:
NOTE: The DR Series system supports both the 32–bit and 64–bit versions for NetBackup, and the 64–bit
version for Backup Exec.
•
•
•
–
Windows 2003
–
Windows 2008
–
Windows 2008 Release 2
Supported Linux-based 64-bit OST plug-in releases:
–
Red Hat Enterprise Linux (RHEL), version 5.x
–
RHEL, version 6.x
–
SUSE, version 10 and 11
Supported Symantec OpenStorage (OST) protocol:
–
Symantec, version 9
–
Symantec, version 10
Supported Symantec DMAs:
–
NetBackup: version 7.1 (Windows 2003, 32–bit), 7.1 (Windows 2008 R2, 64–bit), 7.5 (Windows 2008, 32–
bit), 7.5 (Windows 2008 R2, 64–bit), 7.1 (RHEL 5.x, 64–bit), and 7.5(SLES11 SP2, 64–bit).
–
Backup Exec: version 2010 Release 3 (Windows 2008 R2, 64–bit), and 2012 (Windows 2008 R2, 64–bit).
NOTE: The Dell DR Series system licensing is all-inclusive, so that no additional Dell licensing is
required to use OST or the optimized duplication capability. The Dell OST plug-in that gets installed
on a supported Linux or Windows media server platform is a free download from Dell. However,
Symantec NetBackup requires that you purchase a Symantec OpenStorage Disk Option license.
Similarly, Symantec Backup Exec requires that you purchase the Deduplication Option to enable
the OST feature.
•
Backup, restore, and optimized duplication operations need to be performed via the OST plug-in
25
•
Optimal supported aggregated throughput rates:
–
3 Terabytes per hour (TB/hr) for passthrough write operations
–
4 TB/hr for optimized write operations
NOTE: Passthrough writes are when data is sent from a media server to the DR Series system
without applying any optimization to the data. By contrast, optimized writes are when data is sent
from a media server to the DR Series system after optimization is applied to the data.
•
Supported OST operations
–
Backup (Passthrough writes and Optimized writes)
–
Restore
–
Replication
NOTE: To check for the latest supported OST software components and operating guidelines, see the Dell DR
Series System Interoperability Guide. This document is available at support.dell.com/manuals.
DR Series System and Data Operations
Data is stored and resides on the Dell DR Series system, a two-rack unit (RU) appliance, which comes preinstalled with
the system software. Starting with the 2.0 release. the DR Series system comes in two types:
•
DR4000 system: this consists of preinstalled DR4000 system software on a Dell R510 appliance platform.
•
DR4100 system: this consists of preinstalled DR4000 system software on a Dell R720xd appliance platform.
The DR Series system consists of a total of 14 drives. Two of these drives are 2.5–inch drives that are configured as a
Redundant Array of Independent Disks (RAID) 1 on the RAID Controller and this is considered to be volume 1. In the
DR4000 system, these drives are internal, while in the DR4100 system, these drives are accessible from the rear. The
data that is being backed up is stored on the 12 virtual disks that reside on the DR Series system appliance. This release
also supported additional storage in the form of external expansion shelf enclosures (see the DR Series Expansion Shelf
section in this topic). The hot-swappable data drives that are attached to the RAID controller are configured as:
•
11 drives that operate as RAID 6, which act as virtual-disks for data storage (drives 1–11).
•
The remaining drive (drive 0) acts as the dedicated hot-spare drive for RAID 6 for the system.
The DR Series system supports RAID 6, which allows the appliance to continue read and write requests to the RAID
array virtual disks even in the event of up to two concurrent disk failures, providing protection to your mission-critical
data. In this way, the system design supports double-data drive failure survivability.
If the system detects that one of the 11 virtual drives has failed, then the dedicated hot spare (drive slot 0) becomes an
active member of the RAID group. Data is then automatically copied to the hot spare as it acts as the replacement for
the failed drive. The dedicated hot spare remains inactive until it is called upon to replaced a failed drive. This scenario
is usually encountered when a faulty data drive is replaced. The hot spare can act as replacement for both internal
mirrored drives and the RAID 6 drive arrays.
Figure 1. DR4000/DR4100 System Drive Slot Locations
26
Drive 0 (top)
Drive 3 (top)
Drive 6 (top)
Drive 9 (top)
Drive 1 (middle)
Drive 4 (middle)
Drive 7 (middle)
Drive 10 (middle)
Drive 2 (bottom)
Drive 5 (bottom)
Drive 8 (bottom)
Drive 11 (bottom)
DR Series Expansion Shelf
Each DR Series system appliance supports the installation and connection of up to two Dell PowerVault MD1200 data
storage expansion shelf enclosures. Each expansion shelf contains 12 physical disks in an enclosure, which provides
additional data storage capacity for the basic DR Series system. The supported data storage expansion shelves can be
added in 1 Terabyte (TB), 2 TB, or 3 TB hard drive capacities.
The physical disks in each expansion shelf are required to be Dell-certified Serial Attached SCSI (SAS) drives, and the
physical drives in the expansion shelf uses slots 1–11 configured as RAID 6, with slot 0 being a global hot spare (GHS).
When being configured, the first expansion shelf is identified as Enclosure 1 (in the case where two enclosures are
added, these would be Enclosure 1 and Enclosure 2). Adding an expansion shelf to support the DR Series system
requires a license. For more information, see Expansion Shelf Licenses. For more general information about the
supported storage enclosures, see support.dell.com/manuals.
NOTE: The 300 Gigabyte (GB) drive capacity (2.7 TB) version of the DR Series system does not support the addition
of expansion shelf enclosures.
NOTE: If you are running a DR4000 system with an installed release of system software prior to 2.0, and you intend
to upgrade to release 2.0 system software and install an external expansion shelf (or shelves), Dell recommends
that you observe the following best practice sequence of operations to avoid any issues:
•
Upgrade the DR4000 system with the release 2.0 system software
•
Power off the DR4000 system (required for 2.0 with Dell OpenManage 7.1)
•
Connect the external expansion shelf (or shelves) with cabling to the DR4000 system
•
Power on the external expansion shelf (or shelves)
•
Power on the DR4000 system
NOTE: If you install an expansion shelf enclosure to support a DR Series system, each shelf must use physical
disks that have a capacity equal to or greater than each DR Series system internal drive slot capacity (0–11) that
they are supporting.
Figure 2. DR4100 System Expansion Shelf (MD1200) Drive Slot Locations
Drive 0 (top)
Drive 3 (top)
Drive 6 (top)
Drive 9 (top)
Drive 1 (middle)
Drive 4 (middle)
Drive 7 (middle)
Drive 10 (middle)
Drive 2 (bottom)
Drive 5 (bottom)
Drive 8 (bottom)
Drive 11 (bottom)
27
Understanding About Adding a DR Series Expansion Shelf
The 2.0 release of the DR Series system appliance allows you to connect up to two Dell PowerVault MD1200 data
storage expansion shelf enclosures to provide additional data storage capacity beyond the capacity of the basic DR
Series system. Supported data storage expansion shelves can be added in 1 Terabyte (TB), 2 TB, or 3 TB hard drive
capacities. The process for adding an expansion shelf requires the following:
NOTE: The 300 Gigabyte (GB) drive capacity (2.7 TB) version of the DR Series system does not support the addition
of expansion shelf enclosures.
•
Physically adding or installing the expansion shelf (for more information, see Adding a DR Series System
Expansion Shelf)
•
Cabling the expansion shelf to the DR Series system (for more information, see DR Series System - Expansion
Shelf Cabling)
•
Installing the license for an expansion shelf (for more information, see Installing an Expansion Shelf License)
Supported Software and Hardware
For a complete list of the latest supported software and hardware for the DR Series system, Dell recommends that you
see the Dell DR Series System Interoperability Guide at support.dell.com/manuals. For example, the Dell DR Series
System Interoperability Guide lists the following supported hardware and software categories:
•
•
Hardware
–
BIOS
–
RAID Controllers
–
Hard Drives (internal)
–
Hard Drives (external)
–
USB Flash Drives
–
Network Interface Controllers
–
iDRAC Enterprise
–
Marvell WAM Controller
Software
–
Operating System
–
Supported Backup Software
–
Network File Protocols and Backup Client Operating Systems
–
Supported Web Browsers
–
Supported System Limits
–
Supported OST Software and Components
Terminal Emulation Applications
To access the DR Series system command line interface (CLI), the following terminal emulation applications can be
used:
28
•
FoxTerm
•
Win32 console
•
PuTTY
•
Tera Term Pro
NOTE: The listed terminal emulation applications are not the only ones that will work with the DR Series system.
This list is only intended to provide examples of terminal emulation applications that can be used.
DR Series — Expansion Shelf Cabling
The 2.0 release enables each DR Series system appliance that is capable of supporting additional storage capacity to
install and connect up to two Dell PowerVault MD1200 data storage expansion shelf enclosures. Each of the expansion
shelf enclosures contains 12 physical disks that provide additional data storage capacity for a basic DR Series system.
The supported data storage expansion shelves can be added in 1 Terabyte (TB), 2 TB, or 3 TB hard drive capacities.
Figures 1 and 2 are diagrams that display the recommended method for connecting the cabling between the DR4000/
DR4100 PERC controller card to the appropriate connectors on the rear of the Dell MD1200 expansion shelf enclosure.
NOTE: The 300 Gigabyte (GB) drive capacity (2.7 TB) version of the DR Series system does not support the addition
of expansion shelf enclosures.
Make sure that the Dell MD1200 front panel selector switch is set to its Unified mode (with the switch set to its “up”
position, indicated by a single Volume icon). Figure 1 shows the SAS In ports on the Enclosure Management Module
(EMM) on the rear of the Dell MD1200. Figure 2 shows the recommended redundant path cabling configuration, which
includes cable connections from both PERC H800 connectors on the DR4000 system (or the PERC H810 on a DR4100
system) to the two SAS In ports on the EMM rear chassis of the MD1200.
If you plan on installing the second of the two supported expansion shelf enclosures in Release 2.0, then the two SAS In
ports on the rear chassis of the EMM on the second enclosure are daisy-chained to the two SAS Out ports on the EMM
rear chassis on the first enclosure. This is considered a redundant mode connection via the SAS In/Out connectors on
the enclosures with the DR Series system appliance (see Figures 1, 2, and 3 for more information).
If you install a second enclosure and cable it as described here, make sure to set the enclosure mode switch on the
MD1200 front chassis to the top (unified mode) positions. For more information, see Dell PowerVault MD1200 and
MD1220 Storage Enclosures Hardware Owner's Manual at support.dell.com/manuals.
•
Figure 1, MD1200 Rear Chassis
•
Figure 2, Unified Mode Daisy-Chained Redundant Path MD1200 Enclosures
29
•
Figure 3, SAS Port and Cable Connections (MD1200 EMM)
Adding a DR Series System Expansion Shelf
There are three tasks associated with configuring an expansion shelf enclosure with the DR Series system that you
need to complete before being able to use this additional data storage capacity:
•
•
•
30
Install all cabling that connects the expansion shelf enclosure to the DR Series system (for information, see DR
Series System - Expansion Shelf Cabling).
Add and activate the expansion shelf enclosure using the Storage page (which is explained in this topic).
Install the Dell license for expansion shelf enclosures (for information, see Installing an Expansion Shelf
License).
To add an expansion shelf enclosure to a DR Series system, complete the following:
1.
Click Storage in the navigation panel.
The Storage page is displayed (this step assumes that you completed all expansion shelf enclosure cable
connections).
2.
In the Physical Storage pane, click Add in the Configured column of the Physical Storage summary table that
corresponds to the enclosure you want to add (Not Configured is the displayed State for the enclosure).
The Enclosure Addition dialog is displayed that indicates that all input-output to the system will be stopped during
an enclosure addition, and prompts you to click OK to continue or click Cancel to stop this process.
3.
Click OK to continue adding the enclosure to the DR Series system.
If you click Cancel, the addition process quits and the Storage page is displayed.
4.
If you clicked OK, an Enclosure Addition dialog is displayed that indicates this process may take up to 10 minutes to
complete.
A System Status dialog displays with the following message: The system is currently adding an enclosure. Please
wait for this process to complete and the system to become operational.
5.
To verify that an enclosure was added, click Dashboard→ Health.
The Health page is displayed, and each properly cabled and activated expansion shelf enclosure has a
corresponding tab that displays a green status check mark (for example, if you have installed two enclosures, two
tabs are displayed: Enclosure 1 and Enclosure 2).
NOTE: If the Enclosure tab does not display a green status check mark, this indicates that there is an issue
with the enclosure (such as it has not been properly connected or activated).
6.
After adding an expansion shelf enclosure, make sure that you install an expansion shelf license.
For more information, see Installing an Expansion Shelf License.
31
32
Setting Up the DR Series System
3
Before you can interact with the DR Series system using one of its two supported methods: the web-based DR Series
system graphical user interface (GUI) using a web browser or the command line interface (CLI) and a terminal emulator
application (for example, PuTTY), you must first ensure that it is properly set it up. For more information about properly
setting up the DR Series system, see the following links. For more information on the DR Series system CLI commands,
see the Dell DR Series System Command Line Reference Guide.
Related Links
Logging in Using a Web Interface
Interacting with the DR Series System
Logging in and Initializing the DR Series System
Networking Preparations for the DR Series System
Interacting with the DR Series System
You interact with the DR Series system using its web-based graphical user interface (GUI) through a browser-based
connection. The DR Series system GUI provides a single, comprehensive data management interface that lets you
create new data containers, modify or delete existing containers, and perform a number of data-related operations
using its features and settings.
NOTE: A second method for interacting with the DR Series system is by using its command-line interface (CLI) via a
terminal emulator application (for example, PuTYY).
You can create and manage containers that are the repositories where you store your backup and deduplicated data. A
data container is a shared file system that is imported using a client, and is accessible via NFS or CIFS filesystem
protocols.
The DR Series system provides real-time summary tables, detail tables, and graphs that let you monitor the status of the
data capacity, storage savings, and the throughput of the containers you are managing using its set of GUI features.
Networking Preparations for the DR Series System
Before you can start using the DR Series system, ensure that you have satisfied the following networking prerequisites:
•
Network: An active network is available using Ethernet cables and connections.
NOTE: If your DR Series system is equipped with a 1-GbE NIC, Dell recommends using CAT6 (or CAT6a)
copper cabling. If your DR Series system is equipped with a 10-GbE NIC, Dell recommends using CAT6a
copper cabling.
NOTE: If your DR Series system is equipped with a 10-GbE enhanced small form-factor pluggable (SFP+)
NIC, you must use Dell-supported SFP+ LC fiber-optic transceivers or twin-axial cabling.
•
IP Addresses: You need to make sure to have IP addresses that you use for the DR Series system. The DR Series
system ships with a default IP address and subnet mask address, which should only be used for an initial system
configuration.
NOTE: You need to have an IP address available to replace the default IP address if you choose the static
mode of IP addressing, or select to use the DHCP mode of IP addressing.
33
To perform an initial configuration, you need:
•
–
An IP address for the system
–
A subnet mask address
–
A default gateway address
–
A DNS suffix address
–
A primary DNS server IP address
–
(Optional) A secondary DNS server IP address
NIC Connections: To configure NIC connection bonding remember that, by default, the DR Series system will
configure its NIC interfaces together as a bonded team (and only one IP address is needed because the bonded
NICs assume the primary interface address). NIC connection bonding can use either of these configurations:
–
Adaptive load balancing (ALB), which is the default setting, does not require any special network switch
support. Ensure that the data source system resides on the same subnet as the DR Series system. For
more information, see Configuring Networking Settings.
–
802.3ad or dynamic link aggregation (using the IEEE 802.3ad standard). 802.3ad requires special switch
configuration before using the system (contact your network administrator for an 802.3ad configuration).
NOTE: To configure a 10-GbE NIC or 10-GbE SFP+ bonded configuration, connect only the 10-GbE/10-GbE
SFP+ NICs (1-GbE NICs are disabled when the 10-GbE/10-GbE SFP+ NICs are present).
•
DNS: you need a DNS domain available, and you need to know the primary DNS server IP address (and a
secondary DNS server IP address, if you choose to configure one).
•
Replication ports: the replication service in the DR Series system requires that enabled fixed ports be configured
to support replication operations that are to be performed across firewalls (TCP ports 9904, 9911, 9915, and 9916).
For more information about replication ports, see Managing Replication Operations, and for more information
about system ports, see Supported Ports in a DR Series System.
NOTE: For the latest details about supported hardware and software for the Dell DR Series system, see the
Dell DR Series System Interoperability Guide at support.dell.com/manuals.
NOTE: For information about ports needed for OST operations, see Understanding OST.
Connections for Initializing a DR Series System
There are two supported methods for connecting to the DR Series system for logging in and performing the initial system
configuration via the DR Series system CLI:
•
Local console connection: this is a local access connection made between a local workstation and the DR
Series system (with one connection made to a USB keyboard port on the DR Series front/rear chassis, and a
second connection made to the VGA monitor port on the DR Series system rear chassis. (See Figure 1 for
locations in the DR Series System Rear Chassis Port Locations in the Local Console Connection.)
•
iDRAC connection: this is a remote access connection made between an integrated Dell Remote Access
Controller (iDRAC) and the dedicated management port on the DR Series system rear chassis. (See Figure 1 for
locations in the DR Series System Rear Chassis Port Locations in the Local Console Connection.)
Initializing the DR Series System
Before you can start using the DR Series system graphical user interface (GUI) for the first time, you must properly
initialize the system. To initialize the DR Series system, complete the following:
1.
Log in to the DR Series system CLI by using a local console KVM (keyboard-video monitor) connection or an iDRAC
connection. For more information, see Local Console Connection, or iDRAC Connection.
2.
Configure your system network settings using the Initial System Configuration Wizard. For more information, see
Logging in and Initializing the DR Series System.
34
The Initial System Configuration Wizard lets you configure the following network settings to complete a first-time
initialization of your system:
•
IP addressing mode
•
Subnet mask address
•
Default gateway address
•
DNS suffix address
•
Primary DNS server IP address
•
(Optional) Secondary DNS server IP address
•
Host name for system
Default IP Address and Subnet Mask Address
This topic lists the following default address values that can be used for initialization of a DR Series system:
•
IP address—10.77.88.99
•
Subnet mask address—255.0.0.0
There are two key factors related to default address values and initializing a DR Series system:
•
Using the local console
•
Reserving MAC addresses using DHCP
If the network where the system will reside does not have or does not support DHCP, then the DR Series system can use
the default IP (10.77.88.99) and subnet mask (255.0.0.0) addresses provided for initialization. If the network where the
system will reside does not have or support reserving an IP address for the MAC address of the NICs in the DHCP
server, then DHCP assigns an arbitrary IP address that is unknown (and which is unusable by you) during initialization.
As a result, if your network does not support DHCP or if you cannot reserve an IP address for the specific MAC
addresses of the DHCP network interface cards (NICs), then Dell recommends that you use the local console connection
method and the Initial System Configuration Wizard.
NOTE: After successfully initializing and configuring your system, you can modify the IP address to use either a
static IP address or use dynamic IP addressing (DHCP), and modify the subnet mask address to be one that is
supported by your network.
NOTE: If you have not run the Initial System Configuration Wizard on one (or more) DR Series system(s) being
installed into the same network, there is a potential that the system (or systems) may come up with the same
default IP address (10.77.88.99). The default IP address is not user-configurable and it can potentially result in
becoming a duplicate IP address in the case of multiple systems.
Initialization issues could include when a network has had a network power outage, the DHCP server in the network is
misconfigured, or if the Initial System Configuration Wizard has never been run.
If your network does not accept the default subnet mask address (255.0.0.0), you can establish a connection between
the DR Series system and a laptop workstation. In this case, make sure that you connect using SSH, and use the default
IP address to run the Initial System Configuration Wizard.
If you are using a known static IP address, you can skip running the Initial System Configuration Wizard, and directly
configure the DR Series system using its user interface.
To configure the DR Series system, select System Configuration → Networking , and configure the network settings as
desired. For more information, see Configuring Networking Settings.
NOTE: For details about logging in and using the Initial System Configuration Wizard, see Configuring Networking
Settings.
35
Local Console Connection
To configure a local console connection, you must make the following two rear chassis cable connections:
•
VGA port and your video monitor
•
USB port and your keyboard
To make local console cable connections for the DR4000 and DR4100 system appliances, complete the following:
1.
(DR4000 system appliance) Locate the VGA monitor port and the USB ports on the back of your system. See Figure 1
for the VGA and USB port locations and complete steps 1–4. For the DR4100 system appliance, skip to step 5.
2.
Connect the video monitor to the VGA port on the back of your system (see item 1 in the DR4000 System Rear
Chassis Port Locations table).
3.
Connect the USB keyboard to one of the two USB ports on the back of your system (see item 3 in DR4000 System
Rear Chassis Port Locations table).
4.
You are now ready to perform initialization using the DR Series system CLI login process. For more information, see
Logging in and Initializing the DR Series System.
Figure 3. DR4000 System Rear Chassis Port Locations
Item
Indicator, Button, or Connector Icon
Description
1
Video connector
Connects a VGA display to the system.
2
iDRAC6 Enterprise port
Dedicated management port for the iDRAC6
Enterprise card.
3
USB connectors (2)
Connects USB devices to the system. The ports are
USB 2.0-compliant.
4
Ethernet connectors (2)
Embedded 10/100/1000 NIC connectors.
5
Ethernet Connectors (2) on
expansion card
1-GbE/10-GbE/10-GbE SFP+ Ethernet Port
To make local console cable connections for the DR4100 system appliance, complete the following:
NOTE: The DR4000 system supports up to four 1–GbE ports or up to two 10–GbE ports; for the 1–GbE ports,
these are two internal LAN on Motherboard (LOM) ports referenced in item 4 above that reside on the
motherboard, and two ports on an expansion card referenced in item 5 above. If the DR4000 system is using
the two 10–GbE ports, these reside on an expansion card referenced in item 5 above.
5.
36
(DR4100 system appliance) Locate the VGA monitor port and the USB ports on the back of your system. See Figure 2
for the VGA and USB port locations and complete steps 5–8.
6.
Connect the video monitor to the VGA port on the back of your system (see item 1 in the DR4100 System Rear
Chassis Port Locations table).
7.
Connect the USB keyboard to one of the two USB ports on the back of your system (see item 7 in the DR4100
System Rear Chassis Port Locations table).
8.
You are now ready to perform initialization using the DR Series system CLI login process. For more information, see
Logging in and Initializing the DR Series System.
Figure 4. DR4100 System Rear Chassis Port Locations
Item
Indicator, Button, or Connector Icon
Description
1
iDRAC7 Enterprise port
Dedicated management port for the iDRAC7
Enterprise card (port is available only if an iDRAC7
Enterprise license is installed on your system).
2
Video connector
Connects a VGA display to the system.
3
USB connectors (2)
Connects USB devices to the system. The ports are
USB 2.0-compliant.
4
Ethernet connectors (4)
Four integrated 10/100/1000 NIC connectors, or four
integrated connectors that include:
–
–
Two 10/100/1000 Mbps NIC connectors
Two 100 Mbps/1 Gbps/10 Gbps SFP+/10GbE T connectors
5
PCIe expansion card slots (3)
Connect up to three full-height PCI Express
expansion cards
6
Hard drives (2)
Provides two hot-swappable 2.5-inch hard drives
NOTE: The DR4100 system supports up to six 1–GbE ports or up to two 10–GbE ports. For the 1–GbE ports,
these are four internal LAN on Motherboard (LOM) ports referenced in item 4 above that reside on the
network daughter card (NDC), and two additional ports on a PCI Express expansion card referenced in item 5
above. If the DR4100 system is using the two 10–GbE ports, these ports reside on the NDC.
iDRAC Connection
The iDRAC connection requires a network connection between the integrated Dell Access Control (iDRAC) management
port on the DR Series system and another computer running the iDRAC remote console session in a supported browser.
The iDRAC provides remote console redirection, power control, and the out-of-band (OOB) system management
functions for the DR Series system. iDRAC connections are configured using console redirection and the iDRAC6/7 web
interface. The login values you can use for making iDRAC connections are:
37
•
Default username: root
•
Default password: calvin
•
Default static IP address: 192.168.0.120
For information on how to configure the iDRAC, see the Dell RACADM Reference Guides at support.dell.com/manuals
and Accessing iDRAC6/iDRAC7 Using RACADM.
When the Dell DR Series System splash screen is displayed, you are ready to begin initialization using the DR Series
system CLI login process. For more information, see Logging in and Initializing the DR Series System.
Logging in and Initializing the DR Series System
Use the DR Series system CLI and the Initial System Configuration Wizard to log in to and initialize the system. After
completing a local console or iDRAC connection, log in to the DR Series system CLI:
1.
Launch a terminal emulator application (like PuTTY), and type the default IP address for the DR Series system (if
you are not using iDRAC or local console).
2.
At the login as: prompt, type administrator, and press <Enter>.
3.
At the administrator@<system_name> password: prompt, type the default administrator password (St0r@ge!), and
press <Enter>.
The Initial System Configuration Wizard window is displayed.
Figure 5. Initial System Configuration Wizard Window
4.
To configure the network settings, type y (for yes), and press <Enter>.
5.
To configure the use of the default IP address that ships with the system, choose to use static IP addressing.
To do this, at the DHCP prompt, type no (this selects static IP addressing), and press <Enter>.
NOTE: When you select static IP addressing, you are prompted to type the static IP address (for example, you
could use the default IP, 10.77.88.99) for the system, and press <Enter>. If your network supports the use of
DHCP, type yes at the DHCP prompt, press <Enter>, and respond to any prompts.
6.
To configure a subnet mask address, type the subnet mask address you want to use (for example, you could use
the default subnet mask address, 255.0.0.0), and press <Enter>.
7.
To configure a default gateway address, type the default gateway address you want to use (for example,
10.10.20.10), and press <Enter>.
8.
To configure a DNS Suffix, type the DNS suffix you want to use (for example, storage.local), and press <Enter>.
9.
To configure a primary DNS server IP address, type an IP address you want to use for the primary DNS server (for
example, 10.10.10.10), and press <Enter>.
10. (Optional) To configure a secondary DNS server IP address, type y (for yes), and press <Enter>.
If you responded yes, type an IP address you want to use for the secondary DNS server (for example, 10.10.10.11),
and press <Enter>.
38
11. To change the default host name (for example, the serial number of the DR Series hardware appliance), type y (for
yes) and press <Enter>.
If you responded yes, type the host name you want to use, and press <Enter>. If you did not want to change the
default host name, type n (for no) and press <Enter>. After you configure your host name response, the current
system settings are displayed.
12. To accept these settings, type y (for yes), and press <Enter>.
13. If you want to change any of these settings, type n (for no), and press <Enter>. Modify the settings as needed, and
press <Enter>.
When completed, a successful initialization message is displayed.
14. At the prompt, type exit and press <Enter> to end the DR Series system CLI session.
You are now ready to log in to the system using the DR Series system GUI.
NOTE: Before you log into the system using the DR Series system GUI, make sure to register it in the local Domain
Name System (DNS) for your network so that it is a DNS-resolvable entry.
NOTE: At this point, you could modify the bonding mode to use 802.3ad, if this configuration is available in your
network.
Accessing iDRAC6/iDRAC7 Using RACADM
You can use SSH-based or Telnet-based interfaces to access iDRAC6/iDRAC7 using the RACADM utility. RACADM
(remote access controller administration) is a Dell command-line utility that allows you to set up and configure the
integrated Dell Remote Access Control (iDRAC) interface card to provide an out-of-band management capability.
The iDRAC card contains a controller with its own processor, memory, network connection, and access to the system
bus. This gives system or network administrators the capability to configure a system as if they were sitting at the local
console using the power management, virtual medial access and remote console capabilities, by using a supported web
browser or command line interface.
The login values you can use for making iDRAC connections are:
•
Default username: root
•
Default password: calvin
•
Default static IP address: 192.168.0.120
For more information, see the RACADM Reference Guides for iDRAC, the Integrated Dell Remote Access Controller 6
(iDRAC6) User Guide, or the Integrated Dell Remote Access Controller 7 (iDRAC7) User Guide that are available at
support.dell.com/manuals.
Logging in Using a Web Interface
To log in to the DR Series system using a browser-based connection, complete the following:
NOTE: This procedure describes the logging in process from a first-time perspective, starting with the Customer
Registration and Notification page, the completion of the Initial System Configuration Wizard process, and the
Initial Software Upgrade page.
1.
In a supported web browser, type the IP address or hostname of the system in the browser Address bar, and press
<Enter>.
The DR Series System Login page is displayed.
39
NOTE: The DR Series System Login page may display a warning message if the web browser you are using
does not properly support the DR Series system. If you are running a Microsoft Internet Explorer (IE) 8 or
greater web browser, make sure that you disable the Compatibility View. For more information about disabling
the Compatibility View settings, see Disabling the Compatibility View Settings. For more information about the
supported web browsers, see the Dell DR Series System Interoperability Guide, Release 2.0.0.0.
NOTE: For best results when using IE web browsers in combination with supported Windows-based servers,
ensure that Active Scripting (JavaScript) is enabled on the Windows client. This setting is often disabled by
default on Windows-based servers. For more information on enabling Active Scripting, see Enabling Active
Scripting in Windows IE Browsers.
NOTE: If you want to reset your login password, click Reset Password on the DR Series System Login page.
The Reset Password dialog is displayed. In Service Tag, enter the service tag number ID for the system, and
click Reset Password to reset the system password back to its default setting (or click Cancel to return to the
DR Series System Login page).
2.
In Password, type St0r@ge! and click Log in or press <Enter>.
The Customer Registration and Notification page is displayed. Before you can begin using the DR Series system
graphical user interface (GUI), you need to properly register the system with Dell. In addition, this page also allows
you to sign up for notifications about appliance alerts and system software updates. For more information, see
Registering a DR Series System.
3.
In the Settings pane of the Customer Registration and Notification page, complete the following:
a)
b)
c)
d)
e)
f)
g)
In Contact Name, enter a system contact name.
In Relay Host, enter a hostname or IP address for the relay host.
In Email Address, enter an email address for the contact.
Select Notify me of DR4000 appliance alerts to be notified about system appliance alerts.
Select Notify me of DR4000 software updates to be notified about system software updates.
Select Don't show me this again to not display the Customer Registration and Notification page again.
Click Confirm to have the DR Series system accept your settings (or click Skip without configuring any settings)
to proceed with initialization.
The Initial System Configuration Wizard page is displayed.
4.
To start the initial system configuration process, click Yes.
The Initial Configuration — Change Administrator Password page is displayed.
NOTE: If you click No, you will bypass the initial system configuration process, and the DR Series system
Dashboard page is displayed. However, when you next log in to the DR Series system, you will be prompted to
perform the initial system configuration process again with the Initial System Configuration Wizard page being
displayed.
The Initial Configuration — Change Administrator Password page is displayed.
40
5.
In the Settings pane of the Initial Configuration — Change Administrator Password page, complete the following:
a) In Current Password, enter the current administrator password.
b) In New Password, enter the new administrator password.
c) In Retype New Password, enter the new administrator password again to confirm it.
d) Click Next to continue with the initial configuration process (or click Back to return to the previous page, or
click Exit to close the Initial System Configuration Wizard).
The Initial Configuration — Networking page is displayed.
6.
In the Settings pane of the Initial Configuration — Networking page, complete the following:
a) In Hostname, enter a hostname that meets the hostname naming convention: A-Z, a-z, 0–9, the dash special
character (-), within a maximum 19 character limit.
b) In IP Address, select the Static or DHCP mode of IP addressing, and if planning to use a Secondary DNS, enter
an IP address for the secondary domain name system.
c) In Bonding, select the Mode choice from the drop-down list (ALB or 802.3ad).
Dell recommends that you verify the system can accept your bonding selection type. The connection will be
lost unless it is correctly configured. For more information, see Configuring Networking Settings.
41
d) In Bonding, enter the MTU value for the maximum transmission unit (the MTU accepts values between 512 and
9000). For more information, see Configuring Networking Settings.
e) In Active Directory, enter a fully qualified domain name for the Active Directory Services (ADS) domain in
Domain Name (FQDN), enter an organization name in Org Unit, enter a valid ADS username in Username, and
enter a valid ADS password in Password.
For more information, see Configuring Active Directory Settings.
f)
NOTE: If an ADS domain has already been configured, you will not be allowed to change the values for the
Hostname or IP Address settings.
Click Next to continue with the initial configuration process (or click Back to return to the previous page, or
click Exit to close the Initial System Configuration Wizard).
The Initial Configuration — Date and Time page is displayed.
NOTE: If the Microsoft Active Directory Services (ADS) domain has already been configured, the Initial
Configuration — Date and Time page will not display.
7.
In the Settings pane, select the Mode choice (NTP or Manual).
a) If you select NTP, accept or revise the NTP servers as desired (you are limited to only three NTP servers), and
in Time Zone, select the desired time zone from the drop-down list.
b) If you select Manual, in Time Zone, select the desired time zone from the drop-down list, click the Calendar icon
and select the desired day in the month, and adjust the Hour and Minute sliders to the desired time (or click
Now to choose the current date and time), and click Done.
c) Click Next to continue with the initial configuration process (or click Back to return to the previous page, or
click Exit to close the Initial System Configuration Wizard)
For more information, see Configuring System Date and Time Settings.
NOTE: Dell recommends using NTP when the DR Series system is part of a workgroup and not part of an
domain. When the DR Series system is joined to a domain, such as the Microsoft Active Directory Services
(ADS) domain, NTP is disabled.
The Initial Configuration — Summary page is displayed.
8.
The Initial Configuration — Summary page displays a summary of all of the initial configuration changes you have
made. Click Finish to complete the Initial System Configuration Wizard (or click Back to return to a previous page to
change a setting).
The Initial Software Upgrade page is displayed and prompts you to verify the current installed system software
version.
42
9.
Click Dashboard in the navigation panel,
The DR Series system main window consists of the following components:
–
Navigation panel
–
System Status bar
–
System Information pane
–
Command bar
43
1
Navigation Panel (left-hand column:
2
Dashboard, Storage, Schedules, System
Configuration, and Support)
System Status Bar (with system status indicators:
System State, HW State, Number of Alerts, and Number
of Events)
3
System Information Pane (with key
system information categories)
Command Bar (with the Help and Log out options)
4
NOTE: Located on the DR Series System Dashboard page command bar, you can display the Help system
documentation by clicking Help, or logout of the system by clicking Log out.
NOTE: When logged in, a Logout Confirmation dialog is displayed after 45 minutes of non-use. This dialog displays
for 30 seconds before the DR Series system performs a forced timeout. Click Continue to reset the 45-minute logout
timer. If you do not click Continue before the 30-second interval elapses, the DR Series system logs you out. You
must log in again to resume using the DR Series system features and GUI.
Before managing data using the system navigation panel options, you should understand the options and capabilities
you can use. The navigation panel contains the following sections that let you manage your data:
•
Dashboard
•
Storage
•
Schedules
•
System Configuration
•
Support
Registering a DR Series System
Before you can start using the DR Series system using its graphical user interface (GUI) for the first time, you must
properly register the system with Dell by completing the Customer Registration and Notification page. In addition to
registering your system, you can also sign up to be notified about appliance alerts and system software updates. The
Customer Registration and Notification page is displayed when you initially log into a Release 2.0 DR Series system using
a web interface connection, and it consists of the following text boxes and check boxes in the Settings pane:
•
Contact Name
•
Relay Host
•
Email Address
•
Notify me of DR4000 appliance alerts
NOTE: If this check box is selected, you are notified of all warning and critical severity system alerts, which
are the types that may require user action. For more information, see Displaying System Alerts.
•
Notify me of DR4000 software updates
NOTE: If this check box is selected, you are notified by Dell about any new system software upgrades or
maintenance releases. For more information, see Software Upgrade Page and Options.
•
44
Don't show me this again
NOTE: DR4000 systems that run system software versions earlier than 2.0 that later upgrade to the 2.0 release will
see this screen display when logging into the DR Series system following the upgrade process.
To register a DR Series system, complete the following:
1.
In Contact Name, enter the name of the DR Series system contact.
2.
In Relay Host, enter the hostname or IP address for the DR Series system email relay host.
3.
In Email Address, enter an email address for the system contact.
4.
To be notified about DR4000 appliance alerts, select the Notify me of DR4000 appliance alerts check box.
5.
To be notified about DR4000 software updates, select the Notify me of DR4000 software updates check box.
6.
To not display the Customer Registration and Notification page again, select the Don't show me this again check
box.
7.
Click Confirm for the DR Series system to accept your values (or click Skip) to proceed to the Initial System
Configuration Wizard page.
Enabling Active Scripting in Windows IE Browsers
To enable Active Scripting (JavaScript) in Microsoft Windows Internet Explorer (IE) web browsers, complete the
following:
NOTE: This procedure describes how to configure your Windows IE web browser to enable Active Scripting
(JavaScript). This setting is often disabled by default on Windows-based servers
1.
Launch the IE web browser, and click Tools→ Internet Options.
The Internet Options page is displayed.
2.
Click the Security tab, and click Custom level....
The Security Settings — Local Intranet Zone page is displayed.
3.
Using the right scroll bar, scroll down the Settings choices until you reach Scripting.
4.
In Active scripting, click Enable.
5.
Click OK to enable JavaScript and the Active Scripting feature for your web browser.
The Internet Options page is displayed.
6.
Click OK to close the Internet Options page.
45
Disabling the Compatibility View Settings
To disable the Compatibility View settings of the IE web browser you are using to log in to access the DR Series system
graphic user interface (GUI), complete the following:
NOTE: This procedure describes how to disable the Compatibility View settings to ensure there is no conflict
between different versions of the Microsoft Internet Explorer (IE) web browser you use to access the DR Series
system. Disabling the compatibility view settings requires that the Display all websites in Compatibility View check
box option in the Compatibility View Settings page remains unselected, and that there are no DR Series systems or
domains associated with these systems listed in the Compatibility View list on this page.
1.
Launch the IE web browser, and click Tools→ Compatibility View settings.
The Compatibility View Settings page is displayed.
2.
If selected, deselect the Display all websites in Compatibility View check box option.
3.
If any DR Series systems are listed in the Compatibility View list, select the entry and click Remove.
Repeat this step for any additional DR Series systems that are listed.
4.
Click Close to exit from the Compatibility View Settings page.
Dashboard Page and Options
By default, the Dashboard page is displayed after logging on, which displays the following current system-related
information:
•
System Status
–
System State
–
HW (Hardware) State
–
Number of Alerts
–
Number of Events
•
Capacity
•
Storage Savings
•
Throughput
•
System Information
NOTE: To refresh the values listed in Storage Savings and Throughput, click
.
NOTE: In the DR Series system navigation panel, the Dashboard section consists of the following menu options that
when selected display the corresponding page:
•
Alerts
•
Events
•
Health
•
Usage
•
Statistics: Container
•
Statistics: Replication
For more information, see the following:
•
46
Understanding the Dashboard Options
•
Using the Dashboard Alerts Page
•
Using the Dashboard Events Option
•
Using the Dashboard Page to Monitor System Health
•
Using the Dashboard to Display System Events
Understanding the Dashboard Options
The DR Series system provides a mechanism for viewing and accessing the latest information about the system as soon
as you log in. The Dashboard section of the navigation panel (which displays the Dashboard page by default) lists the
current system status and provides the following menu options, that when selected, display the corresponding pages:
•
Alerts
•
Events
•
Health
•
Usage
•
Statistics: Container
•
Statistics: Replication
Displaying System Alerts
To display the Alerts page, click Dashboard → Alerts, or click the Number of Alerts link on the Dashboard page.
The Alerts page displays the Current Time Zone (for example, US/Pacific), the Number of Alerts, and a system alerts
summary table that lists the total number of system alerts by index number, timestamp, and a brief message that
describes the alert.
Unresolved critical events become system alerts, which will clear when the problem is resolved. For more information,
see Monitoring System Alerts.
Events
The DR Series system provides two ways to display current system events in the Events page:
•
Click Dashboard→ Events .
•
Click Number of Events link on the Dashboard page.
The Events page provides an Event Filter pane, which is where you can set specific search criteria based on selected
event severity, and starting and ending date setpoints. Once you set the search criteria, click Start Filter to display the
events matching your values.
Matching events are displayed in a Events summary table that lists the total number of system events that match the
search criteria you defined, and defines each matching system event by:
•
Index number
•
Event severity: critical, warning, or info (informational)
•
Timestamp
•
Message (brief description of system event)
In the Events page, set the search criteria for a specific system event type (or all recorded system events) based on the
following:
47
•
In Event Severity, select the event severity to search for from the options in pull-down list: ALL, CRITICAL,
WARNING, and INFO.
•
In Message Contains, enter the word or string of words to search for in the events message text (the DR Series
system performs a case-insensitive match based on your entry).
•
In Timestamp From, enter starting time in field or click calendar icon to choose month and day, enter starting
time using the Hour and Minute sliders, or click Now to set the current time, and click Done.
•
For Timestamp To, enter starting time in field or click calendar icon to choose month and day, enter ending time
using the Hour and Minute sliders, or click Now to set the current time, and click Done.
•
Click Start Filter display all search results that match the selected criteria, or click Reset to return all search
settings to their default values.
All critical system events remain in the event list as a system historical record. For more information, see Monitoring
System Events, and Using the Event Filter.
Health
You can use the Health page to display and view the current state of the DR Series systems, DR4000 and DR4100, (see
Figures 1 and 2).
To display the Health page, click Dashboard → Health or click the HW State link on the Dashboard page. Both methods
display this page, which shows the current state of the system hardware (and any installed data storage expansion shelf
enclosure).
The Health page contains up to three tabs if the maximum number of supported expansion shelves are installed (for
example: System, Enclosure 1, and Enclosure 2). If no expansion shelves were installed, there will be only be one tab
displayed (System).
Health Page: DR4000 System
Figure 1 Health Page (DR4000 System and Components)
48
Health Page: DR4100 System
Figure 2 Health Page (DR4100 System and Components)
By default, the System tab is displayed first, and it lists the following attributes for each of its hardware components:
DR Series System Components
In the System tab on the Health page, the following images and System Hardware Health table display the status of the
system components (for specific locations, see Figures 1 and 2).
•
Chassis: front view (image)—shows the 0 -11 drive locations and status
•
Chassis rear view (image)—shows power supply locations and status, and positions of rear panel connectors
•
OS internal drives (image)—shows the status for the operating system internal drives
•
System Hardware Health (table)—shows the current status for all of the major hardware subcomponents in the
appliance:
–
Power Supplies—status, name, and location
–
Fans—status, name, speed, and identifier
–
Temperature—status, name, and temperature
–
Storage—storage controller, storage virtual disks, storage physical disks, storage controller battery,
and storage cache
NOTE: The storage controller battery state displays either as Ready or Charging (the latter
indicates this state after a system reboot until the storage controller battery is fully charged).
–
Voltage—status, name, voltage, and probe name
–
NIC (network interface card)—status, name, type, and speed
–
CPU (central processing unit)—status and name
–
DIMM (dual in-line memory module)—status, name, and connector name
–
NVRAM (non-volatile random access memory)—NVRAM (status, name, errors, temperature, SSD state,
SSD health, SSD firmware version, serial number, and firmware version); NVRAM super capacitor
(status, name, state, voltage, and maximum design voltage)
NOTE: To display the current status, name, and state of chassis components, scroll your mouse over the desired
component.
49
All system hardware components are listed in the System Hardware Health pane by component name, status, and other
attributes. The following table identifies the component status by one of three color-coded icons that reflect its state.
Icon
Description
This color code icon indicates that the component status is operating at an optimal state.
This color code icon indicates that the component status is a operating under a warning state (a
non-critical error has been detected).
This color code icon indicates that the component status is operating under an error or
actionable state (a critical error has been detected).
To expand any component category to display more status details for each related subcomponent, click + ("plus sign"
icon) in the System Hardware Health pane. To contract any expanded component category, click — ("minus sign" icon).
For more information, see Monitoring System Health.
DR Series System Enclosures
In the Enclosure tab on the Health page, the following images and System Hardware Health table display the status of
the expansion shelf enclosure components (for specific locations, see Figure 3).
Figure 3 Expansion Shelf Components
50
•
Chassis: front view (image)—shows the 1 -11 drive locations and status; drive 0 is the dedicated hot spare for
RAID 6
•
Chassis rear view (image)—shows cooling fan locations and status, and positions of rear panel connectors
•
Service Tag—lists the service tag for the selected expansion shelf
•
System Hardware Health (table)—shows the current status for all of the major hardware subcomponents in the
expansion shelf:
–
Power Supplies—status, name, and location
–
Fans—status, name, speed, and identifier
–
Temperature—status, name, and temperature
–
Storage—storage physical disks (status, slot, serial number, state, GHS status, spare state, smart alert,
and size)
–
Enclosure Management Module (status, name, identifier, and Nexus ID)
Usage
To display the Usage page, click Dashboard → Usage. The Usage page consists of options, pull-down lists, and tabs that
let you filter the DR Series system usage statistics that you want to view, which include:
•
Latest Range and Display last...—these options display system usage details for based whether you select
Latest Range or Time Range.
•
System Usage tabs—displays system usage based on the Latest Range or Time Range option that you selected,
and represented by the following tabs: CPU Load, System, Memory, Active Processes, Protocols, Network, Disk,
and All.
NOTE: If you click the All tab, this action displays the system usage that is defined by the range and display options
you selected, and the file system protocols you have configured. To view all of the displayed usage categories, use
the scroll bar on the right-hand side of the page.
Viewing the Latest Range
The Usage page lets you filter the system usage statistics you want to view. To view the Latest Range statistics,
complete the following:
NOTE: The Usage page also displays the Current Time Zone in use for the system.
1.
Click the Latest Range option.
2.
Select the desired Hours, Days, or Months duration in the Range pull-down list.
3.
Enter the desired value in the Display last... drop-down list.
For the Hours duration, this 1–24 hours; for the Days duration, this is 1–31 days; for the Months duration, this 1–12.
4.
Click Apply.
5.
Click one of the seven desired tabs to view a specific set of usage statistics, or click All to display the entire set of
system usage statistical graphs.
The seven Usage page tabs include: CPU Load, System, Memory, Active Processes, Protocols, Network, Disk, and
All.
If you click All, the following set of statistics are displayed:
•
CPU Load
•
System Usage
•
Memory Usage — Total
•
Memory Usage — Real
•
Active Processes — Total
•
NFS Usage — Total
•
CIFS Usage — Total
•
OST Usage — Total
•
Network Usage
•
Socket Usage — Total
•
Active Connections
•
Disk Usage — Meta Data
•
Disk Usage — Data Storage
For information on viewing specific Time Range statistics on the Usage page, see Viewing a Specific Time Range.
51
Viewing a Specific Time Range
The Usage page lets you filter the system usage statistics you want to view. To view a specific Time Range, complete
the following:
NOTE: The Usage page also displays the Current Time Zone in use for the system.
1.
Click the Time Range option.
2.
Type the desired start date in Start Date (or click the calendar icon and make your date selection), or click Now to
select the current time (or use the Hour and Minute sliders to set a desired time), and click Done.
3.
Type the desired end date in End Date (or click the calendar icon and make your date selection), or select the Set
“End Date” to current time to set the end date to the current day and time, or click Now to select the current time
(or use the Hour and Minute sliders to set a desired time), click Done, and click Apply.
The seven Usage page tabs include: CPU Load, System, Memory, Active Processes, Protocols, Network, Disk, and
All.
If you click All, the following set of statistics are displayed:
•
CPU Load
•
System Usage
•
Memory Usage — Total
•
Memory Usage — Real
•
Active Processes — Total
•
NFS Usage — Total
•
CIFS Usage — Total
•
OST Usage — Total
•
Network Usage
•
Socket Usage — Total
•
Active Connections
•
Disk Usage — Meta Data
•
Disk Usage — Data Storage
For information on viewing the Latest Range statistics on the Usage page, see Viewing the Latest Range.
System Usage
This Usage page is where the DR Series system usage is displayed based on the Latest Time or Time Range values you
selected. System usage statistics are grouped and represented by the following tabs:
52
•
CPU Load
•
System
•
Memory
•
Active Processes
•
Protocols
•
Network
•
Disk
•
All
NOTE: If you click All, this displays system usage defined by the range and display options you select, and the file
system protocols you have configured. To view all of the displayed usage categories, use the scroll bar on the
right-hand side of the page.
The All tab displays the entire set of system status categories in graphic screen format (depending upon your file system
protocol type):
•
CPU Load
•
System Usage
•
Memory Usage - Total
•
Memory Usage - Real
•
Active Processes - Total
•
NFS Usage - Total
•
CIFS Usage - Total
•
OST Usage - Total
•
Network Usage
•
Socket Usage - Total
•
Active Connections
•
Disk Usage - Meta Data
•
Disk Usage - Data Storage
For more information, see Monitoring System Usage.
Statistics: Container Page
To display the Statistics: Container page, click Dashboard → Statistics: Container . This page lets you select from the
Container Name drop-down list, and based on the container you select, displays a variety of statistics for the specified
container:
NOTE: The DR Series system polls for statistics every 30 seconds.
•
Backup Data pane: displays the current number of active files ingested (based on time/minutes) and the current
number of active bytes (mebibytes/MiB) ingested based on time in minutes. You can choose to click Zoom to
view the backup data active files and active bytes statistics in other than the default mode of 1h (1–hour). The
other selectable viewing options are 1d (1–day), 5d (5–day), 1m (1–month), and 1y (1–year).
•
Throughput pane: displays the current number of Mebibytes/second (MiB/s) for read operations (based time/
minutes) and the current number of MiB/s for write operations (based on time/minutes). You can choose to click
Zoom to view the throughput statistics in other than the default mode of 1h (1–hour). The other viewing options
are 1d (1–day), 5d (5–day), 1m (1–month), and 1y (1–year) that you can select.
•
Marker Type and Connection Type pane: displays the marker type associated with the selected container (for
example CommVault, Networker, TSM (Tivoli Storage Manager), or ARCserve, and the Connection Type (NFS,
CIFS, or OST).
•
If the selected container includes an NFS connection type, there will be an NFS Connection Configuration pane
that displays the following categories: NFS Access Path, Client Access, NFS Options, and Map Root To.
•
If the selected container includes a CIFS connection type, there will be a CIFS Connection Configuration pane
that displays the following categories: CIFS Share Path and Client Access.
•
If the selected container includes an OST connection type, the OST login entry user is listed (for example,
backup_user), and there are three tabs: Capacity, Duplication, and Client Statistics. The Capacity tab displays a
Capacity pane with the following categories: Status, Capacity, Capacity Used, and Total Images. The Duplication
NOTE: To refresh the values listed in the Backup Data and Throughput panes, click
.
53
tab displays a Duplication Statistics pane with the following Inbound and Outbound categories: Bytes Copied
(logical), Bytes Transferred (actual), Network Bandwidth Savings, Current Count of Active Files, and Replication
Errors. In addition, this tab also displays a Recent Number of Optimized Copies table, that lists the file name,
peer IP, peer ID, logical bytes to send, replication rate, savings, and replicated at location. The Client Statistics
tab displays a Client Statistics pane with the following categories: Images Ingested, Images Complete, Images
Incomplete, Images Restored, Bytes Restored, Image Restore Errors, Image Ingest Errors, Bytes Ingested, Bytes
Transferred, and Network Savings.
•
(Optional) Replication pane: displays the Replication Configuration and Replication Status panes. The
Replication Configuration pane identifies whether the current container state (Enable or Disable), Role (source
or target), Remote Container Name, Bandwidth, and the Encryption being used. The Replication Status pane
identifies the Peer State, Replication State, Replication Average Transfer Rate, Replication Peak Transfer Rate,
Network Average Transfer Rate, Network Peak Transfer Rate, Network Bytes Sent, Estimated Time to Sync (in
days, hours, minutes, and seconds), Savings (in percentage), Last Insync Time (in timestamp format), and
Schedule Status.
NOTE: The Replication pane is only displayed in the Statistics: Container page if the selected container is
configured for replication.
Backup Data Pane
The Backup Data pane in the Statistics: Container page displays the following graphed information:
•
Current number of active files ingested (based on time in minutes)
•
Current number of active bytes (Mebibytes/MiB) ingested (based on time in minutes)
You can choose to display this information in 1–hour (1h), which is the default, or in 1–day (1d), 5–day (5d), 1–month (1m),
and 1–year (1y) increments for both the Active Files and Active Bytes graphs.
NOTE: To refresh the values listed in Backup Data and Throughput panes, click
.
Throughput Pane
The Throughput pane in the Statistics: Container page displays the following statistics for any existing container that you
select in the Container Name drop-down list:
•
Current number of Mebibytes/per second (MiB/s) for read operations (based on time/minutes)
•
Current number of MiB/s for write operations (based on time/minutes)
NOTE: To refresh the values listed in Backup Data and Throughput panes, click
.
Replication Pane
The Replication section in the Statistics: Container page consists of two panes: Replication Configuration and
Replication Status. This section of this page is only displayed when there are replication statistics for a selected
container that has been configured for replication.
Replication Configuration Pane
This pane contains the following fields:
54
•
Enable (for example, Yes or No)
•
Role (for example, Source or Target)
•
Remote Container Name (for example, IP Address or hostname)
•
Bandwidth (for example, Default, KiB/s, MiB/s, and GiB/s)
•
Encryption (for example, None, AES 128–bit, or AES 256–bit)
Replication Status Pane
This pane contains the following fields:
•
Peer State (for example, online)
•
Replication State (for example, INSYNC)
•
Replication Average Transfer Rate (for example, 1005 KiB/s)
•
Replication Peak Transfer Rate (for example, 2253 KiB/s)
•
Network Average Transfer Rate (for example, 2024 KiB/s)
•
Network Peak Transfer Rate (for example, 2995 KiB/s)
•
Network Bytes Sent (for example, 69.79 KiB)
•
Estimated Time to Sync (for example, 14 days 32 hours 46 minutes, and 33 seconds)
•
Savings (for example, 27.99 %)
•
Last INSYNC Time (for example, 2012–11–04 16:45:53)
•
Schedule Status (for example, Outside window: starts in 2 days, 1 hours, 13 minutes 21 seconds)
NOTE: The Replication pane is only displayed in the Statistics: Container page if the selected container is
configured for replication.
Connection Type Pane
The Connection Type pane is part of the Statistics: Container page, and the information displayed in this pane depends
upon the connection type of the selected container:
•
•
•
NFS containers—lists the following NFS connection configuration information:
–
NFS Access Path
–
Client Access
–
NFS Options
–
Map Root to
CIFS containers—lists the following CIFS connection configuration information:
–
CIFS Share Path
–
Client Access
OST containers—lists the following OST connection configuration information, grouped under the following
tabs:
–
Capacity tab—Status, Capacity, Capacity Used, and Total Images.
–
Duplication tab— the Duplication Statistics pane displays both Inbound and Outbound categories with
the following statistic types: Bytes Copies-logical, Bytes Transferred-actual, Network Bandwidth
Savings-in percentage, Current Count of Active Files, and Replication Errors. The Recent Number of
Optimized Copies pane displays a summary table that lists each entry by the following: File Name, Peer
IP, Peer ID, Logical Bytes to Send, Replication Rate, Savings, and Replicated at categories.
–
Client Statistics tab—contains the Client Statistics pane, which displays Images Ingested, Images
Complete, Images Incomplete, Images Restored, Bytes Restored, Image Restore Errors, Image Ingest
Errors, Bytes Ingested, Bytes Transferred, and Network Savings (in percentage) statistics.
For more information, see Monitoring Container Statistics.
Duplication Statistics
The Duplication Statistics pane displays duplication statistics (which are also known as file copy statistics) for OST
connection type containers. To view these duplication statistics, navigate to the Statistics: Container page, select an
55
OST connection type container in the Container Name pull-down list, and select the Duplication tab. The Duplication
Statistics pane displays the following statistics types:
•
Inbound:
–
•
Bytes Copied (logical): displayed in bytes
–
Bytes Transferred (actual): displayed in bytes
–
Network Bandwidth Savings: (displayed by percentage)
–
Current Count of Active Files: displayed in numbers of files
–
Replication Errors: displayed in numbers of errors
Outbound:
–
Bytes Copied (logical): displayed in bytes
–
Bytes Transferred (actual): displayed in bytes
–
Network Bandwidth Savings: (displayed by percentage)
–
Current Count of Active Files: displayed in numbers of files
–
Replication Errors: displayed in numbers of errors
Recent Number of Optimized Copies
When a OST container is selected in the Statistics: Container page, you can display the Recent Number of Optimized
Copies summary table in the Connection Type: OST pane. This pane, its tabs, and the summary table are displayed only
when the Duplication tab is selected and an OST connection type container is selected in the Container Name pull-down
list.
Recent Number of Optimized Copies Summary Table
This summary table contains the following information about the optimized copies:
•
File Name
•
Peer IP
•
Peer ID
•
Logical Bytes to Send
•
Replication Rate
•
Savings (in percentage)
•
Replicated at (in yyyy-mm-dd hh:mm:ss format)
Client Statistics
You can display client statistics in the Statistics: Container page that correspond to any container that is configured as
an OST connection type. To display client statistics, click the name of the OST container in the Container Name dropdown list, and click the Client Statistics tab in the Connection Type: OST pane. This action displays the following Client
Statistics types for the selected OST container:
56
•
Images Ingested
•
Images Complete
•
Images Incomplete
•
Images Restored
•
Bytes Restored
•
Image Restore Errors
•
Image Ingest Errors
•
Bytes Ingested
•
Bytes Transferred
•
Network Savings (in percentage)
For more information, see Monitoring Container Statistics.
Statistics: Replication Page
To display the Statistics: Replication page, click Dashboard → Statistics: Replication. This page lets you view and
monitor statistics for replication containers or peer DR Series systems that you select, and consists of two main panes:
•
Replication Filter—the Container Filter lets you select all, one, or multiple replication containers, one or more
peer systems, and configure a variety of statistics types to display in the Replication statistics summary table.
You can choose from the 10 Headers check boxes: Peer Status, Replication Status, Time To Sync, Progress %,
Replication Throughput, Network Throughput, Network Savings, Last Time In Sync, Peer Container, and Peer
System to filter the type of replication statistics used in the search.
•
Replication Statistics—contains a summary table that displays the filtered results of the replication statistics
from the Replication Filter pane for the container or peer system choices you made. The summary table displays
the category of statistics based on the check boxes you selected.
NOTE: Starting with Release 2.0, the DR Series system software includes version checking that limits replication
only between other DR Series systems that run the same system software release version (DR Series systems
running Release 2.0.x software can only replicate with other DR Series systems that run the same release system
software). For example, Release 2.0.x systems will not be able to replicate with Release 2.1 or Release 3.0 systems,
but can replicate with systems running Release 2.0.0.1 or 2.0.0.2.
For more information, see Monitoring Replication Statistics, Displaying Replication Statistics, and Displaying the
Statistics: Replication Page.
Container Filter
The Replication Filter pane in the Statistics: Replication page contains the following components:
•
•
Container Filter:
–
All (selecting this option lets you select all replication containers in the system)
–
Name (selecting this option and drop-down list lets you select replication containers)
–
Peer System (selecting this option and list box let you select peer DR Series systems)
Headers (selecting the following check boxes let you filter for specific replication statistic types)
–
Peer Status
–
Replication Status
–
Time to Sync
–
Progress % (percentage)
–
Replication Throughput
–
Network Throughput
–
Network Savings
–
Last Time in Sync
–
Peer Container
–
Peer System
NOTE: The DR Series system polls for statistics every 30 seconds.
After you have configured the Replication Filter settings, click Apply Filter to display the filtered set of replication
statistics in the Replication Filter summary table. The Replication filter summary table lists the replication statistics that
57
correspond to the check boxes you selected (by default, Peer Status, Replication Status, Network Throughput, Network
Savings, and Progress Percentage check boxes are selected and are displayed in the table). To reset the check box
selections, click Reset.
NOTE: If you select more than five statistics types, use the horizontal scroll bar to scroll and display the additional
columns of statistics.
For more information, see Monitoring Replication Statistics.
Storage Page and Options
To display the Storage page, click Dashboard → Storage. This page displays system-related storage information in the
following panes:
NOTE: The DR Series system polls and updates statistics every 30 seconds.
•
•
Storage Summary:
–
Number of Containers
–
Number of Containers Replicated
–
Total Number of Files in All Containers
–
Compression Level
Capacity:
–
•
Storage Savings:
–
•
Total savings (deduplication and compression) graphed in percentages and based on time in minutes;
you can display the statistics in 1–hour (1h), 1–day (1d), 5–day (5d), 1–month (1m), and 1–year (1y); 1–
hour is the default.
Throughput:
–
•
Used and free system physical capacity in both percentages and Gibibytes (GiB) or Tebibytes (TiB)
Read and write rates graphed in Mebibytes per second (MiB/s) and based on time in minutes; you can
display the statistics in 1–hour (1h), 1–day (1d), 5–days (5d), 1–month (1m), and 1–year (1y); 1–hour the
default.
Physical Storage:
–
Type: internal or external storage (external is the expansion shelf enclosure)
–
Raw Size (storage capacity listed in Gigabytes or Terabytes)
–
% Used (represents the percent of capacity used)
–
Service Tag (tag is a unique 7–digit Dell ID)
–
Configured (status is listed as yes, no, add, or detect)
–
State (storage status is ready, reading, initializing, rebuilding, or not detected)
NOTE: To refresh the values listed in Storage Savings and Throughput , click
. To refresh an expansion shelf
enclosure, click Detect under the Configured column in the Physical Storage summary table (the Enclosure Detect
dialog is displayed with this message: If the enclosure is undetected, please wait five minutes and try again. If the
enclosure still remains undetected after an attempt, keep the enclosure powered On and reboot the appliance).
For more information about DR Series system container operations, see Managing Container Operations.
58
Understanding the Storage Options
The DR Series system provides a mechanism for storing backed up and deduplicated data that has been ingested by the
system into easily accessible storage containers. The DR Series system graphical user interface (GUI) simplifies the
process for storing this type of data via its system storage processes. The Storage section of the navigation panel
identifies the following menu options, that when selected, display the corresponding pages:
•
Containers
•
Replication
•
Compression Level
•
Clients
Containers
To display the Containers page, click Storage→ Containers. This page displays the total number of containers (Number
of Containers) and the container path (Container Path: /containers). This page lets you perform the following tasks using
its options: Create, Edit, Delete, and Display Statistics. These options let you do the following:
•
Create new containers
•
Edit existing containers
•
Delete existing containers
•
Display container, connection, and replication statistics
The Containers page also displays a Containers summary table that displays the following types of container-related
information:
•
Containers—lists containers by name
•
Files—lists the number of files in each container
•
File type— lists the connection type per container:
•
–
Network File System (NFS)
–
Common Internet File System (CIFS)
–
OpenStorage Transport (OST)
Replication status—lists the current replication state per container:
–
Not Configured
–
Stopped
–
Disconnected
–
Trying to Connect
–
Online
–
N/A
–
Marked for Deletion
NOTE: For newly created OST containers, the Replication status displays N/A. When replication data has been
deleted from an existing OST container, the Replication status also displays N/A. For existing containers that are in
the process of deleting a large amount of data, the Replication status displays Marked for Deletion to indicate that
the data deletion process has not yet completed.
59
NOTE: Use Select to identify the container on which you want to perform an action. For example, click Select, and
click Display Statistics to display the Statistics: Container page for the container you selected.
Replication Page
To display the Replication page, click Storage → Replication. The Replication page displays the number of source
replications, the names of the local and remote containers, the peer state, and the bandwidth selected per container.
The Replication page lets you perform the following tasks:
•
•
•
•
•
Create a new replication relationship (source and target pair) and select the type of encryption to use
Edit or delete an existing replication relationship
Start or stop replication between a replication pair
Set the bandwidth (or speed limit) for the replication process
Display statistics for an existing replication relationship
The Replication page contains a Replication summary table that lists the following replication-related information:
•
•
•
•
•
Local Container Name—local container name (IP address or hostname)
Role—source or target in the replication process
Remote Container Name—remote container name (IP address or hostname)
Peer State—Online, Offline, Paused, or Disconnected
NOTE: When started, the Peer State displays the status as Online for the selected container. When
stopped, the Peer State initially displays the status as Paused, and then changes to Offline.
Bandwidth—settings include Kibibytes per second (KiB/s), Mebibytes per second (MiB/s), Gibibytes per second
(GiB/s), or default (an unlimited bandwidth setting)
NOTE: Click Select to identify the replication relationship on which you want to perform an action. For
example, click Select→ Display Statistics to display the Statistics: Replication page for the container you
selected. For more information, see Statistics: Replication Page.
Compression Level
To display the Compression Level page, click Storage → Compression Level . This page lets you set or edit the data
compression level that you want used on all of the incoming data that is to be backed up and deduplicated by the DR
Series system. Select a compression level setting using either of these options based on your preferences:
•
•
Fast—provides a shorter time doing backups—this choice results in less space savings (this is the default
setting).
Best—provides the highest space savings—this choice results in a longer time doing backups.
For more information, see Configuring Compression Level Settings.
Clients
To display the Clients page, click Storage → Clients. This page displays the total number of clients that are connected to
the DR Series system, which can be a combination of NFS, CIFS, and OST clients, and this total is listed above the three
Client tabs (NFS, CIFS, and OST tabs).
In addition, depending upon the tab type you select, the number of clients for each connection type is displayed. For
example, in the Clients page, if the OST tab is selected, this displays the number of current OST clients that correspond
to this type (OpenStorage Technology or OST clients) that are connected to the system, and provides the following
information client-related information:
60
•
Number of OST Clients—lists number of OST clients
•
Name—lists each client by name
•
Plug-In—lists the plug-in type installed on each client
•
Backup Software—lists the backup software used with each client
•
Idle Time—lists the idle time (non-activity) for each client
•
Connection—lists the number of connections for each client
•
Mode—lists the current mode type for each client
To perform one of the possible actions on a client, click Select to identify the client, and then click the desired option (for
example, the OST tab provides three options: Update Client, Edit Password, or Download Plug-In. For more information
about using this page and its tabs, see Clients Page (Using the NFS or CIFS Tab) or Clients Page (Using the OST Tab).
Clients Page (Using the NFS or CIFS Tab)
To display the Clients page, click Storage→ Clients. This page displays the total number of clients that are connected to
the DR Series system, and this number reflects all of the clients based listed under the Clients tabs (NFS, CIFS, and OST).
Using this page and the NFS or CIFS tab lets you perform the following tasks for NFS or CIFS clients (for information
about OST clients, see Clients Page (Using the OST Tab)). The Clients page displays a summary of the NFS (or CIFS)
clients, and lists the following types of NFS and CIFS client-related information:
•
Number of NFS (or CIFS) Clients—lists number of NFS (or CIFS) clients
•
Name—lists each client by name
•
Idle Time—lists idle time (non-activity) for each client
•
Connection Time—lists connection time for each client
Clients Page (Using the OST Tab)
To display the Clients page, click Storage→ Clients. This page displays the total number of clients that are connected to
the DR Series system, and this number reflects all of the clients based listed under the Clients tab (NFS, CIFS, and OST).
Using this page and the OST tab lets you perform the following tasks for OST clients:
•
Update a client (you are limited to modifying the mode type)
•
Edit a client password
•
Download a client plug-in
This page displays an OST Clients Summary table that lists the following types of OST client-related information:
•
Name—lists client by name
•
Plug-In—lists plug-in type that is installed on the client
•
Backup Software—lists backup software used with this client
•
Idle Time—lists the idle time for this client
•
Connection—lists the number of connections for this client
•
Mode—lists the mode types that can be set for this client:
–
Auto
–
Passthrough
–
Dedupe (deduplication)
61
NOTE: If an OST client has four or more CPUs, it is considered to be dedupe-capable. However, the OST
client operating mode depends upon how it is configured in the DR Series system (Dedupe is the default
OST client mode). If the administrator did not configure an OST client to operate in a specific mode and it is
dedupe-capable, it will run in the Dedupe mode. If an OST client is not dedupe-capable (meaning the OST
client has less than four CPUs), and the administrator sets it to run in the Dedupe mode, it will only run in
the Passthrough mode. If an OST client is set to run in Auto mode, the OST client will run in the mode
setting determined by the media server. The following table shows the relationship between the configured
OST client mode types and the supported client mode based on client architecture type and corresponding
number of CPUs.
Table 3. Supported OST Client Modes and Settings
OST Client Mode
Settings
32–Bit OST Client (4
or more CPUs)
64–Bit Client (4 or
more CPUs)
32–Bit OST Client
(Less than 4 CPUs)
64–Bit OST Client
(Less than 4 CPUs)
Auto
Passthrough
Dedupe
Passthrough
Passthrough
Dedupe
Not Supported
Supported
Not Supported
Not Supported
Passthrough
Supported
Supported
Supported
Supported
NOTE: Click Select to identify the OST client on which you want to perform an action. For example, click Select →
Download Plug-In to display the Download Plug-Ins page for the client you selected with the following choice:
•
Linux (64–bit), Red Hat Enterprise Linux (RHEL), versions 5.6 and 6
•
SUSE (64–bit), SUSE Linux Enterprise Server (SLES), versions 10 and 11
•
Windows (32–bit), Windows Server 2003 (SP2) and Windows Server 2008
•
Windows (64–bit), Windows Server 2008, Release 2
About the Schedules Page and Options
To display the Schedules page, click Dashboard → Schedules . This page displays any existing Replication or Cleaner
operations that have been set up for the DR Series system. If no times are listed, this indicates there are no scheduled
Replication or Cleaner operations. The Replication and Cleaner operations will automatically run whenever the DR
Series system detects a window of inactivity when there are no other major system operations running.
NOTE: Replication schedules can only be set on individual replication-enabled source containers.
The Schedules page lets you create a new schedule for running Replication or Cleaner operations, or you can modify an
existing schedule for either of these operations. For more information about scheduling Replication or Cleaner
operations, see Creating a Cleaner Schedule and Creating a Replication Schedule.
NOTE: Cleaner operations are system processes that reclaim disk space from containers where files were deleted.
When no Cleaner schedule is set, the Cleaner process will run as needed.
The Schedules page displays the following:
•
System Time Zone: using the following format (US/Pacific, Tue May 1 10:33:45 2012)
•
Scheduled Replication operations: with day of the week (Sunday through Saturday), start time, and stop time
•
Scheduled Cleaner operations: with day of the week (Sunday through Saturday), start time, and stop time
NOTE: Schedules only control the source container in scheduled Replication operations; the target container is
passive in these operations.
Setting a Replication Schedule
To set a Replication schedule from the Schedules page, complete the following:
62
NOTE: Replication schedules can only be set on individual replication-enabled source containers.
NOTE: Starting with Release 2.0, the DR Series system software includes version checking that limits replication
only between other DR Series systems that run the same system software release version (DR Series systems
running Release 2.0.x software can only replicate with other DR Series systems that run the same release system
software). For example, Release 2.0.x systems will not be able to replicate with Release 2.1 or Release 3.0 systems,
but can replicate with systems running Release 2.0.0.1 or 2.0.0.2.
1.
Click Replication on the options bar, which displays the Replication Schedule page.
Another method to display the Replication Schedule page, click Schedules → Replication Schedule.
2.
In Container, select a replication-enabled source container form the drop-down list.
3.
Click Schedule to display the Set Replication Schedule window, and enter a Start Time and Stop Time (using the
hour and minute pull-down lists) for each day of the week you want replication to be scheduled.
For more information about Replication schedules, see Creating a Replication Schedule.
NOTE: If either the Create or Edit Schedule options are disabled (grayed out), this means that there is no
replication-enabled source container on which you can create a Replication schedule. You must first create a
source container that can be replicated. For more information, see Creating Replication Relationships.
Setting a Cleaner Schedule
To set up a Cleaner schedule on the Schedules page, complete the following:
NOTE: For more information about setting a new or modifying an existing Cleaner schedule, see Creating a Cleaner
Schedule.
1.
Click Schedules→ Cleaner Schedule in the navigation panel, or click Cleaner on the Schedules page to display the
Cleaner Schedule page.
2.
If there is no Cleaner schedule, click Schedule to display the Set Cleaner Schedule window, and enter the Start
Time and Stop Time (using the hour and minute pull-down lists) for each day of the week being scheduled.
If there is an existing Cleaner schedule that you want to modify, click Edit Schedule and make your changes.
About the System Configuration Page and Options
To display the System Configuration page, click Dashboard → System Configuration . The System Configuration page
displays the current DR Series system configuration information in the following panes:
•
•
•
•
•
•
•
Networking
Active Directory
Local Workgroup Users
Email Alerts
Admin Contact Info
Email Relay Host
Date and Time
NOTE: Each pane title in the System Configuration page serves as a link. To display the corresponding page that
provides more detailed information and the related options you can use, click the pane title link. For example, to
display the Date and Time page, click the Date and Time pane title link.
The System Configuration page provides three options that let you:
•
Edit the current system password
63
•
•
Shut down the system
Reboot the system
The System Configuration page provides the means for managing configuration settings for the Networking, Active
Directory, Local Workgroup Users, Email Alerts, Admin Contact Info, Email Relay Host, and Date and Time pages in the
system.
NOTE: For example, to manage the date and time configuration settings, click Date and Time to display the Date
and Time page. You can then add or edit the following date and settings: Mode, Time Zone, and Date and Time. If
the DR Series system is part of a workgroup and not joined to a Microsoft Active Directory Services (ADS) domain,
you will also be able to add or edit the Network Time Protocol (NTP) servers associated with the system. However,
when the DR Series system is joined to a domain, the NTP Servers setting on the Date and Time page is disabled
and is not displayed.
NOTE: Dell recommends using NTP servers when the DR Series system will be running as part of a workgroup and
not joined to a domain. The use of NTP servers as a reference time source is disabled when the DR Series system
is joined to a domain.
System Configuration Page and Options
To display the System Configuration page, click Dashboard → System Configuration . This page displays the following
pane title-enabled links that allow you to display more detailed system configuration information for the following
categories:
•
•
•
•
•
•
•
Networking
Active Directory
Local Workgroup Users
Email Alerts
Admin Contact Info
Email Relay Host
Date and Time
Networking
The Networking pane displays the currently configured Mode, Hostname, IP Address, Bonding, Domain Suffix, and
Primary DNS settings for the DR Series system. The Networking pane title acts as a link to the Networking page:
•
This page lists the Hostname, IP Address, DNS, Bonding, and installed NICs. The Networking page provides Edit
Hostname, Edit IP Address, Edit DNS, Edit Bonding, and Edit MTU options.
Active Directory
The Active Directory pane displays the current status of the Domain Name for the DR Series system (not configured or
listing the configured domain name). The Active Directory pane title acts as a link to the Active Directory page:
•
This page contains a Settings and a CIFS Container Share Path pane. The Settings pane lists the configuration
status, and lists the FQDN domain name (Fully Qualified Domain Name) of the Microsoft Active Directory
Services (ADS) domain. The CIFS Container Share Path pane lists the current CIFS container share path
locations. The Active Directory page provides the Join and Leave options.
Local Workgroup Users
The Local Workgroup Users pane displays the current configured local workgroup users (CIFS) for the DR Series
system. The Local Workgroup Users pane title acts as a link to the Local Workgroup Users (CIFS) page:
•
64
This page lists the configured local CIFS users by user name that belongs to the local workgroup in the DR
Series system. The Local Workgroup Users (CIFS) page provides the Create, Edit, and Delete options (by which
you manage the users that belong to this local workgroup. To edit or delete an existing local workgroup user,
click Select to identify the local user you wish to modify or delete.
Email Alerts
The Email Alerts pane displays the current number of email notification recipients configured for the DR Series system.
The Email Alerts pane title acts as a link to the Email Alerts page:
•
This page lists all currently configured recipient email addresses. The Email Alerts page provides Add, Edit,
Delete, and Send Test Message options. To create an email recipient, click Add to display the Add Recipient
Email Address dialog, in Email Address enter a valid email address for your email system, and click Submit. To
edit or delete an existing email recipient, click Select to identify the email recipient in which you wish to modify,
delete, or send a test message.
Admin Contact Info
The Admin Contact Info pane displays the current information associated with the administrator configured for the DR
Series system. The current information is contained in the Contact Information and Notification panes. The Contact
Information pan includes the Contact Information, Company Name, Email, Work Phone, and Comments categories. The
Notification pane displays the status of the DR Series system appliance alerts and system software updates (disabled or
enabled). The Admin Contact Info pane title acts as a link to the Administrator Contact Information page:
•
This page contains contact information for the DR Series system administrator and is sent with all system alert
email messages. The Administrator Contact Information page provides the Add Contact Information option
(which after you configure it, this option changes to Edit Contact Information). Click the Edit Contact Information
option to display the Edit Administrator Contact Information dialog where you can enter information or select a
check box:
–
Administrator Name
–
Company Name
–
Email
–
Work Phone
–
Comments
–
Notify me of DR4000 appliance alerts
–
Notify me of DR4000 software updates
Email Relay Host
The Email Relay Host pane displays the current email relay host configured for the DR Series system. The Email Relay
Host pane title acts as a link to the Email Relay Host page:
•
This page lists the configured email relay host by its IP address or hostname that is responsible for email in the
DR Series system. The Email Relay Host page provides the Add Relay Host option (which after you configure it,
this option changes to Edit Relay Host).
Date and Time
The Date and Time pane displays the current Mode configured for the DR Series system (Manual or NTP), the current
Time Zone, and the current Date and Time (in mm/dd/yy hh:mm:ss format, for example: 12/11/12 14:58:22 PST). The Date
and Time pane title acts as a link to the Date and Time page:
•
This page contains a Settings pane that lists the Mode used. The system uses Network Time Protocol (NTP)
servers if the system is part of a workgroup and not joined to an Active Directory Services (ADS) domain. If the
system is joined to an ADS domain, then the NTP servers setting is disabled and the system uses the ADS
domain time. The Settings pane also displays the current Time Zone, and current Date and Time. The Date and
Time page provides the Edit option for changing the date and time settings.
65
NOTE: Dell recommends using the Network Time Protocol (NTP) servers when the DR Series system is part of a
workgroup and not part of a domain. The NTP time mode is disabled when the DR Series system is joined to an
Active Directory Services (ADS) domain. Any attempt to enable the NTP time mode when you are joined to an ADS
domain displays an error message indicating this is not possible.
Understanding the System Configuration Page Options
The System Configuration page contains three key system options:
•
Edit Password
•
Shutdown
•
Reboot
Edit Password
Edit Password—click this option to display the Edit Password dialog, where you can change the login password for the
DR Series system
NOTE: To change CIFS login credentials, you can use the DR Series system CLI command, authenticate –set –user .
For details, see the Dell DR Series System Command Line Reference Guide.
NOTE: Editing your existing login password is different than resetting your login password. Click Edit Password in
the System Configuration page to edit your login password to reflect any value that meets the system password
requirements (for more information, see Modifying the System Password. Click Reset Password in the Login page
to reset your login password to the system default value, which requires you to provide the service tag for your
system. For more information, see Resetting the Default System Password.
Shutdown
Shutdown—click this option to display the Shutdown System dialog, where you can shut down the DR Series system.
CAUTION: Shutdown powers Off the appliance on which the system software is installed. Once in a powered Off
state, you can power it On at its physical location or using an iDRAC configuration to the system.
Reboot
Reboot—click this option to display the Reboot System dialog, where you can reboot the DR Series system.
Support Page and Options
Click Dashboard → Support to display the Support page. The Support page displays the current support-related
information for your system in the Support Information pane:
NOTE: The exact number of Ethernet listings (MAC and Speed) displayed depend upon the number and type of
Ethernet ports installed in your system. For example, the DR4000 system can support up to four 1–GbE ports or up to
two 10–GbE ports, and the DR4100 system can support up to six 1–GbE ports (four internal 1–GbE ports on the
network daughter card and two 1–GbE ports on a PCI Express expansion card) or two 10–GbE ports. The following
example shows four ports (eth0 through eth3).
66
•
Product Name
•
Software Version
•
Service Tag
•
Last Diagnostic Run
•
BIOS Version
•
MAC Address
•
iDRAC IP Address
•
eth0 MAC
•
eth0 Speed
•
eth1 MAC
•
eth1 Speed
•
eth2 MAC
•
eth2 Speed
•
eth3 MAC
•
eth3 Speed
In addition, this page provides options for supporting, upgrading, and licensing additional storage for your DR Series
system: Diagnostics, Software Upgrade, and License. For more information, see Understanding the Support Page
Options.
Understanding the Support Page Options
The Support page displayed in the navigation panel provides three important options (Diagnostics, Software Upgrade,
and License). These three options allow you to perform the following tasks:
•
Generate, download, or delete diagnostics log files
•
Upgrade a later version of the DR Series system software
•
Install the license file for any added data storage expansion shelf
Diagnostics
Diagnostics—click this option to display the Diagnostics page, where the number of diagnostics are listed by file name,
size, time, and date that the diagnostics log bundle was generated, the reason the diagnostics log bundle was created,
and its status. The Diagnostics page provides the Generate, Download, and Delete options.
The diagnostics bundle of log files are used by Dell Support to diagnose system conditions that you report or are
detected as issues during DR Series system operations.
NOTE: Click Select to identify the diagnostics log file on which you want to perform an action. For example, click
Select → Download to display the File Download dialog for the diagnostics log file you selected for downloading.
NOTE: The diagnostics bundles can be generated in two modes: admin-generated and auto-generated. In the latter
mode, when a process or service failure is detected, the DR Series system starts collecting system-related
information as a background task. Once the collection has completed, the DR Series system generates a system
event. If diagnostics bundles are being generated frequently without an administrator request, you may want to
contact Dell Support for assistance.
For more information about the Diagnostics page and Diagnostics service, see Diagnostics Page and Options, and About
the Diagnostics Service.
Software Upgrade
Software Upgrade—click this option to display the Software Upgrade page, where there are two panes: the Upgrade
File Location and Software Information. The Software Upgrade page allows you navigate to and locate the software
upgrade file. Once located, click Start Upgrade to start the upgrade process, or view the current version and upgrade
history for the DR Series system. The Start Upgrade page provides the Reboot option.
NOTE: When preparing to perform a software upgrade for the DR Series system, the software upgrade file must be
downloaded and be locally accessible from the system running the DR Series system GUI.
67
For more information about system software upgrades, see Software Upgrade Page and Options.
License
License—click this option to display the License page, where there are two panes: License File Location and Number of
Installed Licenses. The License page is where you locate the corresponding license file for the installed data storage
expansion shelf.
In the License File Location pane, enter the location on the local disk (or a known network location) where the expansion
shelf license file has been downloaded (typically, it is /store/license), or click Browse... to navigate to another directory/
folder path location where the license file (license.xml) resides. Once located, click Install License to install and validate
the license file for the installed data storage expansion shelf.
After installing and validating the license file, the License page displays a License file has been successfully installed
dialog, and the Number of Installed Licenses summary table is updated with the new license file you just installed. The
Number of Installed Licenses pane contains a summary table that lists and identifies each installed license by ID,
description, entitlement ID, and current status.
For more information about the supported data storage expansion shelf or the licenses needed for an expansion shelf,
see Expansion Shelf Licenses and Installing an Expansion Shelf.
Expansion Shelf Licenses
This topic introduces the license required for adding external data storage in the form of Dell MD1200 storage arrays
that are referred to as expansion shelf enclosures. Expansion shelf enclosures allow you to add supplemental data
storage capacity to support DR Series system operations. The DR Series system supports up to maximum of two
enclosures per system, and any expansion shelf enclosure that is added must be equal to or greater than each DR
Series system internal drive slot capacity (0–11). Expansion shelf enclosures can be added to the internal data storage
to create up to 9, 18, or 27 Terabyte (TB) hard drive capacities, and expansion shelf enclosures can be added in 1 TB, 2
TB, or 3 TB capacities. Licenses define the expansion shelf enclosure size in a license = size format (for example, shelf =
18TB), and licenses are added on a per-shelf basis.
Table 4. Expansion Shelf Capacities in the DR Series System
System/Expansion Shelf Enclosure Size
600 Gigabyte (GB) expansion shelf
1 TB expansion shelf
2 TB expansion shelf
3 TB expansion
Maximum Data Storage Capacity Options
•
•
•
9 TB
18 TB
27 TB
•
•
•
9 TB
18 TB
27 TB
•
•
18 TB
27 TB
•
27 TB
Licenses
Adding an expansion shelf enclosure requires that you order a license for each enclosure from a Dell Account
representative at the time that you order the DR Series system. You can also order this at a later date when you want to
add additional external storage to your base DR Series system. To obtain the license, you can download it from the
support.dell.com/ website using your service tag or use an email link from your Dell Account representative.
If you already have a Dell MD1200 storage array, the order process supports licensing for existing hardware that you
want to add to a base DR Series system. Each license supports one expansion shelf enclosure, and the system supports
68
up to two enclosures using the DR Series system service tag. Because the licenses are tied to the system service tag, if
the internal drives are moved to another system chassis, this would require a new license. For more information about
the expansion shelf enclosures, see “DR Series Expansion Shelf” in DR Series System and Data Operations.
NOTE: The 300 Gigabyte (GB) drive capacity (2.7 TB) version of the DR Series system does not support the addition
of expansion shelf enclosures to add external storage to the base system.
Installing an Expansion Shelf License
Make sure that you have located the license for expansion shelf prior to attempting to install and validate it.
To install a license for an expansion shelf for the DR Series system, complete the following:
NOTE: The 300 Gigabyte (GB) drive capacity (2.7 TB) version of the DR Series system does not support the addition
of expansion shelf enclosures.
1.
In the navigation panel, select Support → License (or double-click License).
The License page is displayed, showing a License File Location pane and a Number of Installed Licenses pane.
2.
In the License File Location pane, enter the path where the license file resides (typically, this is /store/license), or
click Browse... to navigate to the license file location.
3.
Click Install License and follow all prompts.
If successful, a License has been successfully installed dialog is displayed, and the new license appears in the
Number of Installed Licenses pane. The Number of Installed Licenses pane list the total number of installed
licenses, and defines each installed license by ID. a brief description, an entitlement ID (license tag), and the status
of the license.
69
70
Configuring the DR Series System Settings
4
This topic introduces the concept that before you can run any DR Series system operations, you first need to understand
the following key tasks:
•
how to initialize the system
•
how to shut down or reboot the system
•
how to manage the system password
Initializing the DR Series system requires that you configure and manage a number of very important system settings.
NOTE: Dell recommends that you use the Initial System Configuration Wizard to configure your DR Series system.
Changing some of the system settings using the DR Series system GUI (such as bonding, MTU, hostname, IP
address, and DNS) can cause issues that may affect your DR Series system GUI access.
For more information about initializing the system, see Initializing the DR Series System.
For more information about shutting down or rebooting the system, see Shutting Down the DR Series System and
Rebooting the DR Series System.
For more information about managing the system password, see Managing the DR Series System Password.
Configuring Networking Settings
You can configure the networking settings that were configured using the Initial System Configuration Wizard process
for the DR Series system in the following panes:
NOTE: For the Ethernet port settings on the NICs, this example only shows Eth0 and Eth1 (depending upon your
system configuration, you could have NICs configured with Ethernet port settings in the Eth0–Eth5 range). The
DR4000 system supports up to four 1–GbE ports or up to two 10–GbE ports, while the DR4100 system supports up to
six 1–GbE or up to two 10–GbE ports. For more information, see Local Console Connection.
•
Hostname
•
IP Address
•
•
–
Mode (IP address used (static IP or DHCP addressing)
–
Netmask
–
iDRAC IP address
–
System IP address
–
Gateway IP address
DNS
–
Domain Suffix
–
Primary DNS
–
Secondary DNS
Bonding
–
Device
71
•
•
–
Mode
–
MAC Address
–
MTU (maximum transmission unit)
–
Bonding Option
–
Slave Interfaces
Eth0
–
MAC
–
Maximum Speed
–
Speed
–
Duplex
Eth1
–
MAC
–
Maximum Speed
–
Speed
–
Duplex
To configure new networking settings (or to change from those set using the Initial System Configuration Wizard),
complete the following:
1.
Select System Configuration → Networking.
The Networking page is displayed. Select settings for hostname, IP Address, DNS, Bonding, or to view the Ethernet
port settings (Eth0-Eth3) for the DR Series system.
–
If you need to configure hostname, skip to step 2.
–
If you need to configure IP addressing, skip to step 4.
–
If you need to configure DNS, skip to step 7.
–
If you need to configure bonding, skip to step 10.
–
If you need to configure MTU, skip to step 13.
–
–
2.
To change the current Hostname, click Edit Hostname on the options bar.
The Edit Hostname dialog is displayed.
3.
4.
Type a hostname in Hostname that meets the following supported character types and length:
–
Alphabetic—allows A-Z, a-z, or a combination of upper and lower case alphabetic characters.
–
Numeric—allows numerals zero (0) through 9.
–
Special characters—allows only the dash (-) character.
–
Length limit—hostnames cannot exceed the maximum length of 19 characters.
–
When satisfied with the new hostname, click Submit to set the new hostname for your system.
To change the current IP address settings, click Edit IP Address on the options bar.
The Edit IP Address dialog is displayed.
5.
Enter or modify the following values in the Edit IP Address dialog:
–
72
In Mode, select Static (to set static IP addressing for your system), or select DHCP (to set dynamic IP
addressing for your system).
6.
NOTE: To select the DHCP mode of IP addressing, select DHCP, and click Submit. The remaining
substeps in this step only need to be completed if you selected the Static mode of IP addressing for
the DR Series system.
– In New IP Address, type an IP address that represents the new IP address for your system.
– In Netmask, type an netmask address value that represents your system (the system IP address and
netmask identify the network to which your system belongs).
– In Gateway, type an IP address for the gateway associated with your system.
Click Submit to have the DR Series system accept the new values (or click Cancel to display the Networking page).
The Updated IP Address dialog is displayed when the selection is successful (if you change the static IP address
manually, you need to use this IP address in the browser when you log back into the DR Series system).
7.
To configure DNS settings for your system, click Edit DNS on the options bar.
8.
Configure the following values in the Edit DNS page:
The Edit DNS dialog is displayed.
–
–
9.
In Domain Suffix, type a domain suffix to use (for example, acme.local); this is a required field.
In Primary DNS, type an IP address that represents the primary DNS server for your system; this is a
required field.
– For Secondary DNS, type an IP address that represents the secondary DNS server for your system; this is
an optional field.
Click Submit to have the DR Series system accept the new values (or click Cancel to display the Networking page).
The Updated DNS dialog is displayed when the selection is successful.
10. To configure Bonding settings for your system, click Edit Bonding on the options bar.
The Edit Bonding dialog is displayed.
11. Select the Bonding configuration for the system by choosing one of the following options from the Bonding config
list:
–
ALB—configures adaptive load balancing (ALB), which is the default setting.
–
NOTE: ALB load balancing does not balance the load properly when your backup servers are on a
remote subnet. This is because ALB uses the address resolution protocol (ARP) and ARP updates are
subnet-specific. Because this is the case, ARP broadcasts and updates are not sent across the
router. Instead, all traffic is sent to the first interface in the bond. To resolve this ARP-specific issue,
make sure that your data source systems reside on the same subnet as the DR Series system.
802.3ad—configures dynamic link aggregation using the IEEE 802.ad standard.
CAUTION: If you change the existing bonding setting, the connection to the DR Series system may be
lost unless you are sure that the system can accept this bonding type.
12. Click Submit to have the DR Series system accept the new values (or click Cancel to display the Networking page).
The Updated Bonding dialog is displayed when the selection is successful.
13. To configure a maximum transmission unit (MTU) setting for your system, click Edit MTU on the options bar.
The Edit MTU dialog is displayed.
NOTE: In computer networking, jumbo frames are Ethernet frames with more than 1500 bytes of payload (but
in some cases, jumbo frames can carry up to 9000 bytes of payload). Many Gigabit Ethernet switches and
Gigabit Ethernet network interface cards support jumbo frames. Some Fast Ethernet switches and Fast
Ethernet network interface cards also support jumbo frames.
Some computer manufacturers use 9000 bytes as the conventional limit for jumbo frame sizes. To support jumbo
frames used in an Internet Protocol subnetwork, both the host DR Series system (initiator or source) and the target
DR Series system have to be configured for 9000 MTU.
Consequently, interfaces using a standard frame size and those using the jumbo frame size should not be in the
same subnet. To reduce the chance of interoperability issues, network interface cards capable of supporting jumbo
frames require specific configurations to use jumbo frames.
73
To verify that the destination system can support a specific frame size, use the DR Series system CLI command
network --ping --destination <IP address> --size <number of bytes>.
For more information, contact Dell Support for assistance (for details, see Contacting Dell).
NOTE: Make sure that if you are using any Dell network switches that you take full advantage of the latest
switch firmware upgrades and application notes. The application notes provide procedures that assist you in
performing switch firmware upgrades and saving configuration files (for complete details, see
support.dell.com/ and navigate to Drivers and Downloads for your system type).
14. In MTU, type the value you want to set as the maximum.
NOTE: When setting or changing the MTU value, make sure that you verify that the Ethernet network switch is
capable of supporting an MTU size that is equal to or larger than the value you are setting. Any mismatch in
MTU values between the clients, Ethernet network switch, and the DR Series system appliance will make it
inoperable.
Dell suggests that you observe standard best practices when deploying jumbo frames in networks, and
recommends using jumbo frames with the DR Series system because this frame size typically provides the best
performance. However, for networks that do not support jumbo frames, the DR Series system also supports using
the standard frame size.
15. Click Submit to configure the MTU option for your system (or click Cancel to display the Networking page).
The Updated MTU dialog is displayed when the selection is successful.
Networking Page and Ethernet Port Values
The Networking page displays the currently configured multiple Ethernet ports for the DR Series system in a series of
panes. For 1–Gigabit Ethernet (GbE) ports in the DR4000 system this could be Eth0, Eth1, Eth2, and Eth3, and in the
DR4100 system this could be Eth0, Eth1, Eth2, Eth3, Eth4, and Eth5. For 10-GbE/10-GbE SFP+ NICs, this means that the two
ports are bonded together into a single interface. For example, the DR Series system port configuration is as follows:
•
In a 1-GbE NIC configuration: the DR4000 system supports up to four 1–GbE ports, which consists of up to two
internal LAN on Motherboard (LOM) ports and two ports on an expansion card that are bonded together. The
DR4100 system supports up to six 1–GbE ports, which consists of up to four internal LOM ports on the network
daughter card (NDC) and two ports on a PCI Express expansion card.
•
In a 10-GbE or 10-GbE SFP+NIC configuration: the DR4000 system supports up to two 10–GbE or 10–GbE SFP+
ports on an expansion card that are bonded together. The DR4100 system supports up to two 10-GbE or 10-GbE
SFP+ ports that reside on the NDC that are bonded together.
The ports for bonded NICs display: MAC address, port speed in megabtyes per second (MB/s), maximum speed, and
duplex setting. The following example shows Ethernet port values for the four ports in a 1-GbE NIC bonded configuration
on a DR4000 system:
Eth0:
•
MAC: 00:30:59:9A:00:96
•
Speed: 1000Mb/s
•
Max Speed: 1000baseT/Full)
•
Duplex: Full
Eth1:
74
•
MAC: 00:30:59:9A:00:97
•
Speed: 1000Mb/s
•
Max Speed: 1000baseT/Full
•
Duplex: Full
Eth2:
•
MAC: 00:30:59:9A:00:98
•
Speed: 1000Mb/s
•
Max Speed: 1000baseT/Full
•
Duplex: Full
Eth3:
•
MAC: 00:30:59:9A:00:99
•
Speed: 1000Mb/s
•
Max Speed: 1000baseT/Full
•
Duplex: Full
Managing the DR Series System Password
You can manage the login password that is used when logging in to the DR Series system in two ways:
•
By modifying the existing login password using the Edit Password option in the System Configuration page. For
more information, see Modifying the System Password.
•
By resetting the login password to its default value using the Reset Password option in the DR Series System
Login page. For more information, see Resetting the Default System Password.
Modifying the System Password
To configure a new password or to modify an existing password for logging in to the DR Series system, complete the
following:
1.
In the navigation panel, select System Configuration.
The System Configuration page is displayed.
2.
Click Edit Password on the System Configuration page options bar.
The Edit Password dialog is displayed.
3.
In Current password, type the current password for the system.
4.
In New password, type the new password that will replace the current system password.
5.
In Confirm password, retype the new password to confirm this as the new password replacing the existing system
password.
6.
Click Change Password (or click Cancel to display the System Configuration page).
If successful, a Password change was successful dialog is displayed.
Resetting the Default System Password
To reset the system to use the default password (St0r@ge! ) for logging in, complete the following:
1.
In the Login window, click Reset Password.
The Reset Password dialog is displayed.
2.
In Service Tag, type the service tag associated with your system, and click Reset Password.
NOTE: If you are unsure of the service tag associated with your DR Series system, it can be found on the
Support page (click Support in the navigation panel to display the Support Information pane, which displays
the service tag).
75
The Login window is displayed, and a Password has been reset dialog is displayed.
3.
To login using the default password, type St0r@ge! , and click Login.
NOTE: After you have reset the login password to its default and logged in to the DR Series system, Dell
recommends for security reasons that you create a new unique login password.
Shutting Down the DR Series System
If needed, you can shut down the DR Series system by selecting Shutdown in the System Configuration page. However,
you should fully understand what this action means to system operations before attempting to shut down the system.
CAUTION: Shutdown powers Off the appliance on which the DR Series system software is installed. Once powered
Off, you can only power it On again at its physical location, or you must use an iDRAC connection to the DR Series
system.
To shutdown your DR Series system, complete the following:
1.
In the navigation panel, select System Configuration.
The System Configuration page is displayed.
2.
Click Shutdown on the System Configuration page options bar.
The Shutdown confirmation dialog is displayed.
3.
Click Shutdown System to proceed with shutting down the system (or click Cancel to return to the System
Configuration page).
Rebooting the DR Series System
If needed, you can reboot the DR Series system by selecting the Reboot option in the System Configuration page. To
reboot your system:
1.
In the navigation panel, select System Configuration.
The System Configuration page is displayed.
2.
Click Reboot on the System Configuration page options bar.
The Reboot System confirmation dialog is displayed.
3.
Click Reboot System to proceed with rebooting the system (or click Cancel to return to the System Configuration
page).
The System has successfully rebooted dialog is displayed after rebooting (system reboot may take up to 10 minutes
to complete).
Configuring Compression Level Settings
You can configure the data compression that you want used on all incoming data to be backed up and deduplicated by
the DR Series system.
NOTE: This is a global compression level setting for your system. After making a compression level setting change,
the change only affects the new incoming data (which is written using the new setting). All existing data on the
system remains in the setting in effect when it ingested (it is not rewritten using the new compression level
setting).
Configure the compression level setting on the Compression Level page by selecting from the following choices:
•
76
Fast—(default) when selected, system backups are performed faster than if Best was selected. However, using
this setting results in a corresponding reduction in space savings.
•
Best—when selected, system backups gain the highest overall space savings. However, using this setting
results in a corresponding longer time to complete the backup process.
To configure the Compression Level setting for your system, complete the following:
1.
Select Storage → Compression Level.
The Compression Level page is displayed.
2.
To configure a Compression Level setting, click Edit on the options bar.
The Compression Level Settings dialog is displayed.
3.
In the Compression Level list, choose the compression level type you want to use for all incoming data: Fast or
Best.
4.
Click Set Compression Level to configure the system using this setting (or click Cancel to display the Compression
Level page).
The Updated Compression dialog is displayed when the selection is successful.
NOTE: The compression level setting you configure for your system is a global setting. Once you have made a
compression level setting change, the change will only affect the new incoming data (which is written using
the new setting). All existing data on the system remains in the previous setting that was in effect when it
ingested (it is not rewritten using the new compression level setting). The checksum is performed on the new
incoming data so changing the compression settings will not affect the storage capacity of the system in any
negative way.
Configuring Active Directory Settings
You need to configure the Active Directory setting to direct your DR Series system to join or leave a domain that
contains a Microsoft Active Directory Service (ADS). To join an ADS domain, complete steps 1 through 4 in the following
procedure (to leave an ADS domain, skip to step 5). When you join the DR Series system to an ADS domain, this disables
the Network Time Protocol (NTP) service and instead uses the domain-based time service.
To configure the DR Series system for a domain using ADS, complete the following:
1.
Select System Configuration → Active Directory.
The Active Directory page is displayed.
NOTE: If you have not yet configured ADS settings, an informational message is displayed in the Settings pane
in the Active Directory page.
2.
Click Join on the options bar.
The Active Directory Configuration dialog is displayed.
3.
Type the following values in the Active Directory Configuration dialog:
–
In Domain Name (FQDN), type a fully qualified domain name for the ADS; for example, AD12.acme.com.
(This is a required field.)
NOTE: Supported domain names are limited to 64 characters in length and can only consist of a
combination of A-Z, a-z, 0-9, and three special characters: a dash (-), a period (.), and an underscore
(_).
–
In Username, type a valid user name that meets the user name guidelines for the ADS. (This is a required
field.)
NOTE: Supported user names are limited to 64 characters in length and can only consist of a
combination of A-Z, a-z, 0-9, and three special characters: a dash (-), a period (.), and an underscore
(_).
–
In Password, type a valid password that meets the password guidelines for the ADS. (This is a required
field.)
77
–
4.
In Org Unit, type a valid organizational name that meets the organization name guidelines for the ADS. (This
is an optional field.)
Click Join Domain to configure your system with these ADS settings (or click Cancel to display the Active Directory
page).
The Successfully Configured dialog is displayed when successful.
NOTE: If you configure CIFS container share paths, these will be displayed in a CIFS Container Share Path
pane in the Active Directory page.
5.
To leave an ADS domain, click Leave in the Active Directory page.
The Active Directory Configuration dialog is displayed.
6.
Leaving the configured ADS domain requires that you enter the following:
a) In Username, enter a valid user name for the ADS domain.
b) In Password, enter a valid password for the ADS domain.
7.
Click Leave Domain to direct your DR Series system to leave the ADS domain (or click Cancel to display the Active
Directory page).
The Successfully Configured dialog is displayed when successful.
Configuring Local Workgroup Users Settings
You need to configure settings to create a local workgroup of CIFS authenticated users. This capability lets you create a
local workgroup (Local Workgroup Users) to which you can add new users, edit existing users, or delete users from the
workgroup.
To configure the DR Series system for a Local Workgroup Users, complete the following:
1.
Select System Configuration → Local Workgroup Users.
The Local Workgroup Users (CIFS) page is displayed.
2.
To create a new CIFS user in this local workgroup of users, click Create on the option bar.
The Create a local workgroup user for CIFS authentication dialog is displayed.
a) In User Name, enter a valid user name for this user.
b) In Password, enter a valid password for this user.
c) Click Add CIFS User to create the new user in the Local Workgroup Users for the system (or click Cancel to
return to the Local Workgroup Users (CIFS) page).
An Added CIFS user confirmation dialog is displayed when successful.
3.
To edit an existing CIFS user in this local workgroup of users, click Select to identify the user in the Local
Workgroup Users summary table that you want to modify, and click Edit in the option bar.
The Edit a local workgroup user for CIFS authentication dialog is displayed.
a) In Password, enter a different valid password for this user.
You cannot modify the User Name for this user, you can only modify the Password. If you want a user with a
different User Name, you must delete this user and create a new user with the desired User Name.
b) Click Edit CIFS User to modify the password for existing user in the Local Workgroup Users for the system (or
click Cancel to return to the Local Workgroup Users (CIFS) page).
4.
To delete an existing CIFS user from the local workgroup of users, click Select to identify the user in the Local
Workgroup Users summary table that you want to delete, and click Delete in the option bar.
The Delete user confirmation dialog is displayed.
a) Click OK to delete the selected user from the Local Workgroup Users summary table (or click Cancel to return
to the Local Workgroup Users (CIFS) page).
A Deleted CIFS user confirmation dialog is displayed when successful.
78
Configuring Email Alert Settings
You can create and manage recipient email addresses for users to which you want to send DR Series system email
alerts. The Email Alerts page contains options that let you add new, edit or delete existing recipient email addresses,
and send a test message to the recipient email addresses listed in the Recipient Email Address pane.
NOTE: The Email Alerts page contains all the options you need for managing the recipient email addresses and
testing the send message capability.
Adding a Recipient Email Address
To configure and add a new recipient email address, complete the following:
1.
Select System Configuration → Email Alerts.
The Email Alerts page is displayed.
2.
Click Add on the options bar.
The Add Recipient Email Address dialog is displayed.
3.
4.
In Email Address, type a valid email address using the address format that your email system supports.
Click Submit to configure the recipient email address (or click Cancel to display the Email Alerts page).
The Email Alerts page is displayed, and an Added email recipient dialog is displayed when successful.
5.
To create additional recipient email addresses, repeat steps 2 through 4.
NOTE: For information about sending an email alerts message to test one or more email recipients, see Sending a
Test Message.
Editing or Deleting a Recipient Email Address
To edit or delete an existing recipient email address:
1.
Select System Configuration→ Email Alerts.
The Email Alerts page is displayed.
NOTE: To edit or delete an existing recipient email address, you must first click Select in the Recipient Email
Address pane to indicate the address that you want to edit or delete. To edit an existing email address,
proceed to step 2, or to delete an existing email address, skip to step 4. For more information about adding
email recipients, see Adding a Recipient Email Address.
2.
To edit an existing recipient email address, click Select to indicate the recipient email address entry that you want
to change, and click Edit on the options bar.
The Edit Recipient Email Address dialog is displayed.
3.
Modify the existing email address you selected as needed, and click Submit.
The Email Alerts page is displayed, and a Successfully updated email recipient dialog is displayed when
successful. To edit additional recipient email addresses, repeat steps 2 and 3.
4.
To delete an existing recipient email address, click Select to indicate the recipient email address entry that you
want to delete, and click Delete on the options bar.
The Delete Confirmation dialog is displayed.
5.
Click OK to delete the selected email recipient address (or click Cancel to display the Email Alerts page).
79
The Email Alerts page is displayed, and a Deleted email recipient dialog is displayed when successful. To delete
additional recipient email addresses, repeat steps 4 and 5.
Sending a Test Message
The DR Series system provides the means for sending test messages to all configured recipient email addresses. This
process lets you manage the sending of system alert messages, at which point you can verify that all of the configured
email recipients received these messages.
NOTE: If needed, ensure that you have a configured email relay host. For more information about email relay hosts,
see Adding an Email Relay Host.
1.
Select System Configuration → Email Alerts.
The Email Alerts page is displayed.
2.
Click Send Test Message on the options bar.
The Send Test Email confirmation dialog is displayed.
3.
Click OK (or click Cancel to display the Email Alerts page).
The Email Alerts page is displayed, and a Successfully sent email dialog is displayed when successful.
4.
Verify that all of the intended recipient email addresses received the test email.
Configuring Administrator Contact Information
You can configure the administrator contact information to identify the person who is actively managing or responsible
for your DR Series system acting as its administrator. To do this, enter contact information for the administrator on the
Administrator Contact Information page using the Edit Contact Information option.
In the navigation panel on the Dashboard page, click System Configuration → Admin Contact Info to display the
Administrator Contact Information page.
For more information about contact information for the administrator, see Editing Administrator Contact Information, and
Adding Administrator Contact Information.
The following information categories are displayed in the Contact Information and Notification panes on the
Administrator Contact Information page, and this is information sent with all system alert emails:
•
•
Contact Information
–
Administrator Name
–
Company Name
–
Email
–
Work Phone
–
Comments
Notification
–
Status of Notify me of DR4000 appliance alerts check box (enabled or disabled)
–
Status of Notify me of DR4000 software updates check box (enabled or disabled)
Adding Administrator Contact Information
To configure contact information for the system administrator, complete the following:
1.
80
Select System Configuration → Admin Contact Info.
The Administrator Contact Information page is displayed.
2.
Click Add Contact Information on the options bar.
The Add Administrator Contact Information dialog is displayed.
3.
In Administrator Name, type the name of the administrator for this appliance.
4.
In Company Name, type the company name associated with the administrator.
5.
In Email, type the email address of the administrator (using the email address format that your email system
supports).
6.
In Work Phone, type the telephone number associated with the administrator.
7.
In Comments, type some information or add comments that uniquely identify this administrator.
8.
Click the Notify me of DR 4000 appliance alerts check box to be notified about system alerts.
9.
Click the Notify me of DR 4000 software updates check box to be notified about system software updates.
10. Click Submit (or click Cancel to display the Administrator Contact Information page).
The Administrator Contact Information page is displayed, and an Updated administrator contact information dialog
is displayed when successful.
Editing Administrator Contact Information
To edit the contact information for an existing system administrator, complete the following:
1.
Select System Configuration→ Admin Contact Info.
The Administrator Contact Information page is displayed.
2.
Click Edit Contact Info on the options bar.
The Edit Administrator Contact Information dialog is displayed.
3.
Modify the administrator contact information as needed in the corresponding information fields.
4.
Select the Notify me of DR Series appliance alerts check box to choose this option (or click to deselect this option if
selected).
5.
Select the Notify me of DR Series software updates check box to choose this option (or click to deselect this option
if selected).
6.
Click Submit (or click Cancel to display the Administrator Contact Information page).
The Administrator Contact Information page is displayed, and an Updated administrator contact information dialog
is displayed when successful.
Configuring an Email Relay Host
If needed, you can configure an external email relay host to serve your DR Series system if the network email system
requires one. The email relay host is typically an external mail server that relays any email alerts from the DR Series
system to each of the designated recipient email addresses.
To do this on the Email Relay Host page, click Add Relay Host to define a new email relay host (or to edit an existing
email relay host, click the Edit Relay Host) on the options bar. For more information on editing an existing email relay
host, see Editing an Email Relay Host.
Adding an Email Relay Host
To configure a new email relay host for your DR Series system, complete the following:
NOTE: To edit an existing email relay host, see Editing an Email Relay Host.
81
1.
Select System Configuration → Email Relay Host.
The Email Relay Host page is displayed.
2.
Click Add Relay Host on the options bar.
The Add Relay Host dialog is displayed.
3.
In Relay Host, type the hostname or IP address of an external mail server that will act as the email relay host for
your DR Series system.
4.
Click Submit (or click Cancel to display the Email Alerts page).
The Email Relay Host page is displayed, and an Updated external email server information dialog is displayed when
successful.
5.
Send a test message to verify that the email relay host is working properly.
For more information, see Sending a Test Message.
6.
Verify that all of the intended recipient email addresses received the test email.
Editing an Email Relay Host
To edit an existing email relay host for your DR Series system, complete the following:
1.
Select System Configuration→ Email Relay Host.
The Email Relay Host page is displayed.
2.
Click Edit Relay Host on the options bar.
The Edit Relay Host dialog is displayed.
3.
In Relay Host, modify the email relay hostname or IP address of the external mail server as needed.
4.
Click Submit (or click Cancel to display the Email Alerts page).
The Email Relay Host page is displayed, and an Updated external email server information dialog is displayed when
successful.
Configuring System Date and Time Settings
If you need to configure or manage the date and time settings used by your system that synchronize it with other DR
Series systems or clients running in your domain, navigate to the Date and Time page, and click Edit. The Date and Time
page displays a Settings pane that contains the following date and time-related settings (by default, the system has the
following date and time settings as default values in an initial system startup):
•
Mode—select from two types: Manual and Network Time Protocol (NTP).
NOTE: Dell recommends using NTP when the DR Series system is part of a workgroup and not part of a
domain. When the DR Series system is joined to a domain, such as the Microsoft Active Directory Services
(ADS) domain, NTP is disabled and the DR Series system uses the domain time.
82
•
Time Zone—when in NTP mode, select from a list of time zone options based on Greenwich Mean Time (GMT);
for example, GMT-8:00, Pacific Time (US and Canada).
•
NTP Servers—when in NTP mode, select from an Internet pool of NTP servers (you can define up to three NTP
servers) when using the NTP mode. If this setting is not visible in the Settings pane, verify that the Mode
indicates it is joined to an Active Directory Services (ADS) domain. When joined to a domain, NTP is disabled for
the DR Series system.
•
Set Date and Time—when in Manual mode, click the calendar icon, and configure the date and time by making
month, day, and time in a 24-hour time format selections. Use the controls on the calendar to select the month,
the day of the month, and the hours and minutes using the slider controls. To set the current time, click Now.
When done with setting your date and time values, click Done (and the time appears for example, as 12/12/12
14:05:45). When all date and time settings are configured, click Submit for the DR Series system to accept the
new values.
NOTE: System synchronization is critical for proper data archiving and replication service operations.
By using the NTP mode, you synchronize your system clock whereby NTP ensures that your system has a reliable time
stamp. This is critical for successful file exchanges, network log coordination and validation, and resource access
requests within a workgroup.
NOTE: Dell recommends that you use the NTP mode to ensure better replication service operations when part of a
workgroup. You can set or modify existing date and time settings for your DR Series system by using the Edit option
in the Date and Time page. However, the NTP service is disabled when you join a domain, at which point the
domain time management is used and you cannot enable NTP.
Editing System Date and Time Settings
To modify the default time and date settings for your DR Series system, complete the following:
1.
Select System Configuration → Date and Time.
The Date and Time page is displayed.
2.
Click Edit on the options bar.
The Edit Date and Time dialog is displayed.
NOTE: If the DR Series system is joined to a Microsoft Active Directory Services (ADS) domain, the Edit option
will be disabled (grayed out) and the Mode, Time Zone, or Date and Time values cannot be changed in the
Settings pane. This is because whenever a DR Series system is joined to a domain, the Network Time Protocol
(NTP) is disabled and the DR Series system uses the domain-based time service. NTP is used in the Mode
setting when the DR Series system is part of a workgroup and not joined to a domain. To be able to modify or
edit any of the Settings pane values when the DR Series system is joined to an ADS domain, you would first
need to leave the ADS domain before you could modify any of the date and time settings. For more
information, see Configuring Active Directory Settings.
3.
In Mode, select either Manual or NTP.
If you select Manual, continue on with the tasks in step 3, and then complete steps 4 and 5.
If you select NTP, skip to step 6, and complete it and step 7.
–
Select Manual.
The Edit Date and Time dialog is displayed.
4.
–
Click the Time Zone drop-down list and choose the desired time zone.
–
Click the Calendar icon (adjacent to Set Date and Time), and select the desired day in the month (the
system prevents the selection of unsupported days).
–
Adjust the Hour and Minute sliders to the desired time (or click Now to set the date and time to be the
current date and time in hours and minutes).
Click Done.
The Edit Date and Time dialog is displayed with your new settings.
5.
Click Submit (or click Cancel).
The Date and Time page is displayed, and a Disabled NTP service dialog is displayed when successful.
6.
Select NTP.
The Edit Date and Time dialog is displayed.
7.
–
Click the Time Zone drop-down list and select the desired time.
–
Edit or revise the NTP servers as desired (you are limited to selecting only three NTP servers).
Click Submit (or click Cancel).
83
The Date and Time page is displayed, and an Enabled NTP service dialog is displayed when successful (and this
was your selected mode).
Creating Containers
After initialization, the DR Series system contains a single default container named backup. Containers function like a
shared file system, which can be assigned a connection type of None (to be defined later), NFS/CIFS, or OST
(OpenStorage Technology). Containers can then be accessed using NFS, CIFS, or OST.
If needed, you can also create additional system containers for storing your data. For more information about creating a
storage container or specific connection type containers, see Creating Storage Containers, Creating an NSF or CIFS
Connection Type Container, or Creating an OST Connection Type Container.
Configuring Share-Level Security
The DR Series system supports setting up share-level permissions for CIFS shares using the standard Microsoft
Windows administrative tool, Computer Management. Computer Management is a component that is built into the
Microsoft System 7, Vista, and XP operating systems.
NOTE: Any user that is part of BUILTIN\Administrators can edit ACLs on CIFS shares. The local DR Series system
administrator is included in the BUILTIN\Administrators group. To add additional domain groups to the BUILTIN
\Administrators group, you can use the Computer Manager tool on a Windows client to connect to the DR Series
system as Domain administrator and add any groups you want. This capability allows users other than the Domain
administrator to modify an ACL as needed.
This administrative tool lets you control access to shares and also configure read-only or read-write access to user
groups or individual users within the Active Directory Service (ADS) when joined to an ADS domain.
To implement share-level security on a DR Series system that has been joined to an ADS domain, make sure that you
have mapped a drive on the DR Series system using an account with DOMAIN\Administrator credentials (or by using an
account that is equivalent to a domain administrator). For more information about joining to an ADS domain, see
Configuring Active Directory Settings.
NOTE: If you do not use an account with sufficient privileges, you will not be able to see the shares or you may
experience other problems.
1.
Click Start → Control Panel → Administrative Tools → Computer Management.
The Computer Management page is displayed.
2.
Click Action → Connect to another computer... .
The Select Computer dialog is displayed.
3.
Click Another computer, type the hostname or IP address for this DR Series system, and click OK.
The Computer Management page is displayed with the designated DR Series system listed in the left pane.
4.
Click System Tools, and click Shared folders.
The Shares, Sessions, and Open Files folders are displayed in the main pane of the Computer Management page.
5.
Click Shares to display a list of the shares managed by the DR Series system.
6.
Right-click on the share of interest, and select Properties.
The specified share Properties page is displayed.
7.
Click the Share Permissions tab in the specified share Properties page.
The Share Permissions view in the Properties page is displayed.
8.
84
To remove existing access permissions to the share, or add additional groups or user that can access the share,
complete the following:
–
To add access for a new group or user, click Add... to display the Select Users or Groups dialog.
–
Click Object Types..., choose the object types you want to select (Built-in security principals, Groups, or
Users), and click OK.
–
Click Locations... and define the root location from which to begin your search, and click OK.
–
In the Enter the object names to select list box, enter any object name(s) you want to find.
NOTE: You can search for multiple objects by separating each name with a semicolon, and by using
one of the following syntax examples: DisplayName, ObjectName, UserName,
ObjectName@DomainName, or DomainName\ObjectName.
–
9.
Click Check Names to locate all matching or similar object names that are listed in the Enter the object
names to select list box, by using the object types and directory locations you selected.
Click OK to add the object to the Group or user names list box.
10. In the Permissions pane for the selected object, select the Allow or Deny check box to configure the following
permissions:
–
Full Control
–
Change
– Read
11. Click OK to save the selected share permission settings associated with the selected object.
85
86
Managing DR Series Storage Operations
5
This topic introduces the concept of using the DR Series system to manage all of your storage and replication
operations. Storage operations can include tasks such as creating new containers, managing or deleting existing
containers, moving data into containers, and displaying current container statistics.
Replication operations can include such tasks as creating new replication relationships, managing or deleting existing
replication relationships, starting and stopping replication, setting a replication bandwidth limit per host, displaying
current replication statistics, and setting a Replication schedule.
Managing Container Operations
This topic introduces the concept of using the DR Series system to manage all of your data storage and replication
operations. Data storage operations can include tasks such as creating new containers, managing or deleting existing
containers, moving data into containers, and displaying current container statistics. Replication operations can include
such tasks as creating new replication relationships, managing or deleting existing replication relationships, starting
and stopping replication, setting a replication bandwidth limit per host, displaying current replication statistics, and
setting a Replication schedule.
Creating Storage Containers
By default, the DR Series system provides a container named backup for your use after you complete the basic system
configuration and initialization process. You can also create additional containers to store your data as needed.
NOTE: The DR Series system does not support creating container names that begin with a 0 (zero). In addition,
many of the DR Series system GUI and CLI operations will not work when a container name begins with a 0.
Containers function like a shared file system that can be accessed using the following connection types:
•
NFS/CIFS
•
NFS
•
CIFS
•
OST (OpenStorage Technology)
•
None (an unassigned connection type)
Choosing the None or unassigned connection type lets you create containers that can be configured later as needed. To
modify a container configured with a None connection type, select the container, click Edit, and start configuring it as
desired.
Creating an NFS or CIFS Connection Type Container
To create an NFS or a CIFS connection type container, complete the following:
1.
Select Storage → Containers.
The Containers page is displayed, which includes a Containers summary table listing all existing containers.
2.
Click Create.
The Create New Container dialog is displayed.
87
3.
In Container Name, type the name of the container.
Container names cannot exceed 32 characters in length, and can be composed of any combination of the following
characters:
NOTE: The DR Series system does not support the use of the following special characters in container
names: /, #, or @.
4.
–
A-Z (uppercase letters)
–
a-z (lowercase letters)
–
0-9 (numbers)
–
dash (-) or underscore (_) special characters
In Marker Type, select from the following choices: None, Auto, CommVault, Networker, TSM, or ARCserve.
If you select the Auto marker type, this will enable all marker types to be detected. As a best practice, if you have
only one type of DMA with traffic directed to a container, it is best to select the corresponding marker type (for
example, CommVault). Conversely, as a best practice, if you have traffic from a DMA that is not one of the
supported marker types, it is best to disable marker detection for the container by selecting the None marker type.
5.
In Connection Type, select NFS/CIFS.
This displays the following in the NFS and CIFS panes:
–
NFS access path: <system name>/containers/<container name>
–
CIFS share path: <system name>\<container name>
NOTE: To create an NFS connection type, skip to step 6. To create a CIFS connection type, skip to step 10.
6.
To select an NFS connection type, click Enable NFS in the NFS pane.
The Client Access, NFS Options, and Map root to panes are displayed, and is where you configure this container to
use NFS to backup Unix or Linux clients.
7.
8.
In the Client Access pane, define a specific NFS client (or all clients) that can access the NFS container or manage
clients who can access this container:
–
To allow open access for all clients to the NFS container you create, select Open Access (all clients have
access). When you select this setting, this action removes the Add client (IP or FQDN Hostname) and
Clients text boxes. Select this check box only if you want to enable access for all clients to this NFS
container.
–
To define a specific client that can access the NFS container you create, type the IP address (or its FQDN
hostname) in the Add clients (IP or FQDN Hostname) text box, and click Add. The “added” client appears in
the Clients list box.
–
To delete an existing client from the NFS Clients list box, select the IP address (or FQDN hostname) of the
client you want to delete, and click Remove. The “deleted” client disappears from the list box.
In the NFS Options pane, define which NFS options to use for the client, by selecting from the NFS Options choices:
rw (allows read-write access), ro (allows read-only access), or insecure (allows for replies being made to requests
before the changes in the request are committed to disk).
NOTE: The DR Series system always commits writes to NVRAM first before committing any changes to disk.
9.
88
In the Map root to pane, select the user level you want mapped to this container from one of the following options
from the drop-down list:
–
nobody represents a user on the system without root access permissions
–
root represents a remote user with root access to read, write, and access files on the system
–
administrator represents the system administrator
NOTE: The DR Series system administrator that manages the system has a different set of privileges than does
the CIFS administrator user. Only the DR Series system administrator can change the password for the CIFS
administrator user. To change the password that allows access for the CIFS administrator user, use the
authenticate --set --user administrator commands. For more information, see the Dell DR Series System
Command Line Reference Guide.
10. To select a CIFS connection type, click Enable CIFS in the CIFS pane.
The Client Access pane is displayed, which allows you to configure this container to use CIFS to backup Microsoft
(MS) Windows clients.
11. In the Client Access pane, define a specific CIFS client (or all clients) that can access the CIFS container or
manage clients who can access this container:
–
To allow open access for all clients to the CIFS container you created, select Open Access (all clients have
access). When you select this setting, this action removes the Add clients (IP or FQDN Hostname) and
Clients text boxes. Select this check box only if you want to enable access for all clients to this CIFS
container.
– Type the IP address (or its FQDN hostname) in the Add clients (IP or FQDN Hostname) text box, and click
Add. The “added” client appears in the Clients list box.
– To delete an existing client from the Clients list box, click to select the IP address (or FQDN hostname) of
the client you want to delete, and click Remove. The “deleted” client disappears from the list box.
12. Click Create a New Container (or click Cancel to display the Containers page).
The Containers page is displayed, along with a Successfully Added dialog. The list of containers in the Containers
summary table is now updated with your new container.
Creating an OST Connection Type Container
To create an OST connection type container, complete the following:
1.
Select Storage → Containers.
The Containers page is displayed showing all existing containers.
2.
Click Create.
The Create New Container dialog is displayed.
3.
In Container Name, type the name of the container.
Container names cannot exceed 32 characters in length, and can be composed of any combination of the following
characters:
–
–
–
–
A-Z (uppercase letters)
a-z (lowercase letters)
0-9 (numbers)
dash (-) or underscore (_) special characters
NOTE: The DR Series system does not support the use of the following special characters in container
names: /, #, or @.
4.
In Marker Type, select from the following choices: None, Auto, CommVault, Networker, TSM, or ARCserv.
If you select the Auto marker type, this will enable all marker types to be detected. As a best practice, if you have
only one type of DMA with traffic directed to a container, it is best to select the corresponding marker type (for
example, CommVault). Conversely, as a best practice, if you have traffic from a DMA that is not one of the
supported marker types, it is best to disable marker detection for the container by selecting the None marker type.
5.
In Connection Type, select OST for this type of container to create.
The OST pane is displayed, which allows you to configure this container to use OST (OpenStorage Technology) to
backup NetBackup and Backup Exec media servers.
6.
In Capacity, select one of the following options allowed per container:
89
7.
–
Unlimited: this defines the allowed amount of incoming raw data per container (based on the physical
capacity of the container).
–
Size: this defines a set limit in Gibibytes (GiB) for incoming raw data allowed per container.
Click Create a New Container (or click Cancel to display the Containers page).
After creating the new container, the Containers page is displayed and includes a Successfully Added dialog. The
list of containers in the Containers summary table is updated with your new container (and its new status is
reflected as N/A in the Replication column of this table).
Creating an Unassigned Connection Type Container
To create an unassigned container in the DR Series system without a defined connection type (None), complete the
following:
NOTE: The DR Series system allows you to create a container without configuring it with a specific connection
type. When you are ready to configure an unassigned container at a later date, select it in the Containers summary
table, click Edit, and configure it with the desired connection type.
1.
Select Storage → Containers.
The Containers page is displayed showing all existing containers.
2.
Click Create.
The Create New Container dialog is displayed.
3.
In Container Name, type the name of the container.
Container names cannot exceed 32 characters in length, and can be composed of any combination of the following
characters:
NOTE: The DR Series system does not support the use of the following special characters in container
names: /, #, or @.
4.
–
A-Z (uppercase letters)
–
a-z (lowercase letters)
–
0-9 (numbers)
–
dash (-) or underscore (_) special characters
In Marker Type, select from the following choices: None, Auto, CommVault, Networker, TSM, or ARCserv.
If you select the Auto marker type, this will enable all marker types to be detected. As a best practice, if you have
only one type of DMA with traffic directed to a container, it is best to select the corresponding marker type (for
example, CommVault). Conversely, as a best practice, if you have traffic from a DMA that is not one of the
supported marker types, it is best to disable marker detection for the container by selecting the None marker type.
5.
To create a container with an unassigned connection type, select None to create a container for configuration at a
later time or to disable any specific marker type for the container.
6.
Click Create a New Container (or click Cancel to display the Container Summary page).
After creating a new container, the Containers page is displayed and displays a Successfully Added dialog. The list
of containers in the Containers summary table is updated with your new unassigned container.
Editing Container Settings
To modify any of the settings for an existing container, complete the following:
1.
Select Storage→ Containers.
The Containers page is displayed, and lists all current containers.
2.
90
Click Select to identify the container in the list that you want to modify, and click Edit.
The Edit Container dialog is displayed.
3.
Modify the marker type options for the selected container as needed (containers support None, Auto, CommVault,
Networker, TSM (Tivoli Storage Manager), or ARCserve.
If you select the Auto marker type, this will enable all marker types to be detected. As a best practice, if you have
only one type of DMA with traffic directed to a container, it is best to select the corresponding marker type (for
example, CommVault). Conversely, as a best practice, if you have traffic from a DMA that is not one of the
supported marker types, it is best to disable marker detection for the container by selecting the None marker type.
4.
Modify the connection type options for the selected container as needed (containers support None, NFS/CIFS, and
OST).
–
If you want to modify an existing NFS/CIFS, NFS, or CIFS connection type container settings, see the NFS/
CIFS, NFS-only, and CIFS-only options available in Creating an NSF or CIFS Connection Type Container, and
make the corresponding changes.
–
If you want to modify the existing OST connection type container settings, see the options available in
Creating An OST Connection Type Container, and make the corresponding changes.
–
If you want to modify the existing unassigned (None) connection type container settings, see the options
available in Creating An Unassigned Connection Type Container, and make the corresponding changes.
NOTE: If you select Open Access in the Client Access pane, the Add clients (IP or FQDN Hostname) and
Clients panes are hidden and you cannot create or modify these options.
NOTE: The DR Series system always commits writes to NVRAM first before committing any changes to disk.
NOTE: The DR Series system administrator that manages the DR Series system has a different set of privileges
than does the CIFS administrator user. Only the DR Series system administrator can change the password for
the CIFS administrator user. To change the password that allows access for the CIFS administrator user, use
the DR Series system CLI authenticate --set --user administrator command. For more information, see the Dell
DR Series System Command Line Reference Guide.
5.
Once the container type settings have been modified, click Modify this Container (or click Cancel to display the
Containers page).
The Successfully updated container dialog is displayed. The list of containers in the Containers summary table is
updated with the newly modified container.
Deleting Containers
Before deleting a container, Dell recommends that you first carefully consider whether or not you need to preserve the
data in the container. To delete an existing container that contains data, complete the following:
CAUTION: Before deleting any DR Series container that contains deduplicated data, Dell recommends that you
take steps to preserve this data using another means of long-term retention. Once a container is deleted, the
deduplicated data cannot be retrieved. This and later releases of the DR Series system allow you to delete any
specified container and all its contents in one operation.
1.
Select Storage → Containers.
The Containers page is displayed, and lists all current containers.
2.
Click Select to identify the container you want to delete, and click Delete.
A Delete Confirmation dialog is displayed, which prompts you about the specific container by name that you
selected to delete.
3.
Click OK in the Delete Confirmation dialog (or click Cancel to display the Containers page).
The Successfully removed container dialog is displayed. The list of containers in the Containers summary table is
updated and no longer displays the deleted container.
91
Moving Data into a Container
To move data into an existing DR Series system container, complete the following:
1.
Click Start → Windows Explorer → Network .
The Network page is displayed, which lists all current computers.
2.
In the browser Address bar, click Network to select your DR Series hostname or IP address.
The Network page is displayed, which lists all current storage and replication containers.
NOTE: However, if your DR Series system is not listed, you can enter its hostname or IP Address preceded by
"https://" and followed by the container name in the Address bar to access it (for example in this format,
https://10.10.20.20/container-1). The DR Series system only supports the Hypertext Transfer Protocol Secure
(HTTPS) form of IP addressing.
3.
Move data from the source location to the destination container using your regular DMA or backup application
process.
NOTE: If any file ingested by the DR Series system by a DMA or backup application is renamed or deleted
without using the DMA or backup application’s process, the corresponding catalog must be updated
accordingly. Failure to do so may prevent the DMA or backup application from being able to access the data.
4.
Verify that the data recently moved now resides in the destination container (or click Dashboard → Statistics:
Container, select the destination container in the Container Name drop-down list, and view the following
information panes for recent container activity:
–
–
–
–
Backup Data
Throughput
Connection Type
Replication
Displaying Container Statistics
To display the current statistics for an existing container that stores your data, complete the following:
NOTE: An alternate method to display statistics for any current container is to select that container by name in the
Container Name drop-down list in the Statistics: Container page (Dashboard Statistics: Container).
1.
Select Storage → Containers.
The Containers page is displayed, and the Containers summary table lists all of the current containers in the
system.
2.
Click Select to identify the container to display, and click Display Statistics in the options bar.
The Statistics: Container page is displayed which shows the current backup data (number of active files and active
bytes ingested in the Backup Data pane), and read and write throughput (in the Throughput pane). The system polls
for and updates the displayed statistics every 30 seconds.
NOTE: To display statistics for another container, select that container by name in the Container Name dropdown list.
This page also displays the marker type and connection type for the selected container, and the displayed statistics
depends upon the connection type container. For more information, see Statistics: Container Page, Connection
Type Pane, and Monitoring Container Statistics.
In addition, you can also display the set of system statistics by using the DR Series system CLI stats --system
command to show the following categories of system statistics:
92
–
Capacity Used (system capacity used in Gibibytes or GiBs)
–
Capacity Free (system capacity free in GiBs)
–
Read Throughput (read throughput rate in Mebibytes or MiB/s)
–
Write Throughput (write throughput rate in MiB/s)
–
Current Files (current number of files in system)
–
Current Bytes (current number of ingested bytes in system)
–
Post Dedupe Bytes (number of bytes after deduplication)
–
Post Compression Bytes (number of bytes after compression)
–
Compression Status (current compression status)
–
Cleaner Status (current space reclamation process status)
–
Total Inodes (total number of data structures)
–
Dedup Savings (deduplication storage savings by percentage)
–
Compression Savings (compression storage savings by percentage)
–
Total Savings (total storage savings by percentage)
Displaying DR Series System Statistics Using the CLI
An alternate method for checking the current DR Series system statistics is using the DR Series system CLI stats -system command to show the following categories of system statistics:
•
Capacity Used (system capacity used in Gibibytes or GiBs)
•
Capacity Free (system capacity free in GiBs)
•
Read Throughput (read throughput rate in Mebibytes or MiB/s)
•
Write Throughput (write throughput rate in MiB/s)
•
Current Files (current number of files in system)
•
Current Bytes (current number of ingested bytes in system)
•
Post Dedupe Bytes (number of bytes after deduplication)
•
Post Compression Bytes (number of bytes after compression)
•
Compression Status (current compression status)
•
Cleaner Status (current space reclamation process status)
•
Total Inodes (total number of data structures)
•
Dedupe Savings (deduplication storage savings by percentage)
•
Compression Savings (compression storage savings by percentage)
•
Total Savings (total storage savings by percentage)
For more information on DR Series system CLI commands, see the Dell DR Series System Command Line Reference
Guide.
Displaying Container-Specific Statistics Using the CLI
You can display the set of container-specific statistics by using the DR Series system CLI stats --container --name
<container name> command to show the following categories of statistics:
•
Container Name (name of the container)
•
Container ID (ID associated with container)
•
Total Inodes (total number of data structures in container)
•
Read Throughput (read throughput rate in Mebibytes or MiB/s for container)
•
Write Throughput (write throughput rate in MiB/s for container)
•
Current Files (current number of files in container)
93
•
Current Bytes (current number of ingested bytes in container)
•
Cleaner Status (current space reclamation process status for the selected container)
For more information on DR Series system CLI commands, see the Dell DR Series System Command Line Reference
Guide.
Managing Replication Operations
If you plan on performing replication operations across a firewall, the DR Series system replication service requires that
the following fixed TCP ports be configured to support replication operations:
NOTE: To allow replication storage information to be viewed by a corresponding data management agent (DMA),
the target DR Series system needs to reside in the same domain as the source DR Series system in the replication
relationship.
•
port 9904
•
port 9911
•
port 9915
•
port 9916
NOTE: If there are no existing containers, replication relationships, or any scheduled replication operations, the
only Replication-related option that is enabled is Create. The Edit, Delete, Stop, Start, Bandwidth, and Display
Statistics options are disabled (grayed out).
In the 2.0 release, DR Series systems support 32:1 replication of data. This means that multiple source DR Series systems
(up to 32) can write data to different individual containers on a single, target DR Series system.
NOTE: Starting with Release 2.0, the DR Series system software includes version checking that limits replication
only between other DR Series systems that run the same system software release version (DR Series systems
running Release 2.0.x software can only replicate with other DR Series systems that run the same release system
software). For example, Release 2.0.x systems will not be able to replicate with Release 2.1 or Release 3.0 systems,
but can replicate with systems running Release 2.0.0.1 or 2.0.0.2.
NOTE: You need to be aware that the storage capacity of the target DR Series system is directly affected by the
number of source systems writing to its containers, and also by the amount being written by each of these source
systems.
Creating Replication Relationships
To create a new replication relationship, complete the following:
1.
Select Storage → Replication.
The Replication page is displayed, which lists all current replication entries by the following categories:
–
Local Container Name
–
Role (target or source)
–
Remote Container Name
–
Peer State (online or offline)
–
Bandwidth (replication bandwidth limit)
NOTE: Bandwidth is the replication bandwidth limit that you can set as Kibibytes per second (KiBps),
Mebibytes per second (MiBps), Gibibytes per second (GiBps), or as an unlimited bandwidth (default).
2.
94
Click Create in the options bar.
The Create Replication page is displayed.
3.
In Step 1: Select a local container, select a local container from the list of available containers.
4.
In Step 2: Select Encryption, select one of the following encryption options: None, 128–bit, or 256–bit.
5.
In Step 3: Select a role, select Source or Target.
6.
In Step 4: Remote container settings, select one of these two options:
7.
–
Create container on remote system. If you select this option, see Creating a Container on a Remote System
(Replication), which describes the process of creating a container on a remote system.
–
Map to container on remote system. If you select this option, see Mapping to a Container on a Remote
System (Replication), which describes the process of mapping to a container on a remote system.
Enter the required information in the Step 4: Username, Password, Peer System, and Peer Container Name fields.
For more information, see Creating a Container on a Remote System (Replication) or Mapping to a Container on a
Remote System (Replication), depending upon your selected option.
8.
Click Create Replication (or click Cancel to display the Replication page).
The Successfully added replication dialog is displayed when successful.
Creating a Container on a Remote System (Replication)
This topic describes the process for creating a replication relationship with a container on a remote system using the
Replication page. For more information, see Creating Replication Relationships. The following procedure assumes you
have completed the Step 1, Step 2, and Step 3 tasks for creating replication relationships, and you are selecting the
Create container on a remote system option in Step: 4 Remote container settings.
To create a replication relationship with a container on a remote system, complete the following tasks:
NOTE: Exercise care when configuring the direction of replication for source and target containers. For example,
target containers can have their contents deleted if they contain existing data.
1.
In Username, type a valid user name for the peer system (for example, administrator).
2.
In Password, type a valid password for the peer system (for example, St0r@ge!).
3.
In Peer System, type the IP address that represents this peer system (for example, 10.10.10.10).
4.
In Peer Container Name, type a name for the new container (for example, StorageReplica2), or chose from an
existing container on the peer system.
5.
Click Create Replication (or click Cancel to display the Replication page).
The Successfully added replication dialog is displayed when successful.
Mapping to a Container on a Remote System (Replication)
This topic describes the process for creating a new replication relationship by mapping to a container on a remote
system using in the Replication page. For more information, see Creating Replication Relationships. The following
procedure assumes you have completed the Step 1, Step 2, and Step 3 tasks in Creating Replication Relationships, and
you are selecting the Map to container on a remote system option in Step: 4 Remote container settings.
To create a replication relationship by mapping to a container on a remote system, complete the following tasks:
NOTE: Exercise care when configuring the direction of replication for source and target containers. For example,
target containers can have their contents deleted if they contain existing data.
1.
Click Map to container on remote system.
2.
In Username, type the valid user name for the peer system (for example, administrator).
3.
In Password, type the valid password for the peer system (for example, St0r@ge!).
4.
In Peer System, type the IP address that represents the peer system (for example, 10.10.10.10).
5.
In Remote Container, click Retrieve Container(s) to display the remote containers in the list box.
95
6.
Select the desired remote container in the Retrieve Container(s) list box.
7.
Click Create Replication (or click Cancel to display the Replication page).
The Successfully added replication dialog is displayed when successful.
Editing Replication Relationships
To modify settings for an existing replication relationship, complete the following:
NOTE: Exercise care when configuring the direction of replication for source and target containers. For example,
target containers can have their contents deleted if they contain existing data.
1.
Select Storage→ Replication.
The Replication page is displayed.
2.
Click Select to identify the replication relationship that you want to modify, and click Edit in the options bar.
The Edit Replication dialog is displayed.
3.
4.
Modify any of the following values as needed in Step 2: Select Encryption:
–
None
–
128–bit
–
256–bit
Modify any of the following values as needed in Step 4: Remote container settings:
–
Username
–
Password
–
Peer System
NOTE: Because you cannot modify an existing defined role (source or target) for a replication relationship, if
necessary you must delete the existing replication relationship, and recreate a new relationship with the
specific source and target roles that you want.
5.
Click Save Replication (or click Cancel to display the Replication page).
The Successfully updated replication dialog is displayed when successful.
Deleting Replication Relationships
To delete an existing replication relationship, complete the following:
1.
Select Storage → Replication.
The Replication page is displayed.
2.
Click Select to identify the relationship that you want to delete, and click Delete in the options bar.
The Delete Replication dialog is displayed.
3.
Click OK in the Delete replication dialog (or click Cancel to display the Replication page).
The Successfully deleted replication dialog is displayed when successful.
Starting and Stopping Replication
To start or stop replication in an existing replication relationship, complete the following:
NOTE: For more information about setting up a Replication schedule, see Creating a Replication Schedule.
96
1.
Select Storage → Replication.
The Replication page is displayed.
2.
Click Select to identify the replication relationship on which you want to stop (see step 3) or start (see step 4) the
replication process.
3.
To stop the scheduled replication process, click Stop, and click OK to stop replication (or click Cancel to display the
Replication page).
The Successfully stopped replication dialog is displayed.
4.
To start the scheduled replication process, click Start, and click OK to start replication (or click Cancel to display
the Replication page).
The Successfully started replication dialog is displayed.
Setting the Replication Bandwidth
To set the replication bandwidth rate on a DR Series system, complete the following:
1.
Select Storage→ Replication.
The Replication page is displayed.
2.
Click Select to identify the replication relationship on which you want to set the replication bandwidth speed rate,
and click Bandwidth.
The Replication Bandwidth Throttling dialog is displayed.
3.
Select the IP address for the peer system from the Peer System drop-down list.
4.
In Set bandwidth throttling speed, choose the replication bandwidth limit you want to set from the following
choices:
–
Click KBps (Kilobytes per second), and type a value in the Rate box to set a rate in KBps.
–
Click MBps (Megabytes per second), and type a value in Rate box to set a rate in MBps.
–
Click GBps (Gigabytes per second), and type a value in Rate box to set a rate in GBps.
–
Click Default (not limited) to choose an unlimited replication bandwidth rate.
NOTE: The minimum allowed replication bandwidth setting that you can configure is 192 KBps.
5.
Click Set Bandwidth (or click Cancel to display the Replication page).
The Successfully set replication bandwidth dialog is displayed when successful.
Displaying Replication Statistics
To display the statistics for an existing replication relationship, complete the following:
1.
Select Storage → Replication.
The Replication page is displayed.
2.
Click Select to identify the replication relationship for which you want to display replication statistics, and click
Display Statistics to display the Statistics: Replication page, which contains:
–
Replication Filter—the Container Filter section in this pane lets you select one or more replication
containers, or all of the replication containers, one or more peer DR Series systems. The Headers section
lets you select any of ten statistics type check boxes that you choose to display in the Replication Statistics
summary table (by default, five check boxes are selected: Peer Status, Replication Status, Network
Throughput, Network Savings, and Progress %).
–
Replication Statistics Summary—this pane displays the filtered statistics results based on the check
box(es) you selected in the Replication Filter pane, and based on your container or peer system choices
97
3.
listed under the corresponding table column. Depending upon the number of check boxes you select, you
may need to use the horizontal scroll bar to display all of the statistics columns.
In the Replication Filter pane, select any of the following Container Filter choices for which you want to display your
choice of replication statistics:
–
Click All—this displays replication statistics for all of the currently configured containers on the system.
–
Click Name, and select an individual container in the Name drop-down list—this displays replication
statistics for a single container. To display more than one container, click Ctrl in the Name drop-down list,
and select any additional containers you want to include.
–
4.
Click Peer System, and select an individual peer DR Series system in the Peer System list box—this
displays replication statistics for a single peer system. To display more than one peer system, click Ctrl in
the Peer System list box, and select any additional peer systems you want to include.
In the Replication Filter pane, select from the following Headers check boxes that you want to filter and display in
the Replication statistics summary table for the selected container(s):
NOTE: Source systems running different DR Series system software versions (for example, one system with
1.0.1.2 software and another system with 1.1.1.0 software), will display some minor replication statistics
differences in the Containers: Statistics and Statistics: Replication pages due to the difference of the system
software version used on the source appliance.
–
Peer Status—indicates the current peer status (Insync, Paused, or Replicating).
–
Replication Status—indicates the current replication status (Offline, Online, Disconnected, Trying to
Connect, or Stopped).
–
Time to Sync—indicates the time until system synchronization (in days/hours/minutes/seconds).
–
Progress (%)—indicates the current replication progress by percentage.
–
Replication Throughput—indicates the current replication throughput by percentage (%).
–
Network Throughput—indicates the current network throughput by percentage.
–
Network Savings—indicates the current network savings using replication by percentage.
–
Last Time in Sync—indicates the last time system synchronization occurred.
–
Peer Container—indicates the peer container in the replication relationship.
–
Peer System—indicates the IP address of the peer system in the replication relationship.
For more information, see Displaying the Statistics: Replication Page.
Creating a Replication Schedule
Replication schedules can only be set on individual replication-enabled source containers. To create a Replication
schedule on a replication-enabled source container, complete the following:
NOTE: If there is no Replication schedule set, but there is pending data that can be replicated, replication will run
when it detects the following: 1) there are no active data ingests, and 2) five minutes of system idle time have
elapsed since the last data file ingest completed.
NOTE: The Replication Schedule page displays the current DR Series system time zone and current timestamp
(using this format: US/Pacific, Tue Oct 28 14:53:02 2012.
To schedule Replication operations on your system, complete the following:
1.
Select Schedules → Replication Schedule.
The Replication Schedule page is displayed.
2.
Click to select the replication-enabled source container in the Container drop-down list.
The Replication schedule table is displayed with columns that identify the week day, start time, and stop time.
3.
98
Click Schedule to create a new schedule (or click Edit Schedule to modify an existing Replication schedule).
The Set Replication Schedule page is displayed.
4.
Select (or modify) the Start Time and Stop Time setpoint values using the Hour and Minutes pull-down lists to
create a Replication schedule. For an example, see Daily Replication Schedule Example and Weekly Replication
Schedule Example.
NOTE: You must set a corresponding Stop Time for every Start Time in each Replication schedule you set. The
DR Series system will not support any Replication schedule that does not contain a Start Time/Stop Time pair
of setpoints (daily or weekly).
5.
Click Set Schedule for the system to accept your Replication schedule (or click Cancel to display the Replication
Schedule page).
NOTE: To reset all of the values in the current Replication schedule, click Reset in the Set Replication
Schedule dialog. To selectively modify values in the current schedule, make your changes to the
corresponding hours and minutes pull-down lists for the Start Time and Stop Time you wish to modify, and
click Set Schedule.
Dell recommends that you do not schedule the running of any Replication operations during the same time period
when Cleaner or ingest operations will be running. Failure to follow this practice will affect the time required to
complete the system operations and/or impact your DR Series system performance.
Daily Replication Schedule Example
The daily Replication schedule example in this topic illustrates the process for setting up a replication schedule that
uses a 24-hour clock (the time keeping convention where time of day is defined on a 24–hour basis). You set or view a
Replication schedule in the Replication Schedule page. For more information, see Creating a Replication Schedule.
NOTE: Replication schedules can only be set on individual replication-enabled source containers.
To set a daily replication schedule that starts at 16:00 hours (which is 4:00 PM in a 12–hour clock format) and stops at
23:00 hours (which is 11:00 PM in a 12–hour clock format) on Mondays, click Edit Schedule (if modifying an existing
schedule) or Schedule (if creating a new schedule):
•
Select 16 in the hours pull-down list and 00 in the minutes pull-down list to set a Start Time of 16:00 on Monday.
•
Select 23 in the hours pull-down list and 00 in the minutes pull-down list to set a Stop Time of 23:00 for Monday.
•
Set the Start Time and Stop Time setpoints for any remaining days of the week on which you want to schedule
replication.
NOTE: You must set a corresponding Stop Time for every Start Time in each Replication schedule you set. The DR
Series system will not support any Replication schedule that does not contain a Start Time/Stop Time pair of
setpoints (daily or weekly).
Weekly Replication Schedule Example
The following example shows how to set up a weekly Replication schedule with a start time at 01:00 am on Saturday and
a stop time at 01:00 am on Sunday. The DR Series system uses the 24-hour clock convention for its time keeping in which
each day is divided into twenty-four 1-hour segments.
NOTE: Replication schedules can only be set on individual replication-enabled source containers that you select
from the Container drop-down list.
•
•
Select 01 in the hours pull-down list and 00 in the minutes pull-down list to set a Start Time of 01:00 for Saturday.
•
Select 01 in the hours pull-down list and 00 in the minutes pull-down list to set a Stop Time of 01:00 for Sunday
NOTE: You need to click Set Schedule for the DR Series system to accept your Replication schedule.
99
For more information on Replication schedules, see Creating a Replication Schedule.
100
Monitoring the DR Series System
6
This topic introduces the ways in which you monitor the current state of DR Series system operations using the
Dashboard page options in the navigation panel. The Dashboard page displays a summary of current system status
categories (System State, HW State, Number of Alerts, and Number of Events. In addition, this page displays Capacity,
Storage Savings, and Throughput), and includes the System Information pane. There are links to other system pages (the
Health, Alerts, and Events pages) that you can use to display the current state of the system health (by the status of its
components), display the current system alerts, and current system events for your DR Series system.
Monitoring Operations Using the Dashboard Page
The Dashboard page contains system status indicators for the current state of the DR Series system (System State),
current hardware state (HW State), current number of system alerts (Number of Alerts), and current number of system
events (Number of Events). The Dashboard page also contains data graphs that display:
•
Capacity—used space and free space available in percentage and total (in Gibibytes or Tebibytes)
•
Storage Savings—total savings in percentage based on time (in minutes), which can be displayed in 1h (1–hour,
which is the default), 1d (1–day, 5d (5–day), 1m (1–month, or 1y (1–year) durations.
•
Throughput—for reads and writes in volume based on time (in minutes), which can be displayed in 1h (1–hour,
which is the default), 1d (1–day, 5d (5–day), 1m (1–month, or 1y (1–year) durations.
The Dashboard page also displays a System Information pane that lists key information about this DR Series system
(such as product name, system name, software version, and a number of other key categories). For details about the
System Information pane, see System Information Pane.
System Status Bar
The Dashboard page contains a System Status pane with icons that indicate the current system status and provide links
for more DR Series system status information:
•
System State
•
HW State (with a link to the Health page)
•
Number of Alerts (with a link to the Alerts page)
•
Number of Events (with a link to the Events page)
For more detailed information about the System Status pane icons:
•
System State, see Monitoring System Usage.
•
HW State, see Monitoring System Health.
•
Number of Alerts, see Monitoring System Alerts.
•
Number of Events, see Monitoring System Events.
101
Location
Status Icon
Description
System Status bar
Represents an optimal state.
System Status bar
Represents a warning state (a non-critical error was
detected).
System Status bar
Represents an actionable state (a critical error was
detected).
NOTE: To display specific information about the current HW State, click the link to display the Health page. The
Health page displays the current status of the DR Series system hardware and expansion shelf enclosures (if
installed): front and rear chassis views, showing hard drive, power supply, cooling fan, and connection locations.
The System Hardware Health pane for the DR Series system provides status for the power supplies, cooling fans,
temperature, storage, voltage, network interface cards (NIC), CPU, DIMM, and NVRAM. The System Hardware
Health pane for the external expansion shelf enclosures provides status for the power supplies, cooling fans,
temperature, storage, and the Enclosure Management Module (EMM).
NOTE: To display more information about the current Number of Alerts, click the link to display the Alerts page. The
Alerts page displays the total number of alerts, and lists each system alert by index number, timestamp, and
message that briefly describes alert status.
NOTE: To display more information about the current Number of Events, click the link to display the Events page.
The Events page displays the total number of events, and lists each system event by index number, severity
(critical, warning, and informational), timestamp, and a message that briefly describes event status.
DR Series System and the Capacity-Storage Savings-Throughput Panes
There are three central panes in the Dashboard page that display data graphs which illustrate the current DR Series
system status for Capacity, Storage Savings, and Throughput:
•
Capacity—displays the used and free physical storage capacity in percentages and volume in Gibibytes and
Tebibytes (GiBs and TiBs).
•
Storage Savings—displays a total savings in percentages (combining both deduplication and compression) over
a time period (in minutes).
•
Throughput—displays the throughput volume in Mebibytes/second (MiB/s) for read and write operations over a
time period (in minutes).
NOTE: For both the Storage Savings and Throughput data graphs, you can choose to display the current values in
1h (1-hour, the default), 1d (1-day), 5d (5-days), 1m (1-month), and 1y (1-year) durations.
System Information Pane
Located in the lower part of the Dashboard page, the System Information pane displays the following categories of
current system information:
102
•
Product Name
•
System Name
•
Software Version
•
Current Date/Time
•
Current Time Zone
•
Cleaner Status
•
Total Savings (in percentage)
•
Total Number of Files in All Containers
•
Number of Containers
•
Number of Containers Replicated
•
Active Bytes (total bytes before optimization)
NOTE: To display additional information about certain elements in the DR Series system GUI, click the
corresponding Question Mark (?) icon.
Monitoring System Alerts
You can monitor the DR Series system alerts and display the current state of the system using the navigation panel, the
Dashboard page, and its options:
•
Using the Dashboard page, you can access the Alerts page via the Number of Alerts link.
•
Using Dashboard→ Alerts, you can access the Alerts page from the navigation panel.
•
The Alerts page lists the number of system alerts, the current time zone, and provides a summary table of alerts
defined by index number, timestamp of the system alert, and a brief message describing the alert. For more
information, see Displaying System Alerts.
Using the Dashboard Alerts Page
To use the Dashboard page to display the current number of system alerts, complete the following:
NOTE: This method in convenient when you are already at the Dashboard page and want to quickly display more
information about system alerts.
1.
Click Number of Alerts on the Dashboard page.
The Number of Alerts in the System Status bar provides a link (which indicates the number of alerts, in this case 2
alerts, which are listed in the Number of Alerts: 2 link).
2.
Click the Number of Alerts link (in this example, 2).
The Alerts page is displayed.
3.
View the list of system alerts in the System Alerts summary table, identified by index number, timestamp, and a brief
message that describes the alert.
For more information, see Dashboard Page and Options and Displaying System Alerts.
Viewing the System Alerts
To use the DR Series navigation panel to display the current number of system alerts, complete the following:
1.
Click Dashboard → Alerts in the navigation panel.
The Alerts page is displayed, which lists the number of system alerts in the System Alerts summary table, and
provides the current timezone (for example, US/Pacific).
2.
Review the system alerts listed in the System Alerts summary table, which identifies each alert by:
–
Index number (for example: 1, 2, ...).
–
Timestamp (in yyyy-mm-dd hh:mm:ss format; for example, 2012–10–30 10:24:53).
103
–
Message (a brief description of the alert; for example, Network Interface Controller Embedded (LOM) Port 2
disconnected. Connect it to a network and/or check your network switches or routers for network
connectivity issues).
Monitoring System Events
You can monitor the DR Series system events, and filter events you want to display using the Event Filter pane in the
Events page. This page can display All system events, or you can restrict the events to only one of the following types:
Info (Informational), Warning, or Critical events.
The Events page lets you search for system events and monitor the current state of the DR Series system based on the
system events that match your search criteria. For more information about using the Event Filter pane, see Using the
Event Filter.
To monitor the system, using either of the following methods to display the Events page:
•
In Dashboard page, click the Number of Events link in the Events page.
•
In the navigation panel, click Dashboard → Events to display the Events page.
Using the Dashboard to Display System Events
To use the Dashboard page to display the current number of system events (Number of Events), complete the following:
NOTE: This method in convenient when you are already at the Dashboard page and want to display the current
system events.
1.
In the Dashboard page, click the Number of Events link in the System Status bar (for example, Number of Events: 2).
The Events page is displayed and lists the total number of current events, the Event Filter, the Events summary
table, and the current time zone.
2.
In the Event Filter pane, you can select to filter events by using the Event Severity pull-down list, and setting the
Timestamp From and Timestamp To starting and ending setpoints.
3.
In the Event Severity pull-down list, select the severity level of events that you want to filter and display (All,
Critical, Warning, or Info).
4.
In Message Contains, enter a word or string of words you want to search for in the Message text field, and the DR
Series system will perform a case-insensitive match for your entry (no other search options are supported).
Matches are displayed in the Events summary table.
5.
In Timestamp From, click in the field or click the calendar icon to display the current month and day.
6.
7.
–
Click and select a day in the current month schedule (or use the left and right arrows in the month title to
select a previous or later month, respectively).
–
Use the Hour and Minute sliders to set the desired time in hours and minutes, or click Now to use the
current time.
–
When configured, click Done.
In Timestamp To, click in the field or click the calendar icon to display the current month and day.
–
Click and select a day in the current month schedule (or use the left and right arrows in the month title to
select a previous or later month, respectively).
–
Use the Hour and Minute sliders to set the desired time in hours and minutes, or click Now to use the
current time.
–
When configured, click Done.
Click Start Filter to display system events in the Events summary table based on the settings you selected.
The Events summary table displays system events based on Index, Severity, Timestamp, and Message (a brief
description of event). To navigate and display results in the Events summary table, complete the following:
104
–
8.
Set the number of events to display per page: click Events per page at the lower-right corner of the table
and select either 25 or 50 events to display per page.
– Use the scroll bar to display each full page of system events.
– To display other pages of system events, click prev or next, click on a specific page number, or enter a
page number in the Goto page and click Go to display that page of system events.
To clear the current filter settings, click Reset and set new filter values using the process described in steps 3
through 6.
For more information about using the Event Filter on the Events page, see Using the Event Filter.
Using the Dashboard Events Option
To use the DR Series navigation panel to display the current number of system events, complete the following:
1.
Click Dashboard→ Events in the navigation panel.
The Events page is displayed, which lists the total number of system events in the System Events summary table,
and provides the current timezone (for example, US/Pacific).
2.
View the list of current system events in the System Events summary table, which are grouped by index number,
severity, timestamp, and a brief description of the event message.
3.
Use the Event Filter to search for events that match the criteria you select (event severity, message content,
timestamp from, and timestamp to ranges).
For more information on using the Event Filter, see Using the Event Filter and Using the Dashboard to Display
System Events.
Using the Event Filter
The Events page contains an Event Filter pane that lets you filter the type of system events you want to display in the
Events summary table. Event filtering is done by selecting the severity level and using a timestamp. Choose the severity
level by selecting it in the Event Severity drop-down list, and refine your search by selecting specific start and end
setpoints in Timestamp from and Timestamp to.
To filter the system events you want to display in the Events summary table, complete the following:
1.
Click Dashboard → Events (or access the Events page via the Number of Events link).
The Events page is displayed, which lists the number of current events and the current time zone set for the system.
2.
In the Event Filter pane, select the desired severity to display from the Event Severity drop-down list.
System event severity levels include:
3.
4.
– All—displays all four types of system events (All, Critical, Warning, and Info)
– Critical—displays only critical events (in red)
– Warning—displays only warning events (in yellow)
– Info—displays only informational events
In Message Contains, enter a word or string of words that you want to search for in the Message text field, and the
DR Series system will perform a case-insensitive match for your entry (no other search options are supported).
Matches are displayed in the Events summary table.
Click the Calendar icon (adjacent to Timestamp From) to configure a start setpoint.
To configure a start setpoint, complete the following:
–
–
Select the desired day in the current month, or click the left or right arrow in the month title bar to select a
previous or later month.
Adjust the Hour and Minute sliders to the desired time (or click Now to set the date and time as the current
date and time in hours and minutes).
105
– Click Done.
Click the Calendar icon (adjacent to Timestamp To) to configure an end setpoint.
5.
To configure an end setpoint, complete the following:
–
Select the desired day in the current month, or click the left or right arrow in the month title bar to select a
previous or later month.
– Adjust the Hour and Minute sliders to the desired time (or click Now to set the date and time to be the
current date and time in hours and minutes).
– Click Done.
Click Start Filter (or click Reset to return all values to default values).
6.
The search results based on your filter choices are displayed in the Events summary table.
For more information about using the Events summary table, see Using the Dashboard to Display System Events.
Monitoring System Health
Monitor and display the current state of your system hardware status using one of two methods in the DR Series system:
•
•
Using Dashboard→ Health , you can access the Health page from the navigation panel.
In the Dashboard page, you can access the Health page via the HW State link.
For more information about the Health page, see Health.
Using the Dashboard Page to Monitor System Health
To use the Dashboard page to display and monitor the current DR Series system hardware status, complete the
following:
1.
Click Dashboard in the navigation panel.
The Dashboard page is displayed and provides a HW State link in the System Status bar (for example, HW State:
optimal). (You can also access the Health page when you click Dashboard→ Health.)
2.
Click the HW State link (in this example, optimal) to display the Health page.
The Health page provides a System tab, which is the default displayed on this page. If you have installed one, your
system will also include an Enclosure tab (this release supports up to two expansion shelves being installed). The
System tab displays front and rear views of the chassis showing the disk drive locations in the front view (0–11), the
OS internal drives (12–13), and the fans, system connectors, and power supplies in the rear view. If installed and
clicked, the Enclosure tab displays front and rear views of the enclosure chassis showing the physical disk
locations (0–11) in the front view, and the enclosure connectors, fans, and pluggable drive locations in the rear
view. In addition, the service tag of the expansion shelf is displayed. Both the System and Enclosure tabs display
the System Hardware Health summary table that lists the current status of all major components in the DR Series
system or its expansion shelf, respectively.
NOTE: This method is convenient when you are already at the Dashboard page and want to display more
information about current System Status.
DR Series system — System Hardware Health components
–
–
–
–
–
106
Power Supplies
Fans
Temperature
Storage
Voltage
–
NIC
–
CPU
–
DIMM
–
NVRAM
Enclosure — System Hardware Health components
–
Power Supplies
–
Fans
–
Temperature
–
Storage
–
Enclosure Management Module (EMM)
Using the Dashboard Health Options
To use the navigation panel to display the current system status of the DR Series system components (or any expansion
shelf enclosure) that are installed, complete the following:
1.
Click Dashboard → Health.
The Health page is displayed.
2.
Mouse over the chassis front and rear panel views on the Health page to display a dialog with the status, name,
and state for the DR Series system disk drives and OS drives (DR4000 and DR4100 system).
Use the same process to display a similar dialog with the status and name for the power supplies and rear panel
connectors for an expansion shelf enclosure.
3.
View the status in the System Hardware Health summary table for all of the DR Series system or expansion shelf
components (depending upon the tab selected, System or Enclosure).
To display additional information, click to expand each component in the corresponding summary table.
NOTE: The Health page provides status of the DR Series chassis front and rear views showing the chassis
drives (0-11), the power supplies (PS1 and PS2), and the OS internal drives (12 and 13) for the DR4000 system
(in the DR4100 system, the OS drives reside in the rear chassis). In addition, all other major DR Series system
components are listed in the System Hardware Health table (Power Supplies, Fans, Temperature, Storage,
Voltage, NIC (network interface card), CPU, DIMM (dual in-line memory module), and NVRAM. For each
installed expansion shelf (Enclosure 1 or Enclosure 2), the Health page provides status of the expansion shelf
chassis front and rear views showing the chassis drives (0–11) and lists the service tag. The System
Hardware Health table for the enclosure lists the Power Supplies, Fans, Temperature, Storage, and Enclosure
Management Module (EMM).
For more information about the system components and the Health page, see Health, Monitoring System Health, and
Using the Dashboard Page to Monitor System Health.
Understanding DR Series System NICs And Ports
Two key components of the DR Series system interaction between its containers and the network involves the network
interface cards (NICs) and system ports. The DR Series system supports the use of the following types of NICs:
•
1-Gigabit Ethernet (GbE) two-port (10-Base T); Dell recommends using CAT6a copper cabling
•
10-GbE two-port (100-Base T); Dell recommends using CAT6a copper cabling
•
10-GbE SFP+ two-port using LC fiber-optic transceivers or twin-axial cabling
107
The 1-GbE, 10-GbE, and 10-GbE SFP+ NICs configurations bond multiple Ethernet ports into a single interface by default:
•
For the 1-GbE ports, this means that the four ports in the DR4000 system (or the six ports in the DR4100 system)
are bonded together to form one interface connection.
•
For the 10-GbE and 10-GbE SFP+ ports, this means that to operate at maximum speed, only the two high-speed
Ethernet ports are bonded together to form one interface connection.
The DR Series system supports configuring the NICs to use either of the two following supported bonding
configurations:
•
ALB—adaptive load balancing (ALB) is the default; this configuration does not require special switch support,
but it does require the data source machine to be on the same subnet as the DR Series system. The ALB is
mediated by the Address Resolution Protocol (ARP).
•
802.3ad—also known as Link Aggregation Control Protocol (LACP) is used for copper-wired Ethernet
applications; this configuration does require special switch management (the requirement being that it be
managed from the switch).
For more information, see Configuring Networking Settings.
ALB and the 802.3ad are link aggregation methods that aggregate or combine multiple network connections in parallel to
increase throughput beyond what a single connection could support.
Link aggregation for Ethernet connections also provides redundancy, in case one of the links fails. The DR Series system
also comes with a Serial-Attached SCSI (SAS) card for future enhancements.
The DR Series system ships equipped with the 1-GbE, I-GbE, or 10-GbE SFP+ NIC. To visually differentiate between the
NIC types, observe the markings on the NICs installed in the rear chassis of the DR Series system:
•
1-GbE NIC is labeled as GRN=10 ORN=100 YEL=1000
•
10-GbE NIC is labeled as 10G=GRN 1G=YLW
NOTE: There are three key requirements to meet if you choose to use the 10-GbE NIC configuration: 1) use only
CAT6a copper cabling, 2) you must have two switch ports capable of supporting 10-GbE NICs, and 3) you do not
connect the 1-GbE ports.
NOTE: There are three key requirements to meet if you choose to use the 10-GbE SFP+ NIC configuration: 1) use
only Dell-supported SFP+ transceivers, 2) you must have two switch ports capable of supporting 10-GbE SFP+ NICs
(and LC fiber-optic or twin-axial cabling), and 3) you do not connect the 1-GbE ports.
To verify the types of NICs that are installed in your system, click System Configuration → Networking to display the NIC
information. For more information, see Configuring Networking Settings. In addition, you can also use the DR Series
system CLI network --show command to display other NIC-related information.
Monitoring System Usage
To display the current DR Series system usage, click Dashboard → Usage to display the Usage page. This page allows
you to monitor system status and the currently displayed system usage status is based on the Latest Range or Time
Range settings that are in effect. These settings define the output for the following tab categories on the Usage page:
108
•
CPU Load
•
System
•
Memory
•
Active Processes
•
Protocols
•
Network
•
Disk
•
All
NOTE: When you click All, this tab displays the following DR Series system status categories: CPU Load, System
Usage, Memory Usage - Total, Memory Usage - Real, Active Processes - Total, NFS Usage - Total, CIFS Usage Total, Network Usage, Socket Usage - Total, Active Connections, Disk Usage - Meta Data, and Disk Usage - Data
Storage.
Displaying Current System Usage
To display the current usage for a DR Series system, complete the following:
1.
Click Dashboard → Usage.
The Usage page is displayed.
2.
View the current system usage based on the current Latest Range or Time Range values in effect (the default is the
last 1-hour period). By default, the CPU Load is always the first tab that displays when the Usage page is selected.
The tabs you can display in the Usage page include: CPU Load, System, Memory, Active Processes, Protocols,
Network, Disk, and All. For more information, see System Usage.
3.
Click any of the system usage tabs to display the current status for that tab category (or click All to display all of the
system usage tab results).
For example, click Protocols to display the current results for the NFS Usage - Total, CIFS Usage - Total, and OST
Usage - Total for the system.
Setting a Latest Range Value
To set a Latest Range value and display system status results based on this setting, complete the following:
1.
Click Dashboard → Usage.
The Usage page is displayed.
2.
3.
Click Latest Range.
Select the desired duration period (Hours, Days, or Months) in the Range drop-down list.
By default, Hours is the first displayed duration option in the drop-down list.
4.
Select a value in the Display last... drop-down list that matches the Range duration time period you selected.
For example, Hours (the default display period shown) lists choices between 1-24. If Days is selected, the choices
listed are between 1-31, and if Months is selected, the listed choices are between 1-12.
5.
Click Apply.
6.
Click the tab that corresponds to the usage type you want to view based on the selected settings (or click All to
display all of the system results based on the selected settings).
For more information, see Usage and Displaying Current System Usage.
Setting a Time Range Value
To set a Time Range value and display system status results based on these settings, complete the following:
1.
Click Dashboard → Usage.
The Usage page is displayed.
2.
Click Time Range.
3.
In Start Date, click the Start Date field (or Calendar icon) to display the current month.
109
To select a previous month, click the left arrow in the month title bar to select the desired month in the current year
(or previous year).
4.
To choose the Start Date day in the selected month, you have two options:
5.
–
Choose a specific day in the selected month (only the available days are displayed). Future days are
considered unavailable (and appear dimmed out).
–
Click Now to select the current date and time in Hours and Minutes (or use the Hour and Minute sliders to
select a desired time value).
Click Done to display your date and time settings in Start Date.
The date and time settings you set appear in an mm/dd/yyyy hh:mm AM/PM format.
6.
In End Date, perform the same process that you did for setting the Start Date to specify an end date (or select Set
“End Date” to current time).
7.
Click Apply.
8.
Click the tab that corresponds to the usage type you want to monitor using your choice of settings (or click All to
display all of the system usage tab results based on your choice of settings).
9.
Observe the DR Series system usage results based on the criteria selected.
For more information about the Usage page, see Usage and Displaying Current System Usage.
Monitoring Container Statistics
Click Dashboard → Statistics: Container to monitor statistics for the container that you selected in the Container Name:
drop-down list, which displays current statistics in the following panes:
•
Backup Data
•
Throughput
•
Marker Type
•
Connection Type
•
Replication
For more information, see Backup Data Pane, Throughput Pane, Connection Type Pane, Replication Pane, Statistics:
Container Page, and Editing Container Settings.
Displaying the Statistics: Container Page
To display container statistics for a selected container, complete the following:
1.
Click Dashboard→ Statistics: Container.
The Statistics: Container page is displayed.
2.
In the Container Name: drop-down list, select the container you want to monitor.
NOTE: When you select a container, all statistics displayed on the Statistics: Container page represent
specific information about the backup data, throughput, replication, marker type, and connection type for the
selected container. The displayed statistics will vary depending upon the connection type used by the
specified container.
3.
View the current statistics in the Backup Data and Throughput panes.
The Backup Data pane displays the number of active files ingested based on time (in minutes), and the number of
active bytes ingested based on time (in minutes). The Throughput pane displays the number of read data in
Mebibytes/per second (MiB/s) based on time (in minutes), and the number of write data in MiB/s based on time (in
minutes).
110
NOTE: The Current Time Zone for the DR Series system is displayed below the Backup Data pane (for
example, System Time Zone: US/Pacific).
4.
In the Backup Data and Throughput panes, click Zoom to select which duration period you want to display:
–
1h (1-hour is the default duration displayed)
–
1d (1-day)
–
5-d (five-day)
–
1m (1-month)
–
1y (1-year)
NOTE: To refresh the values listed in the Backup Data and Throughput panes, click
5.
.
The Marker Type pane displays the marker type associated with the container (supported marker types include
None, Auto, CommVault, Networker, TSM (Tivoli Storage Manager), or ARCserve.
If the Auto marker type is selected, this means all marker types will be detected. If you have a specific marker type
selected (for example, CommVault), this means you have specified traffic to the container from that DMA type. If
marker detection for the container is disabled, this means the None marker type is selected.
6.
In the Connection Type pane, view information about the configured connection type for the selected container
which can be NFS, CIFS, NFS/CIFS, or OST (the following example shows an NFS/CIFS container):
–
NFS Connection Configuration pane—NFS access path, Client Access, NFS Options, and Map root to.
–
CIFS Connection Configuration pane—CIFS share path and Client Access.
–
If the container is an OST connection type container, the Connection Type OST pane—displays three tabs:
Capacity, Duplication, and Client Statistics. The Capacity tab displays a Capacity pane with Status,
Capacity, Capacity Used, and Total Images. The Duplication tab displays a Duplication Statistics pane with
Inbound and Outbound statistics in the following categories: Bytes Copied (logical), Bytes Transferred
(actual), Network Bandwidth Settings, Current Count of Active Files, and Replication Errors. The Client
Statistics tab displays a Client Statistics pane with Images Ingested, Images Complete, Images Incomplete,
Images Restored, Bytes Restored, Image Restore Errors, Image Ingest Errors, Bytes Ingested, Bytes
Transferred, and Network Savings.
In the Replication pane (for NFS/CIFS connection types), view the replication information for the selected container
in the following two panels:
7.
–
Replication Configuration—Enable, Role, Remote Container Name, Bandwidth, and encryption.
–
Replication Status—Peer State, Replication State, Replication Average Transfer Rate, Replication Peak
Transfer Rate, Network Average Transfer Rate, Network Peak Transfer Rate, Estimated Time to Sync (in
days, hours, minutes, and seconds), Savings (in percentage), Last INSYNC Time (yyyy-mm-dd hh:mm:ss),
and Schedule Status (next starting time in days, hours, minutes, and seconds).
Monitoring Replication Statistics
Click Dashboard → Statistics: Replication to display and monitor replication statistics for one (or more) containers, and
one (or more) peer DR Series systems selected in the Replication Filter pane. Depending upon the configured settings,
you can monitor and display replication statistics for:
•
All containers
•
One or more specific containers
•
One or more peer DR Series systems
The Replication Filter pane contains 10 Headers check boxes that when selected display replication statistics for the
container(s) or other peer DR Series system(s) you select in Container Filter.
After selecting the container(s), peer system(s), and the replication statistic categories, click Apply Filter to display the
replication statistics results based on the search criteria you selected.
111
Using the Statistics: Replication page, you can selectively filter and display specific types of related replication statistics
for all, one or more than one container, or one or more other peer DR Series systems.
For more information about Replication statistics, see Displaying Replication Statistics, Container Filter, and Displaying
the Statistics: Replication Page.
Displaying the Statistics: Replication Page
To display system replication container statistics for a selected container or another DR Series system, complete the
following:
1.
Click Dashboard→ Statistics: Replication.
The Statistics: Replication page is displayed.
2.
To select a container or another peer DR Series system, choose the appropriate Container Filter option.
–
Click All to choose all of the replication containers.
–
Click Name, press Ctrl, and select the containers in the list box to select one or more containers in the list
that you want to display.
–
Click Peer System, press Ctrl, and select the peer systems in the list box to select one or more peer DR
Series systems in the list that you want to display.
NOTE: Only one of the Container Filter options can be active at any one time (they are mutually exclusive).
3.
Select the Header check box(es) for the replication statistics categories for which you want to filter and display in
the Replication Statistics summary table:
–
Peer Status
–
Replication Status
–
Time to Sync
–
Progress % (percentage)
–
Replication Throughput
–
Network Throughput
–
Network Savings
–
Last Sync in Time
–
Peer Container
–
Peer Status
NOTE: The following five types of replication statistics are enabled by default: Peer Status, Replication Status,
Network Throughput, Network Savings, and Progress %. If you choose more than five types of statistics
(when you select additional check boxes), a horizontal scroll bar appears at the bottom of the Replication
Statistics table. Use this scroll bar to display the columns of additional statistics that may not display within
the main window.
4.
Click Apply Filter to display the replication statistics types you selected to filter for your container or other peer DR
Series system choices.
The Replication Statistics summary table displays the replication statistics types you selected in the Replication
Filter pane.
To reset the default settings in the Replication Filter pane, click Reset.
To update the Replication Filter table after making a change, click Apply Filter to display an updated set of
replication statistics.
NOTE: Use the horizontal and vertical scroll bars to navigate through the columns of replication statistics
displayed in the Replication Statistics summary table.
112
Displaying Replication Statistics Using the CLI
In addition to using the DR Series system GUI to display replication statistics, you can also display statistics for a
specific replication container by using the DR Series system CLI stats --replication --name <container name> command
to view the following replication container statistics categories:
•
Container Name (name of the replication container)
•
Replication Source Container (name that identifies the data source)
•
Replication Source System (IP address or host name of the data source)
•
Peer Status (current status of replication peer; for example, paused)
•
Replication State (current state of replication relationship; for example, insync)
•
Schedule Status (current status in days, hours, minutes, seconds)
•
Replication Average Throughput (in Kebibytes per second, KiB/s)
•
Replication Maximum Throughput (in KiB/s)
•
Network Average Throughput (average throughput rate in KiB/s)
•
Network Maximum Throughput (maximum throughput rate in KiB/s)
•
Network Bytes Sent (total network bytes sent in Mebibytes/MiB)
•
Dedupe Network Savings (total deduplication network savings in percentage)
•
Compression Network Savings (total compression network savings in percentage)
•
Last INSYNC Time (date of last sync operation in yyyy-mm-dd hh:mm:ss format)
•
Estimated time to sync (time until next sync operation in days, hours, minutes, and seconds)
Data replication history is also displayed on a file-by-file basis, with a replication timestamp, and other file related
information.
For more information about DR Series system CLI commands, see the Dell DR Series System Command Line Reference
Guide.
113
114
Using the DR Series System Support Options
7
You can use the Support page and its Diagnostics, Software Upgrade, and License options to maintain the state of your
DR Series system. To access these options, use the DR Series system navigation panel (for example, click Support→
Diagnostics to display the Diagnostics page) or use the Diagnostics, Software Upgrade, or License links on the Support
page.
Support Information Pane
The Support page displays the Support Information pane, which provides the following information about the DR Series
system:
•
Product Name—DR Series system product name
•
Software Version—DR Series system software version installed
•
Service Tag—DR Series system appliance bar code label
•
Last Diagnostic Run—timestamp of latest diagnostics log file (for example, Tue Nov 6 12:39:44 2012)
•
BIOS Version—current version of installed BIOS
•
MAC Address—current address in standard two-digit hexadecimal grouping format
•
iDRAC IP Address—current IP address of iDRAC (if applicable)
•
Ethernet Ports—displays information about bonded ports only (if the 10-GbE NICs are installed, it only displays
information about the two supported 10–GbE ports):
–
Eth0 MAC address and port speed
–
Eth1 MAC address and port speed
–
Eth2 MAC address and port speed in
–
Eth3 MAC address and port speed in
NOTE: This example shows four Ethernet ports bonded (such as if a DR4000 system with 1–GbE ports as a
single interface). For more information on possible port configurations, see the system chassis
descriptions in Local Console Connection.
•
The support.dell.com Dell Support link
NOTE: The Support Information pane contains important information that may be needed if you contact Dell
Support for any technical assistance.
NOTE: For additional system information, click Dashboard in the navigation panel to display its System Information
pane, which lists Product Name, System Name, Software Version, Current Date/Time, Current Time Zone, Cleaner
Status, Total Savings (in percentage), Total Number of Files in All Containers, Number of Containers, Number of
Containers Replicated, and Active Bytes.
Diagnostics Page and Options
The options on the Diagnostics page allow you to generate new diagnostics log files that capture the current state of
your system (Generate), download diagnostics log files to the local system (Download), or delete existing diagnostics log
files (Delete).
115
NOTE: For more information about diagnostics log files, log file directories, and the Diagnostics service, see About
The Diagnostics Service.
A DR Series diagnostics log file is a bundle that contains a variety of file types that record the latest system settings, and
saves them in a compressed .lzip file format. The Diagnostics page identifies each diagnostics log file by the following
attributes:
•
File name—in this format, <hostname>_<date>_<time>.lzip, as in this example: acmesys-19_2012-10-12_13-51-40.lzip
NOTE: Diagnostic log file names are limited to 128 characters.
•
Size—in Megabytes (for example, 58.6 MB).
•
Time—timestamp when log file was created (for example, Fri Oct 12 13:51:40 2012).
•
Reason for generation—describes reason log file was generated (for example, [admin-generated]: generated by
Administrator).
NOTE: Diagnostic reason descriptions are limited to 512 characters, and the descriptions can only be
added using the DR Series system CLI.
•
Status—indicates status of log file (for example, Completed).
There are two methods to display the Diagnostics page:
•
Using the Support page (to access the Diagnostics page via the Diagnostics link).
•
Using Support → Diagnostics (to access the Diagnostics page from the navigation panel).
If you have multiple pages of diagnostics log files, you can navigate to another page by using the controls are the foot of
the Diagnostics summary table:
•
Click prev or next to move back or forward one page.
•
Double-click the listed page number (adjacent to Goto page).
•
Enter a page number in Goto page, and click Go.
•
Use the scroll bar at the right side of Diagnostics summary table to view all of the diagnostics log files available
to display.
NOTE: You can also set how many entries you want to display per page in the Diagnostics summary table. In the
View per page drop-down list, click 25 or 50 to select the desired number of entries to display.
Generating a Diagnostics Log File
A DR Series diagnostics log file is a bundle that contains a variety of file types that record the latest system settings, and
saves them in a compressed .lzip file format. The Diagnostics page identifies each diagnostics log file by the following
attribute types:
•
File name
•
Size
•
Time
•
Reason for generation
•
Status
NOTE: When you generate a diagnostics log file bundle, it contains all of the DR Series system information that may
be needed when contacting Dell Support for technical assistance.
The diagnostics log file bundle collects the same type of hardware, storage, and operating system information collected
by the Dell System E-Support Tool (DSET) from the Dell DR Series system hardware.
116
The diagnostics log file bundle is identical to one created using the DR Series system CLI diagnostics --collect --dset
command. System diagnostics information can assist Dell Support when troubleshooting or evaluating your DR Series
system.
To generate a diagnostics log file bundle for your system, complete the following:
1.
Select Support → Diagnostics in the navigation panel.
The Diagnostics page is displayed, and this page lists all current diagnostics log files.
2.
Click Generate.
A New log file is scheduled dialog is displayed.
3.
To verify that a new diagnostics log file is being generated, check the status of the diagnostics log file by selecting
Support → Diagnostics.
The Diagnostics page is displayed, and a status showing In-progress indicates that a new diagnostics log file is
being generated.
Once completed, the new diagnostics log file resides at the top of the File Name column in the table. To verify, check its
timestamp (using its date and time), to ensure this is the latest diagnostics file created.
NOTE: When you generate a diagnostics log file bundle, it contains all of the DR Series system information that may
be needed when contacting Dell Support for technical assistance. This also includes all the previous autogenerated diagnostics log files, which are then deleted from the DR Series system.
The diagnostics log file bundle collects the same type of hardware, storage, and operating system information collected
by the Dell System E-Support Tool (DSET) from the Dell DR Series system appliance hardware:
•
To collect a DSET log file, use the DR Series system CLI command, diagnostics --collect --dset.
•
To collect the comprehensive DR Series system diagnostics log file bundle (which also includes DSET
information), use the DR Series system CLI command, diagnostics --collect.
System diagnostics information can assist Dell Support when troubleshooting or evaluating your DR Series system.
Downloading Diagnostics Log Files
To display the Diagnostics page and open or download an existing diagnostics log file, complete the following:
1.
Click Support→ Diagnostics in the navigation panel.
The Diagnostics page is displayed, which lists all current diagnostics log files allowed by the system.
2.
Click Select to identify the diagnostics log file you want to download, and click Download (or single-click the
diagnostics log file name link).
The File Download dialog is displayed.
NOTE: When a new diagnostics log file is in the process of being generated (and its Status displays as Inprogress), the diagnostic log file name link is not active, and if you attempt to select this file the Download
option is disabled.
3.
Download the file to the desired location, depending upon the following:
a) If accessing the DR Series system GUI from a Linux-based system: click Save File and navigate to a different
folder location, define a new file name (or retain the existing file name), and click Save to save the diagnostics
log file to a specified folder location.
b) If accessing the DR Series system GUI from a Windows-based system: click Save (or Save As), and navigate to
the Downloads folder and retrieve the diagnostics log file.
117
Deleting a Diagnostics Log File
To delete an existing diagnostics log file from the Diagnostics summary table on the Diagnostics page, complete the
following:
1.
Select Support → Diagnostics.
The Diagnostics page is displayed.
2.
Click Select to select the diagnostics file you want to delete, and click Delete.
The Delete Confirmation dialog is displayed.
3.
Click OK to delete the selected diagnostics log file (or click Cancel to display the Diagnostics page).
The Log file was removed successfully dialog is displayed when successful.
DR Series System Software Upgrade
When you initiate a DR Series system software upgrade, the navigation panel displays only the Support page and the
Software Upgrade options.
The administrator that initiated the software upgrade (considered the initiator administrator) will see a System
Information pane that displays an alert that reads IMPORTANT: Please do not navigate out of this screen until the
upgrade is finished, and displays the upgrade status as Upgrade in Progress... Please wait.... The Current Version and
Upgrade History versions of the DR Series system software are listed in the Software Info pane.
All other administrators that may be logged into DR Series system (with the exception of the initiator administrator who
started the software upgrade), will only see a dialog that displays Status: The system is being upgraded. Wait for it to
become operational..
There are only three possible outcomes during a DR Series system software upgrade operation:
•
The upgrade operation completed successfully—no reboot is required.
•
The upgrade operation completed successfully—but a reboot is required (click Reboot in the Software Upgrade
page).
•
The upgrade operation failed.
Software Upgrade Page and Options
Use the Software Upgrade page to verify the current installed version of the DR Series system software in the Software
Information pane, or to apply updates to the system. There are two methods you can use to display the Software
Upgrade page:
•
Using the Support page, click Software Upgrade.
•
Using the navigation panel, select Support → Software Upgrade.
Both methods display the Software Upgrade page where you can verify the current installed version, check the upgrade
history of previously installed software versions, verify the iDRAC IP address (if one is in use), start the upgrade process,
or reboot the DR Series system using the options on this page.
NOTE: During the DR Series system software upgrade, the upgrade status "starting" remains displayed during
almost the entire duration of the software upgrade process. It is not until the DR Series system upgrade status
changes to "almost done" that the system upgrade process has fully completed.
118
Verifying the Current Software Version
To verify the currently installed version of the DR Series system software, complete the following:
NOTE: You can verify the version of the installed DR Series system software in the Dashboard page (in the System
Information pane), the Support page (in the Support Information pane), and the Software Upgrade page (in the
Software Information pane).
The following procedure documents the process from the Software Upgrade page.
1.
In the navigation panel, select Support and click Software Upgrade (or select Support→ Software Upgrade.
The Software Upgrade page is displayed.
2.
Verify the currently installed DR Series system software version listed as Current Version in the Software
Information pane (all previously installed versions are listed under Upgrade History, showing the version number
and timestamp when installed).
Upgrading the DR Series System Software
To upgrade the DR Series system software, complete the following:
NOTE: The DR Series system only supports the copying of upgrade images and diagnostics files to and from the
system using WinSCP. The DR Series system does not support the copying or deleting of any other file types using
WinSCP. To use WinSCP to copy DR Series software upgrade and diagnostics log files, ensure that the File
Protocol mode is set to SCP (Secure Copy) mode.
NOTE: You can use other SCP tools with the DR Series system, but you cannot use these other SCP tools to copy
other types of files to or from the DR Series system.
1.
Using the browser, go to support.dell.com, navigate to the DR4000 product page, and enter your service tag.
2.
In the Dell DR Series Drivers & Downloads page, click Find Drivers & Downloads.
The Drivers & Downloads page displays a listing of downloadable firmware, utilities, applications, and drivers for
the DR Series system.
3.
Locate the IDM section of the Drivers & Downloads page, which includes the Dell-Utility (DR Series Upgrade File) in
the format, DR4x00-x.x.x.x-xxxxx.tar.gz, and showing its release date and version.
4.
Click Download File, click For Single File Download via Browser, and click Download Now.
The File Download dialog is displayed.
5.
Click Save to download the latest system software upgrade file to the DR Series system that is running the browser
session started by the DR Series administrator.
6.
Using the DR Series system GUI, select Support, and click the Software Upgrade link (or select Support →
Software Upgrade).
The Software Upgrade page is displayed.
7.
Type the path of the software upgrade file in the Select the upgrade file from local disk (or click Browse..., and
navigate to the location where you downloaded the system software upgrade file).
8.
Select the software upgrade file, and click Open.
9.
Click Start Upgrade.
When you initiate a DR Series system software upgrade, the navigation panel displays only the Support page and
the Software Upgrade option.
The administrator that initiated the software upgrade (known as the initiator administrator) sees a System
Information pane that displays an alert and upgrade status, and the Current Version and Upgrade History versions
of the DR Series system software listed in the Software Info pane as shown in Figure 1.
119
Figure 6. Software Upgrade Alert - Upgrade in Progress
All other administrators that may be logged into DR Series system (excluding the initiator administrator), only see
the following dialog displayed (Figure 2):
Figure 7. DR Series System Upgrade Status
There are only three possible outcomes during a DR Series system software upgrade operation:
–
–
–
Upgrade has completed successfully—no reboot is required.
Upgrade has completed successfully—but a reboot is required (click Reboot in the Software Upgrade
page).
Upgrade has failed.
NOTE: If the DR Series system software upgrade operation fails, you can reboot the system and attempt
another software upgrade operation using the DR Series system GUI. If this is unsuccessful, you can use the
DR Series system CLI system --show command to view the current System State status. DR Series system
software upgrades can also be performed using the DR Series system CLI. For details, see the Dell DR Series
System Command Line Reference Guide. If both the DR Series system GUI and CLI attempts are unsuccessful,
contact Dell Support for assistance.
Restore Manager (RM)
The Dell Restore Manager (RM) utility can be used to restore the DR Series system software. RM can be used when a
non-recoverable hardware or software failure prevents the DR Series system from functioning correctly.
RM can also be used to reset the system back to its initial factory settings when moving it from a test environment to a
production environment. RM supports the following two modes:
•
•
Recover Appliance—in a Recover Appliance mode, RM reinstalls the operating system and attempts to recover
the prior system configuration and the data residing in the containers.
Factory Reset—in a Factory Reset mode, RM reinstalls the operating system and resets the system
configuration back to the original factory state. It is important to note that when doing a factory reset, all of the
containers and the data in the containers gets deleted.
CAUTION: Using the Factory Reset mode deletes all of the DR Series system data. The Factory Reset mode must
only be used when the container data is no longer needed.
120
Downloading the Restore Manager
The Dell Restore Manager (RM) utility runs from a USB boot key that contains the RM image, which must first be
downloaded from the Dell Support site.
1.
Using a supported web browser, navigate to support.dell.com.
2.
Enter the DR4100 system Service Tag to be directed to the DR Series system download page (or choose a product
category).
3.
Navigate to the Drivers & Downloads page.
4.
In the Category drop-down list, select IDM.
5.
If required, expand the IDM category to list the available IDM download files.
6.
Locate, select, and download the DR4000 Restore Manager file (listed in the following RM filename format, "DR4000UM-x.x.x.xxxxx.tag.gz").
Creating the Restore Manager USB Key
To create a Restore Manager (RM) USB key, you must first download the RM image (.img) file from the Dell Support site,
and then transfer this on to a USB key. The USB key must be a minimum of 4 GB (Gigabytes) in size or larger. Windows
USB image tools can be used to transfer the RM image when they meet the following conditions:
•
Support using the .img file format
•
Support using a direct block-to-block device copy to ensure that the USB key is bootable
To transfer the RM image to the USB key on a Linux or Unix system, perform the following:
1.
Copy the downloaded RM image file to a Linux or Unix system.
2.
Insert the USB key into an available USB port on the Linux or Unix system.
Make note of the device name that is reported by the operating system (for example, /dev/sdc4).
3.
Do not locally mount the USB device to a file system at this time.
4.
Copy the RM image to the USB key using the dd command:
dd if=<path to .img file> of=<usb device> bs=4096k
For example:
dd if=/root/DR4100-UM-04.49.01.00.00.34555.img of=/dev/sdc4 bs=4096
Running the Restore Manager (RM)
To run the Dell Restore Manager (RM) utility, boot the DR Series system using the RM USB key created in Creating the
RM USB key).
1.
Insert the RM USB key into an available USB port on the system.
You can also use the virtual media option of iDRAC to remotely load the RM USB key. For more information, see
Configuring and Using Virtual Media in the Integrated Dell Remote Access Controller 6 (iDRAC6) User Guide at
support.dell.com/support/edocs/software/smdrac3/.
2.
Boot the DR Series system using the RM USB key.
3.
During the time when the Power-On Self-Test (POST) screen displays, press F11 to load the Boot Manager.
4.
Within the Boot Manager, navigate to the system hard drive (C:), select the USB key as the boot device, and press
<Enter>.
121
5.
After a few minutes, Restore Manager loads and displays its main screen.
6.
Select the desired Restore mode (either Recover Appliance or Factory Reset).
7.
Enter the confirmation string, and press <Enter> to proceed.
CAUTION: The Factory Reset mode deletes all DR Series data. The Factory Reset mode should only be used
when the container data is no longer needed.
NOTE: After Restore Manager completes, only the administrator account will remain enabled. To re-enable
the root or service accounts, see the DR Series system CLI user --enable --user command in the Dell DR
Series System Command Line Reference Guide.
NOTE: If you had previously joined the DR Series system to any Active Directory Services (ADS) domain
before running Restore Manager, after it completes you will need to manually rejoin the desired ADS domain.
For information about joining an ADS domain, see Configuring Active Directory Settings.
Resetting the Boot LUN Setting in H700 BIOS After Running RM
In the event that both of the 2.5-inch 300 GB 10K RPM 6 GB/s SAS internal drives (OS) in RAID1 are replaced, you need to
be able to run the Dell Restore Manager (RM) utility to recover the DR Series system OS drives.
Following the RM recovery process, the boot logical unit number (LUN) has to be reset to VD0 RAID1. The DR Series
system unsuccessfully attempts to boot from RAID6 instead of RAID1.
To resolve this issue, reset the H700 BIOS to revise the proper boot order setting to configure the proper boot LUN to be
RAID1. To reset the proper LUN boot order, complete the following steps:
1.
Start Restore Manager.
2.
Select Option 1 → Recover My Appliance.
The OS Virtual Disk is created: Warning Code 2002 dialog is displayed.
3.
122
Click Proceed.
The Operating System installation was successful dialog is displayed.
4.
Click Reboot, and during reboot, press Ctrl+R to enter the PERC BIOS.
The PERC BIOS Configuration Utility page is displayed.
5.
Select Controller 0: PERC H700 in the list.
6.
Press Ctrl+N twice to select the Ctrl Mgmt (Controller Management) tab.
123
Figure 8. Virtual Disk Management
Figure 9. Selecting Bootable Virtual Disk (VD)
7.
Select Ctrl Mgmt, click Select bootable VD, and select VD 0 as the VD0 RAID1.
8.
Click Apply, and reboot the DR Series system.
The RM Recover My Appliance mode process will then complete.
Hardware Removal or Replacement
To properly remove or replace any DR Series system hardware, you must observe and use the best practice shut down
and start up procedures. For a comprehensive set of removal and replacement procedures with step-by-step
instructions, see the Dell DR Series System Owner’s Manual.
For more information about the best practices, see DR Series System: Proper Shut Down and Start Up and Shutting
Down the DR Series System.
124
DR Series System: Proper Shut Down and Start Up
Before you attempt to remove or replace any hardware component in the DR Series system, ensure that you observe the
following best practices for properly shutting down and starting up the system:
1.
Power off the DR Series system by selecting Shutdown in the System Configuration page.
For more information, see Shutting Down the DR Series System. Another method you can use to shut down the
system is the DR Series system CLI command, system --shutdown.
2.
Allow the DR Series system to fully complete its power-down process.
When the power-down process has completed, the Power Supply status indicator is unlit.
3.
Disconnect the DR Series system power cables from the electrical power outlet.
4.
Wait an additional period of time (up to 10 minutes), and/or verify that all of the green and amber NVRAM LEDs on
the rear panel of the system chassis are unlit.
NOTE: If you do not allow the NVRAM super capacitor sufficient time to discharge, the NVRAM status will
report DATA LOSS when the DR Series system is subsequently powered up.
5.
Unlatch the latch release lock and slide the DR Series system cover back and away to gain entry to the appliance
internal components.
To gain entry to the interior of the DR Series system, remove the cover. For more information, see the procedures in
the Dell DR Series System Owner’s Manual.
6.
Remove and replace the system hardware components as needed.
7.
Replace the cover, reconnect the system power cables to the electrical power outlet.
8.
Power on the DR Series system by pressing the power-on indicator/power button.
DR Series System NVRAM
NVRAM is a field replaceable unit (FRU) in the DR Series system. The super capacitor that powers the NVRAM doubledata rate (DDR) memory must be able to move its contents to the solid-state drive (SSD) during a power loss.
This data transfer requires maintaining the power to run the system for 3 minutes of operation (normally, it only takes
approximately one minute). If a problem occurs during the data backup to the SSD, the subsequent system reboot
detects this. NVRAM can experience backup failure when the following occurs:
•
The NVRAM failed to backup the data during the power shutdown
•
The super capacitor did not maintain sufficient power to backup the DDR contents into the SSD.
•
The NVRAM/SSD encountered an end-of-line (EOL) or another error.
If any of these conditions occur, the NVRAM requires either a failure recovery or a replacement.
NOTE: Dell recommends the following supported method for flushing DR Series system data from the NVRAM to
the RAID6 before replacing the NVRAM by using either of the following DR Series system CLI commands: system -shutdown or system --reboot.
NOTE: If you need to remove or replace the NVRAM in the DR Series system, see Shutting Down the DR Series
System and NVRAM Field Replacement.
NVRAM Backup Failure Recovery
After you have physically replaced the NVRAM card in a PCIe x4 (or x8) slot in the DR Series system chassis, you can
recover from an NVRAM backup failure by completing the following tasks:
125
CAUTION: You must wait a minimum of 20 minutes after powering on the DR Series system before using the DR
Series system CLI maintenance --hardware --reinit_nvram command. This 20–minute post power-on waiting period
allows the NVRAM card, the super capacitor calibration, and all solid state drive (SSD) processes to fully
complete, which are necessary for the proper operation of the DR Series system.
During Maintenance mode, the DR Series system determines, detects, and repairs the data loss. During the system
reboot process, it ensures that no valuable data remains on the NVRAM.
1.
Enter the following DR Series system CLI command: maintenance --hardware --reinit_nvram.
This formats the SSD and clears all of the backup and restore logs, by reinitializing the NVRAM.
2.
Verify that the DR Series system enters its Maintenance mode.
For more information about replacing the NVRAM, see NVRAM Field Replacement and DR Series System: Proper
Shut Down and Start Up.
NVRAM Field Replacement
Whenever the DR Series system NVRAM is replaced in the field, you must observe this best practice procedure:
CAUTION: You must wait a minimum of 20 minutes after powering on the DR Series system before using the DR
Series system CLI command: maintenance --hardware --reinit_nvram. This post power-on waiting period allows
the NVRAM card, the super capacitor calibration, and the SSD processes to fully complete, which are necessary
for the proper operation of the DR Series system.
NOTE: For more information, see DR Series System: Proper Shut Down and Start Up.
1.
Verify that the DR Series system software detects the NVRAM as being new to the system.
2.
Enter the following DR Series system CLI command: maintenance --hardware --reinit_nvram.
This command initializes the NVRAM, creates new partitions, and updates information used internally by the DR
Series system software.
3.
Verify that the DR Series system enters its Maintenance mode.
If properly initialized, the DR Series system will automatically enter Maintenance mode. The filesystem checker
examines every blockmap and datastore to determine how much data was lost due to the failed NVRAM.
126
Configuring and Using OST
8
This topic introduces key OpenStorage Technology (OST) tasks and provides links to other OST-related topics that
contain procedures that describe how to perform these tasks:
•
Configuring the DR Series system for use with OST and the supported DMAs; for more information, see
Configuring the DR Series System Using the Backup Exec GUI, and Configuring DR Series System Information
Using NetBackup
•
Configuring the Logical Storage Unit (LSU) using the DR Series system GUI; for more information, see
Configuring an LSU
•
Installing the Dell OST plug-in in to a supported media server (Linux or Windows); for more information, see
Installing the OST Plug-In for Linux or Installing the OST Plug-In for Windows
•
Using supported Symantec DMAs (NetBackup and Backup Exec) to perform backup and restore operations; for
more information, see
–
Backing Up Data from a DR Series System Using NetBackup
–
Restoring Data from a DR Series System Using NetBackup
–
Duplicating Backup Images Between DR Series Systems Using NetBackup
–
Creating Backups on the DR Series System Using Backup Exec
–
Restoring Data from a DR Series System Using Backup Exec
–
Optimizing Duplication Between DR Series Systems Using Backup Exec
NOTE: This capability to use OST, also known as DR Rapid Data Access within Dell, adds tighter integration with
backup software applications, such as the two Symantec OpenStorage-enabled backup applications supported in
this release: NetBackup and Backup Exec.
Understanding OST
OpenStorage Technology (OST) provides the logical disk interface that can be used with network storage devices, and
the DR Series system appliance requires plug-in software to integrate its data storage operations with the following
supported data management applications (DMA):
•
NetBackup
•
Backup Exec
The DR Series system integrates with these supported DMAs using the Dell OpenStorage plug-in, through which both
NetBackup and Backup Exec can control when backup images are created, duplicated, and deleted. Via the plug-in, the
DMAs can take full advantage of key DR Series system features like replication and data deduplication.
The DR Series system accesses the OpenStorage API code through a Dell OST plug-in, which can be installed on the
supported media server platform type that you choose (Windows or Linux). When OST is used with the DR Series
system, it offers the following benefits:
•
OST protocol provides faster and improved data transfers:
–
Focus is on backups with minimal overhead
–
Accommodates larger data transfer sizes
–
Provides throughput that is significantly better than CIFS or NFS
127
•
•
•
OST and DMA integration:
–
OpenStorage API enables the DMA-to-media server software communication
–
DR Series system storage capabilities can be used without extensive changes to DMAs
–
Backup and replication operations are simplified by using built-in DMA policies
DR Series system and OST ports and write operations:
–
Control channel uses TCP port 10011
–
Data channel uses TCP port 11000
–
Optimized write operations enable client-side deduplication
Replication operations between DR Series systems:
–
No configuration is required on the source or target DR Series system
–
Replication is file-based, not container-based
–
Replication is triggered by DMA optimized duplication operation
–
DR Series system transfers the data file (not the media server)
–
Once duplication completes, DR Series system notifies DMA to update its catalog (acknowledging the
second backup)
–
Supports different retention policies between source and replica
–
Replication is set up in the DMA itself, not the DR Series system
OpenStorage Technology (OST) API
The OpenStorage Technology (OST) API is an application programming interface that allows disk-based devices like the
DR Series system to natively integrate with the two supported Symantec Data Management Applications (DMA),
NetBackup and Backup Exec. For example, because the DR Series system supports both data deduplication and
replication, the OST API allows these supported DMAs to use the DR Series system appliance features and duplicate the
optimized data from one storage appliance to another.
The OST API enables the writing of data to disk and is illustrated in the following example where NetBackup (the DMA)
interacts with the DR Series system (the data backup and deduplication device) using the OST API:
•
NetBackup needs to store a file to disk. To do this it notifies the DR Series system via the OST API which file it
needs to backup and what to name this file.
•
DR Series system accepts this file, backs it up, and stores it in its filesystem.
•
NetBackup can perform one of three subsequent operations with this specific stored file:
–
Expire it
–
Restore from it
–
Copy or duplicate it
•
If NetBackup, using the OST API, directs the DR Series system to expire a stored file, it deletes it from its
filesystem.
•
Similarly, if NetBackup, using the OST API, wants to restore from a stored file, it directs the DR Series system
which file to restore, which then delivers the stored file to NetBackup for the restore.
NOTE: OST contains a feature called optimized duplication. For example, in optimized duplication, the DMA
(NetBackup) directs device A to perform an optimized duplication with device B. Device A and B communicate and
determine which data segments of the file need to be replicated from A to B for device B to ensure that device B
contains a full and complete duplicate data file. Once successful, the DMA now knows about both copies of this
data file, and can use this file on device B as it would any other data file that resides there.
128
OST Guidelines
For best results, observe the following guidelines for optimal performance with your supported OpenStorage Technology
(OST) operations with the DR Series system:
•
Backup, restore, and optimized duplication operations need to be performed via the Dell OST plug-in
NOTE: The Dell OST plug-in needs to be installed on client systems to support client-side deduplication.
•
Optimal supported aggregated throughput rates:
–
3 Terabytes per hour (TB/hr) for passthrough write operations
–
4 TB/hr for optimized write operations
NOTE: Passthrough writes are when data is sent from a media server to the DR Series system without
applying any optimization to the data. By contrast, optimized writes are when date is sent from a media
server to the DR Series system after optimization is applied to the data.
•
Backup:
–
Passthrough writes
–
Optimized writes
•
Restore
•
Replication
OST Terminology
This topic introduces and briefly defines some basic OpenStorage Technology (OST) terminology used throughout the
DR Series system documentation.
Term
Description
BE
Shortened name for the Symantec DMA, Backup Exec (BE).
DMA/DPA
Data Management Application (also known as Data Protection
Application, which are terms for the role played by the Symantec
NetBackup or Backup Exec applications.
LSU
Logical Storage Unit, which from the DR Series system perspective,
represents any container created for data storage. LSU is a common
storage term while container is a common term in DR Series systems
that represents a location for storing data.
media server
This is the host running the DMA media server (NetBackup and Backup
Exec), and is where the OST plug-in is installed. The OST plug-in can
also be installed on a NetBackup client.
NBU
Shortened name for the Symantec DMA, NetBackup (NBU).
OST
The OpenStorage Technology from Symantec™, which allows storage
devices to deliver backup and recovery solutions with NetBackup. OST
uses the OpenStorage API and a plug-in installed on either a Linux or a
Windows-based media server platform.
129
Supported OST Software and Components
This topic provides a brief listing of some of the supported OST software and components that can be used with the DR
Series system.
NOTE: For the latest list of supported DMAs and OST plug-ins, see the Dell DR Series System Interoperability
Guide, which is available at support.dell.com/manuals.
Supported OST Software and Components
Software or Component
Description
OST Server Components
Media Server
Component resides on the DR Series system
•
Linux installations
•
Uses a Linux OST plug-in and the Red Hat Package
Manager (RPM) installer
•
Windows installations
•
Uses a Windows OST plug-in and the Microsoft installer
(MSI)
OST Plug-In Component
Windows-based 64–bit
Supported releases:
•
•
•
Linux-based 64–bit
Windows 2003
Windows 2008
Windows 2008, Release 2
Supported releases:
•
•
•
Red Hat Enterprise Linux (RHEL), version 5.x
RHEL, version 6.x
SUSE, version 10 and 11
OST Protocol
Symantec OpenStorage
Supported releases:
•
Symantec, versions 9 and 10
Supported DMAs
Symantec (Linux and Windows 64–bit versions)
130
Supported releases:
•
NetBackup
•
– Versions 6.5, 7.1, and 7.5 (Windows 2003, 32–bit)
– Version 7.5 (Windows 2008, 32–bit)
– Version 7.5 (Windows 2008 R2, 64–bit)
– Version 7.1 (RHEL 5.x)
– Version 7.5 (SLES 11 SP2, 64–bit)
Backup Exec
–
–
Version 2010 R3 (Windows 2008 R2, 64–bit)
Version 2012 (Windows 2008 R2, 64–bit)
NOTE: The Dell DR Series system licensing is all-inclusive, so that no additional Dell licensing is required to use
OST or the optimized duplication capability. The Dell OST plug-in that gets installed on a supported Linux or
Windows media server platform is a free download from Dell. However, Symantec NetBackup requires that you
purchase a Symantec OpenStorage Disk Option license. Similarly, Symantec Backup Exec requires that you
purchase the Deduplication Option to enable the OST feature.
OST Required Configurations
This topic introduces three possible required configurations that must be made to enable OpenStorage Technology
(OST) operations: DR Series system and a DMA-based media server or client (for example, OST operations that support
a NetBackup-media server, a Backup Exec-media server, or a Backup Exec-client).
Best Practices: OST and the DR Series System
This topic introduces some recommended best practices for using OpenStorage Technology (OST) operations with the
DR Series system.
•
•
•
OST and non-OST containers can exist on the same DR Series system. The DR Series system supports having
both OST and non-OST containers on the same appliance. However, this can cause incorrect capacity reporting
as both container types share the same underlying storage.
OST replication and non-OST replication on the same DR Series system. Non-OST replication needs to be
configured, and it is replicated on a per-container basis. However, this type of replication will not replicate OST
containers. OST replication is file-based and is triggered by the DMA.
Do not change the container connection type from NFS/CIFS to OST. A non-OST container must be deleted
before this container can then be created as an OST container using the same name.
Setting Client-Side Optimization
Client-side optimization is a process that can contribute to saving time performing backup operations and reducing the
data transfer overhead on the network.
You can turn On or turn Off client-side optimization (also known as client-side deduplication) using the DR Series system
CLI commands, ost --update_client --name --mode. For more information about DR Series system CLI commands, see
the Dell DR Series System Command Line Reference Guide, which is available at support.dell.com/manuals.
Configuring an LSU
You can configure a logical storage unit (LSU) as an OpenStorage Technology (OST) connection type container for data
storage by using the DR Series system GUI. To configure an LSU as an OST connection type container, log in to the DR
Series system and complete the following:
1.
Navigate to the Containers page (in the Dashboard navigation panel).
2.
Click Create to create a new container.
The Create New Container dialog is displayed.
3.
In Container Name, enter a name for the container.
4.
In Marker Type, select the None marker type.
For OST operations, only the NetBackup and Backup Exec media servers are supported.
5.
In Connection Type, set the container type to OST.
131
The OST pane is displayed, and this is where you can set the capacity for the OST connection type container.
6.
In Capacity, select either the Unlimited or Size options to set the capacity for the OST connection type container.
If you select Size, make sure to define the desired size in Gibibytes (GiB).
7.
Click Create a New Container (or click Cancel to display the Containers page).
NOTE: For general information about creating DR Series system containers, see Creating Containers, and for
creating an OST connection type container, see Creating An OST Connection Type Container.
NOTE: The capacity option in this command example sets the quota on the LSU. This is the maximum number of
bytes (ignoring optimization) that can be written to an LSU and it is listed in the gigabytes (GB). If the capacity
option is not specified (or if 0 is specified for the capacity), then the LSU will not have a quota. If this is the case,
then this means that the amount of data that can be written to the LSU is limited only by the amount of free space
on the disk.
Installing a Dell OST Plug-In
Before you can start the installation process for the Dell OST plug-in, you need to understand its role. The Dell OST plugin needs to be installed on to the media server type you choose (this DR Series system release supports Linux and
Windows). The Dell OST plug-in software enables integration between DR Series system data storage operations and
the supported data management applications (DMAs).
Understanding the Dell OST Plug-In (Linux)
The Dell OST plug-in needs to be installed on the designated Linux-based media server running the support Linux server
operating system software in the following directory, /usr/openv/lib/ost-plug-ins. The Dell OST plug-in is installed using a
self-extracting installer that installs the OST plug-in and all its related components. The installer supports the following
modes, with the default being Help (-h):
NOTE: If no option is selected, the Help mode is displayed by default.
•
Help (-h)
•
Install (-install)
•
Upgrade (-upgrade)
•
Uninstall (-uninstall)
•
Force (-force)
$> ./Dellostplugin-x86_64-38105.bin -help
Dell plug-in installer/uninstaller
usage: Dellostplugin-x86_64-38105.bin [ -h ] [ -install ] [ -uninstall ]
-h
: Displays help
-install
: Installs the plug-in
-upgrade
: Upgrades the plug-in
-uninstall
: Uninstalls the plug-in
-force
: Forces the installation of the plug-in
You can download the Dell OST Plug-In Installer in two ways:
•
•
Using the Dell website:
–
Navigate to support.dell.com/ and locate the Drivers and Downloads location
–
Locate the Dell OST plug-in for Linux and download this to your system.
Using the DR Series system GUI:
–
132
Click Storage → Clients
–
Click the OST tab in the Clients page, and click Download Plug-In
–
Select the appropriate plug-in in the Download Plug-Ins page, and click Download
Once downloaded, run the Dell OST Plug-In Installer to install the plug-in on your designated Linux-based media server.
For specifics, see Installing the OST Plug-In for NetBackup on Linux.
NOTE: The Dell OST plug-in needs to be installed on client systems to support client-side deduplication.
Understanding the Dell OST Plug-In (Windows)
This Dell OST plug-in needs to be installed in the following directory on the designated Windows-based media server
running the supported Microsoft Windows server operating system software: $INSTALL_PATH\VERITAS\Netbackup\bin
\ost-plug-ins for NetBackup installations, and $INSTALL_PATH\Symantec\Backup Exec\bin\ for Backup Exec
installations. Once downloaded, you can use SETUP to install the Dell OST plug-in. For specifics, see Installing the OST
Plug-In for Backup Exec on Windows or Installing the OST Plug-In for NetBackup on Windows.
NOTE: The Dell OST plug-in needs to be installed on client systems to support client-side deduplication.
Installing the OST Plug-In for Backup Exec on Windows
This topic describes how to install the Dell OpenStorage Transport (OST) plug-in within a Microsoft Windows
environment for performing DR Series system operations via the plug-in.
Make sure that you meet all of the following prerequisites prior to attempting to install the OST plug-in:
NOTE: The Dell OST plug-in needs to be installed on client systems to support client-side deduplication.
1. The Backup Exec installation must be running on one of the supported Windows media server platforms.
2. The Windows OST installer must be present. If not, download the Windows installer (DellOSTPlug-in.msi), which is
available at support.dell.com/drivers, to a network directory location you can access.
Version 2.0.0 of the OST plug-in supports the following versions of Backup Exec: Backup Exec 2010 (Release 3), Backup
Exec 2012, Backup Exec 12.5. Version 2.0.0 of the OST plug-in supports the following Windows-based media servers:
Windows 2003, Windows 2008, and Windows 2008 (Release 2).
NOTE: For the latest information on supported versions, see the Dell DR Series System Interoperability Guide,
available at support.dell.com/manuals.
To install the Dell OST plug-in, complete the following:
1.
Launch the Backup Exec Administrator console, select Tools, and Backup Exec Services....
The Backup Exec Services Manager page is displayed.
2.
Select the server on which you want to install the Dell OST plug-in, and select Stop all services.
The Restarting Backup Exec Services page is displayed, which lists the current status of services for the selected
server.
3.
Click OK.
4.
Launch the Dell Storage Plug-In for Symantec OST Setup Wizard (and accept all default values).
5.
In the Welcome page, click Next to continue.
The End-User License Agreement page is displayed.
6.
Click I accept the terms in the License Agreement, and click Next.
7.
In the Destination Folder page, accept the default destination location, and click Next.
8.
In the Ready to Install Dell Storage Plug-In for Symantec OST page, click Install.
133
When the plug-in has been installed, the Completed the Dell Storage Plug-In for Symantec OST Setup Wizard page
is displayed.
9.
Click Finish to exit the wizard.
Installing the OST Plug-In for NetBackup on Windows
This topic describes how to install the Dell OST plug-in on a media server running the supported Microsoft Windows
server operating system software (and using the NetBackup DMA).
Ensure that you have downloaded the Dell OST plug-in installer into the correct directory on the designated media
server. The OST plug-in installer is saved as DellOSTPlugin64.msi, or DellOSTPlugin.msi (DellOSTPlugin64.msi is for 64bit operating systems and DellOSTPlugin.msi is for 32-bit operating systems). Please ensure that the correct plug-in is
downloaded to support your 64-bit or 32-bit systems.
NOTE: The Dell OST plug-in needs to be installed on client systems to support client-side deduplication.
1.
Stop the NetBackup services if they are running, by using the following command:
Verify if a previous version is already installed. If it is, uninstall it. If SETUP performs this check, there is no need to
do it manually.
$INSTALL_PATH\VERITAS\NetBackup\bin\bpdown.exe
2.
Run SETUP to install the OST plug-in.
3.
Check that the plug-in is installed by using the following NetBackup command on the Windows media server:
$INSTALL_PATH\VERITAS\NetBackup\bin\admincmd\bpstsinfo.exe -pi
This NetBackup command lists the Dell OST plug-in details along with other plug-in details, as shown in the
following example:
–
4.
Plug-In Name: libstspiDellMT.dll
–
Prefix: DELL
–
Label: OST Plug-in that interfaces with the DR Series system
–
Build Version: 9
–
Build Version Minor: 1
–
Operating Version: 9
–
Vendor Version: Dell OST plug-in 10.1
Start the NetBackup services by using the following command:
$INSTALL_PATH\VERITAS\NetBackup\bin\bpup.exe
NOTE: To more information about uninstalling the Dell OST plug-in, see Uninstalling the Dell OST Plug-In for
Windows.
Uninstalling the Dell OST Plug-In for Windows
Use the following uninstall process if you need to uninstall the Dell OST plug-in on a Windows-based media server:
Use the standard Microsoft Windows uninstall process to uninstall the Dell OST plug-in on a Windows-based media
server.
NOTE: Dell recommends that you retain the Dell OST plug-in installer on the media server in case you need to use it
to reinstall the Dell OST plug-in.
The following procedure is an example of the process for a Windows-based media server with an installed Dell OST
plug-in.
134
1.
Click Start, and click Control Panel.
The Control Panel page is displayed.
2.
Under Programs and Features, click Uninstall a program.
The Uninstall or change a program page is displayed.
3.
Locate the Dell OST plug-in in the listed of installed programs, right click and select Uninstall.
The Programs and Features confirmation dialog is displayed.
4.
Click Yes in uninstall the Dell OST plug-in.
Installing the OST Plug-In for NetBackup on Linux
This topic describes how to install the Dell OST plug-in on a media server running the supported Red Hat Enterprise
Linux or SUSE Linux server operating system software (using the NetBackup DMA).
Ensure that you have downloaded the Dell OST plug-in installer into the correct directory on the designated media
server. The OST plug-in installer is saved as Dellostplugin-x86_64-xxxxx.bin.gz, where xxxxx represents its build number.
NOTE: The Dell OST plug-in needs to be installed on client systems to support client-side deduplication.
1.
Unzip the OST plug-in installer file using the following command:
$> /bin/gunzip Dellostplugin-x86_64-xxxxx.bin.gz
2.
Configure the executable bit on the OST plug-in installer using the following command:
$> /bin/chmod a+x Dellostplugin-x86_64-xxxxx.bin
3.
Stop the NetBackup nbrmms service before using the -install option.
The OST plug-in installer returns an error if the NetBackup nbrmms service is running when attempting to install
the OST plug-in.
4.
Run the OST plug-in installer using the -install option, and install the plug-in using the following command:
$> ./Dellostplugin-x86_64-xxxxx.bin -install
NOTE: You must stop the NetBackup nbrmms process before installing the Dell OST plug-in. You are also
required to use the Dell OST plug-in installer to uninstall the plug-in. The location for installing the Dell OST
plug-in is not user-configurable.
5.
Once the OST plug-in installer has stopped running, and the system prompt returns, verify that the plug-in has
loaded properly by checking the output using the following NetBackup command on the Linux media server:
$> /usr/openv/netbackup/bin/admincmd/bpstsinfo -plugininfo
This NetBackup command lists the Dell OST plug-in details as shown:
6.
–
Plug-In Name: libstspiDellMT.so
–
Prefix: DELL
–
Label: Dell OpenStorage (OST) Plug-in
–
Build Version: 10
–
Build Version Minor: 1
–
Operating Version: 10
–
Vendor Version: (EAR-2.0.0) Build: 41640
Retain the OST plug-in installer on the media server so you can use it if needed to uninstall the plug-in.
For information about uninstalling the Dell OST plug-in, see Uninstalling the Dell OST Plug-In for Linux.
135
Uninstalling the Dell OST Plug-In for Linux
Use the following uninstall process if you need to uninstall the Dell OST plug-in on a Linux-based media server:
1.
Stop the NetBackup nbrmms service before using the -uninstall option.
The OST plug-in installer returns an error if the NetBackup nbrmms service is running when attempting to uninstall
the OST plug-in.
2.
Run the OST plug-in installer with the -uninstall option, which uninstalls the plug-in, using the following command:
$> ./Dellostplugin-x86_64-xxxxx.bin -uninstall
NOTE: You must stop the NetBackup nbrmms service before uninstalling the OST plug-in (you are also
required to use the Dell OST plug-in installer to uninstall the plug-in).
3.
Check that the plug-in is uninstalled by using the following NetBackup command on the Linux media server:
$> /usr/openv/netbackup/bin/admincmd/bpstsinfo -plugininfo
NOTE: If the -pluginfo command returns any Dell OST plug-in details, this means that the plug-in has not been
uninstalled.
4.
Retain the OST plug-in installer on the media server in case you need to use it to reinstall the plug-in.
Configuring DR Series System Information Using NetBackup
The topic introduces the concept of configuring the DR Series system information using the NetBackup media server
command line interface (CLI) commands and graphical user interface (GUI) menus, tabs, and options. The NetBackup
CLI commands and GUI menus, tabs, and options allow you to configure both the Linux or Windows media servers. In the
DR Series System Administrator Guide documentation, you will find specific topics that address operations for using the
NetBackup CLI, such as adding the DR Series system name to NetBackup on each Linux and Windows media server you
intend to use with the DR Series system, using the NetBackup GUI to configure it to work with the DR Series system via
OST, using the NetBackup GUI to configure disk pools from logical storage units (LSUs) on the DR Series system, and
using the NetBackup GUI to create storage units using the disk pools on the DR Series system.
Related Links
Configuring NetBackup for the DR Series System
Use the NetBackup graphical user interface (GUI) to configure it to work with the DR Series system via OST.
This process is essentially the same type of operation for either the Linux or Windows platforms.
Configuring the DR Series System Using the Backup Exec GUI
Backup Exec only supports the use of its own graphical user interface (GUI) for configuring the DR Series
system. There is no supported Backup Exec command-line interface (CLI) for using Backup Exec 2010
version.
Using NetBackup CLI to Add DR Series System Name (Windows)
This topic describes how to use the NetBackup CLI to add the DR Series system name to each Windowsbased media server you plan to use with the DR Series system.
Using NetBackup CLI to Add the DR Series System Name (Linux)
136
This topic describes how to use the NetBackup CLI to add the DR Series system name to each Linux-based
media server you plan to use with the DR Series system.
Using NetBackup CLI to Add DR Series System Name (Linux)
This topic describes how to use the NetBackup CLI to add the DR Series system name to each Linux-based media server
you plan to use with the DR Series system.
1.
Add the DR Series system name to NetBackup by using the following command:
/usr/openv/netbackup/bin/admincmd/nbdevconfig -creatests
-storage_server servername -stype DELL -media_server mediaservername
2.
Log in to and authenticate with DR Series system by using the following command (for details, see Configuring an
LSU.
/usr/openv/volmgr/bin/tpconfig -add -storage_server servername -stype DELL sts_user_id backup_user -password password
NOTE: On the DR Series system, only one user account exists, and the user ID for that account is
backup_user. You can only change the password for this account; you cannot create a new account nor can
the existing account be deleted.
Using NetBackup CLI to Add DR Series System Name (Windows)
This topic describes how to use the NetBackup CLI to add the DR Series system name to each Windows-based media
server you plan to use with the DR Series system.
1.
Add the DR Series system name to NetBackup by using the following command:
$INSTALL_PATH\VERITAS\NetBackup\bin\admincmd\nbdevconfig
-creatests -storage_server servername -stype DELL -media_server
mediaservername
2.
Log in to and add the valid credentials for authentication by the DR Series system by using the following command
(for details, see Configuring an LSU).
$INSTALL_PATH\VERITAS\Volmgr\bin\tpconfig -add -storage_server servername stype DELL -sts_user_id backup_user -password password
Configuring NetBackup for the DR Series System
Use the NetBackup graphical user interface (GUI) to configure it to work with the DR Series system via OST. This
process is essentially the same type of operation for either the Linux or Windows platforms.
Log in to NetBackup, and complete the following:
1.
In the main window of the NetBackup Administrator console, click Configure Disk Storage Servers to launch the
Storage Server Configuration Wizard.
The Storage Server Configuration Wizard page is displayed, which is where you can add a storage server.
2.
Select OpenStorage to choose the type of disk storage that you want to configure in this window, and click Next.
The Add Storage Server page is displayed.
3.
Enter the following values to configure a storage server:
–
In Storage server type, enter DELL.
–
In Storage server name, enter the name of the DR Series system.
–
In the Select media server drop-down list, select the desired media server (the server on which you are
configuring OST).
137
–
Enter values for the credential needed to authenticate with the DR Series system:
*
User name
*
Password
*
Confirm password
The credentials should be the same as the credentials that are required for the DR Series system. For more
information, see Configuring an LSU.
4.
Click Next.
The Storage Server Configuration Summary page is displayed, which lists the values you configured.
5.
Click Next.
The storage server you configured and the corresponding credentials are displayed in the Storage Server Creation
Status page.
6.
Click Next and click Finish to close the Storage Server Configuration Wizard.
The Storage server servername successfully created page is displayed. NetBackup is now configured for use with
the DR Series system.
Creating Disk Pools from LSUs
Use the NetBackup graphical user interface (GUI) to configure disk pools from logical storage units (LSUs) on the DR
Series system.
Log in to NetBackup, and complete the following:
1.
In the main window of the NetBackup Administrator console, click Configure Disk Pools to launch the Disk Pool
Configuration Wizard.
The Disk Pool Configuration Wizard page is displayed, which is where you define media servers for use in a disk
pool.
2.
In the Welcome to the Disk Pool Configuration Wizard page, click Next.
The Disk Pool page is displayed.
3.
In Type, select OpenStorage (DELL), and click Next.
The Select Storage Server page is displayed, and contains a list of available storage servers.
4.
In the Storage server list, select a server, and click Next.
The Disk Pool Properties page is displayed.
5.
Select the LSUs (volumes) to include from the list, and click Next.
The Disk Pool Properties page is displayed.
6.
Enter a Disk pool name, and click Next.
The Summary page for the Disk Pool Configuration Wizard is displayed.
7.
Verify the disk pool configuration in the Summary page, and click Next to configure the disk pool you created.
The Performing required task page is displayed, with the status being: Configuration completed successfully. You
have several options available at this point:
–
Deselect the Create a storage unit for the disk pool.
–
Click Finish and close the Disk Pool Configuration Wizard.
–
Click Next to create the storage unit with this disk pool.
NOTE: If you create the storage unit using the Disk Pool Configuration Wizard, you can skip the step where
you create storage units using a disk pool.
8.
138
Click Next to continue with creating a storage unit using this wizard.
9.
Enter a Storage unit name, and click Next.
The Successfully Completed Disk Pool Configuration page is displayed.
10. Click Finish.
To display the disk pool you created, click Devices → Disk Pools in the left navigation pane in the NetBackup
Administrator console.
Creating Storage Units Using the Disk Pool
Use the NetBackup GUI to create storage units using the disk pools on the DR Series system.
Log in to NetBackup, and complete the following tasks:
1.
In the main window of the NetBackup Administrator console, click Storage in the left navigation pane, and select
Storage Units.
2.
In the NetBackup Administrator console main window, right-click and select New Storage Unit from the drop-down
list.
3.
In the New Storage Unit page, enter a name in Storage unit name, and select the OST disk pool that you created in
the Disk pool drop-down list.
4.
Click OK to create the new storage unit.
Backing Up Data from a DR Series System (NetBackup)
This topic describes how to use NetBackup to back up data from a DR Series system.
Before backing up data, you first need to configure a policy that creates a backup on the OpenStorage Technology (OST)
logical storage unit (LSU). This type of policy is similar to what is done for network-attached storage (NAS) shares,
except that when defining policy attributes, you need to select the LSU that contains the OST disk pool.
To back up data from a DR Series system using a policy, complete the following:
1.
Log into the NetBackup Administrator console.
2.
Click NetBackup Management in the left navigation pane, and select Policies.
3.
In the All Policies main window, right-click OST, and select Change Policy from the drop-down list.
The Change Policy page is displayed.
4.
In the Change Policy page, click the Attributes tab, and select the settings for the policy you want to create.
5.
Click OK to create the policy, which displays under OST in the main window.
6.
Right-click the policy, and select Manual Backup from the drop-down list.
The Manual Backup page is displayed.
7.
In the Manual Backup page, enter the name of the media server in Server, and click OK.
To monitor the status of any backup operation, click Activity Monitor in the left navigation pane of the NetBackup
Administrator console, and select the backup job you are interested in to view details about the operation.
Restoring Data from a DR Series System Using NetBackup
This topic describes how to use NetBackup to restore data from a DR Series system. The process for restoring data from
OpenStorage Technology (OST) logical storage units (LSUs) is similar to how restores are performed from any backup
device.
To restore data from a DR Series system, complete the following:
139
1.
Log into the NetBackup Administrator console.
2.
Click Backup, Archive, and Restore in the left navigation pane.
3.
In the Restore main window, click the Restore Files tab.
4.
Select the data that you want to restore, and click OK.
To monitor the status of any restore operation, click Activity Monitor in the left navigation pane of the NetBackup
Administrator console, and select the restore job you are interested in to view details about the operation.
Duplicating Backup Images Between DR Series Systems Using NetBackup
Using NetBackup with the DR Series system, you can duplicate backup images from a disk pool on one DR Series
system to a target disk pool (or a storage unit derived from it) that could be on the same DR Series system or on a
different DR Series system.
To duplicate backup images between DR Series systems using NetBackup, complete the following:
1.
Log into NetBackup Administrator console.
2.
Click NetBackup Management in the left navigation pane, and select Catalog.
3.
In the Catalog main window, select Duplicate from the Action drop-down list, and click Search Now.
The Search Results pane is displayed, which lists images from which you can choose to duplicate.
4.
Right-click to select the image in the Search Results pane that you would like to duplicate, and select Duplicate in
the drop-down list.
The Setup Duplication Variables page is displayed.
5.
In the Setup Duplication Variables page, select the LSU that is the target DR Series system in the Storage unit dropdown list, and click OK.
To monitor the status of any duplicate image operation, perform the following:
•
Click Activity Monitor in the left navigation pane of the NetBackup Administrator console
•
Select the data duplication job in which you are interested
•
View the operation details
Using Backup Exec with a DR Series System (Windows)
This topic introduces the Dell OpenStorage Technology (OST) plug-in and describes its installation prerequisites for
Backup Exec within a Microsoft Windows environment. Once installed, Backup Exec can perform DR Series system
operations via the OST plug-in.
OST Plug-In and Supported Versions
This topic introduces the version 1.0 of the OST plug-in that supports the following versions of Backup Exec:
•
Backup Exec 2010, Release 3
•
Backup Exec 2012
Version 1.0 of the OST plug-in supports the following versions of the Windows media server:
140
•
Server 2003
•
Server 2008
•
Server 2008, Release 2
NOTE: For the latest information, see the Dell DR Series System Interoperability Guide, available at
support.dell.com/manuals.
Installation Prerequisites for the OST Plug-In for Backup Exec
This topic introduces the installation prerequisites for installing the OST plug-in for Backup Exec on Windows media
servers. Ensure that you meet the following prerequisites prior to installing the Dell OST plug-in:
1. The Backup Exec installation must be running on one of the supported Windows platforms.
2. Dell recommends that the DR Series system appliance have an OST container created and configured. For details,
see Configuring an LSU.
3. The Windows OST installer must be present. If not, download the Windows installer (DellOSTPlug-in.msi), which is
available at support.dell.com/support/drivers, to a network directory location you can access.
4. The Dell OST plug-in needs to installed in the following directory on the designated Windows-based media server
running the supported Microsoft Windows operating system software ($INSTALL_PATH\VERITAS\NetBackup\bin
\ost-plugins) for NetBackup installations.
Configuring the DR Series System Using the Backup Exec GUI
Backup Exec only supports the use of its own graphical user interface (GUI) for configuring the DR Series system. There
is no supported Backup Exec command-line interface (CLI) for using Backup Exec 2010 version.
To configure the DR Series system using the Backup Exec GUI, complete the following:
1.
Launch the Backup Exec Administrator console, select Tools, and Backup Exec Services....
2.
Select the server that you want to configure in the Backup Exec Services Manager page, and select Start all
services.
3.
Verify that all services have been started, and click OK.
4.
In the Connect to Media Server page, log into the media server, and enter a User name, a Password, and click OK.
5.
In the Backup Exec Administrator page, click Network, and click Logon Accounts.
The Logon Account Management page is displayed.
6.
Click New to create a new logon account.
The Add Logon Credentials page is displayed.
7.
In the Account Credentials pane, enter the User name and Password account credentials for the DR Series system,
and click OK (for example, the default user name is backup_user).
8.
In the Backup Exec Administrator page, click the Devices tab, and right-click on the local system name that is listed
as the root node.
A drop-down list of device-related options is displayed.
9.
Select Add OpenStorage in the drop-down list.
The Add OpenStorage Device page is displayed.
10. Configure the Add OpenStorage Device page with the following information, and click OK:
–
Server—enter the host name or IP address of the DR Series system.
–
Logon account—select the account from the drop-down list, which has credentials for accessing the DR
Series system.
–
Server type—select the type of plug-in from the drop-down list (DELL OST plug-in).
– Logical storage unit—enter the LSU (DR Series system container) name to use.
11. Click Yes in response to the prompt about making the new device the default destination for new jobs.
12. Close the Add OpenStorage Device page.
141
The Restart Services confirmation dialog is displayed (this dialog recommends against restarting the services if any
jobs are currently running).
13. Click Restart Now to restart the Backup Exec services.
Creating Backups on the DR Series System Using Backup Exec
This topic describes how to use Backup Exec to create backups on the DR Series system.
To create backups on the DR Series system using Backup Exec, complete the following:
NOTE: This procedure documents this process using Backup Exec 2010. The procedure for Backup Exec 2012 is
different. For specific details and procedures, see the product-specific documentation from Symantec for the
specific DMA product and version you are using.
1.
Launch the Backup Exec Administrator console, and select the Job Setup tab.
2.
Click Backup Tasks in the left navigation panel, and select New job.
The Backup Job Properties page is displayed.
3.
In the left navigation pane of the Backup Job Properties page, select Source, and select Selections.
The Selections page is displayed.
4.
Select the system or node name in the center pane of the Selections page, and click the check boxes that
correspond to the files you want backed up.
5.
In the left navigation pane of the Backup Job Properties page, select Destination, and select Device and Media.
The Device and Media page is displayed.
6.
In the Device pane in the Device and Media page, select the DELL OST device in the drop-down list, and click Run
Now to start the backup job.
7.
Click the Job Monitor tab to view the progress of the backup job you created.
Optimizing Duplication Between DR Series Systems Using Backup Exec
The Backup Exec DMA can work with the DR Series system to replicate backups between two DR Series systems that
are part of a defined source and target replication pair. This process uses the deduplication and replication features of
the DR Series system via the OpenStorage Technology (OST).
Using OST, backed up data is catalogued which makes its available from the designated media server so that a
seamless restore can be performed from either the target or source DR Series system. This is considered an integrated
replication, where the OST appliance does the replication. It is considered to be “optimized” because the data flows
from the local appliance directly to the remote appliance in a deduplicated format, and it does not travel through the
media server.
When the data is in a deduplicated format (in an optimized form), only new or unique data is copied between the two DR
Series systems. Because the duplication job is initiated by Backup Exec, there are two entries in its catalog: one entry is
for the source file, while the other entry is for the target file. The backup administrator can restore backup data from
either appliance in case of data loss or disaster.
To optimize duplication between DR Series systems, create an additional OST device that points to the target DR Series
system, and complete the following:
1.
Launch the Backup Exec Administrator console, select the Devices tab, and right-click the target DR Series system.
2.
Select Add OpenStorage in the drop-down list.
The Add OpenStorage Device page is displayed
3.
142
Configure the Add OpenStorage Device page with the following information:
–
Server—enter the host name or IP address of the DR Series system.
–
Logon account—select the account from the drop-down list (or click ... and browse to the account
location), which has credentials for accessing the DR Series system.
–
Server type—select the type of server from the drop-down list (DELL).
–
Logical storage unit—enter the name of the logical storage unit (LSU), also known as a DR Series system
container, to use.
4.
Click Yes in response to the prompt if you want to make the new device the default destination for new jobs.
5.
Close the Add OpenStorage Device page.
6.
Click the Job Setup tab.
7.
In the left navigation pane, select Backup Tasks, and click New job to duplicate backup sets.
The New Job to Duplicate Backup Sets page is displayed.
8.
Select Duplicate existing backup sets, and click OK.
9.
Click the View by Resource tab in the Selections page, and select the dataset you want copied.
10. In the left navigation pane, select Destination, and select Device and Media.
11. In Device, select the destination device from the drop-down list (that was created in this procedure), and click Run
Now to start the replication operation between the two DR Series systems.
Click the Job Monitor tab to view the progress of the replication operation you created.
Restoring Data from a DR Series System Using Backup Exec
This topic describes how to use Backup Exec to restore data from a DR Series system.
To restore data from a DR Series system using Backup Exec, complete the following:
1.
Launch the Backup Exec Administrator console, and select the Job Setup tab.
2.
In the left navigation pane, select Restore Tasks, and click New job.
The Restore Job Properties page is displayed.
3.
Click the View by Resource tab in the Selections pane, and select the dataset to be restored.
4.
Click Run Now to start the restore job.
Click the Job Monitor tab to view the progress of the restore job operation you created.
Understanding the OST CLI Commands
The OpenStorage Transport (OST) --mode component supported in the DR Series system command line interface (CLI)
command supports three values, which represent optimized writes done via: deduplication (--mode dedupe),
passthrough (--mode passthrough), and auto (--mode auto). These OST commands are used in the following format: ost
--update_client --name --mode.
NOTE: If an OST client has four or more CPUs, it is considered to be dedupe-capable. However, the OST client
operating mode depends upon how it is configured in the DR Series system (Dedupe is the default OST client
mode). If the administrator did not configure an OST client to operate in a specific mode and it is dedupe-capable,
it will run in the Dedupe mode. If an OST client is not dedupe-capable (meaning the OST client has less than four
CPUs), and the administrator sets it to run in the Dedupe mode, it will only run in the Passthrough mode. If an OST
client is set to run in Auto mode, the OST client will run in the mode setting determined by the media server. The
following table shows the relationship between the configured OST client mode types and the supported client
mode based on client architecture type and corresponding number of CPUs.
143
Table 5. Supported OST Client Modes and Settings
OST Client Mode
Settings
32–Bit OST Client (4 or 64–Bit Client (4 or
more CPUs)
more CPUs)
32–Bit OST Client
(Less than 4 CPUs)
64–Bit OST Client
(Less than 4 CPUs)
Auto
Passthrough
Dedupe
Passthrough
Passthrough
Dedupe
Not Supported
Supported
Not Supported
Not Supported
Passthrough
Supported
Supported
Supported
Supported
Supported DR Series System CLI Commands for OST
The following are the supported DR Series system CLI commands for OST operations:
administrator@acme100 > ost
Usage:
ost --show [--config]
[--file_history] [--name <name>]
[--clients]
[--limits]
ost --setpassword
ost --delete_client --name <OST Client Hostname>
ost --update_client --name <OST Client Hostname>
--mode <auto|passthrough|dedupe>
ost --limit --speed <<num><kbps|mbps|gbps> | default>
--target <ip address | hostname>
ost --help
ost <command> <command-arguments>
<command> can be one of:
--show
Displays command specific information.
--setpassword
Updates the OST user password.
--delete_client
Deletes the OST client.
--update_client
Updates attributes of the OST client.
--limit
Limits bandwidth consumed by ost.
For command-specific help, please type ost --help <command>
For example:
ost --help show
NOTE: The --files in the ost --show --file_history command represents replicated files that were processed via the
DMA optimized duplication operation. This command displays only up to the last 10 such files. The --name in the
ost --show --name command represents the OST container name.
NOTE: For more information about OST-related DR Series system CLI commands, see the Dell DR Series System
Command Line Reference Guide.
144
Understanding OST Plug-In Diagnostic Logs
There are currently two supported types of OST plug-ins for which you can collect diagnostic logs: NetBackup and
Backup Exec.
NOTE: The directory location, C:\ProgramData, is considered to be a hidden directory on Windows-based systems.
However, you can copy and paste C:\ProgramData\Dell\OST\log\ into your Internet Explorer Address bar or you can
enter this into the Windows command prompt window (Start→ All Programs→ Accessories→ Command Prompt).
For more information about OST, OST plug-ins and logs, see Understanding OST, Installing a Dell OST Plug-In, Rotating
OST Plug-In Logs for Linux, and Rotating OST Plug-In Logs for Windows.
Rotating OST Plug-In Logs for Windows
By default, the Windows log rotation size is set at 10 megabytes (MB). Once a log file has been reached this size, the
OpenStorage Transport (OST) plug-in automatically renames the existing log file, libstspiDell.log to libstspiDell.log.old,
and creates a new log.
Modifying Log Rotation Size
To modify the log rotation size, you can edit the following registry key value:
HKLM\Software\Dell\OST\LogRotationSize
Immediately after modifying this value, the new rotation size value takes effect (meaning that you do not have to restart
the backup process).
Collecting Diagnostics Using a Linux Utility
You can use a Linux utility called Dell_diags to collect diagnostics from Linux-only clients. This Linux utility is installed by
the OST plug-in installer in the /opt/Dell directory. The tool collects the following types of information:
•
var/log/libstspiDell.log.*
•
usr/openv/netbackup/logs
•
usr/openv/logs/nbemm/
•
usr/openv/logs/nbrmms/
The Dell_diags diagnostics file is written to the following location: /var/log/diags_client location.
The following example shows the process for collecting the OST diagnostic logs (the root user account shown
represents one that resides on the media server, and is not to be confused with a root user account on the DR Series
system):
root@oca3400-74 ~]# ./Dell_diags –collect
Collecting diagnostics...Done
Diagnostics location: /var/log/diags_client//oca3400-74_2012-02-27_23-02-13.tgz
The default log level is set to Error in the OST plug-in, is user-configurable, and can be modified via the DR Series system
CLI or GUI.
145
Rotating OST Plug-In Logs for Linux
If you set the OST plug-in log level to Debug, this can cause the plug-in log to quickly grow in size. The best practice for
preventing any issues with log sizes is to rotate the OST plug-in logs using the logrotate utility that is commonly available
on Linux-based systems.
To configure log rotation, complete the following:
1.
Create a file in /etc/logrotate.d/, name it “ost”, and add the following entries:
/var/log/libstspiDell.log {
rotate 10
size 10M
copytruncate
}
2.
Create a file in /etc/cron.hourly/, name it “ost_logrotate.cron”, and add the following entries:
#!/bin/bash
/usr/sbin/logrotate /etc/logrotate.d/ost
The logrotate utility runs every hour, and rotates the logs whenever the log file size exceeds 10 megabytes (MB). This
procedure is automated and is available as part of the OST plug-in installation.
Guidelines for Gathering Media Server Information
In addition to the DR Series system diagnostics log file bundles and core files that you can collect for history and
troubleshooting purposes, if you have run any OpenStorage Technology (OST) operations, Dell recommends that you
also gather some important media server-related files. This topic introduces some of these key media server files that
reside on Linux and Windows platforms .
NetBackup on Linux Media Servers
For NetBackup running on a Linux media server, Dell recommends gathering the following files:
•
OST plug-in configuration files and log files from the media server
–
•
•
146
Location: /var/log/libstspiDell.log.*
NetBackup backup job logs and command logs from the media server:
–
Location: NetBackup log files reside in /usr/openv/netbackup/logs/. For each process in NetBackup,
there is a subdirectory in the logs directory. Dell is interested in the following process-related logs:
bptm, bpdm, bprd, bpcd, bpbrm.
–
Be aware that these five directories may not exist by default, so only collect these logs if they exist on
your media server. If they were created, the locations where these log files reside are as follows: /usr/
openv/netbackup/logs/bptm, /usr/openv/netbackup/logs/bpdm, /usr/openv/netbackup/logs/bpcd, /usr/
openv/netbackup/logs/bprd, and /usr/openv/netbackup/logs/bpbrm.
–
Dell recommends that you collect logs from the following directories: /usr/openv/logs/nbemm and /usr/
openv/logs/nbrmms/.
Check for any core files that were generated on the NetBackup media server or on the DR Series system that
can include:
–
Core files on a Linux NetBackup media server reside in the /usr/openv/netbackup/bin directory. Most of
the NetBackup binaries that link with the OST plug-in are in this directory.
–
The location of the core files on the client is not a fixed location. Verify if the core files reside in
following directories: /, /root/, or the directory mentioned in the /proc/sys/kernel/core_pattern. For
example, if the following is a core_pattern from a DR Series system (/var/cores/core.%e.%p.%t), then all
the core files would reside in /var/cores.
Dell recommends that if core_pattern on the client is set by NAT to a specific directory, then the diagnostics script has
to look into that directory for any related cores.
NetBackup on Windows Media Servers
For NetBackup running on a Windows media server, Dell recommends gathering the following files:
•
OST plug-in configuration files and log files from the media server:
–
•
Location: %ALLUSERSPROFILE%\Dell\OST\log\libstspiDell.log*
NetBackup job logs and command logs from the media server, with log files from following directories:
–
C:\Program Files\Veritas\NetBackup\logs\bptm (if it exists)
–
C:\Program Files\Veritas\NetBackup\logs\bpdm (if it exists)
–
C:\Program Files\Veritas\NetBackup\logs\bpbrm (if it exists)
–
C:\Program Files\Veritas\NetBackup\logs\bprd (if it exists)
–
C:\Program Files\Veritas\NetBackup\logs\bpcd (if it exists)
–
C:\Program Files\Veritas\NetBackup\logs\nbemm
–
C:\Program Files\Veritas\NetBackup\logs\nbrmms
•
Any core files generated on the NetBackup media server or on the DR Series system.
•
If a server failure is involved (which could be an inapparent or silent failure), the Windows media server event
log for the application could be collected by using Administrative Tools → Event Viewer. Next, check the
Windows Logs → Application. Typically, the last entry marked with Error is the one for which you are searching.
–
Copy and paste this text in the window, as shown in the following example:
Faulting application bptm.exe, version 7.0.2010.104, time stamp
0x4b42a78e, faulting module libstspiDellMT.dll, version 1.0.1.0,
time stamp 0x4f0b5ee5, exception code 0xc0000005, fault offset
0x000000000002655d, process id 0x12cc, application start time
0x01cccf1845397a42.
–
If the system is unresponsive, force the crash of bptm.exe and complete the following:
1. Click to open Task Manager.
2. Locate the process.
3. Right-click, and select Create Dump File.
4. Retrieve the dump file from the location specified in the dialog that displays after the dump file is
created.
Backup Exec on Windows Media Servers
For Backup Exec running on a Windows media server, Dell recommends gathering the following files:
•
OST plug-in configuration files and log files from the media server:
–
Location: %ALLUSERSPROFILE%\Dell\OST\log\libstspiDell.log*
•
Backup Exec job logs and command logs from the media server.
•
Any core files generated on the Backup Exec media server or on the DR Series system.
•
If a crash is involved, collect any mini-dump file(s) that reside in %ProgramFiles%\Symantec\Backup Exec
\BEDBG.
147
•
If the system is unresponsive, force the crash of pvlsvr.exe and bengine.exe, and complete the following:
a. Open Task Manager.
b. Locate the process.
c. Right-click, and select Create Dump File.
d. Retrieve the dump file from the location specified in the dialog that displays after the dump file is created.
148
Troubleshooting and Maintenance
9
This topic provides an overview of the basic troubleshooting and maintenance information that is available to help you
better understand the current state of your DR Series system. The following list of information sources can aid you in
understanding the current state of and maintaining your system:
•
System alert and system event messages:
for more information, see DR Series System Alert and Event Messages, which provides a tables that list the
system alerts and system events.
•
Diagnostics service:
for more information, see About the Diagnostics Service.
•
Maintenance mode:
for more information, see About the DR Series Maintenance Mode.
•
Support mode:
for more information, see About the DR Series Support Mode.
•
Scheduling system operations:
for more information, see Scheduling DR Series System Operations.
•
Scheduling Replication operations:
for more information, see Creating a Replication Schedule.
•
Scheduling Cleaner operations:
for more information, see Creating a Cleaner Schedule.
Troubleshooting Error Conditions
To troubleshoot error conditions that disrupt your normal DR Series system operations, complete the following
1.
Generate a DR Series system diagnostics log file bundle if one has not already been automatically created.
For more information, see Generating a Diagnostics Log File.
2.
Check the system alert and system event messages to determine the current status of your DR Series system.
For more information, see DR Series System Alert and Event Messages, Monitoring System Alerts, and Monitoring
System Events.
3.
Verify if the DR Series system has recovered or whether it has entered into Maintenance mode or Support mode.
For more information, see About the DR Series System Maintenance Mode and About the DR Series System
Support Mode.
4.
If you cannot resolve the issue using the information in this DR Series system documentation, then read Before
Contacting Dell Support, and seek assistance from Dell Support.
149
DR Series System Alert and Event Messages
The DR Series system provides a variety of system alert and system event message types that describe the current state
of the system. You can review these messages, and see if there are any actions you can perform to resolve any reported
issue.
Dell recommends that you refer to the material in this and other related topics:
•
Before any attempt is made to troubleshoot your DR Series system.
•
Before contacting Dell Support for technical assistance.
You may be able to resolve any basic issues using the information presented in the DR Series system documentation.
Some alert and event messages are purely informational, and provide general system status. Other alert and event
messages display specific status or component information or suggest a specific task you can perform to resolve an
issue or to verify that a condition exists.
There are still other alert and event messages that direct you to contact Dell Support for assistance, where Dell Support
intervention may be required.
•
Table 1 lists the DR Series System Alert Messages by system alert type: general system, system chassis,
NVRAM, and PERC-specific alert messages that could be displayed during the course of backup and
deduplication-related operations.
•
Table 2 lists the DR Series System Event Messages by system event type (type 1 through 7): event messages that
could be displayed during the course of backup, replication, deduplication, diagnostics, cleaner, DataCheck,
maintenance, and OpenStorage Technology (OST) operations.
Table 6. DR Series System Alert Messages
Alert Message
Description/Meaning or Action
General System Alerts
Filesystem scan requested.
System is switching to Maintenance mode. Filesystem has
read-only access.
NVRAM not detected.
Ensure that the NVRAM card is seated properly.
NVRAM capacitor is disconnected.
Contact Dell Support for possible support assistance or
intervention.
NVRAM capacitor has degraded.
Contact Dell Support for possible support assistance or
intervention.
NVRAM solid-state drives (SSD) are disconnected.
Contact Dell Support for possible support assistance or
intervention.
NVRAM has failed to backup or restore data during the
last boot.
Contact Dell Support for possible support assistance or
intervention.
NVRAM hardware failure.
Contact Dell Support for possible support assistance or
intervention.
Data volume is not present. Check that all drives are
installed and powered up.
Contact Dell Support for possible support assistance or
intervention.
File server failed to start after multiple attempts.
Contact Dell Support for possible support assistance or
intervention.
150
Alert Message
Description/Meaning or Action
File server failed multiple times. Entering Maintenance
mode.
Contact Dell Support for possible support assistance or
intervention.
Insufficient disk space exists.
The filesystem is now read-only.
Unable to detect filesystem type on the Data volume.
Contact Dell Support for possible support assistance or
intervention.
Unable to detect filesystem type on the Namespace
volume.
Contact Dell Support for possible support assistance or
intervention.
Filesystem scan discovered inconsistencies.
Please check the filesystem report, and perform the
suggested action. Contact Dell Support for possible
assistance or intervention.
Replication peer network disconnected.
Check access to remote site.
NVRAM does not match the data volume.
If this is a newly replaced NVRAM, use the maintenance -hardware --reinit_nvram command to reinitialize the
NVRAM.
For more information, see the Dell DR Series System
Command Line Reference Guide.
Storage usage is approaching the system capacity.
Clean up the filesystem. If issue persists, contact Dell
Support for possible assistance or intervention.
Replication resync cannot proceed.
Namespace limit has reached its maximum.
Out of space on replication target.
Clean up the filesystem. If issue persists, contact Dell
Support for possible assistance or intervention.
The filesystem has reached the maximum allowable limit
for files and directories. Creating new files and
directories will be denied.
Clean up the filesystem. If issue persists, contact Dell
Support for possible assistance or intervention.
System Chassis Alerts
Power Supply <number> detected a failure.
•
•
•
Reconnect the power cable to the designated
power supply unit if it is disconnected.
Ensure that there is input AC power at the power
cable.
Use a different power cord.
If this does not resolve the issue, replace the designated
power supply.
Power Supply <number> is missing or has been removed.
•
•
•
•
•
The power supply might not be making a proper
connection.
Try reseating the power supply in the power
supply slot.
Reconnect the power cable to the designated
power supply unit if it is disconnected.
Ensure that there is input AC at the power cable.
Use a different power cord.
151
Alert Message
Description/Meaning or Action
If this does not resolve the issue, replace the designated
power supply.
Power Supply <number> is unplugged.
•
•
•
Fan <number> failed.
•
•
Reconnect the power cable to the designated
power supply unit if it is disconnected.
Ensure that there is input AC power at the power
cable.
Use a different power cord.
Verify that the designated cooling fan is present
and is installed correctly.
Verify that the designated cooling fan spins up and
runs.
If this does not resolve the issue, replace the designated
cooling fan.
Fan <number> is missing.
Attach or replace the designated missing cooling fan.
Abnormal network errors detected on Network Interface
Controller <number>.
The Network Interface Controller errors could be caused
by network congestion or by packet errors.
•
•
Network Interface Controller is missing.
•
•
Check your network. If that does not resolve the
problem, then replace the NIC.
If the NIC is embedded, the DR Series system
appliance requires service.
Remove and reinsert the NIC.
If this does not resolve the problem, replace the
NIC.
Network Interface Controller <name> is disconnected.
Connect it to a network and/or check your network
switches or routers for any network connectivity issues.
Network Interface Controller <name> is disabled.
Enable the port on the designated NIC.
Network Interface Controller <name> driver is bad.
Upgrade the DR Series system appliance (in the Software
Upgrade page, and click Start Upgrade).
CPU <name> failed.
Replace the designated failed processor.
CPU <name> is missing.
Reinsert or replace the designated missing processor.
DIMM <name> failed.
Replace the designated failed DIMM (Dual In-line Memory
Module) device.
DIMM <name> is missing.
•
•
•
Reinsert or replace the designated DIMM device.
The memory capacity of the storage appliance is
below the minimum required for correct operation.
The storage appliance requires service.
Temperature probe <name> failed.
The storage appliance requires service.
Voltage probe <name> failed.
The storage appliance requires service.
152
Alert Message
Temperature probes have recorded temperatures in the
failed range.
Description/Meaning or Action
•
•
•
Voltage probes have recorded readings in the failed
range.
•
•
Check the Events page in the DR Series system for
specific temperature events and the location of the
temperature probes.
Check the data center air conditioning, ventilation,
and internal system cooling fans for any problems.
Ensure there is proper air flow through the storage
appliance, and as needed, clean the cooling vents.
Check the Events page in the DR Series system for
specific voltage events and the location of the
voltage probes.
Check the power supplies. If there are no issues
with the power supplies, have a service technician
check the DR Series system appliance to see if it
requires any servicing.
Storage Controller <number> failed.
Replace the RAID controller in the DR Series system.
Storage Controller <number> is missing.
Reinsert or replace the RAID controller in the DR Series
system.
Storage Controller <number> has an illegal configuration. The expected number of virtual drives is <number>, and
the actual number of virtual drives found was <number>.
Run the Dell Restore Manager (RM) utility to repair the
drive configuration mismatch.
The expected number of enclosures is <number>, and the
actual number of enclosures found was <number>.
•
•
Check the SAS cable connections between the
storage controller and all its enclosures.
Check the power cable connections to the
enclosure power supplies.
Physical disk <number> failed.
Replace the physical disk that failed.
Physical disk <number> is missing, removed, or it cannot
be detected.
Reinsert or replace the physical disk.
Physical disk <number> predictive failure reported.
Replace the physical disk.
NOTE: Even though the disk may not have failed yet,
the recommended best practice is to replace the disk.
Physical disk <number> is an unsupported type.
This disk type is unsupported and cannot be used in this
configuration.
Replace the unsupported physical disk with a Dellsupported SAS physical disk.
Physical disk <number> has been manually set to offline
with a configuration command.
Remove the physical disk and reinsert it (the drive is nonoperational in this state).
Physical disk <number> is foreign.
This can occur when a storage controller has been
replaced or all drives have been migrated from another
system. In such cases, the foreign configuration should be
imported.
153
Alert Message
Description/Meaning or Action
If this is seen on a single physical disk, the foreign
configuration should be cleared.
NOTE: This condition can also be seen when a drive is
removed and reinserted while a rebuild is still in
progress.
Virtual Disk <number> failed.
Replace any failed or missing physical disk(s) and run the
Dell Restore Manager (RM) utility.
Virtual Disk <number> has an invalid layout.
Run the Dell Restore Manager (RM) utility to repair this
installation.
<device> failed.
•
•
•
<device> is missing.
•
•
Verify that the device is present, and then check
that the cables are properly connected. For more
information, see the Dell DR Series System
Owner’s Manual to verify the system cabling is
correct.
Check the connection to the controller battery and
the status of battery health.
If none of these steps resolve the problem, replace
the storage controller battery.
Verify that the device is present, and then check
that the cables are properly connected. For more
information, see the Dell DR Series System
Owner’s Manual to verify the system cabling is
correct.
Check the connection to the controller battery and
the status of battery health.
NOTE: A battery with a weak or depleted charge can
cause this warning.
Storage <device> has failed.
Check cable connections between the storage controller
and the enclosure or backplane.
Storage <device> is missing.
Perform the following:
•
•
Check SAS and power cable connections between
the storage controller and the enclosure or
backplane.
Check the external enclosure management
modules (EMM) and PERC status LEDs.
NVRAM Alerts
NVRAM PCI Controller failed.
Replace the NVRAM PCI Controller.
NVRAM PCI Controller is missing.
Reinsert or replace the NVRAM PCI Controller.
Super Capacitor on the NVRAM PCI Controller failed.
Replace the NVRAM PCI Controller.
Super Capacitor on the NVRAM PCI Controller is missing. Replace the NVRAM PCI Controller.
Failed to check software compatibility.
154
Upgrade the DR Series system appliance (in the Software
Upgrade page, click Start Upgrade).
Alert Message
Description/Meaning or Action
The system software package is incompatible with the
current software stack.
Upgrade the DR Series system appliance (in the Software
Upgrade page, click Start Upgrade).
PERC Alerts
The storage appliance failed to gather the system
diagnostics.
Storage Appliance Critical Error: BIOS System ID is
incorrect for correct operation of this storage appliance.
•
•
•
Resolve all issues in the DR Series system
diagnostics log bundle.
Re-attempt to collect the diagnostics log bundle.
Contact Dell Support for assistance.
•
•
The DR Series system appliance requires service.
Contact Dell Support for assistance.
Table 7. DR Series System Event Messages
System Event Message
Description/Meaning or Action
System Event = Type 1
System memory usage has returned to an optimal
level.
Informational message. No user intervention is required.
A high level of system process usage has been
detected, if it persists, please collect system
diagnostics.
Informational message. No user intervention is required.
System process usage has returned to an optimal
level.
Informational message. No user intervention is required.
A high-temperature reading has been detected on the
NVRAM PCI controller. System will operate only in a
read-only mode. Please check system airflow.
Informational message. No user intervention is required.
A high-temperature reading has been detected on the
NVRAM PCI controller. System will not become
operational until the temperature reduces to an
ambient value of 55 degrees Celsius (131 degrees
Fahrenheit).
Informational message. No user intervention is required. If
issue persists, contact Dell Support for assistance or
intervention.
The next NVRAM capacitor health check is scheduled
for <variable>.
Informational message. No user intervention is required.
Windows Active Directory client is unable to contact
the Active Directory domain server.
Informational message. No user intervention is required.
Active Directory domain server connectivity is
restored.
Informational message. No user intervention is required.
The system IP address has changed from <variable> to Informational message. No user intervention is required.
<variable>.
Filesystem scan has been requested. Switching to
Maintenance mode. Filesystem has read-only access.
Informational message. No user intervention is required.
155
System Event Message
Description/Meaning or Action
NVRAM not detected. Ensure card is seated properly.
Verify that the NVRAM card is seated properly in the DR
Series system appliance. Contact Dell Support for assistance
or intervention.
NVRAM capacitor is disconnected.
Contact Dell Support for assistance or intervention.
NVRAM capacitor has degraded.
Contact Dell Support for assistance or intervention.
NVRAM SSD is disconnected.
Contact Dell Support for assistance or intervention.
NVRAM has failed to backup or restore data during the Contact Dell Support for assistance or intervention.
last boot.
NVRAM hardware failure.
Contact Dell Support for assistance or intervention.
Data volume is not present. Check that all drives are
inserted and powered up.
Contact Dell Support for assistance or intervention.
Filesystem server failed to start after multiple attempts. Contact Dell Support for assistance or intervention.
Filesystem server crashed multiple times. System is
now entering Maintenance mode.
Contact Dell Support for assistance or intervention.
Insufficient disk space. Filesystem switched to readonly mode.
Informational message. No user intervention is required. If
issue persists, contact Dell Support for assistance or
intervention.
Unable to detect filesystem type on the Data Volume.
Contact Dell Support for assistance or intervention.
Unable to detect filesystem type on the Namespace
Volume.
Contact Dell Support for assistance or intervention.
Filesystem scan discovered inconsistencies.
Please check report and take the recommended action.
Contact Dell Support for assistance or intervention.
NVRAM does not match data volume.
If this is a newly replaced NVRAM device, use the CLI
maintenance --hardware --reinit_nvram command. For more
information, see the Dell DR Series System Command Line
Reference Guide.
Storage usage is approaching the DR Series system
capacity.
Informational message. No user intervention is required. If
issue persists, contact Dell Support for assistance or
intervention.
Replication resync cannot proceed because the
Namespace depth has reached its maximum.
Informational message. No user intervention is required. If
issue persists, contact Dell Support for assistance or
intervention.
Filesystem has reached the maximum allowable file(s)
and directories limit. New file and directory creation
will be denied until sufficient space exists.
Please clean up the filesystem. If issue persists, contact Dell
Support for assistance or intervention.
Filesystem is reaching the maximum allowable file(s)
and directories limit. New file and directory creation
will be denied after the limit has been reached.
Please clean up the filesystem. If issue persists, contact Dell
Support for assistance or intervention.
Replication has encountered an unexpected error.
Contact Dell Support for assistance or intervention.
156
System Event Message
Description/Meaning or Action
DataCheck has detected a potential corruption.
Run data consistency checks at the first available opportunity.
If this issue persists, contact Dell Support for assistance or
intervention.
Temperature warning detected on NVRAM PCI
controller.
Please check the data center air conditioning, rack
ventilation, and internal cooling fans for any issues. Ensure
that there is proper air flow through the system appliance,
and clean the system cooling vents as needed. If issue
persists, contact Dell Support for assistance or intervention.
Filesystem Name Space partition has reached its
maximum allowable limit.
Please delete any old, unused file(s) or disable replication(s).
If issue persists, contact Dell Support for assistance or
intervention.
Filesystem Name Space partition is reaching its
maximum allowable limit.
New replication resynch(s) will be stopped. If issue persists,
contact Dell Support for assistance or intervention.
One or more software packages are incompatible.
Please upgrade the system appliance to rectify the issue.
Upgrade the DR Series system appliance (in the Software
Upgrade page, click Start Upgrade).
System Event = Type 2
Container <name> created successfully.
Informational message. No user intervention is required.
Container <name> marked for deletion.
For more information, see Deleting Containers. Use the DR
Series system CLI maintenance --filesystem --reclaim_space
command to recover this storage space.
Successfully renamed container <name> as <name>.
Informational message. No user intervention is required.
Successfully added connection entry for container
<name>: type <variable> clients <variable>.
Informational message. No user intervention is required.
Successfully updated connection entry for container
<name>: type <variable> clients <variable>.
Informational message. No user intervention is required.
Successfully deleted connection entry for container
<name>: type <variable> clients <variable>.
Informational message. No user intervention is required.
Replication entry updated successfully for container
<name>: role <variable> peer <variable> peer
container <variable>.
Informational message. No user intervention is required.
Replication configuration updated successfully for
container <name>: role <variable> peer <variable>.
Informational message. No user intervention is required.
Replication configuration deleted successfully for
container <name>: peer <variable> peer container
<name>.
Informational message. No user intervention is required.
Replication <variable> defaults successfully updated:
role <variable> peer <variable>.
Informational message. No user intervention is required.
Successfully updated replication bandwidth limit for
<variable> to <variable>.
Informational message. No user intervention is required.
157
System Event Message
Description/Meaning or Action
Successfully removed replication bandwidth limit for
<variable>.
Informational message. No user intervention is required.
Successfully set <variable> replication bandwidth
limit.
Informational message. No user intervention is required.
Successfully initiated replication resync on container
<name>.
Informational message. No user intervention is required.
Failure initiating replication resync on container
<name>.
For more information, see Managing Replication Operations.
Snapshot <variable> → <variable> created
successfully.
Informational message. No user intervention is required.
Snapshot <variable> → <variable> successfully
updated.
Informational message. No user intervention is required.
Snapshot <variable> → <variable> successfully
deleted.
Informational message. No user intervention is required.
Online data verification <variable> successfully.
Informational message. No user intervention is required.
Successfully <variable> system marker for <variable>. Informational message. No user intervention is required.
Successfully updated <variable> schedule.
Informational message. No user intervention is required.
System Event = Type 3
System is entering Maintenance mode.
Informational message. No user intervention is required.
Contact Dell Support for assistance or intervention.
System is entering Support mode.
Informational message. No user intervention is required.
Contact Dell Support for assistance or intervention.
Failure—OFS client initialization failure.
Contact Dell Support for assistance or intervention.
Failure—mtab initialization failure for container if
<variable>.
Contact Dell Support for assistance or intervention.
Failure—cannot initialize node mtab.
Contact Dell Support for assistance or intervention.
Failure retrieving configuration for container ID
<variable>.
Contact Dell Support for assistance or intervention.
Failure deleting container ID <variable>.
Contact Dell Support for assistance or intervention.
Failure stopping container ID <variable>.
Contact Dell Support for assistance or intervention.
Failure adding connection <variable> for container ID
<variable>.
Contact Dell Support for assistance or intervention.
Failure deleting connection <variable> for container ID Contact Dell Support for assistance or intervention.
<variable>.
Replication started as per schedule, will be active until Informational message. No user intervention is required.
<variable>.
Replication stopped as per schedule, will restart at
<variable>.
158
Informational message. No user intervention is required.
System Event Message
Description/Meaning or Action
Container replay failed for container <variable>.
Informational message. No user intervention is required.
Contact Dell Support for assistance or intervention.
Failure—Name Space subsystem initialization failed.
Informational message. No user intervention is required.
Contact Dell Support for assistance or intervention.
Inconsistencies were found in the Name Space.
Please schedule a filesystem consistency check using the DR
Series system CLI maintenance --filesystem --start_scan
command.
System entering Maintenance mode—Name Space
log replay failed.
Contact Dell Support for assistance or intervention.
System entering Maintenance Mode—Name Space
transaction failure.
Contact Dell Support for assistance or intervention.
Failure—failed to commit Name Space transaction.
Contact Dell Support for assistance or intervention.
Filesystem has reached the maximum supported
number of Name Space entries.
Please clean up the filesystem to allow new file and directory
create operations. If this condition persists, contact Dell
Support for assistance or intervention.
Filesystem has recovered from a lack of available
Name Space entries.
Filesystem create operations will now be allowed. Contact
Dell Support for assistance or intervention.
Internal attributes of some files were found to be
corrupt. The DR Series system will not allow the
setting or removing of Attributes or ACLs on files that
have corrupt attributes.
To find all files with corrupt attributes and to clear the state,
please perform a maintenance scan using the DR Series
system CLI maintenance --filesystem --start_scan command.
Contact Dell Support for assistance or intervention.
Replication resync started for container <variable>.
Informational message. No user intervention is required.
Replication internal resync started for container
<variable>.
Informational message. No user intervention is required.
Replication resync completed for container <variable>. Informational message. No user intervention is required.
Replication internal resync completed for container
<variable>.
Informational message. No user intervention is required.
Failure creating replication snapshot for container
<variable>.
If condition persists, reduce number of inodes, or contact Dell
Support for assistance or intervention.
Failure deleting replication snapshot for container
<variable>.
If condition persists, reduce number of inodes, or contact Dell
Support for assistance or intervention.
Replication client connected for container <variable>.
Informational message. No user intervention is required.
Replication client disconnected for container
<variable>.
Verify that the ports for replication (9904, 9911, 9915, and 9916)
and OST (10011 and 11000) operations have been enabled. If
issue persists, contact Dell Support for assistance or
intervention.
Replication server connected for container <variable>. Verify that the ports for replication (9904, 9911, 9915, and 9916)
and OST (10011 and 11000) operations have been enabled. If
issue persists, contact Dell Support for assistance or
intervention.
159
System Event Message
Description/Meaning or Action
Replication server disconnected for container
<variable>.
Informational message. No user intervention is required.
Replication Name Service volume operations log
(oplog) full for container <variable>.
Verify that the ports for replication (9904, 9911, 9915, and 9916)
and OST (10011 and 11000) operations have been enabled. If
issue persists, contact Dell Support for assistance or
intervention.
DR Series entering Maintenance mode due to corrupt
Name Service volume operations log (oplog) for
container <variable>.
The DR Series system should self-correct itself. If condition
persists, reduce number of inodes, or contact Dell Support for
assistance or intervention.
Replication data operations log (oplog) full for
container <variable>.
The DR Series system should self-correct itself. If condition
persists, reduce number of inodes, or contact Dell Support for
assistance or intervention.
DR Series entering Maintenance mode due to corrupt
replication data operations log (oplog) for container
<variable>.
The DR Series system should self-correct itself. If condition
persists, reduce number of inodes, or contact Dell Support for
assistance or intervention.
System entering Maintenance mode due to corrupt
blockmap for container <variable> scid <variable>.
The DR Series system should self-correct itself. If condition
persists, reduce number of inodes, or contact Dell Support for
assistance or intervention.
System entering Maintenance Mode due to corrupt
datastore <variable> scid <variable>.
The DR Series system should self-correct itself. If condition
persists, reduce number of inodes, or contact Dell Support for
assistance or intervention.
Replication transmit log (txlog) full for container
<variable>.
The DR Series system should self-correct itself. If condition
persists, reduce number of inodes, or contact Dell Support for
assistance or intervention.
DR Series entering Maintenance mode due to corrupt
replication txlog for container <variable>.
Collect a diagnostics log file, and open a Support record with
Dell Support for assistance.
System entering Maintenance mode due to replication Collect a diagnostics log file, and open a Support record with
txlog commit error <variable> for container <variable>. Dell Support for assistance.
DR Series entering Maintenance mode due to corrupt
chunk data for container <variable>.
Collect a diagnostics log file, and open a Support record with
Dell Support for assistance.
File replication unable to make progress on container
<variable>.
Collect a diagnostics log file, and open a Support record with
Dell Support for assistance.
Replication syncmgr exited for container <variable>
error <variable>.
Collect a diagnostics log file bundle, and open a Support
record with Dell Support for assistance.
Replication syncmgr event for container <variable>
error <variable>.
Collect a diagnostics log file bundle, and open a Support
record with Dell Support for assistance.
Replication Name Service exited for container
<variable> error <variable>.
Collect a diagnostics log file bundle, and open a Support
record with Dell Support for assistance.
Replication data replicator exited for container
<variable> error <variable>.
Collect a diagnostics log file bundle, and open a Support
record with Dell Support for assistance.
160
System Event Message
Description/Meaning or Action
Replication protocol version mismatch for container
<variable> error <variable>.
Collect a diagnostics log file bundle, and open a Support
record with Dell Support for assistance.
Replication delete cleanup failed for container
<variable> error <variable>.
Collect a diagnostics log file bundle, and open a Support
record with Dell Support for assistance.
Replication target system <variable> is running low on Informational message. Contact Dell Support for assistance or
space. Replication cannot proceed further on
intervention.
container <variable>.
Replication misconfiguration detected for container
<variable>. Replication relationship might have been
deleted forcibly on target system <variable>.
Informational message. Contact Dell Support for assistance or
intervention.
Replication failed for container <variable> error
<variable>.
Collect a diagnostics log file bundle, and open a Support
record with Dell Support for assistance.
Replication server failed to commit blockmap for
The DR Series system should self-correct itself. If condition
container <variable>. System is entering Maintenance persists, reduce number of inodes, or contact Dell Support for
mode.
assistance or intervention.
Replication container <variable> is paused due to files Run the Cleaner on the replica container. If condition persists,
pending in the Cleaner process.
contact Dell Support for intervention or assistance.
System is running a lower version of RPC. This will
stall replication on all target containers.
Please upgrade RPC to correct version. If condition persists,
contact Dell Support for intervention or assistance.
NFS client successfully mounted <variable>.
Informational message. No user intervention is required.
Maximum NFS connection limit <variable> reached,
active NFS connections <variable>.
You have reached the threshold limit. Reduce the number of
connections.
NFS server started successfully.
Informational message. No user intervention is required.
CIFS client successfully connected to container
<variable>.
Informational message. No user intervention is required.
Maximum CIFS connection limit <variable> reached.
You have reached the threshold limit. Reduce the number of
connections.
CIFS server failed to start <variable>.
Reboot the DR Series system. If issue persists, contact Dell
Support for assistance or intervention.
CIFS client connected <variable> times to container
<variable>.
Reboot the DR Series system. If issue persists, contact Dell
Support for assistance or intervention.
CIFS server started successfully.
Informational message. No user intervention is required.
Online data verification (DataCheck) started.
Informational message. If issue persists, contact Dell Support
for assistance or intervention.
Online data verification (DataCheck) suspended.
Informational message. If issue persists, contact Dell Support
for assistance or intervention.
Online data verification (DataCheck) stopped.
Informational message. If issue persists, contact Dell Support
for assistance or intervention.
161
System Event Message
Description/Meaning or Action
Online data verification (DataCheck) resumed.
Informational message. If issue persists, contact Dell Support
for assistance or intervention.
Online data verification (DataCheck) detected
<variable> corruption.
Informational message. If issue persists, contact Dell Support
for assistance or intervention.
Online data verification (DataCheck) detected
<variable> corruptions.
Informational message. If issue persists, contact Dell Support
for assistance or intervention.
Online data verification (DataCheck) failed to start.
Informational message. If issue persists, contact Dell Support
for assistance or intervention.
System Event = Type 4
Unable to load deduplication dictionary <variable>.
Use the DR Series system CLI maintenance --configuration -reinit_dictionary command. If this issue persists, contact Dell
Support for assistance or intervention.
Unable to locate deduplication dictionary <variable>.
Use the DR Series system CLI maintenance --configuration -reinit_dictionary command. If issue persists, contact Dell
Support for assistance or intervention.
Cleaner process run <variable> started.
Informational message. No user intervention is required.
Cleaner process run <variable> completed in
<variable> milliseconds (ms).
Informational message. No user intervention is required.
Cleaner process encountered input/output (I/O) errors. Maintenance-based issue with the DR Series system. Check
status using Maintenance mode or DR Series system CLI
commands. Contact Dell Support as needed.
Failure to sync NVRAM <variable>.
NVRAM hardware issue with the DR Series system. Check
status using Maintenance mode or DR Series system CLI
commands.
Failure in reading from NVRAM <variable>.
NVRAM hardware issue with the DR Series system. Check
status using Maintenance mode or DR Series system CLI
commands.
Failure in writing to NVRAM <variable>.
NVRAM hardware issue with the DR Series system. Check
status using Maintenance mode or DR Series system CLI
commands.
Failure to write sync NVRAM <variable>.
NVRAM hardware issue with the DR Series system. Check
status using Maintenance mode or DR Series system CLI
commands.
Datastore <variable> length mismatch <variable>.
Maintenance-based issue with the DR Series system. Check
status using Maintenance mode or DR Series system CLI
commands. Contact Dell Support as needed.
Data volume capacity threshold reached.
Informational message. No user intervention is required.
Out of space. Rollback of updates on object <variable> Maintenance-based issue with the DR Series system. Check
failed. Restarting file server.
status using Maintenance mode or DR Series system CLI
commands. Contact Dell Support as needed.
162
System Event Message
Description/Meaning or Action
Failure reading from data volume.
Maintenance-based issue with the DR Series system. Check
status using Maintenance mode or DR Series system CLI
commands. Contact Dell Support as needed.
Failure writing to data volume.
Maintenance-based issue with the DR Series system. Check
status using Maintenance mode or DR Series system CLI
commands. Contact Dell Support as needed.
Checksum verification on metadata failed.
Contact Dell Support for assistance or repair the filesystem.
For repairs, see About The DR Series Maintenance Mode.
Optimization engine log replay failed.
Contact Dell Support for assistance or repair the filesystem.
For repairs, see About The DR Series Maintenance Mode.
Decompression of datastore failed <variable>.
Contact Dell Support for assistance or intervention.
Failed to clean active datastore <variable>.
Contact Dell Support for assistance or intervention.
Negative reference on datastore <variable>. Record
type: <variable>. Count: <variable>.
Contact Dell Support for assistance or repair the filesystem.
For repairs, see About the DR Series Maintenance Mode.
Datastore <variable> contains negative stream
reference count. Record type: <variable>. Count:
<variable>.
Informational message. No user intervention is required.
Datastore <variable> total reference count reached
threshold. Record type: <variable>. Count: <variable>.
Informational message. No user intervention is required.
Entering Maintenance mode due to failure in
processing logs.
Contact Dell Support for assistance or intervention.
Failed to acquire optimizer pipeline. Error: <variable>.
Contact Dell Support for intervention or assistance.
Failed to create optimizer event. Type: <variable>,
Error: <variable>.
Contact Dell Support for intervention or assistance.
Task execution in fiber <variable> timed out after
<variable> milliseconds (ms). Restarting file server.
Filesystem restarted. Collect diagnostics log file bundle, and
upload diagnostics log file bundle to Dell Support.
Memory allocation failure.
Collect diagnostics log file bundle.
Background compression started.
Informational message. No user intervention is required.
Background compression completed.
Informational message. No user intervention is required.
Optimization initialized on container <variable>.
Informational message. No user intervention is required.
Optimization terminated on container <variable>.
Informational message. No user intervention is required.
Cleaner process started as per schedule, will be active Informational message. No user intervention is required.
until <variable>.
Cleaner process stopped as per schedule, will restart
at <variable>.
Informational message. No user intervention is required.
Cleaner aborted at <variable>.
The DR Series system should enter Maintenance mode, and
Cleaner process will restart.
163
System Event Message
Description/Meaning or Action
Moving data from NVRAM to disk failed. System is
entering its Maintenance mode.
Informational message. No user intervention is required.
Last event/invalid event.
Informational message. Contact Dell Support for assistance or
intervention.
Filesystem Cleaner process started as per schedule
(will be active until <variable>).
Informational message. No user intervention is required.
Filesystem Cleaner process stopped as per schedule
(will restart at <variable>).
Informational message. No user intervention is required.
System Event = Type 5
System shutdown initiated by administrator.
Informational message. No user intervention is required.
System reboot initiated by administrator.
Informational message. No user intervention is required.
Start system upgrade to version <variable>.
Informational message. No user intervention is required.
System name changed to <variable>.
Informational message. No user intervention is required.
System date changed to <variable>.
Informational message. No user intervention is required.
System time zone changed to <variable>.
Informational message. No user intervention is required.
Password changed for user: administrator.
Informational message. No user intervention is required.
NTP server <variable> added.
Informational message. No user intervention is required.
NTP server <variable> deleted.
Informational message. No user intervention is required.
NTP service enabled.
Informational message. No user intervention is required.
NTP service disabled.
Informational message. No user intervention is required.
User data destroyed using CLI command.
Informational message. No user intervention is required.
User <variable> enabled.
Informational message. No user intervention is required.
User <variable> disabled.
Informational message. No user intervention is required.
Networking interfaces restarted.
Informational message. No user intervention is required.
DHCP enabled: IP address assigned by DHCP.
Informational message. No user intervention is required.
Static IP address <variable> assigned.
Informational message. No user intervention is required.
Network interface bonding mode set to <variable>.
Informational message. No user intervention is required.
Network MTU size set to <variable>.
Informational message. No user intervention is required.
System name set to <variable>.
Informational message. No user intervention is required.
Email relay host set to <variable> for email alerts.
Informational message. No user intervention is required.
Recipients for email alerts set to <variable>.
Informational message. No user intervention is required.
Recipient <variable> added to receive email alerts.
Informational message. No user intervention is required.
Recipient <variable> is no longer receiving email
alerts.
Check whether email recipient still exists, or if mailbox is full.
164
System Event Message
Description/Meaning or Action
Administrator information set to <variable> for email
alerts.
Informational message. No user intervention is required.
Test email sent.
Informational message. No user intervention is required.
Joined the Windows Active Directory domain
<variable>.
Informational message. No user intervention is required.
Left the Windows Active Directory domain <variable>.
Informational message. No user intervention is required.
System diagnostics package <variable> deleted.
Informational message. No user intervention is required.
All diagnostic packages deleted.
Informational message. No user intervention is required.
System diagnostic package <variable> is copied off
the system.
Informational message. No user intervention is required.
System statistics reset by administrator.
Informational message. No user intervention is required.
System diagnostic package <variable> is collected.
Informational message. No user intervention is required.
System diagnostics space usage exceeded threshold.
Auto cleaning oldest package: <variable>.
Informational message. No user intervention is required.
CIFS server cannot access file service.
Contact Dell Support for intervention or assistance. Collect
diagnostics log file bundle, and upload to Dell Support.
Host <variable> added to SNMP alert recipient list.
Informational message. No user intervention is required.
Host <variable> deleted from SNMP alert recipient list. Informational message. No user intervention is required.
Host <variable> enabled for SNMP alerts.
Informational message. No user intervention is required.
Host <variable> disabled for SNMP alerts.
Informational message. No user intervention is required.
User <variable> logged into the system.
Informational message. No user intervention is required.
CIFS user <variable> added.
Informational message. No user intervention is required.
CIFS user <variable> deleted.
Informational message. No user intervention is required.
Password changed for CIFS user <variable>.
Informational message. No user intervention is required.
System upgrade completed <variable>.
Informational message. No user intervention is required.
Cleared foreign configuration on disk <variable>.
Informational message. No user intervention is required.
User <variable> logged into the system.
Informational message. No user intervention is required.
Disk <variable> configured as hot spare.
Informational message. No user intervention is required.
Cleared foreign configuration on disk <variable>.
Informational message. No user intervention is required.
Telnet service enabled.
Informational message. No user intervention is required.
Telnet service disabled.
Informational message. No user intervention is required.
DNS settings updated with primary <variable>,
secondary <variable>, and suffix <variable>.
Informational message. No user intervention is required.
System initialized successfully.
Informational message. No user intervention is required.
Security privilege(s) changed for <variable>.
Informational message. No user intervention is required.
165
System Event Message
Description/Meaning or Action
Miscellaneous Invalid/Last Event.
Informational message. No user intervention is required.
System Event = Type 6
File system check restarted.
Informational message. No user intervention is required.
File system check completed successfully. No
inconsistencies were found.
Informational message. No user intervention is required.
File system check found some inconsistencies.
The DR Series system Maintenance mode repair process
should resolve this. If the problem persists, contact Dell
Support for assistance or intervention.
File system repair started.
Informational message. No user intervention is required.
File system repair completed.
Informational message. No user intervention is required.
File system check stop requested.
Informational message. No user intervention is required.
One (or more) file(s) were deleted as part of the repair
process.
Informational message. No user intervention is required. To
verify, please use the DR Series system CLI maintenance -filesystem --repair_history verbose command.
One or more file(s) were deleted as part of the repair
process for container <variable>. Replication will be
stopped for this container.
Informational message. No user intervention is required.
One or more file(s) were deleted as part of the repair
process for container <variable>. Resync has been
initiated for this container.
Informational message. No user intervention is required.
System Event = Type 7
OST server started successfully.
Informational message. No user intervention is required.
OST server failed to start.
Restart the OST server. If issue persists, contact Dell Support
for assistance or intervention.
OST server stopped successfully.
Informational message. No user intervention is required.
OST client authentication failed.
Retry the OST client authentication. If issue persists, contact
Dell Support for assistance or intervention.
OST Logical Storage Unit (LSU) quota exceeded
<variable>.
Informational message. Reduce the number of LSUs. If issue
persists, contact Dell Support for assistance or intervention.
OST backup failed <variable>.
Retry the OST backup operation. If issue persists, contact Dell
Support for assistance or intervention.
OST Opdup failed <variable>.
The OST optimized duplication process failed. If issue
persists, contact Dell Support for assistance or intervention.
OST Restore failed <variable>.
The OST restore process failed. If issue persists, contact Dell
Support for assistance or intervention.
OST connections exceeded the maximum limit; count:
<variable>, maximum limit: <variable>.
Informational message. Reduce the number of OST
connections. If issue persists, contact Dell Support for
assistance or intervention.
166
System Event Message
Description/Meaning or Action
Connection from the OST client <variable> aborted.
Informational message. No user intervention is required.
OST client protocol version is not supported.
Informational message. No user intervention is required.
Check for the supported OST client versions in the Dell DR
Series System Interoperability Guide.
System is entering the Maintenance mode: OST LSU
information file is corrupted.
Informational message. No user intervention is required. If
issue persists, contact Dell Support for assistance or
intervention.
System is entering the Maintenance mode: OST LSU
image information is corrupted.
Informational message. No user intervention is required. If
issue persists, contact Dell Support for assistance or
intervention
OST client connection was reset.
Informational message. No user intervention is required.
System is entering the Maintenance mode: OST meta
directory is corrupted.
Informational message. No user intervention is required.
OST server initialization failed.
Informational message. No user intervention is required.
OST server initialization was successful.
Informational message. No user intervention is required.
About the Diagnostics Service
The Diagnostics service in the DR Series system lets you display, collect, and manage your system’s diagnostic log file
bundles. Each diagnostic log file bundle provides:
•
A current snapshot of system operations
•
System-related information that assists in understanding system operations
•
A record of system operations in case Dell Support needs to provide technical assistance
To access this functionality, use the following DR Series system navigation panel GUI option:
•
Support → Diagnostics
The Diagnostics service works by collecting all the system-related information that could help when diagnosing a
problem or error condition in the system.
For more information about diagnostics log file bundles, see Diagnostics Page and Options.
Diagnostics runs as a service during system startup, and this process listens for incoming requests. There are two
modes in which the diagnostics collection process is started:
•
Admin-Generated mode: when a DR Series system CLI or DR Series system GUI request is made by the
administrator (and the default reason that is listed is admin-generated).
•
Auto-Generated mode: when a process or service failure is reported, the DR Series system starts collecting
system-related information. After it completes the auto-generated collection, it generates a system event.
When the diagnostics log directory exceeds the maximum storage capacity, any log older than one hour is automatically
deleted. The DR Series system GUI lets you download and save diagnostics log files to other systems on your network.
The DR Series system also maintains a separate archive logs directory that collects other system-related information,
and these archive logs are also automatically deleted when they exceed a maximum capacity.
For more information, see Diagnostics Page and Options, Generating a Diagnostics Log File, Downloading Diagnostics
Log Files. and Deleting a Diagnostics Log File.
167
NOTE: When you generate a diagnostics log file bundle, it contains all of the DR Series system information that you
need when contacting Dell Support for technical assistance. When a diagnostics log file bundle is generated, this
process also collects all the previous auto-generated diagnostics and deletes them from the system.
The diagnostics log file bundle collects the same type of hardware, storage, and operating system information that is
collected when using the Dell System E-Support Tool (DSET) and the DR Series system CLI commands (diagnostics -collect --dset). For more information about DR Series system command line interface commands, see the Dell DR Series
Command Line Reference Guide.
The DSET-based information that gets collected for the system helps Dell Support to troubleshoot or evaluate the status
of your DR Series system.
Understanding Diagnostics Collection
The Diagnostics service collection tool process observes the following guidelines:
•
DR Series system triggers an automatic diagnostic log collection of the DR Series system status for any system
process or service failures.
•
All automatic diagnostic collection requests are queued and executed sequentially.
•
The DR Series system GUI provides options to display existing diagnostics logs, generate new diagnostics logs,
download and save copies of existing diagnostics logs, or delete existing diagnostics logs. For more information,
see Diagnostics Page and Options and About the Diagnostics Service.
•
The DR Series system CLI also provides the means for managing, generating, or downloading the diagnostics log
files. For more information, see the Dell DR Series System Command Line Reference Guide.
About the DR Series System Maintenance Mode
In general, the DR Series system enters the Maintenance mode whenever the filesystem has encountered an issue that
prevents it from operating normally.
When in its Maintenance mode, the filesystem is in a read-only state, and the system runs the following maintenancebased operations:
NOTE: Whenever the DR Series systems enters or exits from the Maintenance mode state, all communication via
CIFS, NFS, or OST is lost.
•
Runs an internal filesystem check.
•
Generates a filesystem status report (if the filesystem check finds no issues, the DR Series system switches
back to Operational mode without user intervention).
If the filesystem check finds issues, you can choose to make repairs (using Confirm Repair Filesystem) or ignore the
detected issue (using Skip Repair Filesystem), at which point the system switches back to Operational mode.
The Maintenance mode process displays a number of stages, indicated on the Maintenance Mode progress bar, which
include:
•
Preparing for Filesystem Check
•
Scan in Progress
•
Completed Generating Report
NOTE: If the Filesystem Check detects any repairable files, it generates a Repair Report that identifies
these reported files. The Maintenance Mode progress bar halts at the Completed Generating Repair stage,
and remains in Maintenance mode until you click Confirm Repair Filesystem. The DR Series system does
not advance to the Switching to Operation Mode stage until the filesystem repair is completed.
•
168
Switching to Operational Mode
•
Operational Mode (Normal State)
The Maintenance Mode page provides the following information:
•
Maintenance Mode Progress bar:
–
Displays the five stages of Maintenance mode
–
Updates the progress bar as each stage completes
NOTE: If an alert displays above the Maintenance Mode progress bar, this indicates that the
filesystem check has completed, and it has generated a report on the repairable files (which are
displayed in the Repair Report pane under the Maintenance Mode progress bar). To repair all of
the reported files listed in the Repair Report, you must click Confirm Repair Filesystem.
•
•
•
Repair Report:
–
Displays a list of repairable filesystem files that were detected in the Filesystem Check.
–
Identifies the repairable files by Container ID, File/Inode/Directory location, and a brief reason for
failure.
–
Provides a search capability that allows you to click prev or next to display the previous or next page in
the Repair Report, or lets you display a specific page number of the Repair Report by entering this
number in the Goto page and click go.
System Information pane:
–
System Name
–
Software Version
–
Current Date/Time
–
iDRAC IP Address
Support Information
–
Service Tag
–
Last Diagnostic Run
–
BIOS Version
NOTE: When in Maintenance mode, the DR Series system navigation panel displays the following options that are
links to display the correspond page in the DR Series system GUI:
•
Alerts
•
Events
•
Health
•
Usage
•
Diagnostics
•
Software Upgrade
Once the DR Series system enters Maintenance mode, there can only be two possible outcome states:
•
Operational mode (Normal State): where the filesystem check was successful, and no system files need to be
repaired (Filesystem Check: successful).
•
Maintenance mode has halted: where the filesystem check detected one or more repairable files (Filesystem
Check: unsuccessful).
Filesystem Check — Successful: when the Maintenance mode successfully completes all of its stages, the DR Series
system displays its status as having entered Operational mode (Normal State). Only after the Maintenance mode has
successfully completed its internal check can it return to an Operational mode.
169
To return to the Operational mode, click Go to Dashboard on the Maintenance Mode page options bar. Go to Dashboard
is only active when all of the internal system checks have completed and the progress bar indicates that all stages have
been completed.
NOTE: You may encounter issues when using data management agents (DMAs) such as NetBackup with expired
backup images when the DR Series system is in its Maintenance mode.
NOTE: When in Maintenance mode, image expiration fails because the DR Series system is in a read-only state. If
this occurs, the DMA assumes that the backup images have expired. However, the DR Series system administrator
may be unaware that the backup data images still reside on the DR Series system.
Filesystem Check — Unsuccessful: when the Maintenance mode halts at the Completed Generating Report stage, this
indicates that the filesystem check detected some repairable files, and listed them in the Repair Report pane on the
Maintenance Mode page.
To return to the Operational mode, click Confirm Repair Filesystem on the Maintenance Mode page options bar to repair
the files listed in the Repair Report. Confirm Repair Filesystem is the only active option you can select when the progress
bar indicates that some filesystem files are in need of repair.
About the DR Series System Support Mode
Generally, the DR Series system enters its Support mode only because of one of the following reasons:
•
The filesystem has encountered an issue that could not be resolved by running the internal Maintenance mode.
•
Some system processes failed to start properly.
•
The system detected an unsupported configuration.
The Support mode puts the DR Series system into a state in which only the following tasks can be performed:
•
Generating a DR Series system diagnostics file. For more information, see Generating a Diagnostics Log File.
•
Upgrading the DR Series system software. For more information, see Upgrading the DR Series System Software.
•
Installing a license for the data storage expansion shelf enclosure. For more information, see Expansion Shelf
Licenses and Installing an Expansion Shelf.
•
Contacting Dell Support for technical assistance. For more information, see Contacting Dell.
NOTE: Dell recommends that you generate a DR Series system diagnostics file whenever the DR Series system is
in its Maintenance or Support modes if one was not automatically generated.
When in the Support mode, the DR Series system displays the following alert message:
The server is currently in Support mode. To continue, you must contact Dell
Support at http://www.support.dell.com or contact your Dell support
representative.
The
Scheduling DR Series System Operations
The most important thing to remember when scheduling critical DR Series system operations is that you want to ensure
that you perform each of these operations at a time when it will not overlap or interfere with the running of any of the
other key system operations.
By better scheduling when you run system operations, you can optimize your system resources and make it possible to
achieve the best possible DR Series system performance. To do this, plan and schedule time periods in which to perform
the following critical system operations:
•
170
Data ingests (which are dependent upon the DMAs)
•
Replication process
•
Cleaner process (space reclamation)
The main goal in planning and scheduling operations is running the Cleaner and Replication operations at times when
they do not overlap or interfere with other important system operations. You want to make sure that by properly
scheduling and planning, your system can perform each of these key operations independent of the other.
The best practice is to run these two operations during non-standard business hours, so that they do not conflict with
any of your other backup or ingest operations. In short, efficient scheduling maximizes the best use of your system
resources.
Dell recommends scheduling resource-intensive operations during specific time periods when no other system
operations are being performed. This approach is called windowing, which requires scheduling a specific block of time
(or “window”), each with a set starting and stopping point so that you can perform data ingests, replication, or space
reclamation operations without interfering with the running of any other operation.
Creating a Cleaner Schedule
Performing scheduled disk space reclamation operations are recommended as a method for recovering disk space from
system containers in which files were deleted as a result of deduplication. The best method is to schedule a time when
you can run the Cleaner on your DR Series system with no other planned processes running. Alternately, another
method lets the Cleaner process on the DR Series system run whenever it determines that there are no active data
ingests.
NOTE: Even if no Cleaner schedule is set, but the system detects that there is disk space that can be reclaimed, the
Cleaner process runs. However, the Cleaner will not start until the following conditions are met: it detects that
there are no active data ingests, that two minutes of system idle time have elapsed since the last data file ingest
was completed, and that the Replication process is not running (the Cleaner process runs as a lower system
priority operation than the Replication process).
NOTE: The Cleaner Schedule page displays the current DR Series system time zone and current timestamp (using
this format: US/Pacific, Fri Nov 2 15:15:10 2012).
To schedule Cleaner operations on your system, complete the following:
1.
Select Schedules → Cleaner Schedule.
The Cleaner Schedule page is displayed.
2.
Click Schedule to create a new schedule (or click Edit Schedule to modify an existing schedule).
The Set Cleaner Schedule page is displayed.
3.
Select (or modify) the Start Time and Stop Time setpoint values using the Hour and Minutes pull-down lists to
create a Cleaner schedule.
NOTE: You must set a corresponding Stop Time for every Start Time set in each Cleaner schedule you create.
The DR Series system will not support any Cleaner schedule that does not contain a Start Time/Stop Time pair
of setpoints (daily or weekly).
4.
Click Set Schedule for the system to accept your Cleaner schedule (or click Cancel to display the Cleaner Schedule
page).
NOTE: To reset all of the values in the current Cleaner schedule, click Reset in the Set Cleaner Schedule
dialog. To selectively modify values in the current schedule, make your changes to the corresponding hours
and minutes pull-down lists to represent the Start Time and Stop Time you wish to set, and click Set Schedule.
The current Cleaner Status is represented in the Dashboard page in the System Information pane as one of the three
following states:
171
•
Pending—displayed when there is any scheduled window set and the current time is outside the scheduled
window for the Cleaner operation.
•
Running—displayed when the Cleaner operation is running during a scheduled window.
•
Idle—displayed only if there is no Cleaner operation running during a scheduled window.
Dell recommends that you do not schedule the running of any Cleaner operations during the same time period when
replication or ingest operations will be running. Failure to follow this practice will affect the time required to complete
the system operations and/or impact your DR Series system performance.
Displaying Cleaner Statistics
To display additional Cleaner statistics, you can use the DR Series system CLI stats --cleaner command to show the
following categories of Cleaner statistics:
•
Last Run Files Processed (number of files processed by Cleaner)
•
Last Run Bytes Processed (number of bytes processed by Cleaner)
•
Last Run Bytes Reclaimed (number of bytes reclaimed by the Cleaner)
•
Last Run Start Time (indicates date and time last Cleaner process started)
•
Last Run End Time (indicates date and time last Cleaner process ended)
•
Last Run Time To Completion(s) (indicates the number of times that Cleaner process has successfully
completed)
•
Current Run Start Time (indicates date and time current Cleaner process started)
•
Current Run Files Processed (number of files processed by current Cleaner process)
•
Current Run Bytes Processed (number of bytes processed by current Cleaner process)
•
Current Run Bytes Reclaimed (number of bytes reclaimed by the current Cleaner processed)
•
Current Run Phase 1 Start Time (indicates date and time for start of current Cleaner process phase 1)
•
Current Run Phase 1 Records Processed (lists the number of data records processed in current Cleaner process
phase 1)
•
Current Run Phase 1 End Time (indicates date and time for end of current Cleaner process phase 1)
•
Current Run Phase 2 Start Time (indicates date and time for start of current Cleaner process phase 2)
•
Current Run Phase 2 Records Processed (lists the number of data records processed in current Cleaner process
phase 2)
•
Current Run Phase 2 End Time (indicates date and time for end of current Cleaner process phase 2)
•
Current Run Phase 3 Start Time (indicates date and time for start of current Cleaner process phase 3)
•
Current Run Phase 3 Records Processed (lists the number of data records processed in current Cleaner process
phase 3)
•
Current Run Phase 3 End Time (indicates date and time for end of current Cleaner process phase 3)
•
Current Run Phase 4 Start Time (indicates date and time for start of current Cleaner process phase 4)
•
Current Run Phase 4 Records Processed (lists the number of data records processed in current Cleaner process
phase 4)
•
Current Run Phase 4 End Time (indicates date and time for end of current Cleaner process phase 4)
For more information about DR Series system CLI commands, see the Dell DR Series System Command Line Reference
Guide.
172
Getting Help
10
For more information about what you can attempt to resolve yourself or to get technical assistance from Dell for the DR
Series system, see Troubleshooting and Maintenance, Troubleshooting Error Conditions,Before Contacting Dell Support,
and Contacting Dell.
Before Contacting Dell Support
If you encounter an error condition or operational issue, Dell recommends that you first attempt to see if you can resolve
it using the supporting Dell DR Series system documentation before you make an attempt to contact Dell Support for
technical assistance.
To help isolate or diagnose any basic issues that you may encounter with the Dell DR Series system, Dell recommends
that you perform the following tasks:
•
Refer to the Dell DR Series System Administrator Guide to verify if it contains information that can explain or
resolve your issue. See Chapter 9, “Troubleshooting and Maintenance”.
•
Refer to the Dell DR Series System Command Line Reference Guide to verify if it contains information that can
explain or resolve your issue.
•
Read the latest set of Dell DR Series System Release Notes to verify if they contain any information that can
explain or resolve your issue.
•
Locate your Dell support account number and password, locate the Service Tag for your DR Series system,
understand your type of support account, and be ready to provide specific details about the system operations
you were performing.
•
Record the content of any status or error dialog messages that you received, and the sequence in which they
were displayed.
•
Generate a current version diagnostics file (or if this is not possible, locate your latest existing diagnostics file).
–
Using the DR Series system GUI, click Diagnostics → Generate to generate a diagnostics file.
–
Using the DR Series system CLI, at the system prompt, enter the command diagnostics --collect to
generate a diagnostics file. For more information, see the Dell DR Series System Command Line
Reference Guide.
NOTE: For best results in addressing replication issues, you should generate diagnostics files on both DR Series
source and target systems as close in time as possible.
NOTE: Each generated diagnostics file bundle contains information to assist Dell Support with the most current
data about:
•
System alerts and events
•
System configuration status
•
System log files
•
System statistics for storage and replication containers
•
System hardware component status
173
Contacting Dell
The topic explains the process for customers who need to contact Dell Support for technical assistance. For customers
in the United States, please call 800-WWW-DELL (800-999-3355).
NOTE: If you do not have an active Internet connection, you can still find the proper contact information that you
need on your purchase invoice, packing slip, bill, or Dell product catalog.
Dell provides several online and telephone-based support and service options. Availability varies by country and
product, and some services may not be available in your area.
To contact Dell for sales support, technical support, or customer service issues:
1.
Visit support.dell.com.
2.
Click to select your country/region at the bottom of the support.dell.com page. For the full listing of countries and
regions, click All.
The Choose a Country/Region page is displayed.
3.
Click the country/region from the Americas, Europe, Middle East, & Africa, or Asia Pacific choices.
4.
Select the appropriate service or support link based on your need.
5.
Select the method of contacting Dell that is most convenient for you.
174
Supported Ports in a DR Series System
11
Table 1 lists the application and service ports found on a normally operating DR Series system. There may be other ports
that are not listed here, that an administrator may need to open and enable to support specific operations across the
network. Be aware that the ports listed in Table 1 may not reflect your specific network environment, or any planned
deployment. While some of these DR Series system ports may not need to be accessible through the firewall, this
information is made available when deploying the DR Series system in your own network because it indicates supported
ports that may need to be exposed.
Table 8. Supported DR Series System Ports
Port Type
Number
Port Usage or Description
TCP
20
File Transfer Protocol (FTP)—for transferring files.
TCP
23
Telnet—remote terminal access protocol for unencrypted text
communications.
TCP
80
Hypertext Transfer Protocol (HTTP)—unencrypted protocol communications.
TCP
443
HTTPS—combination of the HTTP with Secure Socket Layer (SSL)/Transport
Layer Security (TLS).
TCP
1311
Hardware Health Monitor
TCP
9901
Watcher
TCP
9904
Configuration Server (needed for replication operations)
TCP
9911
Filesystem Server (needed for replication operations)
TCP
9915
MetaData Replication (needed for replication operations)
TCP
9916
Data Filesystem Server (needed for replication operations)
TCP
9918
Diagnostics Collector
TCP
9920
Data path used for OST replications
TCP
10011
Control channel (needed for OST operations)
TCP
11000
Data channel (needed for OST operations)
TCP
22
Secure Shell (SSH)—used for secure logins, file transfers like SCP (Secure
Copy) and SFTP (Secure File Transfer Protocol)
TCP
25
Simple Mail Transfer Protocol (SMTP)—used for routing and sending email
TCP
139
SMB daemon—used for SMB protocol-related processes
DR Series System
Application Ports
DR Series System
Service Ports
175
Port Type
Number
Port Usage or Description
TCP
199
SNMP daemon—used by Simple Network Management Protocol (SNMP)
requests
TCP
801
NFS status daemon
176