1
About this Manual
We’ve added this manual to the Agilent website in an effort to help you support
your product. This manual is the best copy we could find; it may be incomplete
or contain dated information. If we find a more recent copy in the future, we will
add it to the Agilent website.
Support for Your Product
Agilent no longer sells or supports this product. Our service centers may be able
to perform calibration if no repair parts are needed, but no other support from
Agilent is available. You will find any other available product information on the
Agilent Test & Measurement website, www.tm.agilent.com.
HP References in this Manual
This manual may contain references to HP or Hewlett-Packard. Please note that
Hewlett-Packard's former test and measurement, semiconductor products and
chemical analysis businesses are now part of Agilent Technologies. We have
made no changes to this manual copy. In other documentation, to reduce
potential confusion, the only change to product numbers and names has been in
the company name prefix: where a product number/name was HP XXXX the
current name/number is now Agilent XXXX. For example, model number
HP8648A is now model number Agilent 8648A.
User's Guide
HP 11990A Option 001 for the
HP 70900 System Performance Tests
ABCDE
HP Part No. 11990-90051
Printed in USA
December 1992
Edition B.0.0
Notice
The information contained in this document is subject to change without notice.
Hewlett-Packard makes no warranty of any kind with regard to this material, including,
but not limited to, the implied warranties of merchantability and tness for a particular
purpose. Hewlett-Packard shall not be liable for errors contained herein or for incidental or
consequential damages in connection with the furnishing, performance, or use of this material.
Restricted Rights Legend.
Use, duplication, or disclosure by the U.S. Government is subject to restrictions as set forth
in subparagraph (c) (1) (ii) of the Rights in Technical Data and Computer Software clause
at DFARS 252.227-7013 for DOD agencies, and subparagraphs (c) (1) and (c) (2) of the
Commercial Computer Software Restricted Rights clause at FAR 52.227-19 for other agencies.
c Copyright Hewlett-Packard Company 1987, 1989, 1992
All Rights Reserved. Reproduction, adaptation, or translation without prior written
permission is prohibited, except as allowed under the copyright laws.
1212 Valley House Drive, Rohnert Park, CA 94928-4999, USA
Hewlett-Packard Software Product License Agreement and Limited
Warranty
Important
Please carefully read this License Agreement before opening the media
envelope or operating the equipment. Rights in the software are oered only
on the condition that the Customer agrees to all terms and conditions of the
License Agreement. Opening the media envelope or operating the equipment
indicates your acceptance of these terms and conditions. If you do not agree
to the License Agreement, you may return the unopened package for a full
refund.
License Agreement
In return for payment of the applicable fee, Hewlett-Packard grants the Customer a license in
the software, until terminated, subject to the following:
Use
Customer may use the software on one spectrum-analyzer instrument.
Customer may not reverse assemble or decompile the software.
Copies and Adaptations
Customer may make copies or adaptations of the software:
For archival purposes, or
When copying or adaptation is an essential step in the use of the software with a
computer so long as the copies and adaptations are used in no other manner.
Customer has no other rights to copy unless they acquire an appropriate license to
reproduce which is available from Hewlett-Packard for some software.
Customer agrees that no warranty, free installation, or free training is provided by
Hewlett-Packard for any copies or adaptations made by Customer.
All copies and adaptations of the software must bear the copyright notices(s) contained in
or on the original.
Ownership
Customer agrees that they do not have any title or ownership of the software, other than
ownership of the physical media.
Customer acknowledges and agrees that the software is copyrighted and protected under the
copyright laws.
Customer acknowledges and agrees that the software may have been developed by a third
party software supplier named in the copyright notice(s) included with the software, who
shall be authorized to hold the Customer responsible for any copyright infringement or
violation of this License Agreement.
iii
Transfer of Rights in Software
Customer may transfer rights in the software to a third party only as part of the transfer of
all their rights and only if Customer obtains the prior agreement of the third party to be
bound by the terms of this License Agreement.
Upon such a transfer, Customer agrees that their rights in the software are terminated and
that they will either destroy their copies and adaptations or deliver them to the third party.
Transfer to a U.S. government department or agency or to a prime or lower tier contractor
in connection with a U.S. government contract shall be made only upon their prior written
agreement to terms required by Hewlett-Packard.
Sublicensing and Distribution
Customer may not sublicense the software or distribute copies or adaptations of the software
to the public in physical media or by telecommunication without the prior written consent
of Hewlett-Packard.
Termination
Hewlett-Packard may terminate this software license for failure to comply with any of these
terms provided Hewlett-Packard has requested Customer to cure the failure and Customer
has failed to do so within thirty (30) days of such notice.
Updates and Upgrades
Customer agrees that the software does not include future updates and upgrades which may
be available for HP under a separate support agreement.
Export
Customer agrees not to export or re-export the software or any copy or adaptation in
violation of the U.S. Export Administration regulations or other applicable regulations.
iv
Limited Warranty
Software
Hewlett-Packard warrants for a period of 90 days from the date of purchase that the
software product will execute its programming instructions when properly installed on the
spectrum-analyzer instrument indicated on this package. Hewlett-Packard does not warrant
that the operation of the software will be uninterrupted or error free. In the event that this
software product fails to execute its programming instructions during the warranty period,
customer's remedy shall be to return the measurement card (\media") to Hewlett-Packard
for replacement. Should Hewlett-Packard be unable to replace the media within a reasonable
amount of time, Customer's alternate remedy shall be a refund of the purchase price upon
return of the product and all copies.
Media
Hewlett-Packard warrants the media upon which this product is recorded to be free from
defects in materials and workmanship under normal use for a period of 90 days from the
date of purchase. In the event any media prove to be defective during the warranty period,
Customer's remedy shall be to return the media to Hewlett-Packard for replacement. Should
Hewlett-Packard be unable to replace the media within a reasonable amount of time,
Customer's alternate remedy shall be a refund of the purchase price upon return of the
product and all copies.
Notice of Warranty Claims
Customer must notify Hewlett-Packard in writing of any warranty claim not later than thirty
(30) days after the expiration of the warranty period.
Limitation of Warranty
Hewlett-Packard makes no other express warranty, whether written or oral, with respect
to this product. Any implied warranty of merchantability or tness is limited to the 90 day
duration of this written warranty.
This warranty gives specic legal rights, and Customer may also have other rights which vary
from state to state, or province to province.
Exclusive Remedies
The remedies provided above are Customer's sole and exclusive remedies. In no event shall
Hewlett-Packard be liable for any direct, indirect, special, incidental, or consequential damages
(including lost prot) whether based on warranty, contract, tort, or any other legal theory.
Warranty Service
Warranty service may be obtained from the nearest Hewlett-Packard sales oce or other
location indicated in the owner's manual or service booklet.
v
Safety Notes
The following safety notes are used throughout this manual. Familiarize yourself with each of
the notes and its meaning before operating this instrument.
denotes a hazard. It calls attention to a procedure that, if not
correctly performed or adhered to, could result in damage to or destruction
of the instrument. Do not proceed beyond a caution sign until the indicated
conditions are fully understood and met.
Caution
Caution
Warning
Warning
denotes a hazard. It calls attention to a procedure which, if not
correctly performed or adhered to, could result in injury or loss of life. Do
not proceed beyond a
warning
note until the indicated conditions are fully
understood and met.
L
Instruction
Manual
vi
The instruction manual symbol. The product is marked with this symbol when it is
necessary for the user to refer to the instructions in the manual.
General Safety Considerations
Warning
Before this instrument is switched on , make sure it has been properly grounded
through the protective conductor of the ac power cable to a socket outlet
provided with protective earth contact.
Any interruption of the protective (grounding) conductor, inside or outside
the instrument, or disconnection of the protective earth terminal can result in
personal injury.
Warning
There are many points in the instrument which can, if contacted, cause personal
injury. Be extremely careful.
Any adjustments or service procedures that require operation of the instrument
with protective covers removed should be performed only by trained service
personnel.
Caution
its primary power circuitry
has been adapted to the voltage of the ac power source.
Failure to set the ac power input to the correct voltage could cause damage to
the instrument when the ac power cable is plugged in.
Before this instrument is switched on, make sure
vii
How to Use This Guide
This guide uses the following conventions:
4Front-Panel
Key5
NNNNNNNNNNNNNNNNNNNNNNN
Softkey
Screen Text
viii
This represents a key physically located on the instrument.
This indicates a \softkey," a key whose label is determined by the
instrument's rmware.
This indicates text displayed on the instrument's screen.
HP 70000 Modular Measurement System Documentation Outline
Instruments and modules of the HP 70000 Modular Measurement System are documented
to varying levels of detail. Modules that serve as masters of an instrument require operation
information in addition to installation and verication instructions. Modules that function as
slaves in a system require only a subset of installation and verication information.
Manuals Supplied with Module
Installation and Verication Manual
Topics covered by this manual include installation, specications, verication of module
operation, and some troubleshooting techniques. Manuals for modules that serve as
instrument masters will supply information in all these areas; manuals for slave modules will
contain only information needed for slave module installation and verication. Master module
documentation may also include some system-level information.
Operation Manual
Operation Manuals usually pertain to multiple- and single-module instrument systems. Topics
include preparation for module use, module functions, and softkey denitions.
Programming Manual
Programming Manuals also pertain to multiple- and single-module instrument systems.
Programming Manual topics include programming fundamentals and denitions for remote
programming commands.
Service Manual, Available Separately
When available, this manual provides service information for a module, including module
verication tests, adjustments, troubleshooting, replaceable parts lists, and replacement
procedures. For ordering information, contact an HP Sales and Service Oce. (NOTE: Some
versions of this manual are titled Technical Reference .)
ix
Contents
1. General Information
Introduction . . . . . . . . . . . . . . . .
Shipment Contents . . . . . . . . . . . . .
Software Version . . . . . . . . . . . . . .
Software/Hardware Compatibility . . . . . . .
Computer Hardware Compatibility . . . . .
Computer Language Compatibility . . . . .
Printer Compatibility . . . . . . . . . . .
Typographic Conventions . . . . . . . . . .
Required Test Equipment . . . . . . . . . .
Standard Test Equipment . . . . . . . . .
Specialized Test Equipment . . . . . . . .
System Performance Test Software Overview . .
Testing Multiple Systems . . . . . . . . .
Types of Error Messages or Warnings Dened
Limited Cal Dened . . . . . . . . . . . .
Single Tests Dened . . . . . . . . . . . .
Test Results . . . . . . . . . . . . . . .
Printing Test Results . . . . . . . . . . .
.
.
.
.
.
.
.
.
.
.
.
.
.
.
.
.
.
.
.
.
.
.
.
.
.
.
.
.
.
.
.
.
.
.
.
.
.
.
.
.
.
.
.
.
.
.
.
.
.
.
.
.
.
.
.
.
.
.
.
.
.
.
.
.
.
.
.
.
.
.
.
.
.
.
.
.
.
.
.
.
.
.
.
.
.
.
.
.
.
.
.
.
.
.
.
.
.
.
.
.
.
.
.
.
.
.
.
.
.
.
.
.
.
.
.
.
.
.
.
.
.
.
.
.
.
.
.
.
.
.
.
.
.
.
.
.
.
.
.
.
.
.
.
.
.
.
.
.
.
.
.
.
.
.
.
.
.
.
.
.
.
.
.
.
.
.
.
.
.
.
.
.
.
.
.
.
.
.
.
.
.
.
.
.
.
.
.
.
.
.
.
.
.
.
.
.
.
.
.
.
.
.
.
.
.
.
.
.
.
.
.
.
.
.
.
.
.
.
.
.
.
.
.
.
.
.
.
.
.
.
.
.
.
.
1-1
1-2
1-3
1-3
1-3
1-3
1-4
1-4
1-5
1-5
1-5
1-5
1-5
1-6
1-6
1-6
1-6
1-6
Conguring the Hardware . . . . . . . . . . . . . . . . . .
System Performance Test Software . . . . . . . . . . . . . .
Installing System Performance Test Software onto an HP 9133 .
Running the System Performance Test Software from an HP 9133
Running System Performance Test Software from an HP 9122 .
.
.
.
.
.
.
.
.
.
.
.
.
.
.
.
.
.
.
.
.
.
.
.
.
.
2-2
2-3
2-3
2-4
2-6
.
.
.
.
.
.
.
.
.
.
.
.
.
.
.
.
.
.
.
.
.
.
.
.
.
.
.
.
.
.
.
.
.
.
.
.
.
.
.
.
.
.
.
.
.
.
.
.
.
.
.
.
.
.
.
.
.
.
.
.
.
.
.
.
.
.
.
.
.
.
3-1
3-2
3-2
3-2
3-4
3-5
3-5
3-6
3-7
3-9
3-9
3-10
3-11
3-12
2. Start-Up Procedures
3. Menus
Menu Structure . . . . . . . . . . . . . .
Common Edit and Command Screen Softkeys
Edit Screen Softkeys . . . . . . . . . .
Command Screen Softkeys . . . . . . . .
Main Menu . . . . . . . . . . . . . . .
Mass Storage Menu . . . . . . . . . . . .
Mass Storage Menu Volume Labels . . . .
Editing Mass Storage Menu Information . .
Parameter Menu . . . . . . . . . . . . .
Equipment Menu . . . . . . . . . . . . .
Equipment Menu Edit Screen . . . . . . .
Equipment Menu Command Screen . . . .
Editing Calibration Data . . . . . . . .
HP-MSIB Address Menu . . . . . . . . . .
.
.
.
.
.
.
.
.
.
.
.
.
.
.
.
.
.
.
.
.
.
.
.
.
.
.
.
.
.
.
.
.
.
.
.
.
.
.
.
.
.
.
.
.
.
.
.
.
.
.
.
.
.
.
.
.
.
.
.
.
.
.
.
.
.
.
.
.
.
.
.
.
.
.
.
.
.
.
.
.
.
.
.
.
.
.
.
.
.
.
.
.
.
.
.
.
.
.
.
.
.
.
.
.
.
.
.
.
.
.
.
.
.
.
.
.
.
.
.
.
.
.
.
.
.
.
Contents-1
Test Menu . . . . . . . . . . . . . . . . . . . . . . . . . . . . . .
4. HP 11990A Option 033 System Add-On Package
Introduction . . . . . . . . . . . . . . . .
Option 033 Tests . . . . . . . . . . . . .
Test Descriptions . . . . . . . . . . . . .
Limited Cal Tests . . . . . . . . . . . . .
TG Absolute Amplitude Accuracy (HP 70300A)
TG Vernier Accuracy (HP 70300A) . . . . . .
TG Frequency Response (HP 70300A) . . . . .
TG Feedthru (HP 70300A) . . . . . . . . . .
TG Harmonics (HP 70300A) . . . . . . . . .
TG Frequency Accuracy (HP 70300A) . . . . .
TG Absolute Amplitude Accuracy (HP 70301A)
TG Vernier Accuracy (HP 70301A) . . . . . .
TG Frequency Response (HP 70301A) . . . . .
TG Feedthru (HP 70301A) . . . . . . . . . .
TG Harmonics (HP 70301A) . . . . . . . . .
TG Low Band Input Insertion Loss (HP 70301A)
TG Frequency Accuracy (HP 70301A) . . . . .
TG RF O Residuals (HP 70301A) . . . . . .
TG Spurious Outputs (HP 70301A) . . . . . .
5. HP 11990A Option 100 System Software Package
Introduction . . . . . . . . . .
Option 100 Tests . . . . . . .
Test Descriptions . . . . . . .
Limited Cal Tests . . . . . . .
Sweep Time Accuracy . . . . . .
Calibrator Frequency Accuracy . .
Second Harmonic Distortion . . .
Third Order IMD . . . . . . . .
Gain Compression . . . . . . .
Calibrator Amplitude Accuracy . .
Frequency Response (HP 70904A) .
Frequency Readout Accuracy . . .
Frequency Span Accuracy . . . .
Image Responses . . . . . . . .
Out of Range Responses . . . . .
Displayed Average Noise . . . . .
Residual Responses . . . . . . .
Input Coupling Switching . . . .
Noise Sidebands . . . . . . . .
Line and System Related Sidebands
Synthesis Related Sidebands . . .
Step Gain Accuracy . . . . . . .
Log Fidelity . . . . . . . . . .
Resolution Bandwidth Tests . . .
Linear Fidelity . . . . . . . . .
Contents-2
.
.
.
.
.
.
.
.
.
.
.
.
.
.
.
.
.
.
.
.
.
.
.
.
.
.
.
.
.
.
.
.
.
.
.
.
.
.
.
.
.
.
.
.
.
.
.
.
.
.
.
.
.
.
.
.
.
.
.
.
.
.
.
.
.
.
.
.
.
.
.
.
.
.
.
.
.
.
.
.
.
.
.
.
.
.
.
.
.
.
.
.
.
.
.
.
.
.
.
.
.
.
.
.
.
.
.
.
.
.
.
.
.
.
.
.
.
.
.
.
.
.
.
.
.
.
.
.
.
.
.
.
.
.
.
.
.
.
.
.
.
.
.
.
.
.
.
.
.
.
3-13
.
.
.
.
.
.
.
.
.
.
.
.
.
.
.
.
.
.
.
.
.
.
.
.
.
.
.
.
.
.
.
.
.
.
.
.
.
.
.
.
.
.
.
.
.
.
.
.
.
.
.
.
.
.
.
.
.
.
.
.
.
.
.
.
.
.
.
.
.
.
.
.
.
.
.
.
.
.
.
.
.
.
.
.
.
.
.
.
.
.
.
.
.
.
.
.
.
.
.
.
.
.
.
.
.
.
.
.
.
.
.
.
.
.
.
.
.
.
.
.
.
.
.
.
.
.
.
.
.
.
.
.
.
.
.
.
.
.
.
.
.
.
.
.
.
.
.
.
.
.
.
.
.
.
.
.
.
.
.
.
.
.
.
.
.
.
.
.
.
.
.
.
.
.
.
.
.
.
.
.
.
.
.
.
.
.
.
.
.
.
.
.
.
.
.
.
.
.
.
.
.
.
.
.
.
.
.
.
.
.
.
.
.
.
.
.
.
.
.
.
.
.
.
.
.
.
.
.
.
.
.
.
.
.
.
.
.
.
.
.
.
.
.
.
.
.
.
4-1
4-1
4-1
4-2
4-3
4-4
4-5
4-6
4-8
4-10
4-11
4-12
4-13
4-14
4-16
4-18
4-19
4-20
4-22
.
.
.
.
.
.
.
.
.
.
.
.
.
.
.
.
.
.
.
.
.
.
.
.
.
.
.
.
.
.
.
.
.
.
.
.
.
.
.
.
.
.
.
.
.
.
.
.
.
.
.
.
.
.
.
.
.
.
.
.
.
.
.
.
.
.
.
.
.
.
.
.
.
.
.
.
.
.
.
.
.
.
.
.
.
.
.
.
.
.
.
.
.
.
.
.
.
.
.
.
.
.
.
.
.
.
.
.
.
.
.
.
.
.
.
.
.
.
.
.
.
.
.
.
.
.
.
.
.
.
.
.
.
.
.
.
.
.
.
.
.
.
.
.
.
.
.
.
.
.
.
.
.
.
.
.
.
.
.
.
.
.
.
.
.
.
.
.
.
.
.
.
.
.
.
.
.
.
.
.
.
.
.
.
.
.
.
.
.
.
.
.
.
.
.
.
.
.
.
.
.
.
.
.
.
.
.
.
.
.
.
.
.
.
.
.
.
.
.
.
.
.
.
.
.
.
.
.
.
.
.
.
.
.
.
.
.
.
.
.
.
.
.
.
.
.
.
.
.
.
.
.
.
.
.
.
.
.
.
.
.
.
.
.
.
.
.
.
.
.
.
.
.
.
.
.
.
.
.
.
.
.
.
.
.
.
.
.
.
.
.
.
.
.
.
.
.
.
.
.
.
.
.
.
.
.
.
.
.
.
.
.
.
.
.
.
.
.
.
.
.
.
.
.
.
5-1
5-1
5-2
5-2
5-3
5-4
5-5
5-6
5-8
5-9
5-10
5-12
5-13
5-14
5-15
5-16
5-17
5-18
5-19
5-20
5-21
5-22
5-23
5-24
5-26
6. HP 11990A Option 200 System Software Package
Introduction . . . . . . . . . . . . . . .
Option 200 Tests . . . . . . . . . . . .
Test Descriptions . . . . . . . . . . . .
Limited Cal Tests . . . . . . . . . . . .
Sweep Time Accuracy . . . . . . . . . . .
Calibrator Frequency Accuracy . . . . . . .
Second Harmonic Distortion . . . . . . . .
Third Order IMD . . . . . . . . . . . . .
Gain Compression . . . . . . . . . . . .
Calibrator Amplitude Accuracy . . . . . . .
Frequency Response (HP 70905A, HP 70906A)
Frequency Response (HP 70600A, HP 70601A)
Frequency Readout Accuracy . . . . . . . .
Frequency Span Accuracy . . . . . . . . .
Image Responses (HP 70905A or HP 70906A)
Image Response (HP 70600A, HP 70601A) . .
Multiple Responses (HP 70600A, HP 70601A)
Displayed Average Noise . . . . . . . . . .
Residual Responses . . . . . . . . . . . .
Noise Sidebands . . . . . . . . . . . . .
Line and System Related Sidebands . . . . .
Synthesis Related Sidebands . . . . . . . .
Step Gain Accuracy . . . . . . . . . . . .
Log Fidelity . . . . . . . . . . . . . . .
Resolution Bandwidth Tests . . . . . . . .
Linear Fidelity . . . . . . . . . . . . . .
.
.
.
.
.
.
.
.
.
.
.
.
.
.
.
.
.
.
.
.
.
.
.
.
.
.
7. HP 11990A Option 209 System Software Package
Introduction . . . . . . . . . .
Option 209 Tests . . . . . . .
Test Descriptions . . . . . . .
Limited Cal Tests . . . . . . .
Sweep Time Accuracy . . . . . .
Calibrator Frequency Accuracy . .
Second Harmonic Distortion . . .
Third Order IMD . . . . . . . .
Gain Compression . . . . . . .
Calibrator Amplitude Accuracy . .
Frequency Response (HP 70908A) .
Frequency Readout Accuracy . . .
Frequency Span Accuracy . . . .
Image Responses . . . . . . . .
Multiple Responses . . . . . . .
Displayed Average Noise . . . . .
Residual Responses . . . . . . .
Noise Sidebands . . . . . . . .
Line and System Related Sidebands
Synthesis Related Sidebands . . .
Step Gain Accuracy . . . . . . .
Log Fidelity . . . . . . . . . .
.
.
.
.
.
.
.
.
.
.
.
.
.
.
.
.
.
.
.
.
.
.
.
.
.
.
.
.
.
.
.
.
.
.
.
.
.
.
.
.
.
.
.
.
.
.
.
.
.
.
.
.
.
.
.
.
.
.
.
.
.
.
.
.
.
.
.
.
.
.
.
.
.
.
.
.
.
.
.
.
.
.
.
.
.
.
.
.
.
.
.
.
.
.
.
.
.
.
.
.
.
.
.
.
.
.
.
.
.
.
.
.
.
.
.
.
.
.
.
.
.
.
.
.
.
.
.
.
.
.
.
.
.
.
.
.
.
.
.
.
.
.
.
.
.
.
.
.
.
.
.
.
.
.
.
.
.
.
.
.
.
.
.
.
.
.
.
.
.
.
.
.
.
.
.
.
.
.
.
.
.
.
.
.
.
.
.
.
.
.
.
.
.
.
.
.
.
.
.
.
.
.
.
.
.
.
.
.
.
.
.
.
.
.
.
.
.
.
.
.
.
.
.
.
.
.
.
.
.
.
.
.
.
.
.
.
.
.
.
.
.
.
.
.
.
.
.
.
.
.
.
.
.
.
.
.
.
.
.
.
.
.
.
.
.
.
.
.
.
.
.
.
.
.
.
.
.
.
.
.
.
.
.
.
.
.
.
.
.
.
.
.
.
.
.
.
.
.
.
.
.
.
.
.
.
.
.
.
.
.
.
.
.
.
.
.
.
.
.
.
.
.
.
.
.
.
.
.
.
.
.
.
.
.
.
.
.
.
.
.
.
.
.
.
.
.
.
.
.
.
.
.
.
.
.
.
.
.
.
.
.
.
.
.
.
.
.
.
.
.
.
.
.
.
.
.
.
.
.
.
.
.
.
.
.
.
.
.
.
.
.
.
.
.
.
.
.
.
.
.
.
.
.
.
.
.
.
.
.
.
.
.
.
.
.
.
.
.
.
.
.
.
.
.
.
.
.
.
.
.
.
.
.
.
.
.
.
.
.
.
.
.
.
.
.
.
.
.
.
.
.
.
.
.
.
.
.
.
.
.
.
.
.
.
.
.
.
.
.
.
6-1
6-1
6-2
6-2
6-3
6-4
6-5
6-6
6-8
6-9
6-10
6-12
6-14
6-15
6-16
6-17
6-19
6-21
6-22
6-23
6-25
6-26
6-27
6-28
6-29
6-31
.
.
.
.
.
.
.
.
.
.
.
.
.
.
.
.
.
.
.
.
.
.
.
.
.
.
.
.
.
.
.
.
.
.
.
.
.
.
.
.
.
.
.
.
.
.
.
.
.
.
.
.
.
.
.
.
.
.
.
.
.
.
.
.
.
.
.
.
.
.
.
.
.
.
.
.
.
.
.
.
.
.
.
.
.
.
.
.
.
.
.
.
.
.
.
.
.
.
.
.
.
.
.
.
.
.
.
.
.
.
.
.
.
.
.
.
.
.
.
.
.
.
.
.
.
.
.
.
.
.
.
.
.
.
.
.
.
.
.
.
.
.
.
.
.
.
.
.
.
.
.
.
.
.
.
.
.
.
.
.
.
.
.
.
.
.
.
.
.
.
.
.
.
.
.
.
.
.
.
.
.
.
.
.
.
.
.
.
.
.
.
.
.
.
.
.
.
.
.
.
.
.
.
.
.
.
.
.
.
.
.
.
.
.
.
.
.
.
.
.
.
.
.
.
.
.
.
.
.
.
.
.
.
.
.
.
.
.
.
.
.
.
.
.
.
.
.
.
.
.
.
.
.
.
.
.
.
.
.
.
.
.
.
.
.
.
.
.
.
.
.
.
.
.
.
.
.
.
.
.
.
.
.
.
.
.
7-1
7-1
7-2
7-2
7-3
7-4
7-5
7-6
7-8
7-9
7-10
7-12
7-13
7-14
7-16
7-18
7-19
7-20
7-21
7-22
7-23
7-24
Contents-3
Resolution Bandwidth Test . . . . . . .
Linear Fidelity . . . . . . . . . . . .
Bandwidth . . . . . . . . . . . . . .
Local Oscillator (LO) Output Amplitude .
.
.
.
.
.
.
.
.
.
.
.
.
8. HP 11990A Option 210 System Software Package
Introduction . . . . . . . . . .
Option 210 Tests . . . . . . .
Test Descriptions . . . . . . .
Limited Cal Tests . . . . . . .
Sweep Time Accuracy . . . . . .
Calibrator Frequency Accuracy . .
Second Harmonic Distortion . . .
Third Order IMD . . . . . . . .
Gain Compression . . . . . . .
Calibrator Amplitude Accuracy . .
Frequency Response (HP 70908A) .
Frequency Readout Accuracy . . .
Frequency Span Accuracy . . . .
Image Responses . . . . . . . .
Multiple Responses . . . . . . .
Displayed Average Noise . . . . .
Residual Responses . . . . . . .
Noise Sidebands . . . . . . . .
Line and System Related Sidebands
Synthesis Related Sidebands . . .
Step Gain Accuracy . . . . . . .
Log Fidelity . . . . . . . . . .
Resolution Bandwidth Test . . . .
Linear Fidelity . . . . . . . . .
.
.
.
.
.
.
.
.
.
.
.
.
.
.
.
.
.
.
.
.
.
.
.
.
.
.
.
.
.
.
.
.
.
.
.
.
.
.
.
.
.
.
.
.
.
.
.
.
.
.
.
.
.
.
.
.
.
.
.
.
.
.
.
.
.
.
.
.
.
.
.
.
.
.
.
.
.
.
.
.
.
.
.
.
.
.
.
.
.
.
.
.
.
.
.
.
.
.
.
.
.
.
.
.
.
.
.
.
.
.
.
.
.
.
.
.
.
.
.
.
.
.
.
.
.
.
.
.
.
.
.
.
.
.
.
.
.
.
.
.
.
.
.
.
9. HP 11990A Option 300 System Software Package
Introduction . . . . . . . .
Option 300 Tests . . . . .
Test Descriptions . . . . .
Limited Cal Tests . . . . .
Sweep Time Accuracy . . . .
Calibrator Frequency Accuracy
Mixer Bias Output Accuracy .
Calibrator Amplitude Accuracy
LO Output Amplitude . . . .
Frequency Response . . . . .
Frequency Readout Accuracy .
Frequency Span Accuracy . .
Gain Calibration Accuracy . .
Displayed Average Noise Level
Residual Responses . . . . .
Log Fidelity . . . . . . . .
Resolution Bandwidth . . . .
IF Gain Accuracy . . . . . .
Image Response . . . . . .
Contents-4
.
.
.
.
.
.
.
.
.
.
.
.
.
.
.
.
.
.
.
.
.
.
.
.
.
.
.
.
.
.
.
.
.
.
.
.
.
.
.
.
.
.
.
.
.
.
.
.
.
.
.
.
.
.
.
.
.
.
.
.
.
.
.
.
.
.
.
.
.
.
.
.
.
.
.
.
.
.
.
.
.
.
.
.
.
.
.
.
.
.
.
.
.
.
.
.
.
.
.
.
.
.
.
.
.
.
.
.
.
.
.
.
.
.
.
.
.
.
.
.
.
.
.
.
.
.
.
.
.
.
.
.
.
.
.
.
.
.
.
.
.
.
.
.
.
.
.
.
.
.
.
.
.
.
.
.
.
.
.
.
.
.
.
.
.
.
.
.
.
.
.
.
.
.
.
.
.
.
.
.
.
.
.
.
.
.
.
.
.
.
.
.
.
.
.
.
.
.
.
.
.
.
.
.
7-25
7-27
7-28
7-30
.
.
.
.
.
.
.
.
.
.
.
.
.
.
.
.
.
.
.
.
.
.
.
.
.
.
.
.
.
.
.
.
.
.
.
.
.
.
.
.
.
.
.
.
.
.
.
.
.
.
.
.
.
.
.
.
.
.
.
.
.
.
.
.
.
.
.
.
.
.
.
.
.
.
.
.
.
.
.
.
.
.
.
.
.
.
.
.
.
.
.
.
.
.
.
.
.
.
.
.
.
.
.
.
.
.
.
.
.
.
.
.
.
.
.
.
.
.
.
.
.
.
.
.
.
.
.
.
.
.
.
.
.
.
.
.
.
.
.
.
.
.
.
.
.
.
.
.
.
.
.
.
.
.
.
.
.
.
.
.
.
.
.
.
.
.
.
.
.
.
.
.
.
.
.
.
.
.
.
.
.
.
.
.
.
.
.
.
.
.
.
.
.
.
.
.
.
.
.
.
.
.
.
.
.
.
.
.
.
.
.
.
.
.
.
.
.
.
.
.
.
.
.
.
.
.
.
.
.
.
.
.
.
.
.
.
.
.
.
.
.
.
.
.
.
.
.
.
.
.
.
.
.
.
.
.
.
.
.
.
.
.
.
.
.
.
.
.
.
.
.
.
.
.
.
.
.
.
.
.
.
.
.
.
.
.
.
.
.
.
.
.
.
.
.
.
.
.
.
.
.
.
.
.
.
.
.
.
.
.
.
.
8-1
8-1
8-2
8-2
8-3
8-4
8-5
8-6
8-8
8-9
8-10
8-12
8-13
8-14
8-16
8-18
8-19
8-20
8-21
8-22
8-23
8-24
8-25
8-27
.
.
.
.
.
.
.
.
.
.
.
.
.
.
.
.
.
.
.
.
.
.
.
.
.
.
.
.
.
.
.
.
.
.
.
.
.
.
.
.
.
.
.
.
.
.
.
.
.
.
.
.
.
.
.
.
.
.
.
.
.
.
.
.
.
.
.
.
.
.
.
.
.
.
.
.
.
.
.
.
.
.
.
.
.
.
.
.
.
.
.
.
.
.
.
.
.
.
.
.
.
.
.
.
.
.
.
.
.
.
.
.
.
.
.
.
.
.
.
.
.
.
.
.
.
.
.
.
.
.
.
.
.
.
.
.
.
.
.
.
.
.
.
.
.
.
.
.
.
.
.
.
.
.
.
.
.
.
.
.
.
.
.
.
.
.
.
.
.
.
.
.
.
.
.
.
.
.
.
.
.
.
.
.
.
.
.
.
.
.
.
.
.
.
.
.
.
.
.
.
.
.
.
.
.
.
.
.
.
.
.
.
.
.
.
.
.
.
.
.
.
.
.
.
.
.
.
.
.
.
.
.
.
.
.
.
.
.
.
.
.
.
.
.
.
.
.
9-1
9-1
9-1
9-2
9-3
9-4
9-5
9-6
9-8
9-9
9-11
9-14
9-17
9-19
9-21
9-23
9-25
9-27
9-29
A. Measurement Uncertainty
Introduction . . . . . . . . . . . . . . . . . . . . . . . . . . . . .
Combining Individual Uncertainties . . . . . . . . . . . . . . . . . . .
Combining Uncertainty and Specication . . . . . . . . . . . . . . . .
B. Error and Status Messages
Introduction . . . . . . . . . . . . . . . . . . . . . . . . . . . . .
A-1
A-2
A-3
B-1
C. Standard Test Equipment
D. Critical Test Equipment Specications
E. Specialized Test Equipment
Contents-5
Figures
3-1.
3-2.
3-3.
3-4.
9-1.
9-2.
9-3.
9-4.
9-5.
9-6.
9-7.
9-8.
9-9.
A-1.
Main Menu Softkeys . . . . . . . . . . . . . . . . . . . . . . . . .
Mass Storage Menu and Parameter Menu Softkeys . . . . . . . . . . .
Equipment Menu and HP-MSIB Address Menu Softkeys . . . . . . . . .
Test Menu Softkeys . . . . . . . . . . . . . . . . . . . . . . . . .
Frequency Response Test Setup . . . . . . . . . . . . . . . . . . . .
Frequency Readout Accuracy Test Setup A . . . . . . . . . . . . . . .
Frequency Readout Accuracy Test Setup B (alternate) . . . . . . . . . .
Frequency Span Accuracy Test Setup A . . . . . . . . . . . . . . . .
Frequency Span Accuracy Test Setup B (alternate) . . . . . . . . . . .
Gain Calibration Accuracy Test Setup A . . . . . . . . . . . . . . . .
Gain Calibration Accuracy Test Setup B (alternate) . . . . . . . . . . .
Displayed Average Noise Level Test Setup B (alternate) . . . . . . . . .
Residual Response Test Setup B (alternate) . . . . . . . . . . . . . .
Acceptable Measurement Range with Measurement Uncertainty Coecient
Set to Zero . . . . . . . . . . . . . . . . . . . . . . . . . . .
3-16
3-17
3-18
3-19
9-9
9-11
9-12
9-14
9-15
9-17
9-18
9-19
9-21
A-1
Tables
1-1. HP 11990A Options . . . . . . . . . . . . . . . . . . . . . . . . .
C-1. Required Accessories . . . . . . . . . . . . . . . . . . . . . . . .
C-2. Required External Test Equipment . . . . . . . . . . . . . . . . . .
Contents-6
1-2
C-1
C-2
1
General Information
Introduction
This manual documents the user-interface program of the HP 11990A System Performance
Test software and describes the performance tests available for each of the individual options.
The user-interface program automates the test process. Refer to \Shipment Contents" for
more information about what is included with the system performance test programs.
This chapter contains general information. Chapter 2 contains procedures to congure the
hardware and install the test software. Chapter 3 contains detailed information about the
user-interface menus. Chapters 4 through 9 describe the performance tests for each of the
dierent options.
The information in this chapter is divided into the following sections:
Shipment Contents . . . . . . . . . . . . . . . . . . . . . . . . . . . . . . . . . . . . . . . . . . . . . . . . . . . . . 1-2
Software Version . . . . . . . . . . . . . . . . . . . . . . . . . . . . . . . . . . . . . . . . . . . . . . . . . . . . . . . 1-3
Software/Hardware Compatibility . . . . . . . . . . . . . . . . . . . . . . . . . . . . . . . . . . . . . . . . 1-3
Computer Hardware Compatibility . . . . . . . . . . . . . . . . . . . . . . . . . . . . . . . . . . . . 1-3
Computer Language Compatibility . . . . . . . . . . . . . . . . . . . . . . . . . . . . . . . . . . . . 1-3
Printer Compatibility . . . . . . . . . . . . . . . . . . . . . . . . . . . . . . . . . . . . . . . . . . . . . . . 1-4
Typographic Conventions . . . . . . . . . . . . . . . . . . . . . . . . . . . . . . . . . . . . . . . . . . . . . . . 1-4
Required Test Equipment . . . . . . . . . . . . . . . . . . . . . . . . . . . . . . . . . . . . . . . . . . . . . . . 1-5
Standard Test Equipment . . . . . . . . . . . . . . . . . . . . . . . . . . . . . . . . . . . . . . . . . . . . 1-5
Specialized Test Equipment . . . . . . . . . . . . . . . . . . . . . . . . . . . . . . . . . . . . . . . . . . 1-5
System Performance Test Software Overview . . . . . . . . . . . . . . . . . . . . . . . . . . . . . . . 1-5
Testing Multiple Systems . . . . . . . . . . . . . . . . . . . . . . . . . . . . . . . . . . . . . . . . . . . . 1-5
Types of Error Messages or Warnings Dened . . . . . . . . . . . . . . . . . . . . . . . . . . 1-6
Limited Cal Dened . . . . . . . . . . . . . . . . . . . . . . . . . . . . . . . . . . . . . . . . . . . . . . . . . 1-6
Single Tests Dened . . . . . . . . . . . . . . . . . . . . . . . . . . . . . . . . . . . . . . . . . . . . . . . . . 1-6
Test Results . . . . . . . . . . . . . . . . . . . . . . . . . . . . . . . . . . . . . . . . . . . . . . . . . . . . . . . . 1-7
Printing Test Results . . . . . . . . . . . . . . . . . . . . . . . . . . . . . . . . . . . . . . . . . . . . . . . . 1-7
Notes
Before you can use the start-up procedure in Chapter 2 to install the user
interface, you must have a system software package. The user interface
start-up procedure requires the Executive Disk from a system software
package.
The HP 11990A System Performance Test software automates the electrical
performance verication of a single RF input of an HP 70000 Series modular
spectrum analyzer whose master module is an HP 70900 local oscillator. If
your system has more than one RF input, refer to \Testing Multiple Systems"
under \System Performance Test Software Overview" in this chapter.
General Information
1-1
Shipment Contents
This documentation supports HP 11990A System Performance Test software, Revision B.03.00
or greater. The system performance test software consists of three types of packages:
User Interface package, which is used to automate the test process.
System Software package, which contain tests for specic predened systems.
System Add-On package, which contains additional tests that may be needed to test
modules that are not part of a predened system.
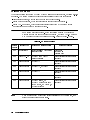
Note
HP 70900 system performance tests require both the User Interface package
and a system software package. If you are testing a system that includes
modules that are not part of a predened system, a System Add-On package
may be needed to test the additional modules. Refer to Table 1-1 below.
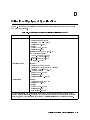
Table 1-1. HP 11990A Options
Option
Number
Package Type
System or Module Supported
Shipment Contents
001
User Interface
Required for all HP 70900 system This manual
performance tests
Executive Disk
Operating Disk
033
System Add-On
HP 70300A or HP 70301A
tracking generators
Manual describing individual tests
Test Disk 3
100
System Software
HP 71100A/C
Manual describing individual tests
Test Disk 1
200
System Software
HP 71200A/C, HP 71201A
Manual describing individual tests
Test Disk 1
209
System Software
HP 71209A/C
Manual describing individual tests
Test Disk 1
210
System Software
HP 71210A/C
Manual describing individual tests
Test Disk 1
300
System Software
HP 71300A system, or
HP 70907A module when used
with HP 71100C, HP 71200C, or
HP 71210C systems
Manual describing individual tests
Test Disk 1
Note
1-2
Make a working copy of each disk before installing any of the software, then
store the master disks in a safe place.
General Information
Software Version
The program software version and the program part number will be needed if you contact
Hewlett-Packard about this software. The program part number is printed on the disk labels.
The software version of the program is visible on the right-hand side of the display that
appears after the rst program disk is loaded. It is also visible in the Main Menu and the Test
Menu. Specic numbers vary, but the version number looks like this: Rev. A.02.00. Refer to
\Installing System Performance Test Software" in Chapter 2.
Software/Hardware Compatibility
Computer Hardware Compatibility
System Performance Test software is written in HP 9000 Series BASIC 4.0. There is no
copy protection. The software can run on the following HP 9000 Series 200/300 computers.
Minimum RAM requirement is 2.0 megabytes.
HP 9816
HP 9836
HP 9920 (with HP 35721A Monitor)
HP 9000 Series 300 computer
When using an HP 9000 Series 300 computer, a medium-resolution monitor and either an
HP 98203C or an HP 46020A keyboard are required. If printed results are not needed, a
high-resolution monitor can be used.
Due to the various keyboards supported, some minor text dierences appear in the menus and
softkeys displayed on-screen. Refer to \Typographic Conventions," later in this chapter.
Computer Language Compatibility
Note
If you have set up some RAM memory for specic usage, be aware that
this program uses RAM memory Volume \:MEMORY, 0, 15". Move any
information stored at this Volume to another location before running the
System Performance Test software program.
The software program runs on HP BASIC 4.0, or later, with the following BIN les in RAM.
CLOCK
CS80 (optional { supports newer
Winchester disk drives)
DISC (optional { supports microoppies
and older Winchester disk drives)
ERR
GRAPH
GRAPHX
CRTA or CRTB
HPIB
IO
KBD
MAT
MS
PDEV (optional { provides
debugging features for
program development)
General Information
1-3
In an SRM (shared resource management) environment, the following BIN les are also
required:
DCOMM
SRM
In an HFS (hierarchical le structure) environment, the following BIN le is also required:
HFS
Printer Compatibility
System Performance Test software supports any HP-IB printer; however, many of the printed
test results require a graphics printer. Graphical test results are not output to a non-graphics
printer.
Note
It is not possible to print graphical test results when an HP 9000 Series
300 computer is used with a high-resolution monitor. Refer to \Computer
Hardware Compatibility" above for more information.
Typographic Conventions
This manual uses the following conventions:
Text that looks like this represents the key label of a key physically located on the
4
5
analyzer or computer.
Text that looks like this represents a \softkey," a key whose label is determined
softkey
by the instrument's rmware. When softkey labels are written in lowercase
letters, a sub-level softkey menu exists for that particular softkey. Softkey labels
written in uppercase letters indicate that no further sub-level softkey menus exist
for that softkey.
Text
Text that looks like this represents messages displayed on the CRT, or text that
the user enters via the keyboard.
For simplicity in this document, we assume that you are using either an HP 9000 Series 200
keyboard, or an HP 98203C keyboard. Refer to the table below if your keyboard key labels do
not match the ones used in text.
KEY
NNNNNNNNNNNNNNNNNNNNNNN
1-4
Key Labels Shown in This Document
Alternate Key Labels
4EXECUTE5
4RETURN5
4ENTER5
4RETURN5
4RUN5
press 4SYSTEM5, then press RUN
4CONTINUE5
press 4SYSTEM5, then press CONTINUE
General Information
NNNNNNNNNN
NNNNNNNNNNNNNNNNNNNNNNNN
Required Test Equipment
Standard Test Equipment
The Equipment Menu lists preferred test equipment models supported by the software.
Substitute equipment is acceptable if it meets or exceeds minimum critical specications for a
particular HP 70000 Series modular spectrum analyzer. The user must supply and install the
instrument software for unlisted equipment.
The manual in each system software package lists required test equipment types for each test.
One appendix in that manual provides a list of test equipment types and the minimum critical
specications for each. Another appendix lists equipment that meets these specications.
The performance tests also require a technical computer. Refer to \Computer Hardware
Compatibility" in this chapter.
Specialized Test Equipment
Some performance tests require specialized test equipment (for example, lters). Construction
information appears in an appendix in the appropriate system software package manual.
System Performance Test Software Overview
Testing Multiple Systems
System performance test software tests only one system at a time. If you have more than one
RF section module to test in your conguration, test them separately. If you have tested a RF
section module and want to select another RF section module to test without turning o the
controller, follow the steps below.
Note
The program erases test results stored on disk the rst time it enters the Test
Menu. Therefore, if you want a printed copy of the previously run test results,
you must print them before pressing test menu . Refer to the Chapter 3
\Parameter Menu" and \Main Menu" sections. \Parameter Menu" contains
information on conguring the software to save test results to disk. \Main
Menu" contains information about the REPRINT softkey.
NNNNNNNNNNNNNNNNNNNNNNNNNNNNN
NNNNNNNNNNNNNNNNNNNNNNN
1. Get to the Main Menu.
2. Press RESTART , then press HP-MSIB map .
3. Press SELECT MODULE to select the desired RF section module. (The SELECT MODULE
softkey is only present when more than one RF section module is present.)
4. Press main menu .
5. From the Main Menu, press test menu . If ERROR MESSAGE: Selected system under
test is ; but the software supports the _ system appears, either press RELOAD and follow
NNNNNNNNNNNNNNNNNNNNNNN
NNNNNNNNNNNNNNNNNNNNNNNNNNNNNNNNNNN
NNNNNNNNNNNNNNNNNNNNNNNNNNNNNNNNNNNNNNNNN
NNNNNNNNNNNNNNNNNNNNNNNNNNNNNNNNNNNNNNNNN
NNNNNNNNNNNNNNNNNNNNNNNNNNNNN
NNNNNNNNNNNNNNNNNNNNNNNNNNNNN
NNNNNNNNNNNNNNNNNNNN
General Information
1-5
the on-screen prompts to load dierent test software, press CHANGE DUT to gain access to
either the HP-MSIB Address Menu or the Equipment Menu, or press ABORT to return to
the Main Menu. From the HP-MSIB Address Menu, select the RF section module to test
that matches the software you already have loaded. From the Equipment Menu, change the
HP-IB address of the HP 70000 system's master module.
NNNNNNNNNNNNNNNNNNNNNNNNNNNNNNNN
NNNNNNNNNNNNNNNNN
Types of Error Messages or Warnings Defined
There are three kinds of error messages or warnings generated by the program.
One type appears briey at the bottom of the CRT display. The program then goes
automatically to a menu that asks you for corrections or modications.
Another type of error message begins with ERROR MESSAGE and provides special softkeys.
These errors are user-correctable and anticipated by the program. There is usually a
Possible Fix message displayed to help you clear the problem.
The nal type begins with ERROR and provides no special softkeys. The message informs you
of an unanticipated error. There is no suggested x displayed. If you cannot recover from
one of these errors, please contact your Hewlett-Packard Sales and Service Oce.
Appendix B in this manual gives detailed error and status message information.
Limited Cal Defined
Limited Cal is a subset of the system performance tests and is used to verify system operation
or check the system after any repair. Press QUICK TEST in the Main Menu or LIMITED CAL
in the Test Menu to start the Limited Cal routine.
NNNNNNNNNNNNNNNNNNNNNNNNNNNNNNNN
NNNNNNNNNNNNNNNNNNNNNNNNNNNNNNNNNNN
Single Tests Defined
You may select individual system performance tests with this program. Refer to \Test Menu"
in Chapter 3, \Menus."
Test Results
For each performance test, the program indicates whether the system passed or requires
adjustment. The program's measurement uncertainty calculations for each test assume
that you are using a preferred set of test equipment; substituting equipment can aect
result validity. Refer to \Required Test Equipment" in this chapter for further information.
Appendix A describes measurement uncertainty.
Printing Test Results
You can use the Parameter Menu to congure the program to format and print test results.
Test results will be automatically printed if the program is correctly congured, an HP-IB
printer is on the bus, and the printer address is provided in the Equipment Menu. The
printout includes title and summary pages. The summary page will be printed at the
completion of the Limited Cal or All Test modes of operation if the printer is selected for
Results sent to: in the Parameter Menu. The summary page will also be printed when the
Test Menu SUMMARY softkey is pressed.
NNNNNNNNNNNNNNNNNNNNNNN
1-6
General Information
The title page lists the following data:
System performance test software used, version code for the user interface software, and the
test date.
Model number, serial number, and rmware version of the modules tested.
Test person's identication.
Customer's name.
Repair number.
Power line frequency.
Elapsed time since test equipment was calibrated.
Ambient temperature.
Ambient humidity.
Test equipment names, model numbers, addresses, and ID or serial number.
The Summary Page contains the following information:
System performance test software used, version codes for user interface and test package
software, and the test date.
Model number, serial number, and rmware version of the modules tested.
Text indicating that the instrument passed, or that it requires adjustment or repair to meet
specications.
There may also be listings of tests under one or more of the following categories:
The following tests showed insucient performance.
The following tests gave ambiguous results.
The following tests were not completed due to setup errors.
The following tests met the appropriate specications.
The following tests were not completed.
General Information
1-7
2
Start-Up Procedures
This chapter contains procedures for installation and use of the HP 11990A System
Performance Test software with either an HP 9133 or HP 9122. Both the HP 11990A System
Performance Test Option 001 user-interface software and a test option (that is, Option 100,
200, 209, 210, or 300) are required before the program can be installed. If you are testing a
system that includes modules that are not part of a predened system, a System Add-on
package may also be needed to test the additional modules.
Note
Refer to the Installation and Verication Manual for the HP 70900 local
oscillator for information about the conguration of various predened
HP 70000 Series modular spectrum analyzers.
Start-Up Procedures
2-1
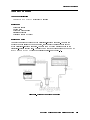
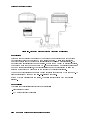
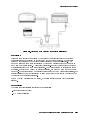
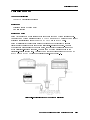
Configuring the Hardware
1. Connect the HP 70000 Series modular spectrum analyzer to the computer port determined
by the following criteria:
a. For computers with an additional HP 98624A HP-IB Interface, connect your spectrum
analyzer to the port labeled HP-IB SELECT CODE 8. Check that the address switch on
the HP 98624A HP-IB Interface board assembly matches the HP-IB controller device
address. If needed, refer to the HP 9000 Series 200/300 Peripheral Installation Guide,
Volume 1 .
b. For computers without an HP 98624A HP-IB Interface, connect the HP 70000 Series
modular spectrum analyzer to the port labeled HP-IB SELECT CODE 7.
2. Connect the HP-IB cables from the test equipment to the computer's HP-IB SELECT
CODE 7 port.
3. Use a 0.5 meter HP-IB cable (HP 10833D, or similar cable) to connect the external disk
drive's HP-IB to the HP-IB SELECT CODE 7 port.
Note
Occasionally disk drives exhibit unpredictable behavior when sharing the
HP-IB with instruments. If you nd this occurring, connect the disk drive to a
separate HP-IB interface.
4. Set the external test equipment and the HP 70000 Series modular spectrum analyzer
line switches to ON. Allow the equipment to warm up at least 1 hour for the system
performance tests.
5. Turn on the disk drive and computer.
2-2
Start-Up Procedures
System Performance Test Software
This section contains a procedure for installing the program. More specic program-operation
information is contained in Chapter 3, \Menus."
Two assumptions are made with the System Performance Test software: that you are using
standard HP-IB addresses for the test equipment, and that all passive devices are available. If
either of these assumptions is incorrect, you must use the \Equipment Menu Edit Screen" to
correctly congure your test equipment.
Note
The program software version and the program part number will be needed
if you contact Hewlett-Packard about this software. The software version of
the program is visible on the right-hand side of the display that appears after
the rst program disk is loaded. It is also visible in the Main Menu and the
Test Menu. Specic numbers vary, but the version number looks like this:
Rev. A.02.00. The program part number is printed on the disk labels.
Installing System Performance Test Software onto an HP 9133
1. Load BASIC 4.0 or later, with the appropriate binaries, into an HP 9000 Series 200/300
computer. If necessary, refer to an HP BASIC reference manual.
Caution
Make backup copies of all disks. If the program data on an individual disk
should become altered, it cannot be ordered separately. The entire set of disks
must be ordered to replace any one disk.
2. Assign the MSI (mass storage is) to the oppy drive of the HP 9133. As an example,
assigning the MSI to the oppy disk drive should be similar to the following:
MSI ":,700,1"
3. Insert the Executive disk into the default oppy drive and type in the following:
LOAD"INSTAL_HFS",1
4Return5
A screen prompt titled \PROCESS OVERVIEW" will appear. Please read the entire
prompt, make any decisions that pertain to your equipment setup, then press CONTINUE .
4. Enter the MSUS of the source and destination disks by following the screen prompts.
If desired, an additional directory path for the destination disk can be entered at this
time, otherwise press 4 5 to continue.
Your source and destination entries will now be conrmed and the program will continue
with Creating Directory Structure.
5. Insert the Executive disk into the default oppy drive as indicated by the screen prompt
and press CONTINUE . Executive disk les will be copied to destination directories created
on the hard drive in the previous step.
Remove the Executive disk from the oppy drive when prompted.
NNNNNNNNNNNNNNNNNNNNNNNNNN
Return
NNNNNNNNNNNNNNNNNNNNNNNNNN
Start-Up Procedures
2-3
6. Insert the Operating disk into the default oppy drive as indicated by the screen prompt
and press CONTINUE . Operating disk les will be copied to destination directories
previously created on the hard drive. Remove the Operating disk from the oppy drive
when prompted.
7. To copy option performance tests to the hard drive at this time, you must answer Yes to
the following screen prompt:
NNNNNNNNNNNNNNNNNNNNNNNNNN
Do you want to copy any OPTION discs? (Y or N)
Note
It is important at this time to decide whether you would like to copy your
option performance tests to the hard drive. When the display screen prompts
you to copy disks for your option software, this will be the only opportunity to
copy your option performance tests to the hard drive.
If you do not want to copy the performance tests for your option to the hard drive,
answering No to the above prompt completes the installation procedure. Otherwise, a
screen prompt for each available option (in numerical order) will appear allowing you to
copy performance tests to the hard drive.
8. Insert the Test disk for your option making sure to select the correct screen prompt that
matches your option, then press CONTINUE .
After you have completed copying your option(s) performance tests onto the hard drive,
the installation procedure is complete.
NNNNNNNNNNNNNNNNNNNNNNNNNN
Running the System Performance Test Software from an HP 9133
Note
The user-interface software automatically reads system conguration data
from the Hewlett-Packard Modular System Interface Bus (HP-MSIB). This
data is then written to the HP-MSIB Address Menu command screen as a list
of the modules in the current system. The conguration of the current system
is easily veried on the HP-MSIB Address Menu command screen.
9. Change to the hard drive directory where the executive les reside by typing the following
command line:
MSI"/MMS_SYS_TEST/900_SPT/EXEC:,700,0"
Note
4Return5
The MSUS could be dierent depending on the HP-IB address of the HP 9133.
If an additional directory path was assigned during the installation procedure,
this path must precede the assigned directory path (/MMS SYS TEST/)
shown above.
10. To run the System Performance Test software, type the following command line:
LOAD "900_SPT",1
2-4
Start-Up Procedures
4Return5
11. When the \Test Disk" prompt appears, press the mass storage (F4) key.
The \Mass Storage Menu Edit Screen" will appear with the three following categories:
Volume Label
MSUS
DIRECTORY PATH
12. Using the cursor keys, place the arrow pointing to the DIRECTORY PATH and press
SELECT (F1).
13. Enter one of the directory paths as listed below for the system being tested and then press
4
5.
../71100C TESTS
../71200C TESTS
../71209A TESTS
../71210C TESTS
../71300A TESTS
14. Press DONE (F8), then PROCEED (F6).
15. Enter any serial numbers for sensors as prompted by the program.
16. Press test menu to access the performance tests for your system and the following
softkeys will be displayed for use with your performance tests.
ALL TESTS (F1)
LIMITED CAL (F2)
SUMMARY (F4)
main menu (F6)
HELP (F7)
quit (F8)
Refer to the display screen for more information and further instructions regarding the
performance tests.
In order to access the SINGLE TEST softkey, press the 4 5 key on the computer
keyboard.
NNNNNNNNNNNNNNNNNNNNNNNNNNNNNNNNNNNNNN
NNNNNNNNNNNNNNNNNNNN
Return
NNNNNNNNNNNNNN
NNNNNNNNNNNNNNNNNNNNNNN
NNNNNNNNNNNNNNNNNNNNNNNNNNNNN
NNNNNNNNNNNNNNNNNNNNNNNNNNNNN
NNNNNNNNNNNNNNNNNNNNNNNNNNNNNNNNNNN
NNNNNNNNNNNNNNNNNNNNNNN
NNNNNNNNNNNNNNNNNNNNNNNNNNNNN
NNNNNNNNNNNNNN
NNNNNNNNNNNNNN
NNNNNNNNNNNNNNNNNNNNNNNNNNNNNNNNNNN
Next
Start-Up Procedures
2-5
Running System Performance Test Software from an HP 9122
The user-interface software automatically reads system conguration data
from the Hewlett-Packard Modular System Interface Bus (HP-MSIB). This
data is then written to the HP-MSIB Address Menu command screen as a list
of the modules in the current system. The conguration of the current system
is easily veried on the HP-MSIB Address Menu command screen.
Note
1. Load BASIC 4.0 or later, with the appropriate binaries, into an HP 9000 Series 200/300
computer. If necessary, refer to an HP BASIC reference manual.
Caution
Make backup copies of all disks. If the program data on an individual disk
should become altered, it cannot be ordered separately. The entire set of disks
must be ordered to replace any one disk.
2. Assign the MSI (mass storage is) to the drive you will use as the default drive. As
an example, assigning the MSI to a disk drive should be similar to the following:
MSI ":,700,0"
3. Insert the Executive disk into the default oppy drive and type in the following to run the
System Performance Test software:
LOAD "900_SPT",1
4Return5
Messages regarding the load sequence for the Executive disk will appear.
4. When prompted to insert Test Disk in default drive, insert the Test disk for the
option that you want to run system performance tests on, then press PROCEED .
5. When the next screen prompt reads Mass Storage data is needed, then press PROCEED .
6. Insert the Operating disk as instructed by the Disk Prompt Screen, then press PROCEED .
NNNNNNNNNNNNNNNNNNNNNNN
NNNNNNNNNNNNNNNNNNNNNNN
NNNNNNNNNNNNNNNNNNNNNNN
7. Enter any serial numbers for sensors as prompted by the program.
8. Press test menu (F6) to build the list of performance tests.
9. The up and down cursor keys can be used to identify a specic performance test and the
following softkeys will be displayed for use with your performance tests.
ALL TESTS (F1)
LIMITED CAL (F2)
SUMMARY (F4)
main menu (F6)
HELP (F7)
quit (F8)
Refer to the display screen for more information and further instructions regarding the
performance tests.
In order to access the SINGLE TEST softkey, press the 4 5 key on the computer keyboard.
NNNNNNNNNNNNNNNNNNNNNNNNNNNNN
NNNNNNNNNNNNNNNNNNNNNNNNNNNNN
NNNNNNNNNNNNNNNNNNNNNNNNNNNNNNNNNNN
NNNNNNNNNNNNNNNNNNNNNNN
NNNNNNNNNNNNNNNNNNNNNNNNNNNNN
NNNNNNNNNNNNNN
NNNNNNNNNNNNNN
NNNNNNNNNNNNNNNNNNNNNNNNNNNNNNNNNNN
Next
2-6
Start-Up Procedures
3
Menus
This chapter contains information about the user interface menus. The information is divided
into the following sections:
Menu Structure . . . . . . . . . . . . . . . . . . . . . . . . . . . . . . . . . . . . . . . . . . . . . . . . . . . . . . . . 3-1
Common Edit and Command Screen Softkeys . . . . . . . . . . . . . . . . . . . . . . . . . . . . . . 3-2
Edit Screen Softkeys . . . . . . . . . . . . . . . . . . . . . . . . . . . . . . . . . . . . . . . . . . . . . . . . 3-2
Command Screen Softkeys . . . . . . . . . . . . . . . . . . . . . . . . . . . . . . . . . . . . . . . . . . . 3-2
Main Menu . . . . . . . . . . . . . . . . . . . . . . . . . . . . . . . . . . . . . . . . . . . . . . . . . . . . . . . . . . . . 3-4
Mass Storage Menu . . . . . . . . . . . . . . . . . . . . . . . . . . . . . . . . . . . . . . . . . . . . . . . . . . . . . 3-5
Mass Storage Menu Volume Labels . . . . . . . . . . . . . . . . . . . . . . . . . . . . . . . . . . . . 3-5
Editing Mass Storage Menu Information . . . . . . . . . . . . . . . . . . . . . . . . . . . . . . . 3-6
Parameter Menu . . . . . . . . . . . . . . . . . . . . . . . . . . . . . . . . . . . . . . . . . . . . . . . . . . . . . . . 3-7
Equipment Menu . . . . . . . . . . . . . . . . . . . . . . . . . . . . . . . . . . . . . . . . . . . . . . . . . . . . . . . 3-9
Equipment Menu Edit Screen . . . . . . . . . . . . . . . . . . . . . . . . . . . . . . . . . . . . . . . . . 3-9
Equipment Menu Command Screen . . . . . . . . . . . . . . . . . . . . . . . . . . . . . . . . . . 3-10
Editing Calibration Data . . . . . . . . . . . . . . . . . . . . . . . . . . . . . . . . . . . . . . . . . . . 3-11
HP-MSIB Address Menu . . . . . . . . . . . . . . . . . . . . . . . . . . . . . . . . . . . . . . . . . . . . . . . 3-12
Test Menu . . . . . . . . . . . . . . . . . . . . . . . . . . . . . . . . . . . . . . . . . . . . . . . . . . . . . . . . . . . . 3-13
Menu Structure
The rst menu presented allows you to go to the Main Menu, to begin Limited Cal (Quick
Test), or to return to the Equipment Menu. From the Main Menu you can access all of the
other menus. Figures 3-1 through 3-4 at the end of this chapter show the menu structure.
The Mass Storage Menu, Parameter Menu, Equipment Menu, and HP-MSIB Address Menu
are conguration menus; they are used to initialize the software for operation. In these menus
you can enter information about disk drives, environment conditions, test equipment, the
system under test, and so on.
The Test Menu allows the selection and execution of specic tests, or sets of tests, that are
present in the current system software package.
Note
When a cursor is present, you may use either the cursor arrow-keys or the
rotary pulse generator (RPG) knob to position the cursor at the column item
you wish to edit. In most cases, there are more selections available than are
displayed on-screen. Be sure to move the cursor to the right and down as far
as you can. NEXT PAGE and PREVIOUS PAGE softkeys are provided to speed
your vertical searches.
NNNNNNNNNNNNNNNNNNNNNNNNNNNNN
NNNNNNNNNNNNNNNNNNNNNNNNNNNNNNNNNNNNNNNNN
Menus
3-1
Common Edit and Command Screen Softkeys
Not all of the menus have edit screens, but all have command screens. This section describes
the edit and command screen softkeys that are common to most menus. Softkeys that are
unique to a single menu are described in the section for that menu.
Edit Screen Softkeys
The following softkeys are present for edit screens:
SELECT or
either one of these softkeys can appear in the edit screen. SELECT activates
SELECT/TOGGLE the column item where the cursor is located, while SELECT/TOGGLE
activates predened choices.
exits the edit screen, then displays the menu's command screen.
DONE
NNNNNNNNNNNNNNNNNNNN
NNNNNNNNNNNNNNNNNNNN
NNNNNNNNNNNNNNNNNNNNNNNNNNNNNNNNNNNNNNNNN
NNNNNNNNNNNNNNNNNNNNNNNNNNNNNNNNNNNNNNNNN
NNNNNNNNNNNNNN
Command Screen Softkeys
The following softkeys are present for most command screens:
returns you to the Main Menu. Refer to \Main Menu" in this chapter for
main menu
details.
appears if there is an edit screen in the menu you are working in. Pressing
EDIT
this softkey returns you to the menu's edit screen.
appears if you have data that needs to be stored on the OPERATING Volume.
STORE
The HP-MSIB Address Menu does not require this softkey, therefore it does
not appear in the command screen for that menu.
appears if you tried to store data without an existing le
CREATE
available. CREATE activates the store function and creates a
le on the OPERATING Volume.
appears if the correct Operating Disk containing calibration
REPEAT
or menu data is not in the disk drive. This softkey allows you
to insert the correct Operating Disk into the disk drive and
try again.
ABORT
displays the Main Menu screen. ABORT is available in various
special task screens but never in a menu screen. In general,
pressing this key a time or two will display the Main Menu,
which has a quit softkey.
If the Main Menu has not appeared for the rst time, pressing
ABORT produces a message asking you to press 4 5, which
returns you to where you were when you pressed ABORT .
NNNNNNNNNNNNNNNNNNNNNNNNNNNNN
NNNNNNNNNNNNNN
NNNNNNNNNNNNNNNNN
NNNNNNNNNNNNNNNNNNNN
NNNNNNNNNNNNNNNNNNNN
NNNNNNNNNNNNNNNNNNNN
NNNNNNNNNNNNNNNNN
NNNNNNNNNNNNNNNNN
NNNNNNNNNNNNNN
NNNNNNNNNNNNNNNNN
RUN
NNNNNNNNNNNNNNNNN
3-2
Menus
NNNNNNNNNNNNNN
HELP
accesses menu and softkey descriptions. Listed below are softkey selections
and functions available via this softkey.
takes you to the top of the next available menu page.
NEXT PAGE
returns you to the top of the preceding menu page.
PREVIOUS PAGE
generates a printout of help-screen information.
PRINT HELP
returns you to the command or edit screen of the menu
DONE
you were previously in.
displays the quit screen. This softkey is available only from menu command
screens. After you press quit , you are asked if you really want to return
to the BASIC operating system. The following two softkey selections are
available via the quit softkey.
stops the program, retains any data les you stored before
YES
pressing quit , and returns you to the BASIC operating
system. (You can press 4 5 to restart the program and
return to the Main Menu. The program retains all previously
entered and stored data.)
displays the edit screen of the previous menu, or the
NO
command screen if there is no edit screen.
NNNNNNNNNNNNNNNNNNNNNNNNNNNNN
NNNNNNNNNNNNNNNNNNNNNNNNNNNNNNNNNNNNNNNNN
NNNNNNNNNNNNNNNNNNNNNNNNNNNNNNNN
NNNNNNNNNNNNNN
NNNNNNNNNNNNNN
quit
NNNNNNNNNNNNNN
NNNNNNNNNNNNNN
NNNNNNNNNNN
NNNNNNNNNNNNNN
RUN
NNNNNNNN
Menus
3-3
Main Menu
From the Main Menu screen you can access all other menus. There is no edit screen for this
menu. Figure 3-1 illustrates the Main Menu softkey organization.
In addition to the ve menu selection softkeys and two common softkeys HELP and quit , the
following three softkeys are present in the Main Menu.
NNNNNNNNNNNNNN
NNNNNNNNNNNNNNNNNNNNNNNNNNNNNNNN
QUICK TEST
NNNNNNNNNNNNNNNNNNNNNNN
REPRINT
runs Limited Cal, a subset of the system performance tests. In this mode,
some tests are omitted, others are modied, still others are unmodied. Quick
Test does not provide a full calibration routine. The test descriptions in the
system software package and System Add-On package include test mode
information.
initiates the reprinting of test data from disk to a selected printer. Test
results are stored on disk if the Parameter Menu was set up appropriately.
Note that the program erases test results stored on disk the rst time it enters
the Test Menu. Therefore, if a printed copy of the results of the previously
run test is desired, it must be printed before pressing test menu .
If test results exceed available disk space, only the results that were stored
on disk may be reprinted. In most cases, the test results of a Limited Cal
test will t on disk, however, the results of an All Tests will not. If you want
to have the results of an All Tests sequence printed, select printer for the
Parameter Menu selection Results sent to: and the test results will be
printed during the test.
If no printer is present on the HP-IB, the program omits this softkey. Refer to
\Parameter Menu" for more information.
is used to recongure the program and retest a system, or to test a dierent
system. Pressing this softkey aects the Status column of the Test Menu
command screen, and the RF section selected in the HP-MSIB Address Menu
command screen. Pressing RESTART also forces the software to reload the
Equipment Menu and Parameter Menu les from the Operating Disk.
NNNNNNNNNNNNNNNNNNNNNNNNNNNNN
NNNNNNNNNNNNNNNNNNNNNNN
RESTART
NNNNNNNNNNNNNNNNNNNNNNN
3-4
Menus
NNNNNNNNNNNNNN
Mass Storage Menu
The Mass Storage Menu has both an edit screen and a command screen. The edit screen
displays a list of mass storage information and allows you to assign the areas where the
program stores system and operation data. This is done by assigning volume labels to a mass
storage unit specier (msus). An msus is a string expression that points to a mass storage
location. The command screen allows you to save the mass storage information after it is
entered. Refer to \Mass Storage Menu Volume Labels" and \Editing Mass Storage Menu
Information" below. Figure 3-2 illustrates the Mass Storage Menu softkey organization.
Mass Storage Menu Volume Labels
The BASIC operating system can use a number of mass storage devices. These include
internal disk drives, external disk drives, and SRM systems. A mass storage Volume is
composed of one or more les. Files are data items or subprograms. A Volume might consist
entirely of les on a oppy disk, or some number of les on a small portion of a hard disk.
The Mass Storage Menu lists volume labels, which show the location of certain types of
program information. Volume labels each have a default msus. From the Mass Storage Menu,
you can reassign the current msus or directory path designation to another designation. You
cannot edit volume labels, but you may edit their msus designations and directory path data
elds.
The volume labels are explained below.
contains the Executive Disk 3 program code. There must be an msus assigned
SYSTEM
to this volume label.
is where the test results (including header and summary information) are
DATA
temporarily stored.
is where unanticipated errors are recorded for possible future use.
ERROR LOG
is where all the program data, including menu conguration les and
OPERATING
calibration data, is stored.
DRIVER DISK contains the driver instrument control program code. There must be an msus
assigned to this volume label. (There may be more than one DRIVER DISK
Volume.)
TEST DISK
contains the system performance tests programs. (There may be more than
one TEST DISK Volume.)
is where temporary instrument-calibration les are kept. (This is usually
TEMP
initialized as a RAM disk.)
Menus
3-5
Editing Mass Storage Menu Information
Use the following procedure to edit Mass Storage Menu information:
1. Use either the keyboard arrow keys or the RPG knob to position the cursor next to the
msus or directory path you wish to edit. The annotations <=more and more=> indicate that
you must scroll the screen left or right to view o-screen column items.
2. Press SELECT . Key in the new location (msus or Directory Path), then press 4
5.
NNNNNNNNNNNNNNNNNNNN
ENTER
Unless you are using an SRM system or HP BASIC 5.0 (or later version),
which uses directory path hierarchy, leave the Directory Path eld blank.
Note
3. Repeat steps 1 and 2 until you have nished editing, then press DONE .
4. Press STORE to save the edited data. Saving Mass Storage Menu data for the rst time
causes an error message prompting you to create a le. Do this simply by pressing
CREATE .
5. Press main menu to return to the Main Menu screen, or press EDIT to continue editing
Mass Storage Menu information.
NNNNNNNNNNNNNN
NNNNNNNNNNNNNNNNN
NNNNNNNNNNNNNNNNNNNN
NNNNNNNNNNNNNNNNNNNNNNNNNNNNN
3-6
Menus
NNNNNNNNNNNNNN
Parameter Menu
The Parameter Menu has both an edit and a command screen. The edit screen displays a
list of parameter items and allows you to determine some of the operating conditions of the
software program.
Use SELECT/TOGGLE to select the parameter item and enter data, or to toggle to a predened
state. After you have nished editing the Parameter Menu items, press DONE to display
the command screen. Then press STORE to save any edited Parameter Menu data, EDIT to
return to the edit screen, or main menu to return to the Main Menu screen.
Figure 3-2 illustrates the Parameter Menu softkey organization.
NNNNNNNNNNNNNNNNNNNNNNNNNNNNNNNNNNNNNNNNN
NNNNNNNNNNNNNN
NNNNNNNNNNNNNNNNN
NNNNNNNNNNNNNN
NNNNNNNNNNNNNNNNNNNNNNNNNNNNN
Note
Saving Parameter Menu data for the rst time causes an error message. The
message prompts you to create a le. Do this by pressing CREATE .
NNNNNNNNNNNNNNNNNNNN
The parameter items and their appropriate selections are dened below.
Results sent to:
Your choices are Screen, Printer, or None. Press SELECT/TOGGLE .
When Screen is displayed, test results appear on the CRT. When
Printer is displayed, test results are displayed on-screen and
printed out. When None is displayed, simple pass/fail indications
are listed next to the test name in the Test Menu.
Your choices are Graph, Table, or Short Table. Press
Output format:
SELECT/TOGGLE . When Graph is displayed, test results are
generated in a graph format if appropriate for the particular test
results (a graphics printer is required if Printer and Graph are both
selected). When Table is displayed, test results are output in a
table format. When Short Table is displayed, test results are also
output in a table format; however, less critical data points may be
eliminated to limit the table length.
Save for reprinting: Your choices are Yes or No. Press SELECT/TOGGLE . If Yes is
displayed, test results are saved on disk for later reprinting using the
REPRINT softkey in the Main Menu. If No is displayed, test results
are not saved.
Lines allowed are from 50 to 70. Press SELECT/TOGGLE . Type a
Printer lines:
number from 50 to 70 to set the number of lines per printed page,
then press 4
5.
Begin each test on a Your choices are Yes or No. Press SELECT/TOGGLE . If Yes is
new page:
displayed, the printer form-feeds after each test. If No is displayed,
there is no form-feed between tests.
Line frequency:
Valid frequency selections are 50, 60, and 400 Hz. Press
SELECT/TOGGLE until the power line frequency for your system is
displayed. The line frequency value aects some test results.
NNNNNNNNNNNNNNNNNNNNNNNNNNNNNNNNNNNNNNNNN
NNNNNNNNNNNNNNNNNNNNNNNNNNNNNNNNNNNNNNNNN
NNNNNNNNNNNNNNNNNNNNNNNNNNNNNNNNNNNNNNNNN
NNNNNNNNNNNNNNNNNNNNNNN
NNNNNNNNNNNNNNNNNNNNNNNNNNNNNNNNNNNNNNNNN
ENTER
NNNNNNNNNNNNNNNNNNNNNNNNNNNNNNNNNNNNNNNNN
NNNNNNNNNNNNNNNNNNNNNNNNNNNNNNNNNNNNNNNNN
Menus
3-7
Ambient temperature:
Valid Celsius temperature entries are 0 to 55. Press
SELECT/TOGGLE . Type a number from 0 to 55, then press 4
5,
This provides the program with the test environment temperature
in Celsius, allowing the test limits to reect temperature-drift
guard-bands, if necessary.
Valid entries for ambient humidity are 0% to 105%. Press
SELECT/TOGGLE . Type a number from 0 to 105, then press 4
5.
Press SELECT/TOGGLE . Type a number representing the number of
months since the last ETE calibration, then press 4
5. This
information is used by some of the uncertainty calculations. The
number of months will appear at the top of the results output.
Your choices are Yes or No. Press SELECT/TOGGLE . When Yes is
displayed, the warning and time-lapse reminder beeps are activated.
When No is displayed, the program's beep feature is disabled.
Your choices are Yes or No. Press SELECT/TOGGLE to indicate
your choice. Yes causes the program to verify the presence of an
instrument on HP-IB at the address shown in the Equipment Menu.
Select No to bypass this feature.
Press SELECT/TOGGLE , type the customer's name or ID number,
then press 4
5. This allows the name or ID number to be
included on the output report. There is a 30 character limit.
Press SELECT/TOGGLE , type the repair number, then press 4
5.
This allows the repair number to be included on the output report.
There is a 30 character limit.
Press SELECT/TOGGLE , type your name or ID number, then press
4
5. This allows your name or ID number to be included on the
output report. There is a 30 character limit.
Lets you include a printed message with the test results. Depending
on the program, you can enter up to 30 lines, with no more than 30
characters per line. (Select User Line: to enter the message you
wish to have printed in this screen.)
1. Position the cursor to the left-hand side of a User Line in the
menu. Press SELECT/TOGGLE .
2. The prompt, Enter additional information, appears. Type in
your message (up to 30 characters per line), then press 4
5.
3. After you have entered your message, reposition the cursor at
Number lines added:. Enter the number of user lines your
message occupies, then press 4
5.
NNNNNNNNNNNNNNNNNNNNNNNNNNNNNNNNNNNNNNNNN
ENTER
Ambient humidity:
NNNNNNNNNNNNNNNNNNNNNNNNNNNNNNNNNNNNNNNNN
ENTER
Equip. cal period:
NNNNNNNNNNNNNNNNNNNNNNNNNNNNNNNNNNNNNNNNN
ENTER
Beeper to be
activated:
Verify equipment on
HP-IB:
Customer:
NNNNNNNNNNNNNNNNNNNNNNNNNNNNNNNNNNNNNNNNN
NNNNNNNNNNNNNNNNNNNNNNNNNNNNNNNNNNNNNNNNN
NNNNNNNNNNNNNNNNNNNNNNNNNNNNNNNNNNNNNNNNN
ENTER
Repair number:
Test person's ID:
NNNNNNNNNNNNNNNNNNNNNNNNNNNNNNNNNNNNNNNNN
ENTER
NNNNNNNNNNNNNNNNNNNNNNNNNNNNNNNNNNNNNNNNN
ENTER
Number lines added:
User Lines:
NNNNNNNNNNNNNNNNNNNNNNNNNNNNNNNNNNNNNNNNN
ENTER
ENTER
3-8
Menus
Equipment Menu
The Equipment Menu has both an edit screen and a command screen. The edit screen
displays a list of all the equipment required to test your device under test (DUT) completely,
and allows you to enter device model numbers, addresses, serial numbers, and information
about the availability of passive devices. \Equipment Menu Edit Screen," below, gives
more information about entering test equipment data. After you have nished editing the
Equipment Menu, press DONE to enter the command screen. Press STORE in the command
screen to save the edited data.
Saving Equipment Menu data for the rst time generates an error message
prompting you to create a le. Do this simply by pressing CREATE .
NNNNNNNNNNNNNN
NNNNNNNNNNNNNNNNN
Note
NNNNNNNNNNNNNNNNNNNN
The command screen also provides a softkey, edit cal data , that provides access to a
calibration-data screen. This calibration-data screen lists those passive devices that are
labeled Available and require calibration data. Refer to \Equipment Menu Command
Screen" and \Editing Calibration Data" below for more information. Figure 3-3 illustrates the
Equipment Menu softkey organization.
NNNNNNNNNNNNNNNNNNNNNNNNNNNNNNNNNNNNNNNNN
Note
An appendix in the system software package manual lists all required test
equipment. Using the preferred test equipment (identied by *) ensures the
most complete testing capability. Using the models listed as \acceptable"
may aect measurement uncertainty. Individual test descriptions provide an
equipment list and the test setup for that particular test.
Equipment Menu Edit Screen
From the Equipment Menu edit screen you can enter data about your test equipment. Next to
each DEVICE TYPE in the equipment list there are columns labeled DEVICE MODEL for the model
number, ADDRESS for the HP-IB address, and SERIAL or ID NO. (for example, calibration lab
number). You may use either the cursor arrow keys or the RPG knob to position the cursor
at the column item you wish to edit. Use the following information to edit information in the
dierent columns. You cannot edit the DEVICE TYPE column.
DEVICE MODEL
Locate the cursor beside the model number you wish to edit. Press
SELECT , type the model number, then press 4
5.
NNNNNNNNNNNNNNNNNNNN
ENTER
ADDRESS
Locate the cursor beside the address you want to edit. Press SELECT ,
edit the address, then press 4
5.
If a device does not have an address listed in the address column,
Missing ETE is included in the Status column next to the tests that
required the device. Tests tagged with Missing ETE are not performed.
NNNNNNNNNNNNNNNNNNNN
ENTER
Menus
3-9
Active devices should be given a three-digit HP-IB address. The
three-digit address includes the HP-IB select code and the actual HP-IB
address. For example, an HP 70000 Modular Spectrum Analyzer HP-IB
select code of 8 and an HP-IB address of 18 yields an address of 818.
Valid addresses for active devices are listed below:
700 to 730 and 800 to 830 for an HP 70000 Modular Spectrum
Analyzer master module. (The addresses of DUTs that function as
slaves should match their master's address.)
700 to 730 for any other device type.
Passive devices (nonprogrammable devices such as sensors, directional
bridges, and detectors) should be addressed as either Available or Not
Available. When certain passive devices are addressed as Available,
you will also be required to enter a serial number and calibration data
for the device. To enter calibration data, press edit cal data to
access the Calibration Data edit screen. (The calibration data for a
passive device is stored on Operating Disk.) If a passive device has Not
Available in the address column, any tests that require that passive
device will not be performed. Missing ETE will be printed next to the
test names on the test results for any procedures that require a device
listed as Not Available.
Locate the cursor beside the serial or ID number that you want to edit.
Press SELECT , enter the new serial or ID number (10 digits or less),
then press 4
5. Some passive devices that have Available displayed
in the address column must also have a serial- or ID-number entry.
NNNNNNNNNNNNNNNNNNNNNNNNNNNNNNNNNNNNNNNNN
SERIAL OR ID NO.
NNNNNNNNNNNNNNNNNNNN
ENTER
Equipment Menu Command Screen
In addition to the common softkeys EDIT , STORE , main menu , HELP , and quit , this
command screen displays the following additional softkeys:
displays the Select Passive Device screen. From this screen, move the
edit cal data
cursor to the passive device that needs its calibration data edited. Press
SELECT , then enter the required data. Refer to \Editing Calibration
Data" below for more information.
NO ADDRESS
appears only if the program cannot nd an instrument at a specied
HP-IB address. Either press NO ADDRESS to delete all faulty
addresses from the edit menu, or use the steps below to nd out which
instruments are not responding and correct their addresses.
1. Press EDIT to access the Equipment Menu edit screen.
2. Scroll the ADDRESS column for ashing addresses, then be sure that
the instrument is on.
3. SELECT the ashing address, correct it, and then press DONE .
If you do not want correct all of the incorrect addresses, press DONE
to return to the Equipment Menu command screen, then press
NO ADDRESS to delete the remaining faulty addresses.
NNNNNNNNNNNNNN
NNNNNNNNNNNNNNNNN
NNNNNNNNNNNNNNNNNNNNNNNNNNNNN
NNNNNNNNNNNNNN
NNNNNNNNNNNNNN
NNNNNNNNNNNNNNNNNNNNNNNNNNNNNNNNNNNNNNNNN
NNNNNNNNNNNNNNNNNNNN
NNNNNNNNNNNNNNNNNNNNNNNNNNNNNNNN
NNNNNNNNNNNNNNNNNNNNNNNNNNNNNNNN
NNNNNNNNNNNNNN
NNNNNNNNNNNNNNNNNNNN
NNNNNNNNNNNNNN
NNNNNNNNNNNNNN
NNNNNNNNNNNNNNNNNNNNNNNNNNNNNNNN
3-10
Menus
Note
If the Verify equipment on HP-IB: feature is selected in the Parameter
Menu, when you exit the Equipment Menu or enter the Test Menu the
program will search the addresses in the Equipment Menu for instruments
assigned to HP-IB.
Editing Calibration Data
The program requires calibration data for some of the passive devices listed in the Equipment
Menu edit screen. The Select Passive Device screen of the Equipment Menu displays all
passive devices that need calibration data entered. To reach the Select Passive Device screen,
press edit cal data in the Equipment Menu.
NNNNNNNNNNNNNNNNNNNNNNNNNNNNNNNNNNNNNNNNN
Note
If you are in the Select Passive Device screen and select a passive device
that needs a serial number entered, you will be prompted to return to the
Equipment Menu and enter the number. If you have formerly entered
calibration data for a passive device of a given serial number and you would
rather not reenter the data, replace your current Operating Disk with one
containing data for passive devices from previous testing. Press REPEAT
to access the calibration data from that disk. If you only need to enter the
passive device's calibration data, press CREATE , then use the procedure given
later in this section to enter the appropriate information.
NNNNNNNNNNNNNNNNNNNN
NNNNNNNNNNNNNNNNNNNN
If you edit the factory default frequency or calibration factor values, you must enter valid
calibration factors for each frequency edited. For power sensors, you must enter a frequency
and calibration factor for 300 MHz even if the device has no factor listed at 300 MHz. Not all
frequencies are listed on the screen at once. Be sure to enter calibration data for frequencies
listed on all pages of the display.
Enter the values from the valid calibration factors given below. Other frequencies outside the
normal range of the device may also be required. Prior to using your device, you may need to
calibrate it at these frequencies to ensure accurate measurement results.
Passive Device
Mixers
Directional Couplers
Sensors
Valid Calibration Factors
16 to 24 dB
8 to 11 dB
0.3 to 1.6 (stored as a percentage by the program)
Use the procedure below to edit calibration data:
1. While in the Equipment Menu command screen, press
Passive Device screen.
NNNNNNNNNNNNNNNNNNNNNNNNNNNNNNNNNNNNNNNNN
edit cal data
to access the Select
Menus
3-11
2. Locate the cursor beside the device and press SELECT .
a. To change a frequency or calibration factor, move the cursor next to the one you want
to change, enter the new value, then press 4
5. (It is not necessary to enter new
frequency values in numeric order; the program sorts them before storing them on the
Operating Disk.)
b. To delete a frequency or calibration factor, select the frequency or cal factor you want to
delete, then clear the line by typing spaces and pressing 4
5.
3. After you have deleted or entered the necessary data, press DONE to return to the Select
Passive Device screen. If you do not want to edit any more data, press DONE to return to
the Equipment Menu command screen. Press main menu to continue with the program.
NNNNNNNNNNNNNNNNNNNN
ENTER
ENTER
NNNNNNNNNNNNNN
NNNNNNNNNNNNNN
NNNNNNNNNNNNNNNNNNNNNNNNNNNNN
HP-MSIB Address Menu
The HP-MSIB Address Menu lists the model numbers and HP-MSIB addresses of the modules
in the HP 70000 Modular Spectrum Analyzer that you may wish to test. The HP-MSIB
address of the master and the system are the same. In other words, the address of the master
module determines the address of the system.
Figure 3-3 illustrates the HP-MSIB Address Map Menu softkey organization. There is no edit
screen for this menu. The command screen may have the following additional softkey.
NNNNNNNNNNNNNNNNNNNNNNNNNNNNNNNNNNNNNNNNN
SELECT MODULE
appears when there is more than one system input (RF section module)
available to test. Locate the cursor next to the RF section module that
you wish to test. Press SELECT MODULE .
NNNNNNNNNNNNNNNNNNNNNNNNNNNNNNNNNNNNNNNNN
3-12
Menus
Test Menu
The Test Menu does not have an edit screen. The command screen allows you to select and
run system performance tests. Refer to the system software package and system add-on
package manuals for information about the specic tests for your system.
If Missing ETE is listed next to a test, additional test equipment is required to perform that
test. To review which additional test equipment is required, locate the cursor beside the test
name, then press SINGLE TEST . The Missing ETE screen displays the missing test equipment
for that test.
Missing calibration data for a passive device causes display of an error screen informing you
that no le exists for the device serial number. If the correct Operating Disk is in the default
drive, press CREATE to build the data le. The Test Menu reappears after calibration data
has been entered for all passive devices that require it. Refer to \Editing Calibration Data"
under \Equipment Menu" in the previous pages for more information.
NNNNNNNNNNNNNNNNNNNNNNNNNNNNNNNNNNN
NNNNNNNNNNNNNNNNNNNN
Pressing either RESTART or equipment menu any time after testing begins
purges Test Menu Status column information. Selecting a new RF section
module to test in the HP-MSIB Address Menu also deletes the Status column
data. The assumption is that test status will most likely be modied if you
are moving between RF section modules, or ETE model numbers.
NNNNNNNNNNNNNNNNNNNNNNN
Caution
NNNNNNNNNNNNNNNNNNNNNNNNNNNNNNNNNNNNNNNNNNNN
Figure 3-4 illustrates the Test Menu softkey organization. The Test Menu command screen is
dierent from the command screen formats previously described. The softkeys available in this
menu are described below.
begins a factory-dened sequence of the Limited Cal mode tests. During
LIMITED CAL
the test sequence, the softkeys listed below are also available.
interrupts the test sequence at the end of the test in
END SEQUENCE
progress. The Test Menu is displayed with an additional
softkey labeled RESUME TESTING . Press this softkey to
resume the test sequence where the program left o.
ends the testing process and displays the Test Menu.
ABORT
From there you may choose some other action.
begins a factory-dened sequence that includes all of the tests displayed in
ALL TESTS
the Test Menu. During the test sequence, the softkeys listed below are also
available.
END SEQUENCE interrupts the test sequence at the end of the test in
progress. The Test Menu is displayed with an additional
softkey labeled RESUME TESTING . Press this softkey to
resume the test sequence where the program left o.
ends the testing process and displays the Test Menu. From
ABORT
there you may choose some other action.
NNNNNNNNNNNNNNNNNNNNNNNNNNNNNNNNNNN
NNNNNNNNNNNNNNNNNNNNNNNNNNNNNNNNNNNNNN
NNNNNNNNNNNNNNNNNNNNNNNNNNNNNNNNNNNNNNNNNNNN
NNNNNNNNNNNNNNNNN
NNNNNNNNNNNNNNNNNNNNNNNNNNNNN
NNNNNNNNNNNNNNNNNNNNNNNNNNNNNNNNNNNNNN
NNNNNNNNNNNNNNNNNNNNNNNNNNNNNNNNNNNNNNNNNNNN
NNNNNNNNNNNNNNNNN
Menus
3-13
NNNNNNNNNNNNNNNNNNNNNNNNNNNNNNNNNNN
REPEAT TEST
runs the selected test and repeats it until you press END SEQUENCE . During
the test sequence, the softkeys listed below are also available.
END SEQUENCE interrupts the test sequence at the end of the test in
progress. The Test Menu is displayed with an additional
softkey labeled RESUME TESTING . Press this softkey to
resume the test sequence where the program left o.
ends the testing process and displays the Test Menu. From
ABORT
there you may choose some other action.
allows you to continue the test sequence after you have pressed either
LIMITED CAL or ALL TESTS , and then pressed END SEQUENCE or ABORT .
lets you select an individual test to run. If Missing ETE is listed in the
Status column, you can review which test equipment is missing. Locate the
cursor beside that test name, then press SINGLE TEST . The Missing ETE
screen is displayed. If you choose to return to the Test Equipment Menu
via the Test Menu to install the missing test equipment, you lose the status
of any tests that have run. To run a single test that has the necessary ETE,
locate the cursor beside the test name and press SINGLE TEST .
allows you to organize a group of tests sequentially. Locate the cursor
beside the test you want to run. Press SELECT to assign the rst number
of the series to that test. Continue to locate the cursor and press SELECT
until you have organized the tests you want to run in the order that you
want to run them. Press END LIST when you are ready to begin testing.
During testing, the following softkeys are also available.
END SEQUENCE interrupts the test sequence at the end of the test in
progress, then displays the Test Menu.
ends the testing process and displays the Test Menu. From
ABORT
there you may choose some other action.
allows you to select a test sequence (you determine the quantity and order).
The tests loop through this sequence until you decide to stop them. Locate
the cursor beside the test you want to run, press SELECT , move the cursor
to the next test, press SELECT , etc. Continue selecting tests until you are
ready to begin testing. It is acceptable to select the same test for repeated
testing. Press END LIST to start the test sequence. During testing, the
following softkeys are also available.
END SEQUENCE interrupts the test sequence at the end of the test in
progress, then displays the Test Menu.
ends the testing process and displays the Test Menu. From
ABORT
there you may choose some other action.
NNNNNNNNNNNNNNNNNNNNNNNNNNNNNNNNNNNNNN
NNNNNNNNNNNNNNNNNNNNNNNNNNNNNNNNNNNNNN
NNNNNNNNNNNNNNNNNNNNNNNNNNNNNNNNNNNNNNNNNNNN
NNNNNNNNNNNNNNNNN
NNNNNNNNNNNNNNNNNNNNNNNNNNNNNNNNNNNNNNNNNNNN
RESUME TESTING
NNNNNNNNNNNNNNNNNNNNNNNNNNNNNNNNNNN
SINGLE TEST
NNNNNNNNNNNNNNNNNNNNNNNNNNNNNNNNNNN
NNNNNNNNNNNNNNNNNNNNNNNNNNNNN
NNNNNNNNNNNNNNNNNNNNNNNNNNNNNNNNNNNNNN
NNNNNNNNNNNNNNNNN
NNNNNNNNNNNNNNNNNNNNNNNNNNNNNNNNNNN
NNNNNNNNNNNNNNNNNNNNNNNNNNNNNNNNNNN
NNNNNNNNNNNNNNNNNNNNNNNNNNNNNNNNNNNNNNNNNNNN
multiple tests
NNNNNNNNNNNNNNNNNNNN
NNNNNNNNNNNNNNNNNNNN
NNNNNNNNNNNNNNNNNNNNNNNNNN
NNNNNNNNNNNNNNNNNNNNNNNNNNNNNNNNNNNNNN
NNNNNNNNNNNNNNNNN
NNNNNNNNNNNNNNNNNNNNNNNNNNNNNNNNNNNNNN
repeat mult.
NNNNNNNNNNNNNNNNNNNN
NNNNNNNNNNNNNNNNNNNN
NNNNNNNNNNNNNNNNNNNNNNNNNN
NNNNNNNNNNNNNNNNNNNNNNNNNNNNNNNNNNNNNN
NNNNNNNNNNNNNNNNN
3-14
Menus
NNNNNNNNNNNNNNNNNNNNNNNNNNNNN
more keys
toggles between SUMMARY , select output , and PURGE DISK and the
previously explained Test Menu command screen softkeys.
gives you a printout of the current test(s) run.
SUMMARY
select output chooses an output device. You can print test results by
pressing PRINTER , or you can print the current display by
pressing SCREEN . Press RETURN to return to the previous
set of softkeys in the Test Menu command screen.
allows you to delete any stored data for the spectrum
PURGE DISK
analyzer system under test. Press YES to delete the stored
data. Press NO to return to the Test Menu command
screen.
NNNNNNNNNNNNNNNNNNNNNNN
NNNNNNNNNNNNNNNNNNNNNNNNNNNNNNNNNNNNNNNNN
NNNNNNNNNNNNNNNNNNNNNNNNNNNNNNNN
NNNNNNNNNNNNNNNNNNNNNNN
NNNNNNNNNNNNNNNNNNNNNNNNNNNNNNNNNNNNNNNNN
NNNNNNNNNNNNNNNNNNNNNNN
NNNNNNNNNNNNNNNNNNNN
NNNNNNNNNNNNNNNNNNNN
NNNNNNNNNNNNNNNNNNNNNNNNNNNNNNNN
NNNNNNNNNNN
NNNNNNNN
Menus
3-15
Figure 3-1. Main Menu Softkeys
3-16
Menus
Figure 3-2. Mass Storage Menu and Parameter Menu Softkeys
Menus
3-17
Figure 3-3. Equipment Menu and HP-MSIB Address Menu Softkeys
3-18
Menus
Figure 3-4. Test Menu Softkeys
Menus
3-19
4
HP 11990A Option 033 System Add-On Package
Introduction
The HP 11990A Option 033 System Add-On package is used, along with a system software
package, to test a tracking generator that is congured with an HP 71100A/C, HP 71200A/C,
HP 71201A, HP 71209A/C, or HP 71210A/C spectrum analyzer. This System Add-On
package consists of this manual and one test disk (Test Disk 3).
The HP 11990A Option 001 user-interface program and a system software package are
required to run the tests in this System Add-On package. This manual includes only test
descriptions; information about the test equipment required for these tests is included in the
system software package manual. Refer to the HP 11990A Option 001 User Interface Manual
for instructions to run the test software.
Option 033 Tests
TG Absolute Amplitude Accuracy (HP 70300A) : : : : : : : : : : : : : : : : : : : : : : : : : : : : : : : 4-3
TG Vernier Accuracy (HP 70300A) : : : : : : : : : : : : : : : : : : : : : : : : : : : : : : : : : : : : : : : : : : : : 4-4
TG Frequency Response (HP 70300A) : : : : : : : : : : : : : : : : : : : : : : : : : : : : : : : : : : : : : : : : : 4-5
TG Feedthru (HP 70300A) : : : : : : : : : : : : : : : : : : : : : : : : : : : : : : : : : : : : : : : : : : : : : : : : : : : : 4-6
TG Harmonics (HP 70300A) : : : : : : : : : : : : : : : : : : : : : : : : : : : : : : : : : : : : : : : : : : : : : : : : : : : 4-8
TG Frequency Accuracy (HP 70300A) : : : : : : : : : : : : : : : : : : : : : : : : : : : : : : : : : : : : : : : : 4-10
TG Absolute Amplitude Accuracy (HP 70301A) : : : : : : : : : : : : : : : : : : : : : : : : : : : : : : 4-11
TG Vernier Accuracy (HP 70301A) : : : : : : : : : : : : : : : : : : : : : : : : : : : : : : : : : : : : : : : : : : : 4-12
TG Frequency Response (HP 70301A) : : : : : : : : : : : : : : : : : : : : : : : : : : : : : : : : : : : : : : : : 4-13
TG Feedthru (HP 70301A) : : : : : : : : : : : : : : : : : : : : : : : : : : : : : : : : : : : : : : : : : : : : : : : : : : : 4-14
TG Harmonics (HP 70301A) : : : : : : : : : : : : : : : : : : : : : : : : : : : : : : : : : : : : : : : : : : : : : : : : : 4-16
TG Low Band Input Insertion Loss (HP 70301A) : : : : : : : : : : : : : : : : : : : : : : : : : : : : : 4-18
TG Frequency Accuracy (HP 70301A) : : : : : : : : : : : : : : : : : : : : : : : : : : : : : : : : : : : : : : : : 4-19
TG RF O Residuals (HP 70301A) : : : : : : : : : : : : : : : : : : : : : : : : : : : : : : : : : : : : : : : : : : : 4-20
TG Spurious Outputs (HP 70301A) : : : : : : : : : : : : : : : : : : : : : : : : : : : : : : : : : : : : : : : : : : : 4-22
Test Descriptions
This manual lists and describes all of the tests in this System Add-On package. Pressing the
softkey ALL TESTS invokes the execution of these tests along with the tests listed in the
system software package. The tests are run in an ecient sequence determined by the software
authors.
The following list explains the information found in this manual under the test names:
\Tested Specication" is the name of the specication as found in the \Specications"
chapter of the tracking generator Installation and Verication manual.
\Equipment" lists all external test equipment required by the particular test. Accessories
are not listed. The test will not run if required test equipment is missing.
NNNNNNNNNNNNNNNNNNNNNNNNNNNNN
HP 11990A Option 033 System Add-On Package
4-1
\Equipment Setup" describes equipment interconnections. A setup screen on the computer
display will also provide instruction. This screen does not appear if the current setup is
complete and correct. The screen presents ABORT and PROCEED softkeys. Pressing ABORT
will display the Test Menu. If the setup is wrong, pressing PROCEED three times will abort
the test and then display the Test Menu.
\Description" provides a brief description of the test.
\Uncertainties" tells what characteristics contribute to measurement uncertainties.
\Test Mode" tells whether the particular test runs in Limited Cal mode and what, if any,
parameter is modied. Mode selection is a Test Menu function. There are six major modes:
Single, Repeat, Multiple, Repeat Multiple, All Tests, and Limited Cal. In any mode other
than Limited Cal, the tests run in their entirety. The following section lists the tests
included in Limited Cal.
\In Case of Failure" tells which modules may need repair or adjustment if the test fails.
NNNNNNNNNNNNNNNNN
NNNNNNNNNNNNNNNNNNNNNNN
NNNNNNNNNNNNNNNNN
NNNNNNNNNNNNNNNNNNNNNNN
Limited Cal Tests
The Limited Cal tests are executed in an ecient sequence dened by the software authors.
The Limited Cal tests are listed below in the order that they appear in this manual, not in
the order of execution. These tests, along with any Limited Cal tests in the system software
package, are executed when you press LIMITED CAL in the Test Menu or QUICK TEST in the
Main Menu.
NNNNNNNNNNNNNNNNNNNNNNNNNNNNNNNNNNN
TG Absolute Amplitude Accuracy (HP 70300A)
TG Vernier Accuracy (HP 70300A)
TG Frequency Response (HP 70300A)
TG Feedthru (HP 70300A)
TG Absolute Amplitude Accuracy (HP 70301A)
TG Vernier Accuracy (HP 70301A)
TG Frequency Response (HP 70301A)
TG Feedthru (HP 70301A)
4-2
HP 11990A Option 033 System Add-On Package
NNNNNNNNNNNNNNNNNNNNNNNNNNNNNNNN
TG Absolute Amplitude Accuracy (HP 70300A)
TG Absolute Amplitude Accuracy (HP 70300A)
Tested Specification
ABSOLUTE AMPLITUDE ACCURACY
(using the normal and alternate detectors)
Equipment
Power meter
RF power sensor
Equipment Setup
With the RF power-sensor output connected to the power meter, connect the input of the RF
power sensor to the RF OUTPUT of the tracking generator.
Description
This test measures the RF OUTPUT amplitude accuracy of the tracking generator. The
tracking generator is set to 010 dBm at 300 MHz and the RF OUTPUT is measured for
amplitude accuracy with the normal detector enabled. The RF OUTPUT is again measured
for amplitude accuracy at 010 dBm at 1 MHz, with the alternate detector enabled. Both
frequency measurements are made with a single sweep in zero span.
Uncertainties
The following characteristics contribute to uncertainties:
Power meter accuracy
Mismatch between RF power sensor and tracking generator RF OUTPUT connector
Tracking generator RF output harmonic distortion
Test Mode
This test is run in Limited Cal mode.
In Case of Failure
If this test fails, the following modules may need repair or adjustment:
Tracking generator
HP 11990A Option 033 System Add-On Package
4-3
TG Vernier Accuracy (HP 70300A)
Tested Specification
AMPLITUDE ACCURACY: Vernier Accuracy
Equipment
Power meter
RF power sensor
Equipment Setup
With the RF power-sensor output connected to the power meter, connect the input of the RF
power sensor to the RF OUTPUT of the tracking generator.
Description
This test measures the incremental RF output amplitude accuracy of the tracking generator
over 021 dBm to 010 dBm, the range of the automatic level control (ALC).
The tracking generator frequency is set to 300 MHz, the ALC normal detector is selected, and
the tracking generator's attenuator (if present) is set to 0 dB. The tracking generator output
power is set to 010 dBm, and a reference reading is taken with the power meter. The output
power is then stepped in 1 dB increments over the 021 dBm to 011 dBm range. The absolute
error between the programmed amplitude (what was expected) and the power meter reading
(what was measured) is stored. The dierences in the absolute errors are checked to see if
they meet incremental specications.
The above procedure is repeated at 1 MHz with the ALC alternate detector.
Uncertainties
The following characteristics contribute to uncertainties:
Power meter accuracy
Test Mode
This test is run in the Limited Cal mode.
In Case of Failure
If this test fails, the following modules may need repair or adjustment:
Tracking generator
4-4
HP 11990A Option 033 System Add-On Package
TG Frequency Response (HP 70300A)
TG Frequency Response (HP 70300A)
Tested Specification
AMPLITUDE FLATNESS
(using the normal and alternate detectors)
Equipment
Power meter
RF power sensor
Equipment Setup
With the RF power-sensor output connected to the power meter, connect the input of the RF
power sensor to the RF OUTPUT of the tracking generator.
Description
This test measures amplitude variation versus frequency of the tracking generator. The
frequency range using the tracking generator normal detector is from 10 MHz to 2.9 GHz. For
the alternate detector, the range tested is 100 kHz to 10 MHz.
A reference amplitude of 010 dBm is set at 300 MHz using the normal detector. The
amplitude over the frequency range of the normal detector is increased in 60 linear steps from
highest to lowest. Each step is measured for any deviation from the reference amplitude.
The same procedure is used to measure the amplitude deviation over the frequency range of
the alternate detector, with the 010 dBm reference set at 1 MHz.
Uncertainties
The following characteristics contribute to uncertainties:
Power meter accuracy
Mismatch between RF power sensor and tracking generator RF OUTPUT connector
Tracking generator RF output harmonic distortion
Test Mode
This test is run in Limited Cal mode.
In Case of Failure
If this test fails, the following modules may need repair or adjustment:
Tracking generator
HP 11990A Option 033 System Add-On Package
4-5
TG Feedthru (HP 70300A)
(using HP 70902A)
Tested Specification
Tracking Generator Feedthrough
Equipment
Power meter
RF power sensor
50 ohm termination (HP 909D only)
Note
The type of 50 termination used can greatly aect the feedthrough level.
BNC or Type N terminations have too much leakage, and should not be used.
The leakage of the HP 909D termination is low enough not to aect the
measurement.
Equipment Setup
Setup A: Connect the RF OUTPUT of the tracking generator to the RF INPUT of the
spectrum-analyzer system.
Setup B: With the RF power-sensor output connected to the power meter, connect the input
of the RF power sensor to the RF OUTPUT of the tracking generator. Connect the 50 ohm
termination to the RF INPUT of the spectrum analyzer.
Description
The equipment is connected using setup A. The spectrum analyzer system containing the
tracking generator is placed in Stimulus Response mode and set to the minimum IF resolution
bandwidth, 10 Hz. Source track peaking is then performed to make sure that the source
frequency is centered in the IF resolution bandwidth.
The equipment is connected using setup B. The tracking generator feedthrough level is then
measured in each band of the spectrum analyzer using the following procedure:
1. The tracking generator is set for an RF output of 010 dBm.
2. The spectrum analyzer is set as follows:
Reference level of 065 dBm (075 dBm when HP 70908A is RF section).
Resolution bandwidth of 10 Hz.
Attenuator setting of 0 dB.
Sample detection.
Stop and start frequencies are set for the band of interest.
3. A sweep is taken.
4. The tracking generator frequency is set to the frequency of the peak response, and a power
meter is used to set the output amplitude to 010 dBm 60.05 dB.
4-6
HP 11990A Option 033 System Add-On Package
TG Feedthru (HP 70300A)
5. The spectrum analyzer settings are changed as follows:
Span is set to 0 Hz.
Video bandwidth is set to 3 Hz.
Sweep time is set to a value which assures that the trace data elements are uncorrelated.
6. A sweep is taken.
The tracking generator feedthrough level is equal to the average of the trace elements. This
procedure is repeated for each band of the spectrum analyzer.
Uncertainties
The following characteristics contribute to uncertainties:
Power meter accuracy
Mismatch between RF power sensor and tracking generator RF OUTPUT connector
Spectrum analyzer marker resolution
Spectrum analyzer IF gain accuracy
Spectrum analyzer log delity
Spectrum analyzer calibration error
Spectrum analyzer RF attenuator switching
Test Mode
This test is run in Limited Cal mode.
In Case of Failure
If this test fails, the following modules may need repair or adjustment:
Tracking generator
RF section
Preselector
HP 11990A Option 033 System Add-On Package
4-7
TG Harmonics (HP 70300A)
Tested Specification
SPECTRAL PURITY: Harmonic Spurious
Equipment
Microwave source
Microwave spectrum analyzer
Power meter
Microwave power sensor
Power splitter
Equipment Setup
Setup A: Connect the microwave source output to the power splitter input. Connect the
microwave power-sensor output to the power meter. Connect the microwave power-sensor
input to one of the power splitter's outputs. Connect the RF OUTPUT of the microwave
spectrum analyzer through a low-loss cable to the remaining power-splitter output.
Setup B: Connect the RF OUTPUT of the microwave spectrum analyzer through a low-loss
cable to the RF OUTPUT of the device under test (DUT).
Description
If it has been longer than 7 days since the frequency response of the microwave spectrum
analyzer was characterized, setup A is used while the new calibration data is generated. The
calibration is made in 100 MHz increments over the frequency range of 10 MHz to 22 GHz*.
The setting of the microwave spectrum analyzer RF attenuator is stored along with the
calibration data.
Connect the equipment using setup B. The second through fth harmonic levels below
2.9 GHz are measured with respect to the maximum leveled output power of the DUT.
Measurements are made at nine fundamental frequencies over the 10 MHz to 2.9 GHz
range. The DUT is set to an RF output level of 010 dBm, and for zero span operation. The
microwave spectrum analyzer RF attenuator is set to the same value that was used during
calibration. Resolution bandwidth is set to 30 kHz and the frequency span is set to 1 MHz.
At each fundamental frequency, the amplitude of the fundamental is measured by the
microwave spectrum analyzer, and the amplitude is corrected using the atness calibration
data. The second through fth harmonic levels are then measured, corrected, and compared
to specications.
*Note:
4-8
The frequency range is dependent upon the frequency range of the test equipment.
HP 11990A Option 033 System Add-On Package
TG Harmonics (HP 70300A)
Uncertainties
The following characteristics contribute to uncertainties:
Power meter accuracy
Mismatch errors
Power splitter tracking
Microwave spectrum analyzer marker resolution
Microwave spectrum analyzer log delity
Test Mode
This test is not run in Limited Cal mode.
In Case of Failure
If this test fails, the following modules may need repair or adjustment:
Tracking generator
HP 11990A Option 033 System Add-On Package
4-9
TG Frequency Accuracy (HP 70300A)
Tested Specification
FREQUENCY ACCURACY
Equipment
Frequency counter
Equipment Setup
The RF OUTPUT of the tracking generator is connected to the high-frequency input of the
frequency counter.
Description
This test measures the frequency accuracy of the tracking generator when it is used as a
source. The tracking generator is set to a span of 0 Hz and an output of 010 dBm. The
frequency counter then measures the tracking generator frequency at 10 points, starting at
500 MHz and ending at 2900 MHz. The frequency error is then determined.
Uncertainties
The following characteristics contribute to uncertainties:
Frequency counter time-base accuracy
Test Mode
This test is not run in Limited Cal mode.
In Case of Failure
If this test fails, the following modules may need repair or adjustment:
Tracking generator
Local oscillator
4-10
HP 11990A Option 033 System Add-On Package
TG Absolute Amplitude Accuracy (HP 70301A)
TG Absolute Amplitude Accuracy (HP 70301A)
Tested Specification
AMPLITUDE ACCURACY: Absolute Accuracy
Equipment
Power meter
Microwave power sensor
Equipment Setup
With the microwave power-sensor output connected to the power meter, connect the input of
the microwave power sensor to the RF OUTPUT of the tracking generator.
Description
This test measures the absolute RF output amplitude accuracy of the tracking generator at its
maximum specied leveled output power. The tracking generator frequency is set at 2.7 GHz,
and the output amplitude is set to 02 dBm. Then the output power is measured.
Uncertainties
The following characteristics contribute to uncertainties:
Power meter accuracy
Mismatch between microwave power sensor and tracking generator RF OUTPUT connector
Test Mode
This test is run in the Limited Cal mode.
In Case of Failure
If this test fails, the following modules may need repair or adjustment:
Tracking generator
HP 11990A Option 033 System Add-On Package
4-11
TG Vernier Accuracy (HP 70301A)
Tested Specification
AMPLITUDE ACCURACY: Vernier Accuracy
Equipment
Power meter
Microwave power sensor
Equipment Setup
With the microwave power-sensor output connected to the power meter, connect the input of
the microwave power sensor to the RF OUTPUT of the tracking generator.
Description
This test measures the incremental RF output amplitude accuracy of the tracking generator
over 011 dBm to 0 dBm, the range of the automatic level control (ALC).
The tracking generator frequency is set to 2.7 GHz, and the tracking generator's attenuator
(if present) is set to 0 dB. The tracking generator output power is then set to 0 dBm, and a
reference reading is taken with the power meter. The output power is then stepped in 1 dB
increments over the 011 dBm to 01 dBm range. The absolute error between the programmed
amplitude (what was expected) and the power meter reading (what was measured) is
stored. The dierences in the absolute errors are checked to see if they meet incremental
specications.
Uncertainties
The following characteristics contribute to uncertainties:
Power meter accuracy
Test Mode
This test is run in the Limited Cal mode.
In Case of Failure
If this test fails, the following modules may need repair or adjustment:
Tracking generator
4-12
HP 11990A Option 033 System Add-On Package
TG Frequency Response (HP 70301A)
TG Frequency Response (HP 70301A)
Tested Specification
AMPLITUDE ACCURACY: Amplitude Flatness rel. to 2.7 GHz
Equipment
Power meter
Microwave power sensor
Equipment Setup
With the microwave power-sensor output connected to the power meter, connect the input of
the microwave power sensor to the RF OUTPUT of the tracking generator.
Description
This test measures the RF output amplitude variations of the tracking generator over its
complete frequency range.
The tracking generator is set to a frequency of 2.7 GHz, then a power meter is used to set
the tracking generator output amplitude to 02 dBm 60.15 dB. This establishes the reference
amplitude. The tracking generator is then incremented in frequency, the output power is
read by the power meter, and the variation from the reference amplitude is stored. Frequency
response is measured at a total of 201 points.
Uncertainties
The following characteristics contribute to uncertainties:
Power meter accuracy
Mismatch between microwave power sensor and tracking generator RF OUTPUT connector
Test Mode
This test is run in Limited Cal mode.
In Case of Failure
If this test fails, the following modules may need repair or adjustment:
Tracking generator
HP 11990A Option 033 System Add-On Package
4-13
TG Feedthru (HP 70301A)
(using HP 70902A)
Tested Specification
Tracking Generator Feedthrough
Equipment
Power meter
RF power sensor
50 ohm termination (HP 909D only)
The type of 50 termination used can greatly aect the feedthrough level.
BNC or Type N terminations have too much leakage, and should not be used.
The leakage of the HP 909D termination is low enough not to aect the
measurement.
Note
Equipment Setup
Setup A: Connect the RF OUTPUT of the tracking generator to the RF INPUT of the
spectrum-analyzer system.
Setup B: With the RF power-sensor output connected to the power meter, connect the input
of the RF power sensor to the RF OUTPUT of the tracking generator. Connect the 50 ohm
termination to the RF INPUT of the spectrum analyzer.
Description
The equipment is connected using setup A. The spectrum analyzer system containing the
tracking generator is placed in Stimulus Response mode and set to the minimum IF resolution
bandwidth, 10 Hz. Source track peaking is then performed to make sure that the source
frequency is centered in the IF resolution bandwidth.
The equipment is connected using setup B. The tracking generator feedthrough level is then
measured in each band of the spectrum analyzer using the following procedure:
1. The tracking generator is set for an RF output of 010 dBm.
2. The spectrum analyzer is set as follows:
Reference level of 065 dBm (075 dBm when HP 70908A is RF section).
Resolution bandwidth of 10 Hz.
Attenuator setting of 0 dB.
Sample detection.
Stop and start frequencies are set for the band of interest.
3. A sweep is taken.
4. The tracking generator frequency is set to the frequency of the peak response, and a power
meter is used to set the output amplitude to 010 dBm 60.05 dB.
4-14
HP 11990A Option 033 System Add-On Package
TG Feedthru (HP 70301A)
5. The spectrum analyzer settings are changed as follows:
Span is set to 0 Hz.
Video bandwidth is set to 3 Hz.
Sweep time is set to a value which assures that the trace data elements are uncorrelated.
6. A sweep is taken.
The tracking generator feedthrough level is equal to the average of the trace elements. This
procedure is repeated for each band of the spectrum analyzer.
Uncertainties
The following characteristics contribute to uncertainties:
Power meter accuracy
Mismatch between RF power sensor and tracking generator RF OUTPUT connector
Spectrum analyzer marker resolution
Spectrum analyzer IF gain accuracy
Spectrum analyzer log delity
Spectrum analyzer calibration error
Spectrum analyzer RF attenuator switching
Test Mode
This test is run in Limited Cal mode.
In Case of Failure
If this test fails, the following modules may need repair or adjustment:
Tracking generator
RF section
Preselector
HP 11990A Option 033 System Add-On Package
4-15
TG Harmonics (HP 70301A)
Tested Specification
SPECTRAL PURITY: Harmonic Spurious
Equipment
Microwave source
Microwave spectrum analyzer
Power meter
Microwave power sensor
Power splitter
Equipment Setup
Setup A: Connect the microwave-source output to the power-splitter input. Connect the
microwave power-sensor output to the power meter. Connect the microwave power-sensor
input to one of the power splitter's outputs. Connect the RF OUTPUT of the microwave
spectrum analyzer through a low-loss cable to the remaining power-splitter output.
Setup B: Connect the RF INPUT of the microwave spectrum analyzer through a low-loss
cable to the RF OUTPUT of the device under test (DUT).
Description
If it has been longer than 7 days since the frequency response of the microwave spectrum
analyzer was characterized, setup A is used while the new calibration data is generated. The
calibration is made in 100 MHz increments over the frequency range of 10 MHz to 22 GHz*.
The setting of the microwave spectrum analyzer RF attenuator is stored along with the
calibration data.
Connect the equipment using setup B. The second and third harmonic levels below 22 GHz
are measured with respect to the maximum leveled output power of the DUT. Measurements
are made at nine fundamental frequencies over the 2.7 GHz to 11 GHz range. The DUT is
set to an RF output level of 02 dBm, and for zero span operation. The microwave spectrum
analyzer RF attenuator is set to the same value that was used during calibration. Resolution
bandwidth is set to 30 kHz and the frequency span is set to 1 MHz.
At each fundamental frequency, the amplitude of the fundamental is measured by the
microwave spectrum analyzer, and the amplitude is corrected using the atness calibration
data. The second and third harmonic levels are then measured, corrected, and compared to
specications.
*Note:
4-16
The frequency range is dependent upon the frequency range of the test equipment.
HP 11990A Option 033 System Add-On Package
TG Harmonics (HP 70301A)
Uncertainties
The following characteristics contribute to uncertainties:
Power meter accuracy
Mismatch errors
Power splitter tracking
Microwave spectrum analyzer marker resolution
Microwave spectrum analyzer log delity
Test Mode
This test is not run in Limited Cal mode.
In Case of Failure
If this test fails, the following modules may need repair or adjustment:
Tracking generator
HP 11990A Option 033 System Add-On Package
4-17
TG Low Band Input Insertion Loss (HP 70301A)
Tested Specification
LOW BAND INPUT: Insertion Loss
Equipment
Microwave source
Power meter
Microwave power sensor
Equipment Setup
Setup A: Connect the microwave power-sensor output to the power meter. Connect the
microwave source to the microwave power-sensor input through a low-loss cable.
Setup B: Connect the microwave power-sensor output to the power meter. Connect the
microwave power-sensor input to the HP 70301A RF OUTPUT. Connect the microwave
source to the HP 70301A LOW BAND INPUT through the same low-loss cable that was used
in setup A.
Description
If it has been longer than 8 days since the output level of the microwave source was
characterized, setup A is used while new calibration data is generated.
The equipment is connected using setup B. After the setup is checked, measurements are
made at 21 frequencies over the LOW BAND INPUT range (10 MHz to 2900 MHz). The
microwave source amplitude is set to 05 dBm, and the power meter is used to measure the
insertion loss from the LOW BAND INPUT to the RF OUTPUT. The measured insertion loss
is corrected for the actual power available at the LOW BAND INPUT connector.
Uncertainties
The following characteristics contribute to uncertainties:
Power meter accuracy
Mismatch between microwave power sensor and microwave source
Mismatch between microwave power sensor and tracking generator RF OUTPUT connector
Mismatch between microwave source and tracking generator LOW BAND INPUT connector
Test Mode
This test is not run in Limited Cal mode.
In Case of Failure
If this test fails, the following modules may need repair or adjustment:
Tracking generator
4-18
HP 11990A Option 033 System Add-On Package
TG Frequency Accuracy (HP 70301A)
TG Frequency Accuracy (HP 70301A)
Tested Specification
FREQUENCY ACCURACY
Equipment
Frequency counter
Equipment Setup
The RF OUTPUT of the tracking generator is connected to the high-frequency input of the
frequency counter.
Description
This test measures the frequency accuracy of the tracking generator when it is used as
a source. The tracking generator is set to a span of 0 Hz and an output of 0 dBm. The
frequency counter then measures the tracking generator frequency at 10 points, starting at the
lowest frequency and going to the highest. The frequency error is then determined.
Uncertainties
The following characteristics contribute to uncertainties:
Frequency counter time-base accuracy
Test Mode
This test is not run in Limited Cal mode.
In Case of Failure
If this test fails, the following modules may need repair or adjustment:
Tracking generator
Local oscillator
HP 11990A Option 033 System Add-On Package
4-19
TG RF Off Residuals (HP 70301A)
Tested Specification
RESIDUALS (RF OFF)
Equipment
Microwave source
MW spectrum analyzer
Power meter
MW power sensor
Power splitter
Equipment Setup
Setup A: Connect the microwave-source output to the power-splitter input. Connect the MW
power-sensor output to the power meter. Connect the MW power-sensor input to one of the
power splitter's outputs. Connect the RF OUTPUT of the MW spectrum analyzer through a
low-loss cable to the remaining power-splitter output.
Setup B: Connect the RF OUTPUT of the MW spectrum analyzer through a low-loss cable to
the RF OUTPUT of the device under test (DUT).
Description
If it has been longer than seven days since the frequency response of the MW spectrum
analyzer was characterized, setup A is used while the new calibration data is generated. The
calibration is made in 100 MHz increments over the frequency range of 100 MHz to 22 GHz*.
The setting of the MW spectrum analyzer RF attenuator is stored along with the calibration
data.
Connect the equipment using setup B. Measurements are made at ten frequencies over the
2.7 GHz to 18 GHz range. Only the local-oscillator signal, and its harmonics that fall below
22 GHz, are measured. The DUT is set to an RF output level of 02 dBm, and for zero span
operation. The MW spectrum analyzer RF attenuator is set to the same value that was
used during calibration. Resolution bandwidth is chosen to provide at least 10 dB of margin
between the specied performance and the displayed average noise level. The frequency span
is set to 600 kHz.
At each test frequency, the amplitude of the local oscillator and its harmonics are measured
by the MW spectrum analyzer. These amplitudes are then corrected using the atness
calibration data and compared to specications.
*Note:
4-20
The frequency range is dependent upon the frequency range of the test equipment.
HP 11990A Option 033 System Add-On Package
TG RF Off Residuals (HP 70301A)
Uncertainties
The following characteristics contribute to uncertainties:
Power meter accuracy
Mismatch errors
Power splitter tracking
MW spectrum analyzer marker resolution
MW spectrum analyzer log delity
Test Mode
This test is not run in Limited Cal mode.
In Case of Failure
If this test fails, the following module may need repair or adjustment:
Tracking generator
HP 11990A Option 033 System Add-On Package
4-21
TG Spurious Outputs (HP 70301A)
Tested Specification
SPECTRAL PURITY: N 2 1st LO
Equipment
Microwave source
MW spectrum analyzer
Power meter
MW power sensor
Power splitter
Level generator
Equipment Setup
Setup A: Connect the microwave-source output to the power-splitter input. Connect the MW
power-sensor output to the power meter. Connect the MW power-sensor input to one of the
power splitter's outputs. Connect the RF OUTPUT of the MW spectrum analyzer through a
low-loss cable to the remaining power-splitter output.
Setup B: Connect the RF OUTPUT of the MW spectrum analyzer through a low-loss cable to
the RF OUTPUT of the device under test (DUT). Connect the level generator's 50
output
to the DUT's rear-panel 21.4 MHz IN.
Description
If it has been longer than seven days since the frequency response of the MW spectrum
analyzer was characterized, setup A is used while the new calibration data is generated. The
calibration is made in 100 MHz increments over the frequency range of 100 MHz to 22 GHz*.
The setting of the MW spectrum analyzer RF attenuator is stored along with the calibration
data.
Connect the equipment using setup B. Measurements are made at ten frequencies over the
2.7 GHz to 18 GHz range. Only the local-oscillator signal, and its harmonics that fall below
22 GHz, are measured. The DUT is set to an RF output level of 0 dBm, and for zero span
operation. The MW spectrum analyzer RF attenuator is set to the same value that was
used during calibration. Resolution bandwidth is chosen to provide at least 10 dB of margin
between the specied performance and the displayed average noise level. The frequency span
is set to 50 kHz.
At each test frequency, the amplitude of the DUT's carrier frequency is measured by the
MW spectrum analyzer and then corrected using the atness calibration data. The spurious
signals due to the local oscillator and its harmonics are then measured by the MW spectrum
analyzer and corrected using the atness calibration data. The results are then compared to
specications.
*Note:
4-22
The frequency range is dependent upon the frequency range of the test equipment.
HP 11990A Option 033 System Add-On Package
TG Spurious Outputs (HP 70301A)
Uncertainties
The following characteristics contribute to uncertainties:
Power meter accuracy
Mismatch errors
Power splitter tracking
MW spectrum analyzer marker resolution
MW spectrum analyzer log delity
Test Mode
This test is not run in Limited Cal mode.
In Case of Failure
If this test fails, the following module may need repair or adjustment:
Tracking generator
HP 11990A Option 033 System Add-On Package
4-23
5
HP 11990A Option 100 System Software Package
Introduction
The HP 11990A Option 100 System Software package provides all test software required
to verify that an HP 71100A, HP 71100C, or HP 71150C spectrum analyzer meets all of its
major specications. This system software package consists of this manual and one test disk
(Test Disk 1). A System Add-On package may be needed to test modules that are not part
of a predened system. For example, although the tracking generator tests are listed in the
Test Menu, these tests are not included in the system software package. The HP 11990A
Option 033 System Add-On package contains the tracking generator tests.
Execution of the tests in this system software package is dependent on the HP 11990A Option
001 User Interface program, which automates the test process. Refer to Chapter 2, \Start-Up
Procedures," for instructions to run the test software.
Option 100 Tests
Sweep Time Accuracy : : : : : : : : : : : : : : : : : : : : : : : : : : : : : : : : : : : : : : : : : : : : : : : : : : : : : : : : : 5-3
Calibrator Frequency Accuracy : : : : : : : : : : : : : : : : : : : : : : : : : : : : : : : : : : : : : : : : : : : : : : : : 5-4
Second Harmonic Distortion : : : : : : : : : : : : : : : : : : : : : : : : : : : : : : : : : : : : : : : : : : : : : : : : : : : 5-5
Third Order IMD : : : : : : : : : : : : : : : : : : : : : : : : : : : : : : : : : : : : : : : : : : : : : : : : : : : : : : : : : : : : : : 5-6
Gain Compression : : : : : : : : : : : : : : : : : : : : : : : : : : : : : : : : : : : : : : : : : : : : : : : : : : : : : : : : : : : : : 5-8
Calibrator Amplitude Accuracy : : : : : : : : : : : : : : : : : : : : : : : : : : : : : : : : : : : : : : : : : : : : : : : : 5-9
Frequency Response (HP 70904A) : : : : : : : : : : : : : : : : : : : : : : : : : : : : : : : : : : : : : : : : : : : : 5-10
Frequency Readout Accuracy : : : : : : : : : : : : : : : : : : : : : : : : : : : : : : : : : : : : : : : : : : : : : : : : : 5-12
Frequency Span Accuracy : : : : : : : : : : : : : : : : : : : : : : : : : : : : : : : : : : : : : : : : : : : : : : : : : : : : 5-13
Image Responses : : : : : : : : : : : : : : : : : : : : : : : : : : : : : : : : : : : : : : : : : : : : : : : : : : : : : : : : : : : : : 5-14
Out of Range Responses : : : : : : : : : : : : : : : : : : : : : : : : : : : : : : : : : : : : : : : : : : : : : : : : : : : : : : 5-15
Displayed Average Noise : : : : : : : : : : : : : : : : : : : : : : : : : : : : : : : : : : : : : : : : : : : : : : : : : : : : : : 5-16
Residual Responses : : : : : : : : : : : : : : : : : : : : : : : : : : : : : : : : : : : : : : : : : : : : : : : : : : : : : : : : : : : 5-17
Input Coupling Switching : : : : : : : : : : : : : : : : : : : : : : : : : : : : : : : : : : : : : : : : : : : : : : : : : : : : : 5-18
Noise Sidebands : : : : : : : : : : : : : : : : : : : : : : : : : : : : : : : : : : : : : : : : : : : : : : : : : : : : : : : : : : : : : : 5-19
Line and System Related Sidebands : : : : : : : : : : : : : : : : : : : : : : : : : : : : : : : : : : : : : : : : : : 5-20
Synthesis Related Sidebands : : : : : : : : : : : : : : : : : : : : : : : : : : : : : : : : : : : : : : : : : : : : : : : : : : 5-21
Step Gain Accuracy : : : : : : : : : : : : : : : : : : : : : : : : : : : : : : : : : : : : : : : : : : : : : : : : : : : : : : : : : : 5-22
Log Fidelity : : : : : : : : : : : : : : : : : : : : : : : : : : : : : : : : : : : : : : : : : : : : : : : : : : : : : : : : : : : : : : : : : : 5-23
Resolution Bandwidth Tests : : : : : : : : : : : : : : : : : : : : : : : : : : : : : : : : : : : : : : : : : : : : : : : : : : 5-24
Linear Fidelity : : : : : : : : : : : : : : : : : : : : : : : : : : : : : : : : : : : : : : : : : : : : : : : : : : : : : : : : : : : : : : : 5-26
HP 11990A Option 100 System Software Package
5-1
Test Descriptions
This manual lists and describes all of the tests in this system software package. Pressing the
softkey ALL TESTS invokes execution of the tests in an ecient sequence determined by the
software authors.
The following list explains the information found in this manual under the test names:
\Tested Specication" is the name of the system specication as found in the
\Specications" chapter of the HP 70900 Local Oscillator Installation and Verication
Manual .
\Equipment" lists all external test equipment required by the particular test. Accessories
are not listed. The test will not run if required test equipment is missing.
\Equipment Setup" describes equipment interconnections. A setup screen on the computer
display will also provide instruction. This screen does not appear if the current setup is
complete and correct. The screen presents ABORT and PROCEED softkeys. Pressing ABORT
will display the Test Menu. If the setup is wrong, pressing PROCEED three times will abort
the test and then display the Test Menu.
\Description" provides a brief description of the test.
\Uncertainties" tells what characteristics contribute to measurement uncertainties.
\Test Mode" tells whether the particular test runs in Limited Cal mode and what, if any,
parameter is modied. Mode selection is a Test Menu function. There are six major modes:
Single, Repeat, Multiple, Repeat Multiple, All Tests, and Limited Cal. In any mode other
than Limited Cal, the tests run in their entirety. The following section lists the tests
included in Limited Cal.
\In Case of Failure" tells which modules may need repair or adjustment if the test fails.
NNNNNNNNNNNNNNNNNNNNNNNNNNNNN
NNNNNNNNNNNNNNNNN
NNNNNNNNNNNNNNNNNNNNNNN
NNNNNNNNNNNNNNNNN
NNNNNNNNNNNNNNNNNNNNNNN
Limited Cal Tests
When you press LIMITED CAL in the Test Menu or QUICK TEST in the Main Menu, the
Limited Cal tests are executed in a sequence dened by the software authors. The Limited
Cal tests are listed below in the order that they appear in this manual, not in the order of
execution.
NNNNNNNNNNNNNNNNNNNNNNNNNNNNNNNNNNN
NNNNNNNNNNNNNNNNNNNNNNNNNNNNNNNN
Sweep Time Accuracy
Calibrator Frequency Accuracy
Gain Compression
Calibrator Amplitude Accuracy
Frequency Response
Frequency Span Accuracy
Displayed Average Noise
Residual Responses
Noise Sidebands
Line and System Related Sidebands
Step Gain Accuracy
Log Fidelity
Resolution Bandwidth Tests
5-2
HP 11990A Option 100 System Software Package
Sweep Time Accuracy
Sweep Time Accuracy
(HP 70900A or HP 70900B)
Tested Specification
SWEEP: Sweep Time: Accuracy
Equipment
Universal counter
Equipment Setup
The H SWP output on the rear panel of the HP 70900 local oscillator is connected to the
input of the universal counter. If an HP 70700A digitizer is in the system, the H SWP line
from the HP 70900 must also be connected to the digitizer rear-panel HI SWP connector.
Description
Several dierent spectrum-analyzer sweep times are selected to exercise the hardware fully.
For each selected sweep time, the DUT is set for a span of 0 Hz and a sweep is triggered. The
sweep time is then measured with the universal counter. Sweep times are selected to turn on
each of the 12 bits of the sweep DAC. Only one bit is on at a time except when the lower six
bits are tested; then bit 6 is also on.
If the HP 70700A digitizer is in the system, then its hardware must also be tested. Several
more sweep times are chosen to test: fast sweep times at multiples of the digitizer's clock rate,
worst-case resolution errors, and long sample rates.
Uncertainties
The following characteristics contribute to uncertainties:
Universal counter resolution
Universal counter accuracy
Test Mode
This test runs in the Limited Cal mode, and should be run after doing a repair.
In Case of Failure
If this test fails, the following modules may need repair or adjustment:
Local oscillator
Digitizer
HP 11990A Option 100 System Software Package
5-3
Calibrator Frequency Accuracy
(HP 70900A or HP 70900B)
Tested Specification
FREQUENCY: Frequency Reference Accuracy: Aging
Equipment
Frequency counter
Equipment Setup
The CALIBRATOR output of the HP 70900 is connected to the input of the frequency
counter.
Description
With the spectrum analyzer (DUT) set to its internal frequency reference, the frequency
counter is used to measure the 300 MHz CALIBRATOR frequency.
Uncertainties
The following characteristics contribute to uncertainties:
Frequency counter time-base stability
Test Mode
This test is run in Limited Cal mode.
In Case of Failure
If this test fails, the following modules may need repair or adjustment:
Local oscillator
5-4
HP 11990A Option 100 System Software Package
Second Harmonic Distortion
Second Harmonic Distortion
(HP 70902A)
Tested Specification
AMPLITUDE: Spurious Responses: Second Harmonic Distortion
Equipment
Level generator
12 MHz low-pass lter
Equipment Setup
Connect the 50 output of the level generator through a 12 MHz low-pass lter to the RF
INPUT of the spectrum analyzer (DUT).
Description
The second harmonic distortion of the DUT is measured at 9 and 11 MHz. The DUT
auto-zoom function is used to tune the level-generator signal in a 50 Hz span. Carrier
amplitude and frequency are measured. The DUT center frequency is then tuned to the
second harmonic, and the amplitude of the internally generated second harmonic is measured.
Uncertainties
The following characteristics contribute to uncertainties:
DUT marker amplitude resolution
DUT atness
DUT log delity
DUT calibrator amplitude accuracy
Test Mode
This test is not run in Limited Cal mode.
In Case of Failure
If this test fails, the following modules may need repair or adjustment:
IF section
RF section
HP 11990A Option 100 System Software Package
5-5
Third Order IMD
(HP 70902A or HP 70903A)
Tested Specification
AMPLITUDE: Spurious Responses: Third-Order Intermodulation Distortion
Equipment
Level generator
General source
50 MHz low-pass lter
Directional bridge
Equipment Setup
Connect the common port of the directional bridge to the RF INPUT of the DUT. Connect
the 50 output of the level generator through a 50 MHz low-pass lter to one of the unused
directional-bridge connectors. Connect the RF OUTPUT of the general source to another
unused directional-bridge connector.
Description
The third-order intermodulation (TOI) of the DUT is measured at approximately 45 MHz
using the 3 kHz resolution bandwidth (100 kHz in the HP 70903A). It is tested at several
signal separations.
First, the amplitude of the general-source output is measured to establish the TOI reference
amplitude level. Then the amplitude of the level-generator output is measured to establish the
signal level. The upper third-order-product signal level is then measured, and the equivalent
TOI is calculated as follows:
(TOI reference ampl:) 0 (third0order ampl:) [(signal level) 0 (DUT input atten: setting)] +
2
This procedure is repeated for the lower TOI product. The smaller value of the equivalent
TOI is retained.
Uncertainties
The following characteristics contribute to uncertainties:
Level generator relative amplitude accuracy
DUT absolute frequency response referenced to 300 MHz
DUT marker amplitude resolution
DUT calibrator amplitude accuracy
DUT resolution bandwidth amplitude switching
DUT log delity
5-6
HP 11990A Option 100 System Software Package
Third Order IMD
Test Mode
This test is not run in Limited Cal mode.
In Case of Failure
If this test fails, the following modules may need repair or adjustment:
IF section
RF section
HP 11990A Option 100 System Software Package
5-7
Gain Compression
(using HP 70902A or HP 70903A)
Tested Specification
AMPLITUDE: Gain Compression
Equipment
Level generator
Measurement receiver
Sensor module
Equipment Setup
The level generator is connected to the RF INPUT of the spectrum analyzer (DUT). The
sensor-module output is connected to the measurement receiver. The sensor-module input is
connected to the front-panel IF OUTPUT on the HP 70902A or HP 70903A.
Description
The level generator is set to produce a signal within the range of the DUT. The DUT is tuned
to this signal, and the input attenuator is set to 10 dB. The DUT is set to zero span and the
level generator is tuned to the center of the DUT passband.
The amplitude of the level generator is adjusted until a signal of 030 dBm or less is at the
DUT input mixer. The measurement receiver then measures signal path gain; this value is
used as the reference for no gain compression.
The level-generator amplitude is increased to produce a signal of 010 dBm at the DUT input
mixer. The measurement receiver again measures signal path gain. The dierence between the
two gain measurements is the gain compression.
Uncertainties
The following characteristics contribute to uncertainties:
Level generator relative amplitude accuracy
Measurement receiver relative accuracy
Test Mode
This test is run in Limited Cal mode.
In Case of Failure
If this test fails, the following modules may need repair or adjustment:
IF section
RF section
5-8
HP 11990A Option 100 System Software Package
Calibrator Amplitude Accuracy
Calibrator Amplitude Accuracy
(HP 70900A or HP 70900B)
Tested Specification
AMPLITUDE ACCURACY: Calibrator Uncertainty
Equipment
Power meter
RF power sensor or microwave power sensor
Equipment Setup
Connect the power sensor to the spectrum analyzer (DUT) CALIBRATOR output connector.
Description
After zeroing and calibrating the power meter, the power sensor is connected to the DUT
CALIBRATOR output. The calibrator amplitude is measured and corrected using the
calibration factor of the power sensor.
Uncertainties
The following characteristics contribute to uncertainties:
Power meter accuracy
Mismatch between power sensor and CALIBRATOR output connector
Test Mode
This test is run in Limited Cal mode.
In Case of Failure
If this test fails, the following modules may need repair or adjustment:
Local oscillator
HP 11990A Option 100 System Software Package
5-9
Frequency Response (HP 70904A)
Tested Specification
AMPLITUDE ACCURACY: Frequency Response
Equipment
Microwave source
Level generator (not needed for Limited Cal)
Power meter
RF power sensor or microwave power sensor
Power splitter
Equipment Setup
A low-loss cable such as HP part number 8120-3124 must be used to connect
the microwave source to the spectrum analyzer (DUT).
Note
Connect the RF OUTPUT of the microwave source to the input port of the power splitter.
Connect one output of the power splitter to the RF INPUT of the DUT. With the power
splitter connected to the power meter, connect the other output of the power splitter to the
power sensor.
For frequencies less than 50 MHz, connect the OUTPUT of the level generator to the RF
INPUT of the DUT.
Description
The power meter is calibrated. The input attenuator of the DUT is set to 10 dB. The
microwave source output level is adjusted for a power-meter reading of 010 dBm at 300 MHz.
The DUT marker amplitude is read to establish a reference. A minimum of 30 measurements
are made in each frequency band above 50 MHz.
For frequencies less than 50 MHz, frequency response is measured with the level generator.
The level-generator output level is adjusted to produce the same DUT marker amplitude as
that using the previous setup.
The frequency response data is available in graph mode.
5-10
HP 11990A Option 100 System Software Package
Frequency Response (HP 70904A)
Uncertainties
The following characteristics contribute to uncertainties:
All Frequencies
DUT marker amplitude resolution
Frequencies >50 MHz
Power splitter tracking
Power meter accuracy
Mismatch between DUT and power splitter
Mismatch between power sensor and power splitter
Frequencies <50 MHz
Level generator atness
Mismatch between DUT and level generator
Test Mode
The test is run for frequencies greater than 50 MHz in Limited Cal mode.
In Case of Failure
If this test fails, the following modules may need repair or adjustment:
RF section
HP 11990A Option 100 System Software Package
5-11
Frequency Readout Accuracy
Tested Specification
FREQUENCY: Frequency Readout Accuracy
Equipment
Synthesized source
Equipment Setup
Connect the RF OUTPUT of the synthesized source to the spectrum analyzer (DUT) RF
INPUT.
Description
Frequency readout accuracy is tested at a maximum of eight frequencies and four spans. For
each span and source frequency, the frequency readout of the DUT is compared to that of
a synthesized source. The source is set to the selected center frequency of the DUT. The
signal is marker-peaked. The deviation between the marker frequency readout and the center
frequency is the frequency error. This test is performed with the DUT referenced to the
internal frequency reference.
If the signal amplitude is close to the noise level due to a cable that has a large amount of
signal loss, the measurement is not recorded.
If the HP 70700A digitizer is in the system, the entire test is repeated with the external
digitizer selected. In addition, extra frequencies are selected to check the area of band
crossings in microwave systems.
Uncertainties
The following characteristics contribute to uncertainties:
Synthesized source time-base accuracy
DUT marker frequency accuracy
Test Mode
This test is not run in the Limited Cal mode.
In Case of Failure
If this test fails, the following modules may need repair or adjustment:
Local oscillator
Digitizer
5-12
HP 11990A Option 100 System Software Package
Frequency Span Accuracy
Frequency Span Accuracy
Tested Specification
FREQUENCY: Frequency Span: Accuracy
Equipment
Synthesized source
Equipment Setup
Connect the RF OUTPUT of the synthesized source to the spectrum analyzer (DUT) RF
INPUT.
Description
The DUT center frequency is set to 1.5 GHz, and spans of 10 kHz, 100 kHz, 1 MHz, 10 MHz,
10.01 MHz, 101 MHz, and 1.01 GHz are tested. The synthesizer frequency is adjusted until
a signal appears near the left edge of the display. The frequency of this point and several
other points in the span are noted by using marker peak. The deviation between the marker
frequency and the synthesizer frequency is the absolute error. The maximum frequency span
error is calculated by taking the dierence between the maximum and minimum absolute
errors.
This test is performed with the DUT referenced to the internal frequency reference.
If the HP 70700A digitizer is in the system, the test is repeated with the external digitizer
selected.
Uncertainties
The following characteristics contribute to uncertainties:
Synthesized source time-base accuracy
DUT marker frequency accuracy
Test Mode
A limited version of this test runs in the Limited Cal mode, and should be run after doing a
repair.
In Case of Failure
If this test fails, the following modules may need repair or adjustment:
Local oscillator
Digitizer
HP 11990A Option 100 System Software Package
5-13
Image Responses
(using HP 70902A)
Tested Specification
AMPLITUDE: Spurious Responses: Image Responses
Equipment
Clean source
Equipment Setup
Connect the RF OUTPUT of the microwave source to the RF INPUT of the spectrum
analyzer (DUT).
Description
The source and DUT are tuned to a frequency of 250 MHz. The DUT marker is used to
determine carrier amplitude.
The source is then tuned to image frequencies, and image amplitude is measured.
Uncertainties
The following characteristics contribute to uncertainties:
DUT marker amplitude resolution
DUT step gain accuracy
DUT log delity
Clean source relative atness
Test Mode
This test is not run in Limited Cal mode.
In Case of Failure
If this test fails, the following modules may need repair or adjustment:
IF section
RF section
5-14
HP 11990A Option 100 System Software Package
Out of Range Responses
Out of Range Responses
Tested Specification
AMPLITUDE: Spurious Responses: Out-of-Range
Equipment
Microwave source
Equipment Setup
The RF output of the microwave source is connected to the RF INPUT of the spectrum
analyzer (DUT).
Note
A low-loss cable such as HP part number 8120-3124 must be used to connect
the microwave source to the RF INPUT of the DUT.
Description
The microwave source is stepped in 100 MHz increments (250 MHz in the All Tests mode)
from 4 to 18 GHz. At each signal frequency, the DUT is tuned to the center frequencies that
could produce an out-of-range response. The response level is measured at each of these
frequencies.
Uncertainties
The following characteristics contribute to uncertainties:
DUT marker amplitude resolution
DUT log delity
DUT step gain accuracy
DUT calibrator amplitude accuracy
DUT atness
Microwave source absolute amplitude accuracy
Mismatch between microwave source and DUT RF INPUT
Test Mode
This test is not run in Limited Cal mode.
In Case of Failure
If this test fails, the following modules may need repair or adjustment:
Local oscillator
RF section
HP 11990A Option 100 System Software Package
5-15
Displayed Average Noise
(using HP 70902A or HP 70903A)
Tested Specification
AMPLITUDE: Displayed Average Noise Level
Equipment
50 termination
Equipment Setup
Connect the 50 termination to the spectrum analyzer (DUT) RF INPUT.
Description
The average displayed noise level is measured at the frequency of the displayed peak in each
band, except below 10 MHz where 10 data points are taken.
When the DUT system has an HP 70902A, a resolution bandwidth of 10 Hz and a video
bandwidth of 3 Hz are used. When the DUT system has an HP 70903A, a resolution
bandwidth of 100 kHz and a video bandwidth of 300 Hz are used. A sweep is taken and trace
information is averaged.
Uncertainties
The following characteristics contribute to uncertainties:
DUT marker amplitude resolution
DUT step gain accuracy
DUT log delity
DUT resolution bandwidth amplitude switching accuracy
DUT calibrator amplitude accuracy
DUT RF attenuator switching accuracy
Test Mode
This test is run in Limited Cal mode.
In Case of Failure
If this test fails, the following modules may need repair or adjustment:
Local oscillator
IF section
RF section
5-16
HP 11990A Option 100 System Software Package
Residual Responses
Residual Responses
(using HP 70902A)
Tested Specification
AMPLITUDE: Spurious Responses: Residual Responses
Equipment
50 termination
Equipment Setup
Connect the 50 termination to the RF INPUT of the spectrum analyzer (DUT).
Description
The input attenuator of the DUT is set to 0 dB. The frequencies at which residual responses
may occur are calculated and the DUT is tuned to these frequencies. The residual product
level is measured.
Uncertainties
The following characteristics contribute to uncertainties:
DUT marker amplitude resolution
DUT step gain accuracy
DUT log delity
DUT resolution bandwidth amplitude switching accuracy
DUT calibrator amplitude accuracy
DUT RF attenuator switching accuracy
Test Mode
This test is run in Limited Cal mode.
In Case of Failure
If this test fails, the following modules may need repair or adjustment:
IF section
RF section
HP 11990A Option 100 System Software Package
5-17
Input Coupling Switching
Tested Specification
AMPLITUDE ACCURACY: Input Coupling Switching Error
Equipment
General source
Equipment Setup
Connect the RF output of the general source to the RF INPUT connector of the spectrum
analyzer (DUT).
Description
The input coupling switching is tested at signal frequencies of 500 kHz, 50 MHz, 500 MHz,
and 2500 MHz. The DUT is set for dc coupling and signal amplitude is measured. The input
coupling is then switched to ac coupling and the dierence is measured.
Uncertainties
The following characteristics contribute to uncertainties:
DUT marker amplitude resolution
DUT incremental log delity
Test Mode
This test is not run in Limited Cal mode.
In Case of Failure
If this test fails, the following modules may need repair or adjustment:
RF section
5-18
HP 11990A Option 100 System Software Package
Noise Sidebands
Noise Sidebands
(using HP 70902A)
Tested Specification
FREQUENCY: Spectral Purity: Noise Sidebands (dBc/Hz)
Equipment
Clean source
Equipment Setup
Connect the RF OUTPUT of the clean source to the RF INPUT of the spectrum analyzer
(DUT).
Description
HP 70900A: The noise sidebands are measured at 40 oset frequencies from 100 Hz to 1 MHz.
HP 70900B: The noise sidebands are measured at an oset frequency of 10 kHz.
The DUT is set for 0 dB attenuation and a span of 0 Hz. The signal amplitude is adjusted
to the reference level, which is the carrier level. The source carrier frequency is increased by
the amount of oset frequency. The resolution bandwidth of the DUT is set to 3% of the
oset frequency, and the reference level is reduced by 20 dB. A sweep is taken and the data
is averaged. The data is normalized to a 1 Hz bandwidth and corrected for log detection and
noise bandwidth.
Uncertainties
The following characteristics contribute to uncertainties:
DUT marker amplitude resolution
DUT log delity
DUT resolution bandwidth amplitude correction
DUT resolution bandwidth 3 dB accuracy
DUT noise oor error
Clean source phase-noise level
Test Mode
This test is run in Limited Cal mode at 796.12 MHz only.
In Case of Failure
If this test fails, the following modules may need repair or adjustment:
Local oscillator
RF section
HP 11990A Option 100 System Software Package
5-19
Line and System Related Sidebands
(using HP 70902A)
Tested Specification
FREQUENCY: Spectral Purity: Line- and system-related sidebands (dBc)
Equipment
Clean source
Equipment Setup
Connect the RF OUTPUT of the clean source to the RF INPUT of the spectrum analyzer
(DUT).
Description
The source is set for an amplitude of 010 dBm. Line- and system-related sidebands are tested
at frequencies of 15, 1200, and 2500 MHz. The signal is peaked on the DUT and set to the
reference level.
The source is then oset by known sideband frequencies, and the sideband level is measured.
Uncertainties
The following characteristics contribute to uncertainties:
DUT marker amplitude resolution
DUT log delity
Test Mode
This test is run in Limited Cal mode at 15 MHz only.
In Case of Failure
If this test fails, the following modules may need repair or adjustment:
Local oscillator
5-20
HP 11990A Option 100 System Software Package
Synthesis Related Sidebands
Synthesis Related Sidebands
(using HP 70902A)
Tested Specification
FREQUENCY: Spectral Purity: Synthesis-related sidebands (dBc)
Equipment
Clean source
Equipment Setup
The RF OUTPUT of the clean source is connected to the RF INPUT of the spectrum
analyzer (DUT).
Description
Based on the center frequency tuning equations, the DUT is tuned to frequencies where
synthesis-related sidebands may exist. The source carrier level is measured. Then the source
frequency is increased to place the sideband on-screen, and the sideband level is measured.
Uncertainties
The following characteristics contribute to uncertainties:
DUT marker amplitude resolution
DUT log delity
Test Mode
This test is not run in Limited Cal mode.
In Case of Failure
If this test fails, the following modules may need repair or adjustment:
Local oscillator
HP 11990A Option 100 System Software Package
5-21
Step Gain Accuracy
(for HP 70902A or HP 70903A)
Tested Specification
AMPLITUDE ACCURACY: IF Gain Uncertainty
Equipment
Level generator
Voltmeter
Equipment Setup
Connect the 50 output of the level generator to the RF INPUT of the spectrum analyzer
(DUT). Connect the voltmeter to the DUT front-panel VIDEO output.
Description
The spectrum analyzer is set for a reference level and RF attenuator setting that corresponds
to 0 dB IF Gain. The level generator is set to +12 dBm and the voltmeter is read to establish
a reference voltage.
The reference level is then decreased 10 dB. The level-generator output is adjusted, if
necessary, until the reference voltage is reached. The dierence between voltage readings is the
IF gain error. Repeat this for each IF gain step.
Uncertainties
The following characteristics contribute to uncertainties:
Level generator relative amplitude accuracy
Voltmeter ac measurement accuracy
DUT marker amplitude resolution
DUT log scale delity incremental accuracy (corrected)
Test Mode
This test is run in the Limited Cal mode.
In Case of Failure
If this test fails, the following modules may need repair or adjustment:
IF section
5-22
HP 11990A Option 100 System Software Package
Log Fidelity
Log Fidelity
(for HP 70902A or HP 70903A)
Tested Specification
AMPLITUDE ACCURACY: Scale Fidelity: Log
Equipment
Level generator
Equipment Setup
Connect the 50 output of the level generator to the RF INPUT of the spectrum analyzer
(DUT).
Description
This test measures the relative on-screen log scale delity (that is, the display CRT's upper
eight divisions for the HP 70903A, or upper nine divisions for the HP 70902A).
The DUT is set for a reference level of +10 dBm, span of 0 Hz, and a resolution bandwidth of
100 kHz (HP 70903A) or 100 Hz (HP 70902A). The level-generator frequency is adjusted to
peak the detected signal, and the amplitude is adjusted to set the signal at the reference level.
The dierence between the level generator and marker amplitudes establishes a reference error
at this point.
The level generator is stepped down in 1 dB increments (2 dB in Limited Cal and All Tests
modes) until the signal is 75 to 90 dB below top-screen. The actual level depends on the IF
and RF being tested. In the last 20 dB of the log range, the sweep time is increased to lessen
the eects of the reduced signal-to-noise ratio. The amplitude dierence between the level
generator and the displayed trace average is measured. Once all measurements have been
made, the data is normalized to 010 dB of top-screen.
If the HP 70700A digitizer is in the system, the test is repeated with the digitizer selected.
Uncertainties
The following characteristics contribute to uncertainties:
Level generator relative amplitude accuracy
DUT marker amplitude resolution
Test Mode
This test is run in Limited Cal mode, and should be run after doing a repair.
In Case of Failure
If this test fails, the following modules may need repair or adjustment:
IF section
HP 11990A Option 100 System Software Package
5-23
Resolution Bandwidth Tests
(for HP 70902A or HP 70903A)
Tested Specifications
AMPLITUDE ACCURACY: Resolution Bandwidth Switching Uncertainty
FREQUENCY: Resolution Bandwidths (03 dB), Accuracy
FREQUENCY: Resolution Bandwidths (03 dB), Selectivity
Equipment
Level generator
Equipment Setup
Connect the RF OUTPUT of the level generator to the RF INPUT of the spectrum analyzer
(DUT).
Description
Bandwidth switching variation is tested by setting a reference value at the widest resolution
bandwidth. The DUT resolution bandwidth is then stepped down in a 1, 3, 10 sequence and
the amplitude variation from the widest bandwidth is recorded. The data is then normalized
to the reference bandwidth (100 Hz, HP 70902A; 300 kHz, HP 70903A).
The 3 dB (or 60 dB) points of the resolution bandwidth response are tested as follows.
The DUT is set to the 0 Hz span and the level-generator frequency is adjusted to peak the
response. The level-generator amplitude is then stepped down 3 dB to establish a reference
value. The level- generator amplitude is then returned to the original value and the frequency
is decreased until the 3 dB reference amplitude is reached. This establishes the lower 3 dB
frequency point. The level-generator frequency is then increased until the upper 3 dB point
is found. The dierence in level-generator frequencies is the 3 dB bandwidth. This procedure
may be repeated to determine the 60 dB points of the resolution bandwidth response.
Uncertainties
The following characteristics contribute to uncertainties:
Level generator relative amplitude accuracy
Level generator frequency accuracy
DUT marker amplitude resolution
5-24
HP 11990A Option 100 System Software Package
Resolution Bandwidth Tests
Test Mode
This test is run in Limited Cal mode for some bandwidths.
In Case of Failure
If this test fails, the following modules may need repair or adjustment:
IF section
HP 11990A Option 100 System Software Package
5-25
Linear Fidelity
(for HP 70902A or HP 70903A)
Tested Specification
AMPLITUDE ACCURACY: Scale Fidelity: Linear
Equipment
Level generator
Equipment Setup
The 50 output of the level generator is connected to the RF INPUT of the spectrum
analyzer (DUT).
Description
The HP 70902A test sets the resolution bandwidth to 30 kHz; the HP 70903A test sets the
resolution bandwidth to 1 MHz. The LIN display mode is selected. The level generator is set
to provide a signal near the reference level.
The spectrum analyzer marker is peaked. The reference level is set at the peaked value to
establish a reference at the top of the display.
The level generator is stepped down in 2 dB increments (4 dB for All Tests mode). The
variation between the level-generator amplitude and DUT marker amplitude is measured.
Uncertainties
The following characteristics contribute to uncertainties:
Level generator relative amplitude accuracy
DUT marker amplitude resolution
Test Mode
This test is not run in Limited Cal mode.
In Case of Failure
If this test fails, the following modules may need repair or adjustment:
IF section
5-26
HP 11990A Option 100 System Software Package
6
HP 11990A Option 200 System Software Package
Introduction
The HP 11990A Option 200 System Software package provides all test software required
to verify that an HP 71200A, HP 71201A, or HP 71200C spectrum analyzer meets all of its
major specications. This system software package consists of this manual and one test disk
(Test Disk 1). A System Add-On package may be needed to test modules that are not part of
a predened system. For example, although the tracking generator tests are listed in the Test
Menu, these tests are not included in the system software package. The HP 11990A Option
033 System Add-On package contains the tracking generator tests.
Execution of the tests in this system software package is dependent on the HP 11990A Option
001 User Interface program, which automates the test process. Refer to Chapter 2, \Start-Up
Procedures," for instructions to run the test software.
Option 200 Tests
Sweep Time Accuracy : : : : : : : : : : : : : : : : : : : : : : : : : : : : : : : : : : : : : : : : : : : : : : : : : : : : : : : : : 6-3
Calibrator Frequency Accuracy : : : : : : : : : : : : : : : : : : : : : : : : : : : : : : : : : : : : : : : : : : : : : : : : 6-4
Second Harmonic Distortion : : : : : : : : : : : : : : : : : : : : : : : : : : : : : : : : : : : : : : : : : : : : : : : : : : : 6-5
Third Order IMD : : : : : : : : : : : : : : : : : : : : : : : : : : : : : : : : : : : : : : : : : : : : : : : : : : : : : : : : : : : : : : 6-6
Gain Compression : : : : : : : : : : : : : : : : : : : : : : : : : : : : : : : : : : : : : : : : : : : : : : : : : : : : : : : : : : : : : 6-8
Calibrator Amplitude Accuracy : : : : : : : : : : : : : : : : : : : : : : : : : : : : : : : : : : : : : : : : : : : : : : : : 6-9
Frequency Response (HP 70905A, HP 70906A) : : : : : : : : : : : : : : : : : : : : : : : : : : : : : : : : 6-10
Frequency Response (HP 70600A, HP 70601A) : : : : : : : : : : : : : : : : : : : : : : : : : : : : : : : : 6-12
Frequency Readout Accuracy : : : : : : : : : : : : : : : : : : : : : : : : : : : : : : : : : : : : : : : : : : : : : : : : : 6-14
Frequency Span Accuracy : : : : : : : : : : : : : : : : : : : : : : : : : : : : : : : : : : : : : : : : : : : : : : : : : : : : 6-15
Image Responses (HP 70905A or HP 70906A) : : : : : : : : : : : : : : : : : : : : : : : : : : : : : : : : : 6-16
Image Response (HP 70600A, HP 70601A) : : : : : : : : : : : : : : : : : : : : : : : : : : : : : : : : : : : : 6-17
Multiple Responses (HP 70600A, HP 70601A) : : : : : : : : : : : : : : : : : : : : : : : : : : : : : : : : 6-19
Displayed Average Noise : : : : : : : : : : : : : : : : : : : : : : : : : : : : : : : : : : : : : : : : : : : : : : : : : : : : : : 6-21
Residual Responses : : : : : : : : : : : : : : : : : : : : : : : : : : : : : : : : : : : : : : : : : : : : : : : : : : : : : : : : : : : 6-22
Noise Sidebands : : : : : : : : : : : : : : : : : : : : : : : : : : : : : : : : : : : : : : : : : : : : : : : : : : : : : : : : : : : : : : 6-23
Line and System Related Sidebands : : : : : : : : : : : : : : : : : : : : : : : : : : : : : : : : : : : : : : : : : : 6-25
Synthesis Related Sidebands : : : : : : : : : : : : : : : : : : : : : : : : : : : : : : : : : : : : : : : : : : : : : : : : : : 6-26
Step Gain Accuracy : : : : : : : : : : : : : : : : : : : : : : : : : : : : : : : : : : : : : : : : : : : : : : : : : : : : : : : : : : 6-27
Log Fidelity : : : : : : : : : : : : : : : : : : : : : : : : : : : : : : : : : : : : : : : : : : : : : : : : : : : : : : : : : : : : : : : : : : 6-28
Resolution Bandwidth Tests : : : : : : : : : : : : : : : : : : : : : : : : : : : : : : : : : : : : : : : : : : : : : : : : : : 6-29
Linear Fidelity : : : : : : : : : : : : : : : : : : : : : : : : : : : : : : : : : : : : : : : : : : : : : : : : : : : : : : : : : : : : : : : 6-31
HP 11990A Option 200 System Software Package
6-1
Test Descriptions
This manual lists and describes all of the tests in this system software package. Pressing the
softkey ALL TESTS invokes execution of the tests in an ecient sequence determined by the
software authors.
The following list explains the information found in this manual under the test names:
\Tested Specication" is the name of the system specication as found in the
\Specications" chapter of the HP 70900 Local Oscillator Installation and Verication
Manual .
\Equipment" lists all external test equipment required by the particular test. Accessories
are not listed. The test will not run if required test equipment is missing.
\Equipment Setup" describes equipment interconnections. A setup screen on the computer
display will also provide instruction. This screen does not appear if the current setup is
complete and correct. The screen presents ABORT and PROCEED softkeys. Pressing ABORT
will display the Test Menu. If the setup is wrong, pressing PROCEED three times will abort
the test and then display the Test Menu.
\Description" provides a brief description of the test.
\Uncertainties" tells what characteristics contribute to measurement uncertainties.
\Test Mode" tells whether the particular test runs in Limited Cal mode and what, if any,
parameter is modied. Mode selection is a Test Menu function. There are six major modes:
Single, Repeat, Multiple, Repeat Multiple, All Tests, and Limited Cal. In any mode other
than Limited Cal, the tests run in their entirety. The following section lists the tests
included in Limited Cal.
\In Case of Failure" tells which modules may need repair or adjustment if the test fails.
NNNNNNNNNNNNNNNNNNNNNNNNNNNNN
NNNNNNNNNNNNNNNNN
NNNNNNNNNNNNNNNNNNNNNNN
NNNNNNNNNNNNNNNNN
NNNNNNNNNNNNNNNNNNNNNNN
Limited Cal Tests
When you press LIMITED CAL in the Test Menu or QUICK TEST in the Main Menu, the
Limited Cal tests are executed in a sequence dened by the software authors. The Limited
Cal tests are listed below in the order that they appear in this manual, not in the order of
execution.
Sweep Time Accuracy
Calibrator Frequency Accuracy
Gain Compression
Calibrator Amplitude Accuracy
Frequency Response
Frequency Span Accuracy
Image Responses (HP 70600A, HP 70601A)
Multiple Responses (HP 70600A, HP 70601A)
Displayed Average Noise
Residual Responses
Noise Sidebands
Line and System Related Sidebands
Step Gain Accuracy
Log Fidelity
Resolution Bandwidth Test
NNNNNNNNNNNNNNNNNNNNNNNNNNNNNNNNNNN
6-2
NNNNNNNNNNNNNNNNNNNNNNNNNNNNNNNN
HP 11990A Option 200 System Software Package
Sweep Time Accuracy
Sweep Time Accuracy
(HP 70900A or HP 70900B)
Tested Specification
SWEEP: Sweep Time: Accuracy
Equipment
Universal counter
Equipment Setup
The H SWP output on the rear panel of the HP 70900 local oscillator is connected to the
input of the universal counter. If an HP 70700A digitizer is in the system, the H SWP line
from the HP 70900 must also be connected to the digitizer rear-panel HI SWP connector.
Description
Several dierent spectrum-analyzer sweep times are selected to exercise the hardware fully.
For each selected sweep time, the DUT is set for a span of 0 Hz and a sweep is triggered. The
sweep time is then measured with the universal counter. Sweep times are selected to turn on
each of the 12 bits of the sweep DAC. Only one bit is on at a time except when the lower six
bits are tested; then bit 6 is also on.
If the HP 70700A digitizer is in the system, then its hardware must also be tested. Several
more sweep times are chosen to test: fast sweep times at multiples of the digitizer's clock rate,
worst-case resolution errors, and long sample rates.
Uncertainties
The following characteristics contribute to uncertainties:
Universal counter resolution
Universal counter accuracy
Test Mode
This test runs in the Limited Cal mode, and should be run after doing a repair.
In Case of Failure
If this test fails, the following modules may need repair or adjustment:
Local oscillator
Digitizer
HP 11990A Option 200 System Software Package
6-3
Calibrator Frequency Accuracy
(HP 70900A or HP 70900B)
Tested Specification
FREQUENCY: Frequency Reference Accuracy: Aging
Equipment
Frequency counter
Equipment Setup
The CALIBRATOR output of the HP 70900 is connected to the input of the frequency
counter.
Description
With the spectrum analyzer (DUT) set to its internal frequency reference, the frequency
counter is used to measure the 300 MHz CALIBRATOR frequency.
Uncertainties
The following characteristics contribute to uncertainties:
Frequency counter time-base stability
Test Mode
This test is run in Limited Cal mode.
In Case of Failure
If this test fails, the following modules may need repair or adjustment:
Local oscillator
6-4
HP 11990A Option 200 System Software Package
Second Harmonic Distortion
Second Harmonic Distortion
(HP 70902A)
Tested Specification
AMPLITUDE: Spurious Responses: Second Harmonic Distortion
Equipment
Level generator
12 MHz low-pass lter
Equipment Setup
Connect the 50 output of the level generator through a 12 MHz low-pass lter to the RF
INPUT of the spectrum analyzer (DUT).
Description
The second harmonic distortion of the DUT is measured at 9 and 11 MHz. The DUT
auto-zoom function is used to tune the level-generator signal in a 50 Hz span. Carrier
amplitude and frequency are measured. The DUT center frequency is then tuned to the
second harmonic, and the amplitude of the internally generated second harmonic is measured.
Uncertainties
The following characteristics contribute to uncertainties:
DUT marker amplitude resolution
DUT atness
DUT log delity
DUT calibrator amplitude accuracy
Test Mode
This test is not run in Limited Cal mode.
In Case of Failure
If this test fails, the following modules may need repair or adjustment:
IF section
RF section
Preselector
HP 11990A Option 200 System Software Package
6-5
Third Order IMD
(HP 70902A or HP 70903A)
Tested Specification
AMPLITUDE: Spurious Responses: Third-Order Intermodulation Distortion
Equipment
Level generator
General source
50 MHz low-pass lter
Directional bridge
Equipment Setup
Connect the common port of the directional bridge to the RF INPUT of the DUT. Connect
the 50 output of the level generator through a 50 MHz low-pass lter to one of the unused
directional-bridge connectors. Connect the RF OUTPUT of the general source to another
unused directional-bridge connector.
Description
The third-order intermodulation (TOI) of the DUT is measured at approximately 45 MHz
using the 3 kHz resolution bandwidth (100 kHz in the HP 70903A). It is tested at several
signal separations.
First, the amplitude of the general-source output is measured to establish the TOI reference
amplitude level. Then the amplitude of the level-generator output is measured to establish the
signal level. The upper third-order-product signal level is then measured, and the equivalent
TOI is calculated as follows:
(TOI reference ampl:) 0 (third0order ampl:) [(signal level) 0 (DUT input atten: setting)] +
2
This procedure is repeated for the lower TOI product. The smaller value of the equivalent
TOI is retained.
Uncertainties
The following characteristics contribute to uncertainties:
Level generator relative amplitude accuracy
DUT absolute frequency response referenced to 300 MHz
DUT marker amplitude resolution
DUT calibrator amplitude accuracy
DUT resolution bandwidth amplitude switching
DUT log delity
6-6
HP 11990A Option 200 System Software Package
Third Order IMD
Test Mode
This test is not run in Limited Cal mode.
In Case of Failure
If this test fails, the following modules may need repair or adjustment:
IF section
RF section
Preselector
HP 11990A Option 200 System Software Package
6-7
Gain Compression
(using HP 70902A or HP 70903A)
Tested Specification
AMPLITUDE: Gain Compression
Equipment
Level generator
Measurement receiver
Sensor module
Equipment Setup
The level generator is connected to the RF INPUT of the spectrum analyzer (DUT). The
sensor-module output is connected to the measurement receiver. The sensor-module input is
connected to the front-panel IF OUTPUT on the HP 70902A or HP 70903A.
Description
The level generator is set to produce a signal within the range of the DUT. The DUT is tuned
to this signal, and the input attenuator is set to 10 dB. The DUT is set to zero span and the
level generator is tuned to the center of the DUT passband.
The amplitude of the level generator is adjusted until a signal of 030 dBm or less is at the
DUT input mixer. The measurement receiver then measures signal path gain; this value is
used as the reference for no gain compression.
The level-generator amplitude is increased to produce a signal of 010 dBm at the DUT input
mixer. The measurement receiver again measures signal path gain. The dierence between the
two gain measurements is the gain compression.
Uncertainties
The following characteristics contribute to uncertainties:
Level generator relative amplitude accuracy
Measurement receiver relative accuracy
Test Mode
This test is run in Limited Cal mode.
In Case of Failure
If this test fails, the following modules may need repair or adjustment:
IF section
RF section
Preselector
6-8
HP 11990A Option 200 System Software Package
Calibrator Amplitude Accuracy
Calibrator Amplitude Accuracy
(HP 70900A or HP 70900B)
Tested Specification
AMPLITUDE ACCURACY: Calibrator Uncertainty
Equipment
Power meter
RF power sensor or microwave power sensor
Equipment Setup
Connect the power sensor to the spectrum analyzer (DUT) CALIBRATOR output connector.
Description
After zeroing and calibrating the power meter, the power sensor is connected to the DUT
CALIBRATOR output. The calibrator amplitude is measured and corrected using the
calibration factor of the power sensor.
Uncertainties
The following characteristics contribute to uncertainties:
Power meter accuracy
Mismatch between power sensor and CALIBRATOR output connector
Test Mode
This test is run in Limited Cal mode.
In Case of Failure
If this test fails, the following modules may need repair or adjustment:
Local oscillator
HP 11990A Option 200 System Software Package
6-9
Frequency Response (HP 70905A, HP 70906A)
Tested Specification
AMPLITUDE ACCURACY: Frequency Response
Equipment
Microwave source
Level generator (not needed for Limited Cal)
Power meter
Microwave power sensor
Power splitter
Equipment Setup
A low-loss cable such as HP part number 8120-3124 must be used to connect
the microwave source to the spectrum analyzer (DUT).
Note
Connect the RF OUTPUT of the microwave source to the input port of the power splitter.
Connect one output of the power splitter to the RF INPUT of the DUT. With the power
sensor connected to the power meter, connect the other output of the power splitter to the
power sensor.
For frequencies less than 50 MHz, connect the OUTPUT of the level generator to the RF
INPUT of the DUT.
Description
The power meter is calibrated. The input attenuator of the DUT is set to 10 dB. The
microwave source output level is adjusted for a power-meter reading of 010 dBm at 300 MHz.
The DUT marker amplitude is read to establish a reference. A minimum of 30 measurements
are made in each frequency band above 50 MHz.
For frequencies less than 50 MHz, frequency response is measured with the level generator.
The level-generator output level is adjusted to produce the same DUT marker amplitude as
that using the previous setup.
The frequency response data is available in graph mode.
6-10
HP 11990A Option 200 System Software Package
Frequency Response (HP 70905A, HP 70906A)
Uncertainties
The following characteristics contribute to uncertainties:
All Frequencies
DUT marker amplitude resolution
Frequencies >50 MHz
Power splitter tracking
Power meter accuracy
Mismatch between DUT and power splitter
Mismatch between power sensor and power splitter
Frequencies <50 MHz
Level generator atness
Mismatch between DUT and level generator
Test Mode
The test is run for frequencies greater than 50 MHz in Limited Cal mode.
In Case of Failure
If this test fails, the following modules may need repair or adjustment:
RF section
HP 11990A Option 200 System Software Package
6-11
Frequency Response (HP 70600A, HP 70601A)
Tested Specification
AMPLITUDE ACCURACY: Frequency Response
(absolute and relative in all bypassed and preselected bands)
Equipment
Microwave source
Level generator (not needed for Limited Cal)
Power meter
Microwave power sensor
Power splitter
Equipment Setup
A low-loss cable such as HP part number 8120-3124 must be used to connect
the microwave source to the spectrum analyzer (DUT).
Note
Setup A: Connect the HP 70900 local oscillator CALIBRATOR output to the HP 70600A or
HP 70601A RF INPUT to calibrate the preselected front end.
Setup B: Connect the source output to the input connector of the power splitter. Connect one
output of the power splitter to the RF INPUT of the HP 70600A or HP 70601A preselector.
Connect the other output from the power splitter to the power sensor, which is connected to
the power meter.
Setup C: (For measurements below 50 MHz only) Connect the level-generator output to the
RF INPUT of the HP 70600A or HP 70601A Preselector.
Description
The algorithm used in this test is the same as for the HP 70905A and HP 70906A RF section
verication tests. The dierence is that this test is run twice, once in the preselected mode
and once in the bypass mode. In the preselected mode, the preselector is peaked before
making each measurement. For both modes, the measurements are made in 3 kHz resolution
bandwidth when the HP 70902A IF section is in the system. The purpose of using this
bandwidth is to eliminate any local oscillator drift during preselector peaking. If only the
wide-band HP 70903A IF section is in the system, the 300 kHz resolution bandwidth is used.
Once the modular spectrum analyzer and power meter have been calibrated, setup B is
veried and the HP 70600A or HP 70601A attenuator is set to 10 dB. Then the preselector
mode is enabled. Next the source power level is adjusted for a power-meter reading of
010 dBm at 300 MHz. The amplitude of the preselector is then measured to set a reference
amplitude.
Starting with the highest band, each band is path-locked while amplitude measurements are
taken at various preselector frequencies with the power meter. If the preselected mode is
enabled, the preselector is peaked in zero span prior to each measurement, then returned to
6-12
HP 11990A Option 200 System Software Package
Frequency Response (HP 70600A, HP 70601A)
the test span. The dierence between the power-meter reading and the measured amplitude of
the preselector is the amplitude measurement error for the frequency measured.
In all modes except Limited Cal mode, frequencies below 50 MHz are measured using a level
generator. Setup C is veried and various frequencies below 50 MHz are measured.
Next, the preselector bypass mode is enabled, and the measurements are repeated once,
starting at the 010 dBm, 300 MHz reference amplitude measurement.
Uncertainties
The following characteristics contribute to uncertainties:
All Frequencies
DUT marker amplitude resolution
Frequencies >50 MHz
Power splitter tracking
Power meter accuracy
Mismatch between DUT and power splitter
Mismatch between power sensor and power splitter
Frequencies <50 MHz
Level generator atness
Mismatch between DUT and level generator
Test Mode
This test is run in Limited Cal mode for frequencies greater than 50 MHz.
In Case of Failure
If this test fails, the following modules may need repair or adjustment:
Preselector
RF section
HP 11990A Option 200 System Software Package
6-13
Frequency Readout Accuracy
Tested Specification
FREQUENCY: Frequency Readout Accuracy
Equipment
Synthesized source
Equipment Setup
Connect the RF OUTPUT of the synthesized source to the spectrum analyzer (DUT) RF
INPUT.
Description
Frequency readout accuracy is tested at a maximum of eight frequencies and four spans. For
each span and source frequency, the frequency readout of the DUT is compared to that of
a synthesized source. The source is set to the selected center frequency of the DUT. The
signal is marker-peaked. The deviation between the marker frequency readout and the center
frequency is the frequency error. This test is performed with the DUT referenced to the
internal frequency reference.
If the signal amplitude is close to the noise level due to a cable that has a large amount of
signal loss, the measurement is not recorded.
If the HP 70700A digitizer is in the system, the entire test is repeated with the external
digitizer selected. In addition, extra frequencies are selected to check the area of band
crossings in microwave systems.
Uncertainties
The following characteristics contribute to uncertainties:
Synthesized source time-base accuracy
DUT marker frequency accuracy
Test Mode
This test is not run in the Limited Cal mode.
In Case of Failure
If this test fails, the following modules may need repair or adjustment:
Local oscillator
Digitizer
6-14
HP 11990A Option 200 System Software Package
Frequency Span Accuracy
Frequency Span Accuracy
Tested Specification
FREQUENCY: Frequency Span: Accuracy
Equipment
Synthesized source
Equipment Setup
Connect the RF OUTPUT of the synthesized source to the spectrum analyzer (DUT) RF
INPUT.
Description
The DUT center frequency is set to 1.5 GHz, and spans of 10 kHz, 100 kHz, 1 MHz, 10 MHz,
10.01 MHz, 101 MHz, and 1.01 GHz are tested. The synthesizer frequency is adjusted until
a signal appears near the left edge of the display. The frequency of this point and several
other points in the span are noted by using marker peak. The deviation between the marker
frequency and the synthesizer frequency is the absolute error. The maximum frequency span
error is calculated by taking the dierence between the maximum and minimum absolute
errors.
This test is performed with the DUT referenced to the internal frequency reference.
If the HP 70700A digitizer is in the system, the test is repeated with the external digitizer
selected.
Uncertainties
The following characteristics contribute to uncertainties:
Synthesized source time-base accuracy
DUT marker frequency accuracy
Test Mode
A limited version of this test runs in the Limited Cal mode, and should be run after doing a
repair.
In Case of Failure
If this test fails, the following modules may need repair or adjustment:
Local oscillator
Digitizer
HP 11990A Option 200 System Software Package
6-15
Image Responses (HP 70905A or HP 70906A)
(using HP 70902A)
Tested Specification
AMPLITUDE: Spurious Responses: Image Responses
Equipment
Clean source
Equipment Setup
Connect the RF OUTPUT of the microwave source to the RF INPUT of the spectrum
analyzer (DUT).
Description
The source and DUT are tuned to a frequency of 250 MHz. The DUT marker is used to
determine carrier amplitude.
The source is then tuned to image frequencies, and image amplitude is measured.
Uncertainties
The following characteristics contribute to uncertainties:
DUT marker amplitude resolution
DUT step gain accuracy
DUT log delity
Clean source relative atness
Test Mode
This test is not run in Limited Cal mode.
In Case of Failure
If this test fails, the following modules may need repair or adjustment:
IF section
RF section
6-16
HP 11990A Option 200 System Software Package
Image Response (HP 70600A, HP 70601A)
Image Response (HP 70600A, HP 70601A)
Tested Specification
AMPLITUDE: Spurious Responses: Image Responses
(in the low and preselected bands)
Equipment
Microwave source
Equipment Setup
Note
A low-loss cable such as HP part number 8120-3124 must be used to connect
the microwave source to the spectrum analyzer (DUT).
Setup A: Connect the HP 70900 local oscillator CALIBRATOR output to the HP 70600A or
HP 70601A RF INPUT, to calibrate the preselected front end.
Setup B: Connect the source output to the RF INPUT of the HP 70600A or HP 70601A
preselector.
Description
This test measures image responses for osets of twice the IF frequency from the center
frequency on the spectrum analyzer under test. These osets are 6 MHz, 42.8 MHz, and
642.8 MHz. The ve tuning bands (1H0, 1L0, 2L0, 3L+, 4L+) are tested in the preselected
mode only. For bands 0 to 12.7 GHz, attenuation is set to 10 dB; for bands 12.5 to 22 GHz,
attenuation is set to 0 dB to maximize dynamic range. In the 12.5 to 22 GHz bands, the
preselector is peaked in zero span, then returned to the test span.
An output from the source is applied to the HP 70600A or HP 70601A preselector RF INPUT
and a reference amplitude is obtained. The source frequency is then changed to an oset of
twice the IF frequency, and the peak amplitude is read. The dierence between the reference
amplitude and the peak amplitude equals the image amplitude in dBc. If the test frequency
fails specications, it will be retested in a narrower resolution bandwidth and video bandwidth
to reduce noise contributions.
In Limited Cal mode, the 6 MHz and 42.8 MHz image frequencies are tested only in the
low-pass lter mode, and the 642.8 MHz image frequency is tested in all bands.
Uncertainties
The following characteristics contribute to uncertainties:
Microwave source atness
DUT marker amplitude resolution
DUT step gain error
DUT log delity
HP 11990A Option 200 System Software Package
6-17
Image Response (HP 70600A, HP 70601A)
Test Mode
This test is run in Limited Cal.
In Case of Failure
If this test fails, the following modules may need repair or adjustment:
Preselector
RF section
6-18
HP 11990A Option 200 System Software Package
Multiple Responses (HP 70600A, HP 70601A)
Multiple Responses (HP 70600A, HP 70601A)
(using HP 70902A)
Tested Specification
AMPLITUDE: Spurious Responses: Multiple Responses
(in the low and preselected bands)
Equipment
Microwave source
Equipment Setup
Note
A low-loss cable such as HP part number 8120-3124 must be used to connect
the microwave source to the spectrum analyzer (DUT).
Setup A: Connect the HP 70900 local oscillator CALIBRATOR output to the HP 70600A or
HP 70601A RF INPUT to calibrate the preselected front end.
Setup B: Connect the source to the RF INPUT of the HP 70600A or HP 70601A preselector.
Description
This test measures multiple responses of an HP 71201A microwave spectrum analyzer. All ve
tuning bands (1H0, 1L0, 2L0, 3L+, 4L+) are tested in the preselected mode only. For bands
0 to 12.7 GHz, attenuation is set to 10 dB; for bands 12.5 to 22 GHz, attenuation is set to 0
dB to maximize dynamic range. In the 12.5 to 22 GHz bands, the preselector is peaked in
zero span, then is returned to the test span.
A list of source frequencies is generated that should produce a multiple response
corresponding to a given center frequency. The source frequency is set to the center frequency
and a reference amplitude is obtained. Next, the source frequency is set to frequencies on the
list where a response level is obtained for each of the frequencies. The dierence between
the amplitudes of the reference frequency and the level of each list frequency is the multiple
response amplitude in dBc. If the test results plus the maximum amplitude error due to the
IF response time is close to specication, the multiple response is measured again at a slower
sweep rate to reduce the IF response-time error.
HP 11990A Option 200 System Software Package
6-19
Multiple Responses (HP 70600A, HP 70601A)
Uncertainties
The following characteristics contribute to uncertainties:
Microwave source atness
DUT marker amplitude resolution
DUT step gain error
DUT log delity
The RSS total of these uncertainties is calculated for each measurement.
Test Mode
This test is run in Limited Cal mode.
In Case of Failure
If this test fails, the following modules may need repair or adjustment:
IF section
RF section
Preselector
6-20
HP 11990A Option 200 System Software Package
Displayed Average Noise
Displayed Average Noise
(using HP 70902A or HP 70903A)
Tested Specification
AMPLITUDE: Displayed Average Noise Level
Equipment
50 termination
Equipment Setup
Connect the 50 termination to the spectrum analyzer (DUT) RF INPUT.
Description
The average displayed noise level is measured at the frequency of the displayed peak in each
band, except below 10 MHz where 10 data points are taken.
When the DUT system has an HP 70902A, a resolution bandwidth of 10 Hz and a video
bandwidth of 3 Hz are used. When the DUT system has an HP 70903A, a resolution
bandwidth of 100 kHz and a video bandwidth of 300 Hz are used. A sweep is taken and trace
information is averaged.
Uncertainties
The following characteristics contribute to uncertainties:
DUT marker amplitude resolution
DUT step gain accuracy
DUT log delity
DUT resolution bandwidth amplitude switching accuracy
DUT calibrator amplitude accuracy
DUT RF attenuator switching accuracy
Test Mode
This test is run in Limited Cal mode.
In Case of Failure
If this test fails, the following modules may need repair or adjustment:
Local oscillator
IF section
RF section
Preselector
HP 11990A Option 200 System Software Package
6-21
Residual Responses
(using HP 70902A)
Tested Specification
AMPLITUDE: Spurious Responses: Residual Responses
Equipment
50 termination
Equipment Setup
Connect the 50 termination to the RF INPUT of the spectrum analyzer (DUT).
Description
The input attenuator of the DUT is set to 0 dB. The frequencies at which residual responses
may occur are calculated and the DUT is tuned to these frequencies. The residual product
level is measured.
Uncertainties
The following characteristics contribute to uncertainties:
DUT marker amplitude resolution
DUT step gain accuracy
DUT log delity
DUT resolution bandwidth amplitude switching accuracy
DUT calibrator amplitude accuracy
DUT RF attenuator switching accuracy
Test Mode
This test is run in Limited Cal mode.
In Case of Failure
If this test fails, the following modules may need repair or adjustment:
IF section
RF section
Preselector
6-22
HP 11990A Option 200 System Software Package
Noise Sidebands
Noise Sidebands
(using HP 70902A)
Tested Specification
FREQUENCY: Spectral Purity: Noise Sidebands (dBc/Hz)
Equipment
Clean source
Equipment Setup
Connect the RF OUTPUT of the clean source to the RF INPUT of the spectrum analyzer
(DUT).
Description
HP 70900A: The noise sidebands are measured at 40 oset frequencies from 100 Hz to 1 MHz.
HP 70900B: The noise sidebands are measured at an oset frequency of 10 kHz.
The DUT is set for 0 dB attenuation and a span of 0 Hz. The signal amplitude is adjusted
to the reference level, which is the carrier level. The source carrier frequency is increased by
the amount of oset frequency. The resolution bandwidth of the DUT is set to 3% of the
oset frequency, and the reference level is reduced by 20 dB. A sweep is taken and the data
is averaged. The data is normalized to a 1 Hz bandwidth and corrected for log detection and
noise bandwidth.
Uncertainties
The following characteristics contribute to uncertainties:
DUT marker amplitude resolution
DUT log delity
DUT resolution bandwidth amplitude correction
DUT resolution bandwidth 3 dB accuracy
DUT noise oor error
Clean source phase-noise level
Test Mode
This test is run in Limited Cal mode at 796.12 MHz only.
HP 11990A Option 200 System Software Package
6-23
Noise Sidebands
In Case of Failure
If this test fails, the following modules may need repair or adjustment:
Local oscillator
RF section
Preselector
6-24
HP 11990A Option 200 System Software Package
Line and System Related Sidebands
Line and System Related Sidebands
(using HP 70902A)
Tested Specification
FREQUENCY: Spectral Purity: Line- and system-related sidebands (dBc)
Equipment
Clean source
Equipment Setup
Connect the RF OUTPUT of the clean source to the RF INPUT of the spectrum analyzer
(DUT).
Description
The source is set for an amplitude of 010 dBm. Line- and system-related sidebands are tested
at frequencies of 15, 1200, and 2500 MHz. The signal is peaked on the DUT and set to the
reference level.
The source is then oset by known sideband frequencies, and the sideband level is measured.
Uncertainties
The following characteristics contribute to uncertainties:
DUT marker amplitude resolution
DUT log delity
Test Mode
This test is run in Limited Cal mode at 15 MHz only.
In Case of Failure
If this test fails, the following modules may need repair or adjustment:
Local oscillator
HP 11990A Option 200 System Software Package
6-25
Synthesis Related Sidebands
(using HP 70902A)
Tested Specification
FREQUENCY: Spectral Purity: Synthesis-related sidebands (dBc)
Equipment
Clean source
Equipment Setup
The RF OUTPUT of the clean source is connected to the RF INPUT of the spectrum
analyzer (DUT).
Description
Based on the center frequency tuning equations, the DUT is tuned to frequencies where
synthesis-related sidebands may exist. The source carrier level is measured. Then the source
frequency is increased to place the sideband on-screen, and the sideband level is measured.
Uncertainties
The following characteristics contribute to uncertainties:
DUT marker amplitude resolution
DUT log delity
Test Mode
This test is not run in Limited Cal mode.
In Case of Failure
If this test fails, the following modules may need repair or adjustment:
Local oscillator
6-26
HP 11990A Option 200 System Software Package
Step Gain Accuracy
Step Gain Accuracy
(for HP 70902A or HP 70903A)
Tested Specification
AMPLITUDE ACCURACY: IF Gain Uncertainty
Equipment
Level generator
Voltmeter
Equipment Setup
Connect the 50 output of the level generator to the RF INPUT of the spectrum analyzer
(DUT). Connect the voltmeter to the DUT front-panel VIDEO output.
Description
The spectrum analyzer is set for a reference level and RF attenuator setting that corresponds
to 0 dB IF Gain. The level generator is set to +12 dBm and the voltmeter is read to establish
a reference voltage.
The reference level is then decreased 10 dB. The level-generator output is adjusted, if
necessary, until the reference voltage is reached. The dierence between voltage readings is the
IF gain error. Repeat this for each IF gain step.
Uncertainties
The following characteristics contribute to uncertainties:
Level generator relative amplitude accuracy
Voltmeter ac measurement accuracy
DUT marker amplitude resolution
DUT log scale delity incremental accuracy (corrected)
Test Mode
This test is run in the Limited Cal mode.
In Case of Failure
If this test fails, the following modules may need repair or adjustment:
IF section
HP 11990A Option 200 System Software Package
6-27
Log Fidelity
(for HP 70902A or HP 70903A)
Tested Specification
AMPLITUDE ACCURACY: Scale Fidelity: Log
Equipment
Level generator
Equipment Setup
Connect the 50 output of the level generator to the RF INPUT of the spectrum analyzer
(DUT).
Description
This test measures the relative on-screen log scale delity (that is, the display CRT's upper
eight divisions for the HP 70903A, or upper nine divisions for the HP 70902A).
The DUT is set for a reference level of +10 dBm, span of 0 Hz, and a resolution bandwidth of
100 kHz (HP 70903A) or 100 Hz (HP 70902A). The level-generator frequency is adjusted to
peak the detected signal, and the amplitude is adjusted to set the signal at the reference level.
The dierence between the level generator and marker amplitudes establishes a reference error
at this point.
The level generator is stepped down in 1 dB increments (2 dB in Limited Cal and All Tests
modes) until the signal is 75 to 90 dB below top-screen. The actual level depends on the IF
and RF being tested. In the last 20 dB of the log range, the sweep time is increased to lessen
the eects of the reduced signal-to-noise ratio. The amplitude dierence between the level
generator and the displayed trace average is measured. Once all measurements have been
made, the data is normalized to 010 dB of top-screen. If the HP 70700A digitizer is in the
system, the test is repeated with the digitizer selected.
Uncertainties
The following characteristics contribute to uncertainties:
Level generator relative amplitude accuracy
DUT marker amplitude resolution.
Test Mode
This test is run in Limited Cal mode, and should be run after doing a repair.
In Case of Failure
If this test fails, the following modules may need repair or adjustment:
IF section
6-28
HP 11990A Option 200 System Software Package
Resolution Bandwidth Tests
Resolution Bandwidth Tests
(for HP 70902A or HP 70903A)
Tested Specifications
AMPLITUDE ACCURACY: Resolution Bandwidth Switching Uncertainty
FREQUENCY: Resolution Bandwidths (03 dB), Accuracy
FREQUENCY: Resolution Bandwidths (03 dB), Selectivity
Equipment
Level generator
Equipment Setup
Connect the RF OUTPUT of the level generator to the RF INPUT of the spectrum analyzer
(DUT).
Description
Bandwidth switching variation is tested by setting a reference value at the widest resolution
bandwidth. The DUT resolution bandwidth is then stepped down in a 1, 3, 10 sequence and
the amplitude variation from the widest bandwidth is recorded. The data is then normalized
to the reference bandwidth (100 Hz, HP 70902A; 300 kHz, HP 70903A).
The 3 dB (or 60 dB) points of the resolution bandwidth response are tested as follows.
The DUT is set to the 0 Hz span and the level-generator frequency is adjusted to peak the
response. The level-generator amplitude is then stepped down 3 dB to establish a reference
value. The level- generator amplitude is then returned to the original value and the frequency
is decreased until the 3 dB reference amplitude is reached. This establishes the lower 3 dB
frequency point. The level-generator frequency is then increased until the upper 3 dB point
is found. The dierence in level-generator frequencies is the 3 dB bandwidth. This procedure
may be repeated to determine the 60 dB points of the resolution bandwidth response.
Uncertainties
The following characteristics contribute to uncertainties:
Level generator relative amplitude accuracy
Level generator frequency accuracy
DUT marker amplitude resolution
HP 11990A Option 200 System Software Package
6-29
Resolution Bandwidth Tests
Test Mode
This test is run in Limited Cal mode for some bandwidths.
In Case of Failure
If this test fails, the following modules may need repair or adjustment:
IF section
6-30
HP 11990A Option 200 System Software Package
Linear Fidelity
Linear Fidelity
(for HP 70902A or HP 70903A)
Tested Specification
AMPLITUDE ACCURACY: Scale Fidelity: Linear
Equipment
Level generator
Equipment Setup
The 50 output of the level generator is connected to the RF INPUT of the spectrum
analyzer (DUT).
Description
The HP 70902A test sets the resolution bandwidth to 30 kHz; the HP 70903A test sets the
resolution bandwidth to 1 MHz. The LIN display mode is selected. The level generator is set
to provide a signal near the reference level.
The spectrum analyzer marker is peaked. The reference level is set at the peaked value to
establish a reference at the top of the display.
The level generator is stepped down in 2 dB increments (4 dB for All Tests mode). The
variation between the level-generator amplitude and DUT marker amplitude is measured.
Uncertainties
The following characteristics contribute to uncertainties:
Level generator relative amplitude accuracy
DUT marker amplitude resolution
Test Mode
This test is not run in Limited Cal mode.
In Case of Failure
If this test fails, the following modules may need repair or adjustment:
IF section
HP 11990A Option 200 System Software Package
6-31
7
HP 11990A Option 209 System Software Package
Introduction
The HP 11990A Option 209 System Software package provides all test software required
to verify that an HP 71209A, HP 71209C, or HP 71250C spectrum analyzer meets all of its
major specications. This software package consists of this manual and one test disk (Test
Disk 1). A System Add-On package may be needed to test modules that are not part of a
predened system. For example, although the tracking generator tests are listed in the Test
Menu, these tests are not included in the system software package. The HP 11990A Option
033 System Add-On package contains the tracking generator tests.
Execution of the tests in this system software package is dependent on the HP 11990A Option
001 User Interface program, which automates the test process. Refer to Chapter 2, \Start-Up
Procedures," for instructions to run the test software.
Option 209 Tests
Sweep Time Accuracy : : : : : : : : : : : : : : : : : : : : : : : : : : : : : : : : : : : : : : : : : : : : : : : : : : : : : : : : : 7-3
Calibrator Frequency Accuracy : : : : : : : : : : : : : : : : : : : : : : : : : : : : : : : : : : : : : : : : : : : : : : : : 7-4
Second Harmonic Distortion : : : : : : : : : : : : : : : : : : : : : : : : : : : : : : : : : : : : : : : : : : : : : : : : : : : 7-5
Third Order IMD : : : : : : : : : : : : : : : : : : : : : : : : : : : : : : : : : : : : : : : : : : : : : : : : : : : : : : : : : : : : : : 7-6
Gain Compression : : : : : : : : : : : : : : : : : : : : : : : : : : : : : : : : : : : : : : : : : : : : : : : : : : : : : : : : : : : : : 7-8
Calibrator Amplitude Accuracy : : : : : : : : : : : : : : : : : : : : : : : : : : : : : : : : : : : : : : : : : : : : : : : : 7-9
Frequency Response (HP 70908A) : : : : : : : : : : : : : : : : : : : : : : : : : : : : : : : : : : : : : : : : : : : : 7-10
Frequency Readout Accuracy : : : : : : : : : : : : : : : : : : : : : : : : : : : : : : : : : : : : : : : : : : : : : : : : : 7-12
Frequency Span Accuracy : : : : : : : : : : : : : : : : : : : : : : : : : : : : : : : : : : : : : : : : : : : : : : : : : : : : 7-13
Image Responses : : : : : : : : : : : : : : : : : : : : : : : : : : : : : : : : : : : : : : : : : : : : : : : : : : : : : : : : : : : : : 7-14
Multiple Responses : : : : : : : : : : : : : : : : : : : : : : : : : : : : : : : : : : : : : : : : : : : : : : : : : : : : : : : : : : : 7-16
Displayed Average Noise : : : : : : : : : : : : : : : : : : : : : : : : : : : : : : : : : : : : : : : : : : : : : : : : : : : : : : 7-18
Residual Responses : : : : : : : : : : : : : : : : : : : : : : : : : : : : : : : : : : : : : : : : : : : : : : : : : : : : : : : : : : : 7-19
Noise Sidebands : : : : : : : : : : : : : : : : : : : : : : : : : : : : : : : : : : : : : : : : : : : : : : : : : : : : : : : : : : : : : : 7-20
Line and System Related Sidebands : : : : : : : : : : : : : : : : : : : : : : : : : : : : : : : : : : : : : : : : : : 7-21
Synthesis Related Sidebands : : : : : : : : : : : : : : : : : : : : : : : : : : : : : : : : : : : : : : : : : : : : : : : : : : 7-22
Step Gain Accuracy : : : : : : : : : : : : : : : : : : : : : : : : : : : : : : : : : : : : : : : : : : : : : : : : : : : : : : : : : : 7-23
Log Fidelity : : : : : : : : : : : : : : : : : : : : : : : : : : : : : : : : : : : : : : : : : : : : : : : : : : : : : : : : : : : : : : : : : : 7-24
Resolution Bandwidth Test : : : : : : : : : : : : : : : : : : : : : : : : : : : : : : : : : : : : : : : : : : : : : : : : : : : 7-25
Linear Fidelity : : : : : : : : : : : : : : : : : : : : : : : : : : : : : : : : : : : : : : : : : : : : : : : : : : : : : : : : : : : : : : : 7-27
HP 11990A Option 209 System Software Package
7-1
Test Descriptions
This manual lists and describes all of the tests in this system software package. Pressing the
softkey ALL TESTS invokes execution of the tests in an ecient sequence determined by the
software authors.
The following list explains the information found in this manual under the test names:
\Tested Specication" is the name of the system specication as found in the
\Specications" chapter of the HP 70900 Local Oscillator Installation and Verication
Manual .
\Equipment" lists all external test equipment required by the particular test. Accessories
are not listed. The test will not run if required test equipment is missing.
\Equipment Setup" describes equipment interconnections. A setup screen on the computer
display will also provide instruction. This screen does not appear if the current setup is
complete and correct. The screen presents ABORT and PROCEED softkeys. Pressing ABORT
will display the Test Menu. If the setup is wrong, pressing PROCEED three times will abort
the test and then display the Test Menu.
\Description" provides a brief description of the test.
\Uncertainties" tells what characteristics contribute to measurement uncertainties.
\Test Mode" tells whether the particular test runs in Limited Cal mode and what, if any,
parameter is modied. Mode selection is a Test Menu function. There are six major modes:
Single, Repeat, Multiple, Repeat Multiple, All Tests, and Limited Cal. In any mode other
than Limited Cal, the tests run in their entirety. The following section lists the tests
included in Limited Cal.
\In Case of Failure" tells which modules may need repair or adjustment if the test fails.
NNNNNNNNNNNNNNNNNNNNNNNNNNNNN
NNNNNNNNNNNNNNNNN
NNNNNNNNNNNNNNNNNNNNNNN
NNNNNNNNNNNNNNNNN
NNNNNNNNNNNNNNNNNNNNNNN
Limited Cal Tests
When you press LIMITED CAL in the Test Menu or QUICK TEST in the Main Menu, the
Limited Cal tests are executed in a sequence dened by the software authors. The Limited
Cal tests are listed below in the order that they appear in this manual, not in the order of
execution.
Sweep Time Accuracy
Calibrator Frequency Accuracy
Gain Compression
Calibrator Amplitude Accuracy
Frequency Response
Frequency Span Accuracy
Image Response
Multiple Responses
Displayed Average Noise
Residual Responses
Noise Sidebands
Line and System Related Sidebands
Step Gain Accuracy
Log Fidelity
Resolution Bandwidth Test
NNNNNNNNNNNNNNNNNNNNNNNNNNNNNNNNNNN
7-2
NNNNNNNNNNNNNNNNNNNNNNNNNNNNNNNN
HP 11990A Option 209 System Software Package
Sweep Time Accuracy
Sweep Time Accuracy
(HP 70900A or HP 70900B)
Tested Specification
SWEEP: Sweep Time: Accuracy
Equipment
Universal counter
Equipment Setup
The H SWP output on the rear panel of the HP 70900 local oscillator is connected to the
input of the universal counter. If an HP 70700A digitizer is in the system, the H SWP line
from the HP 70900 must also be connected to the digitizer rear-panel HI SWP connector.
Description
Several dierent spectrum-analyzer sweep times are selected to exercise the hardware fully.
For each selected sweep time, the DUT is set for a span of 0 Hz and a sweep is triggered. The
sweep time is then measured with the universal counter. Sweep times are selected to turn on
each of the 12 bits of the sweep DAC. Only one bit is on at a time except when the lower six
bits are tested; then bit 6 is also on.
If the HP 70700A digitizer is in the system, then its hardware must also be tested. Several
more sweep times are chosen to test: fast sweep times at multiples of the digitizer's clock rate,
worst-case resolution errors, and long sample rates.
Uncertainties
The following characteristics contribute to uncertainties:
Universal counter resolution
Universal counter accuracy
Test Mode
This test runs in the Limited Cal mode, and should be run after doing a repair.
In Case of Failure
If this test fails, the following modules may need repair or adjustment:
Local oscillator
Digitizer
HP 11990A Option 209 System Software Package
7-3
Calibrator Frequency Accuracy
(HP 70900A or HP 70900B)
Tested Specification
FREQUENCY: Frequency Reference Accuracy: Aging
Equipment
Frequency counter
Equipment Setup
The CALIBRATOR output of the HP 70900 is connected to the input of the frequency
counter.
Description
With the spectrum analyzer (DUT) set to its internal frequency reference, the frequency
counter is used to measure the 300 MHz CALIBRATOR frequency.
Uncertainties
The following characteristics contribute to uncertainties:
Frequency counter time-base stability
Test Mode
This test is run in Limited Cal mode.
In Case of Failure
If this test fails, the following modules may need repair or adjustment:
Local oscillator
7-4
HP 11990A Option 209 System Software Package
Second Harmonic Distortion
Second Harmonic Distortion
(using HP 70902A)
Tested Specification
AMPLITUDE: Spurious Responses: Second Harmonic Distortion
Equipment
Level generator
12 MHz low-pass lter
Equipment Setup
Connect the 50 output of the level generator through a 12 MHz low-pass lter to the RF
INPUT of the spectrum analyzer (DUT).
Description
The second harmonic distortion of the DUT is measured at 9 and 11 MHz. The DUT
auto-zoom function is used to tune the level-generator signal in a 50 Hz span. Carrier
amplitude and frequency are measured. The DUT center frequency is then tuned to the
second harmonic, and the amplitude of the internally generated second harmonic is measured.
Uncertainties
The following characteristics contribute to uncertainties:
DUT marker amplitude resolution
DUT atness
DUT log delity
DUT calibrator amplitude accuracy
Test Mode
This test is not run in Limited Cal mode.
In Case of Failure
If this test fails, the following modules may need repair or adjustment:
IF section
RF section
HP 11990A Option 209 System Software Package
7-5
Third Order IMD
(HP 70902A or HP 70903A)
Tested Specification
AMPLITUDE: Spurious Responses: Third-Order Intermodulation Distortion
Equipment
Level generator
General source
50 MHz low-pass lter
Directional bridge
Equipment Setup
Connect the common port of the directional bridge to the RF INPUT of the DUT. Connect
the 50 output of the level generator through a 50 MHz low-pass lter to one of the unused
directional-bridge connectors. Connect the RF OUTPUT of the general source to another
unused directional-bridge connector.
Description
The third-order intermodulation (TOI) of the DUT is measured at approximately 45 MHz
using the 3 kHz resolution bandwidth (100 kHz in the HP 70903A). It is tested at several
signal separations.
First, the amplitude of the general-source output is measured to establish the TOI reference
amplitude level. Then the amplitude of the level-generator output is measured to establish the
signal level. The upper third-order-product signal level is then measured, and the equivalent
TOI is calculated as follows:
(TOI reference ampl:) 0 (third0order ampl:) [(signal level) 0 (DUT input atten: setting)] +
2
This procedure is repeated for the lower TOI product. The smaller value of the equivalent
TOI is retained.
Uncertainties
The following characteristics contribute to uncertainties:
Level generator relative amplitude accuracy
DUT absolute frequency response referenced to 300 MHz
DUT marker amplitude resolution
DUT calibrator amplitude accuracy
DUT resolution bandwidth amplitude switching
DUT log delity
7-6
HP 11990A Option 209 System Software Package
Third Order IMD
Test Mode
This test is not run in Limited Cal mode.
In Case of Failure
If this test fails, the following modules may need repair or adjustment:
IF section
RF section
HP 11990A Option 209 System Software Package
7-7
Gain Compression
(using HP 70902A or HP 70903A)
Tested Specification
AMPLITUDE: Gain Compression
Equipment
Level generator
Measurement receiver
Sensor module
Equipment Setup
The level generator is connected to the RF INPUT of the spectrum analyzer (DUT). The
sensor-module output is connected to the measurement receiver. The sensor-module input is
connected to the front-panel IF OUTPUT on the HP 70902A or HP 70903A.
Description
The level generator is set to produce a signal within the range of the DUT. The DUT is tuned
to this signal, and the input attenuator is set to 10 dB. The DUT is set to zero span and the
level generator is tuned to the center of the DUT passband.
The amplitude of the level generator is adjusted until a signal of 030 dBm or less is at the
DUT input mixer. The measurement receiver then measures signal path gain; this value is
used as the reference for no gain compression.
The level-generator amplitude is increased to produce a signal of 010 dBm at the DUT input
mixer. The measurement receiver again measures signal path gain. The dierence between the
two gain measurements is the gain compression.
Uncertainties
The following characteristics contribute to uncertainties:
Level generator relative amplitude accuracy
Measurement receiver relative accuracy
Test Mode
This test is run in Limited Cal mode.
In Case of Failure
If this test fails, the following modules may need repair or adjustment:
IF section
RF section
7-8
HP 11990A Option 209 System Software Package
Calibrator Amplitude Accuracy
Calibrator Amplitude Accuracy
(HP 70900A or HP 70900B)
Tested Specification
AMPLITUDE ACCURACY: Calibrator Uncertainty
Equipment
Power meter
RF power sensor or microwave power sensor
Equipment Setup
Connect the power sensor to the spectrum analyzer (DUT) CALIBRATOR output connector.
Description
After zeroing and calibrating the power meter, the power sensor is connected to the DUT
CALIBRATOR output. The calibrator amplitude is measured and corrected using the
calibration factor of the power sensor.
Uncertainties
The following characteristics contribute to uncertainties:
Power meter accuracy
Mismatch between power sensor and CALIBRATOR output connector
Test Mode
This test is run in Limited Cal mode.
In Case of Failure
If this test fails, the following modules may need repair or adjustment:
Local oscillator
HP 11990A Option 209 System Software Package
7-9
Frequency Response (HP 70908A)
Tested Specification
AMPLITUDE ACCURACY: Frequency Response
Equipment
Microwave source
Level generator (not needed for Limited Cal)
Power meter
Microwave power sensor
Power splitter
Equipment Setup
A low-loss cable such as HP part number 8120-3124 must be used to connect
the microwave source to the spectrum analyzer (DUT).
Note
Connect the RF OUTPUT of the microwave source to the input port of the power splitter.
Connect one output of the power splitter to the RF INPUT of the DUT. With the power
splitter connected to the power meter, connect the other output of the power splitter to the
power sensor.
For frequencies less than 50 MHz, connect the OUTPUT of the level generator to the RF
INPUT of the DUT.
Description
The power meter is calibrated. The input attenuator of the DUT is set to 10 dB. The
microwave source output level is adjusted for a power-meter reading of 010 dBm at 300 MHz.
The DUT marker amplitude is read to establish a reference. A minimum of 30 measurements
are made in each frequency band above 50 MHz.
For frequencies less than 50 MHz, frequency response is measured with the level generator.
The level-generator output level is adjusted to produce the same DUT marker amplitude as
that using the previous setup.
The frequency response data is available in graph mode.
7-10
HP 11990A Option 209 System Software Package
Frequency Response (HP 70908A)
Uncertainties
The following characteristics contribute to uncertainties:
All Frequencies
DUT marker amplitude resolution
Frequencies >50 MHz
Power splitter tracking
Power meter accuracy
Mismatch between DUT and power splitter
Mismatch between power sensor and power splitter
Frequencies <50 MHz
Level generator atness
Mismatch between DUT and level generator
Test Mode
This test is run in Limited Cal mode for frequencies greater than 50 MHz.
In Case of Failure
If this test fails, the following modules may need repair or adjustment:
RF section
HP 11990A Option 209 System Software Package
7-11
Frequency Readout Accuracy
Tested Specification
FREQUENCY: Frequency Readout Accuracy
Equipment
Synthesized source
Equipment Setup
Connect the RF OUTPUT of the synthesized source to the spectrum analyzer (DUT) RF
INPUT.
Description
Frequency readout accuracy is tested at a maximum of eight frequencies and four spans. For
each span and source frequency, the frequency readout of the DUT is compared to that of
a synthesized source. The source is set to the selected center frequency of the DUT. The
signal is marker-peaked. The deviation between the marker frequency readout and the center
frequency is the frequency error. This test is performed with the DUT referenced to the
internal frequency reference.
If the signal amplitude is close to the noise level due to a cable that has a large amount of
signal loss, the measurement is not recorded.
If the HP 70700A digitizer is in the system, the entire test is repeated with the external
digitizer selected. In addition, extra frequencies are selected to check the area of band
crossings in microwave systems.
Uncertainties
The following characteristics contribute to uncertainties:
Synthesized source time-base accuracy
DUT marker frequency accuracy
Test Mode
This test is not run in the Limited Cal mode.
In Case of Failure
If this test fails, the following modules may need repair or adjustment:
Local oscillator
Digitizer
7-12
HP 11990A Option 209 System Software Package
Frequency Span Accuracy
Frequency Span Accuracy
Tested Specification
FREQUENCY: Frequency Span: Accuracy
Equipment
Synthesized source
Equipment Setup
Connect the RF OUTPUT of the synthesized source to the spectrum analyzer (DUT) RF
INPUT.
Description
The DUT center frequency is set to 1.5 GHz, and spans of 10 kHz, 100 kHz, 1 MHz, 10 MHz,
10.01 MHz, 101 MHz, and 1.01 GHz are tested. The synthesizer frequency is adjusted until
a signal appears near the left edge of the display. The frequency of this point and several
other points in the span are noted by using marker peak. The deviation between the marker
frequency and the synthesizer frequency is the absolute error. The maximum frequency span
error is calculated by taking the dierence between the maximum and minimum absolute
errors.
This test is performed with the DUT referenced to the internal frequency reference.
If the HP 70700A digitizer is in the system, the test is repeated with the external digitizer
selected.
Uncertainties
The following characteristics contribute to uncertainties:
Synthesized source time-base accuracy
DUT marker frequency accuracy
Test Mode
A limited version of this test runs in the Limited Cal mode, and should be run after doing a
repair.
In Case of Failure
If this test fails, the following modules may need repair or adjustment:
Local oscillator
Digitizer
HP 11990A Option 209 System Software Package
7-13
Image Responses
(using HP 70902A)
Tested Specification
AMPLITUDE: Spurious Responses: Image Responses
(in the low and preselected bands)
Equipment
Microwave source
Equipment Setup
A low-loss cable such as HP part number 8120-3124 must be used to connect
the microwave source to the spectrum analyzer (DUT).
Note
Setup A: Connect the HP 70900 local oscillator CALIBRATOR output to the HP 70908A RF
INPUT, to calibrate the preselected front end.
Setup B: Connect the source output to the RF INPUT of the HP 70908A RF section.
Description
This test measures image responses for osets of twice the IF frequency from the center
frequency on the spectrum analyzer under test. These osets are 6 MHz, 42.8 MHz, and
642.8 MHz. All four tuning bands (1H0, 1L0, 2L0, 4L0) are tested.
An output from the source is applied to the HP 70908A RF INPUT and a reference amplitude
is obtained. The source frequency is then changed to an oset of twice the IF frequency, and
the peak amplitude is read. The dierence between the reference amplitude and the peak
amplitude equals the image amplitude in dBc. If the test frequency fails specications, it
will be retested in a narrower resolution bandwidth and video bandwidth to reduce noise
contributions.
Uncertainties
The following characteristics contribute to uncertainties:
Microwave source atness
DUT marker amplitude resolution
DUT step gain error
DUT log delity
7-14
HP 11990A Option 209 System Software Package
Image Responses
Test Mode
This test is run in Limited Cal mode.
In Case of Failure
If this test fails, the following modules may need repair or adjustment:
RF section
HP 11990A Option 209 System Software Package
7-15
Multiple Responses
(using HP 70902A)
Tested Specification
AMPLITUDE: Spurious Responses: Multiple Responses
(in the low and preselected bands)
Equipment
Microwave source
Equipment Setup
A low-loss cable such as HP part number 8120-3124 must be used to connect
the microwave source to the spectrum analyzer (DUT).
Note
Setup A: Connect the HP 70900 local oscillator CALIBRATOR output to the HP 70908A RF
INPUT to calibrate the preselected front end.
Setup B: Connect the source to the RF INPUT of the HP 70908A RF section.
Description
This test measures multiple responses of an HP 71210 spectrum analyzer. All four tuning
bands (1H0, 1L0, 2L0, 4L0) are tested.
A list of source frequencies is generated that should produce a multiple response
corresponding to a given center frequency. The source frequency is set to the center frequency
and a reference amplitude is obtained. Next, the source frequency is set to frequencies on the
list where a response level is obtained for each of the frequencies. The dierence between the
amplitudes of the reference frequency and the level of each listed frequency is the multiple
response amplitude in dBc. If the test results plus the maximum amplitude error due to the
IF response time are close to specication, the multiple response is measured again at a slower
sweep rate to reduce the IF response-time error.
In single mode, the center frequency is stepped up in 500 MHz increments. In all other test
modes, it is stepped up in 1 GHz increments (27 measurements).
7-16
HP 11990A Option 209 System Software Package
Multiple Responses
Uncertainties
The following characteristics contribute to uncertainties:
Microwave source atness
DUT marker amplitude resolution
DUT step gain error
DUT log delity
The RSS total of these uncertainties is calculated for each measurement.
Test Mode
This test is run in Limited Cal mode.
In Case of Failure
If this test fails, the following modules may need repair or adjustment:
IF section
RF section
HP 11990A Option 209 System Software Package
7-17
Displayed Average Noise
(using HP 70902A or HP 70903A)
Tested Specification
AMPLITUDE: Displayed Average Noise Level
Equipment
50 termination
Equipment Setup
Connect the 50 termination to the spectrum analyzer (DUT) RF INPUT.
Description
The average displayed noise level is measured at the frequency of the displayed peak in each
band, except below 10 MHz where 10 data points are taken.
When the DUT system has an HP 70902A, a resolution bandwidth of 10 Hz and a video
bandwidth of 3 Hz are used. When the DUT system has an HP 70903A, a resolution
bandwidth of 100 kHz and a video bandwidth of 300 Hz are used. A sweep is taken and trace
information is averaged.
Uncertainties
The following characteristics contribute to uncertainties:
DUT marker amplitude resolution
DUT step gain accuracy
DUT log delity
DUT resolution bandwidth amplitude switching accuracy
DUT calibrator amplitude accuracy
DUT RF attenuator switching accuracy
Test Mode
This test is run in Limited Cal mode.
In Case of Failure
If this test fails, the following modules may need repair or adjustment:
Local oscillator
IF section
RF section
7-18
HP 11990A Option 209 System Software Package
Residual Responses
Residual Responses
(using HP 70902A)
Tested Specification
AMPLITUDE: Spurious Responses: Residual Responses
Equipment
50 termination
Equipment Setup
Connect the 50 termination to the RF INPUT of the spectrum analyzer (DUT).
Description
The input attenuator of the DUT is set to 0 dB. The frequencies at which residual responses
may occur are calculated and the DUT is tuned to these frequencies. The residual product
level is measured.
Uncertainties
The following characteristics contribute to uncertainties:
DUT marker amplitude resolution
DUT step gain accuracy
DUT log delity
DUT resolution bandwidth amplitude switching accuracy
DUT calibrator amplitude accuracy
DUT RF attenuator switching accuracy
Test Mode
This test is run in Limited Cal mode.
In Case of Failure
If this test fails, the following modules may need repair or adjustment:
IF section
RF section
HP 11990A Option 209 System Software Package
7-19
Noise Sidebands
(using HP 70902A)
Tested Specification
FREQUENCY: Spectral Purity: Noise Sidebands (dBc/Hz)
Equipment
Clean source
Equipment Setup
Connect the RF OUTPUT of the clean source to the RF INPUT of the spectrum analyzer
(DUT).
Description
HP 70900A: The noise sidebands are measured at 40 oset frequencies from 100 Hz to 1 MHz.
HP 70900B: The noise sidebands are measured at an oset frequency of 10 kHz.
The DUT is set for 0 dB attenuation and a span of 0 Hz. The signal amplitude is adjusted
to the reference level, which is the carrier level. The source carrier frequency is increased by
the amount of oset frequency. The resolution bandwidth of the DUT is set to 3% of the
oset frequency, and the reference level is reduced by 20 dB. A sweep is taken and the data
is averaged. The data is normalized to a 1 Hz bandwidth and corrected for log detection and
noise bandwidth.
Uncertainties
The following characteristics contribute to uncertainties:
DUT marker amplitude resolution
DUT log delity
DUT resolution bandwidth amplitude correction
DUT resolution bandwidth 3 dB accuracy
DUT noise oor error
Clean source phase-noise level
Test Mode
This test is run in Limited Cal mode at 796.12 MHz only.
In Case of Failure
If this test fails, the following modules may need repair or adjustment:
Local oscillator
RF section
7-20
HP 11990A Option 209 System Software Package
Line and System Related Sidebands
Line and System Related Sidebands
(using HP 70902A)
Tested Specification
FREQUENCY: Spectral Purity: Line- and system-related sidebands (dBc)
Equipment
Clean source
Equipment Setup
Connect the RF OUTPUT of the clean source to the RF INPUT of the spectrum analyzer
(DUT).
Description
The source is set for an amplitude of 010 dBm. Line- and system-related sidebands are tested
at frequencies of 15, 1200, and 2500 MHz. The signal is peaked on the DUT and set to the
reference level.
The source is then oset by known sideband frequencies, and the sideband level is measured.
Uncertainties
The following characteristics contribute to uncertainties:
DUT marker amplitude resolution
DUT log delity
Test Mode
This test is run in Limited Cal mode at 15 MHz only.
In Case of Failure
If this test fails, the following modules may need repair or adjustment:
Local oscillator
HP 11990A Option 209 System Software Package
7-21
Synthesis Related Sidebands
(using HP 70902A)
Tested Specification
FREQUENCY: Spectral Purity: Synthesis-related sidebands (dBc)
Equipment
Clean source
Equipment Setup
The RF OUTPUT of the clean source is connected to the RF INPUT of the spectrum
analyzer (DUT).
Description
Based on the center frequency tuning equations, the DUT is tuned to frequencies where
synthesis-related sidebands may exist. The source carrier level is measured. Then the source
frequency is increased to place the sideband on-screen, and the sideband level is measured.
Uncertainties
The following characteristics contribute to uncertainties:
DUT marker amplitude resolution
DUT log delity
Test Mode
This test is not run in Limited Cal mode.
In Case of Failure
If this test fails, the following modules may need repair or adjustment:
Local oscillator
7-22
HP 11990A Option 209 System Software Package
Step Gain Accuracy
Step Gain Accuracy
(for HP 70902A or HP 70903A)
Tested Specification
AMPLITUDE ACCURACY: IF Gain Uncertainty
Equipment
Level generator
Voltmeter
Equipment Setup
Connect the 50 output of the level generator to the RF INPUT of the spectrum analyzer
(DUT). Connect the voltmeter to the DUT front-panel VIDEO output.
Description
The spectrum analyzer is set for a reference level and RF attenuator setting that corresponds
to 0 dB IF Gain. The level generator is set to +12 dBm and the voltmeter is read to establish
a reference voltage.
The reference level is then decreased 10 dB. The level-generator output is adjusted, if
necessary, until the reference voltage is reached. The dierence between voltage readings is the
IF gain error. Repeat this for each IF gain step.
Uncertainties
The following characteristics contribute to uncertainties:
Level generator relative amplitude accuracy
Voltmeter ac measurement accuracy
DUT marker amplitude resolution
DUT log scale delity incremental accuracy (corrected).
Test Mode
This test is run in the Limited Cal mode.
In Case of Failure
If this test fails, the following modules may need repair or adjustment:
IF section
HP 11990A Option 209 System Software Package
7-23
Log Fidelity
(for HP 70902A or HP 70903A)
Tested Specification
AMPLITUDE ACCURACY: Scale Fidelity: Log
Equipment
Level generator
Equipment Setup
Connect the 50 output of the level generator to the RF INPUT of the spectrum analyzer
(DUT).
Description
This test measures the relative on-screen log scale delity (that is, the display CRT's upper
eight divisions for the HP 70903A, or upper nine divisions for the HP 70902A).
The DUT is set for a reference level of +10 dBm, span of 0 Hz, and a resolution bandwidth of
100 kHz (HP 70903A) or 100 Hz (HP 70902A). The level-generator frequency is adjusted to
peak the detected signal, and the amplitude is adjusted to set the signal at the reference level.
The dierence between the level generator and marker amplitudes establishes a reference error
at this point.
The level generator is stepped down in 1 dB increments (2 dB in Limited Cal and All Tests
modes) until the signal is 75 to 90 dB below top-screen. The actual level depends on the IF
and RF being tested. In the last 20 dB of the log range, the sweep time is increased to lessen
the eects of the reduced signal-to-noise ratio. The amplitude dierence between the level
generator and the displayed trace average is measured. Once all measurements have been
made, the data is normalized to 010 dB of top-screen.
If the HP 70700A digitizer is in the system, the test is repeated with the digitizer selected.
Uncertainties
The following characteristics contribute to uncertainties:
Level generator relative amplitude accuracy
DUT marker amplitude resolution
Test Mode
This test is run in Limited Cal mode, and should be run after doing a repair.
In Case of Failure
If this test fails, the following modules may need repair or adjustment:
IF section
7-24
HP 11990A Option 209 System Software Package
Resolution Bandwidth Test
Resolution Bandwidth Test
(for HP 70902A or HP 70903A)
Tested Specifications
AMPLITUDE ACCURACY: Resolution Bandwidth Switching Uncertainty
FREQUENCY: Resolution Bandwidths (03 dB), Accuracy
FREQUENCY: Resolution Bandwidths (03 dB), Selectivity
Equipment
Level generator
Equipment Setup
Connect the RF OUTPUT of the level generator to the RF INPUT of the spectrum analyzer
(DUT).
Description
Bandwidth switching variation is tested by setting a reference value at the widest resolution
bandwidth. The DUT resolution bandwidth is then stepped down in a 1, 3, 10 sequence and
the amplitude variation from the widest bandwidth is recorded. The data is then normalized
to the reference bandwidth (100 Hz, HP 70902A; 300 kHz, HP 70903A).
The 3 dB (or 60 dB) points of the resolution bandwidth response are tested as follows.
The DUT is set to the 0 Hz span and the level-generator frequency is adjusted to peak the
response. The level-generator amplitude is then stepped down 3 dB to establish a reference
value. The level- generator amplitude is then returned to the original value and the frequency
is decreased until the 3 dB reference amplitude is reached. This establishes the lower 3 dB
frequency point. The level-generator frequency is then increased until the upper 3 dB point
is found. The dierence in level-generator frequencies is the 3 dB bandwidth. This procedure
may be repeated to determine the 60 dB points of the resolution bandwidth response.
Uncertainties
The following characteristics contribute to uncertainties:
Level generator relative amplitude accuracy
Level generator frequency accuracy
DUT marker amplitude resolution
HP 11990A Option 209 System Software Package
7-25
Resolution Bandwidth Test
Test Mode
This test is run in Limited Cal mode for some bandwidths.
In Case of Failure
If this test fails, the following modules may need repair or adjustment:
IF section
7-26
HP 11990A Option 209 System Software Package
Linear Fidelity
Linear Fidelity
(for HP 70902A or HP 70903A)
Tested Specification
AMPLITUDE ACCURACY: Scale Fidelity: Linear
Equipment
Level generator
Equipment Setup
The 50 output of the level generator is connected to the RF INPUT of the spectrum
analyzer (DUT).
Description
The HP 70902A test sets the resolution bandwidth to 30 kHz; the HP 70903A test sets the
resolution bandwidth to 1 MHz. The LIN display mode is selected. The level generator is set
to provide a signal near the reference level.
The spectrum analyzer marker is peaked. The reference level is set at the peaked value to
establish a reference at the top of the display.
The level generator is stepped down in 2 dB increments (4 dB for All Tests mode). The
variation between the level-generator amplitude and DUT marker amplitude is measured.
Uncertainties
The following characteristics contribute to uncertainties:
Level generator relative amplitude accuracy.
DUT marker amplitude resolution
Test Mode
This test is not run in Limited Cal mode.
In Case of Failure
If this test fails, the following modules may need repair or adjustment:
IF section
HP 11990A Option 209 System Software Package
7-27
Bandwidth
(for HP 70910A)
Tested Specification
OUTPUT: 321.4 MHz Output (rear-panel); 3 dB bandwidth
Equipment
Microwave source
Spectrum analyzer
Frequency reference
Power meter
Microwave power sensor
Equipment Setup
The microwave source is connected to the HP 70910A RF INPUT port. The RF or microwave
power sensor is connected to the rear-panel 321.4 MHz output port on the HP 70910A. The
microwave source and the spectrum analyzer containing the HP 70910A must share a common
frequency reference.
Description
The spectrum analyzer is tuned to the test frequency with a span of 0 Hz. The microwave
source is tuned to the same CW frequency at a specied amplitude. The preselector lter
in the HP 70910A is peaked, then the power at the rear-panel 321.4 MHz output port is
measured with the power sensor. The source is tuned to a point on the skirt of the preselector
lter dened by the oset frequency. While monitoring the power out the rear-panel 321.4
MHz port with the power sensor, the source is adjusted to the 03 dB point and the source
frequency is saved. This routine is repeated for the other side of the lter. The 3 dB
bandwidth is calculated by subtracting the frequency of the lower 3 dB point from the upper
3 dB point. The 3 dB bandwidth is checked at ten dierent center frequencies, then the
measurement error is subtracted from the bandwidth and is compared against the module
specication.
Uncertainties
The following characteristics contribute to uncertainties:
Power meter error
Mismatch error
7-28
HP 11990A Option 209 System Software Package
Bandwidth
Test Mode
This test is run in Limited Cal mode and should be run after the module has been repaired.
In Case of Failure
Verify the microwave source, spectrum analyzer, and DUT all share a common frequency
reference.
Verify alignment of the HP 70910A RF section preselector.
HP 11990A Option 209 System Software Package
7-29
Local Oscillator (LO) Output Amplitude
Tested Specification
OUTPUT: HP 70909A or HP 70910A LO Output (front panel)
Equipment
Power meter
Microwave power sensor
Equipment Setup
Setup A: If necessary, connect the microwave power sensor to the POWER REF OUTPUT of
the power meter for calibration.
Setup B: Connect the microwave power sensor to the LO OUTPUT of the HP 70909A or
HP 70910A.
Description
This test measures the output power that is available from the LO OUTPUT of the
HP 70909A or HP 70910A (front panel) over the full tuning range of the HP 70900A/B local
oscillator (3.0 to 6.0 GHz). The measurement is made using the microwave power sensor with
the system set to zero span.
Uncertainties
The following characteristics contribute to uncertainties:
Mismatch error
Power meter error
Test Mode
This test is performed in Limited Cal mode.
In Case of Failure
Check the test setup. Make sure the appropriate correction factors are applied for the power
sensor that is being used.
Check for any errors that are reported by the system. If any errors are reported, determine
which module is reporting the error(s). Most probable cause of failure for this test is the
HP 70909A or HP 70910A.
7-30
HP 11990A Option 209 System Software Package
8
HP 11990A Option 210 System Software Package
Introduction
The HP 11990A Option 210 System Software package provides all test software required
to verify that an HP 71210A, HP 71210C, or HP 71250C spectrum analyzer meets all of its
major specications. This software package consists of this manual and one test disk (Test
Disk 1). A System Add-On package may be needed to test modules that are not part of a
predened system. For example, although the tracking generator tests are listed in the Test
Menu, these tests are not included in the system software package. The HP 11990A Option
033 System Add-On package contains the tracking generator tests.
Execution of the tests in this system software package is dependent on the HP 11990A Option
001 User Interface program, which automates the test process. Refer to Chapter 2, \Start-Up
Procedures," for instructions to run the test software.
Option 210 Tests
Sweep Time Accuracy : : : : : : : : : : : : : : : : : : : : : : : : : : : : : : : : : : : : : : : : : : : : : : : : : : : : : : : : : 8-3
Calibrator Frequency Accuracy : : : : : : : : : : : : : : : : : : : : : : : : : : : : : : : : : : : : : : : : : : : : : : : : 8-4
Second Harmonic Distortion : : : : : : : : : : : : : : : : : : : : : : : : : : : : : : : : : : : : : : : : : : : : : : : : : : : 8-5
Third Order IMD : : : : : : : : : : : : : : : : : : : : : : : : : : : : : : : : : : : : : : : : : : : : : : : : : : : : : : : : : : : : : : 8-6
Gain Compression : : : : : : : : : : : : : : : : : : : : : : : : : : : : : : : : : : : : : : : : : : : : : : : : : : : : : : : : : : : : : 8-8
Calibrator Amplitude Accuracy : : : : : : : : : : : : : : : : : : : : : : : : : : : : : : : : : : : : : : : : : : : : : : : : 8-9
Frequency Response (HP 70908A) : : : : : : : : : : : : : : : : : : : : : : : : : : : : : : : : : : : : : : : : : : : : 8-10
Frequency Readout Accuracy : : : : : : : : : : : : : : : : : : : : : : : : : : : : : : : : : : : : : : : : : : : : : : : : : 8-12
Frequency Span Accuracy : : : : : : : : : : : : : : : : : : : : : : : : : : : : : : : : : : : : : : : : : : : : : : : : : : : : 8-13
Image Responses : : : : : : : : : : : : : : : : : : : : : : : : : : : : : : : : : : : : : : : : : : : : : : : : : : : : : : : : : : : : : 8-14
Multiple Responses : : : : : : : : : : : : : : : : : : : : : : : : : : : : : : : : : : : : : : : : : : : : : : : : : : : : : : : : : : : 8-16
Displayed Average Noise : : : : : : : : : : : : : : : : : : : : : : : : : : : : : : : : : : : : : : : : : : : : : : : : : : : : : : 8-18
Residual Responses : : : : : : : : : : : : : : : : : : : : : : : : : : : : : : : : : : : : : : : : : : : : : : : : : : : : : : : : : : : 8-19
Noise Sidebands : : : : : : : : : : : : : : : : : : : : : : : : : : : : : : : : : : : : : : : : : : : : : : : : : : : : : : : : : : : : : : 8-20
Line and System Related Sidebands : : : : : : : : : : : : : : : : : : : : : : : : : : : : : : : : : : : : : : : : : : 8-21
Synthesis Related Sidebands : : : : : : : : : : : : : : : : : : : : : : : : : : : : : : : : : : : : : : : : : : : : : : : : : : 8-22
Step Gain Accuracy : : : : : : : : : : : : : : : : : : : : : : : : : : : : : : : : : : : : : : : : : : : : : : : : : : : : : : : : : : 8-23
Log Fidelity : : : : : : : : : : : : : : : : : : : : : : : : : : : : : : : : : : : : : : : : : : : : : : : : : : : : : : : : : : : : : : : : : : 8-24
Resolution Bandwidth Test : : : : : : : : : : : : : : : : : : : : : : : : : : : : : : : : : : : : : : : : : : : : : : : : : : : 8-25
Linear Fidelity : : : : : : : : : : : : : : : : : : : : : : : : : : : : : : : : : : : : : : : : : : : : : : : : : : : : : : : : : : : : : : : 8-27
HP 11990A Option 210 System Software Package
8-1
Test Descriptions
This manual lists and describes all of the tests in this system software package. Pressing the
softkey ALL TESTS invokes execution of the tests in an ecient sequence determined by the
software authors.
The following list explains the information found in this manual under the test names:
\Tested Specication" is the name of the system specication as found in the
\Specications" chapter of the HP 70900 Local Oscillator Installation and Verication
Manual .
\Equipment" lists all external test equipment required by the particular test. Accessories
are not listed. The test will not run if required test equipment is missing.
\Equipment Setup" describes equipment interconnections. A setup screen on the computer
display will also provide instruction. This screen does not appear if the current setup is
complete and correct. The screen presents ABORT and PROCEED softkeys. Pressing ABORT
will display the Test Menu. If the setup is wrong, pressing PROCEED three times will abort
the test and then display the Test Menu.
\Description" provides a brief description of the test.
\Uncertainties" tells what characteristics contribute to measurement uncertainties.
\Test Mode" tells whether the particular test runs in Limited Cal mode and what, if any,
parameter is modied. Mode selection is a Test Menu function. There are six major modes:
Single, Repeat, Multiple, Repeat Multiple, All Tests, and Limited Cal. In any mode other
than Limited Cal, the tests run in their entirety. The following section lists the tests
included in Limited Cal.
\In Case of Failure" tells which modules may need repair or adjustment if the test fails.
NNNNNNNNNNNNNNNNNNNNNNNNNNNNN
NNNNNNNNNNNNNNNNN
NNNNNNNNNNNNNNNNNNNNNNN
NNNNNNNNNNNNNNNNN
NNNNNNNNNNNNNNNNNNNNNNN
Limited Cal Tests
When you press LIMITED CAL in the Test Menu or QUICK TEST in the Main Menu, the
Limited Cal tests are executed in a sequence dened by the software authors. The Limited
Cal tests are listed below in the order that they appear in this manual, not in the order of
execution.
Sweep Time Accuracy
Calibrator Frequency Accuracy
Gain Compression
Calibrator Amplitude Accuracy
Frequency Response
Frequency Span Accuracy
Image Response
Multiple Responses
Displayed Average Noise
Residual Responses
Noise Sidebands
Line and System Related Sidebands
Step Gain Accuracy
Log Fidelity
Resolution Bandwidth Test
NNNNNNNNNNNNNNNNNNNNNNNNNNNNNNNNNNN
8-2
NNNNNNNNNNNNNNNNNNNNNNNNNNNNNNNN
HP 11990A Option 210 System Software Package
Sweep Time Accuracy
Sweep Time Accuracy
(HP 70900A or HP 70900B)
Tested Specification
SWEEP: Sweep Time: Accuracy
Equipment
Universal counter
Equipment Setup
The H SWP output on the rear panel of the HP 70900 local oscillator is connected to the
input of the universal counter. If an HP 70700A digitizer is in the system, the H SWP line
from the HP 70900 must also be connected to the digitizer rear-panel HI SWP connector.
Description
Several dierent spectrum-analyzer sweep times are selected to exercise the hardware fully.
For each selected sweep time, the DUT is set for a span of 0 Hz and a sweep is triggered. The
sweep time is then measured with the universal counter. Sweep times are selected to turn on
each of the 12 bits of the sweep DAC. Only one bit is on at a time except when the lower six
bits are tested; then bit 6 is also on.
If the HP 70700A digitizer is in the system, then its hardware must also be tested. Several
more sweep times are chosen to test: fast sweep times at multiples of the digitizer's clock rate,
worst-case resolution errors, and long sample rates.
Uncertainties
The following characteristics contribute to uncertainties:
Universal counter resolution
Universal counter accuracy
Test Mode
This test runs in the Limited Cal mode, and should be run after doing a repair.
In Case of Failure
If this test fails, the following modules may need repair or adjustment:
Local oscillator
Digitizer
HP 11990A Option 210 System Software Package
8-3
Calibrator Frequency Accuracy
(HP 70900A or HP 70900B)
Tested Specification
FREQUENCY: Frequency Reference Accuracy: Aging
Equipment
Frequency counter
Equipment Setup
The CALIBRATOR output of the HP 70900 is connected to the input of the frequency
counter.
Description
With the spectrum analyzer (DUT) set to its internal frequency reference, the frequency
counter is used to measure the 300 MHz CALIBRATOR frequency.
Uncertainties
The following characteristics contribute to uncertainties:
Frequency counter time-base stability
Test Mode
This test is run in Limited Cal mode.
In Case of Failure
If this test fails, the following modules may need repair or adjustment:
Local oscillator
8-4
HP 11990A Option 210 System Software Package
Second Harmonic Distortion
Second Harmonic Distortion
(using HP 70902A)
Tested Specification
AMPLITUDE: Spurious Responses: Second Harmonic Distortion
Equipment
Level generator
12 MHz low-pass lter
Equipment Setup
Connect the 50 output of the level generator through a 12 MHz low-pass lter to the RF
INPUT of the spectrum analyzer (DUT).
Description
The second harmonic distortion of the DUT is measured at 9 and 11 MHz. The DUT
auto-zoom function is used to tune the level-generator signal in a 50 Hz span. Carrier
amplitude and frequency are measured. The DUT center frequency is then tuned to the
second harmonic, and the amplitude of the internally generated second harmonic is measured.
Uncertainties
The following characteristics contribute to uncertainties:
DUT marker amplitude resolution
DUT atness
DUT log delity
DUT calibrator amplitude accuracy
Test Mode
This test is not run in Limited Cal mode.
In Case of Failure
If this test fails, the following modules may need repair or adjustment:
IF section
RF section
HP 11990A Option 210 System Software Package
8-5
Third Order IMD
(HP 70902A or HP 70903A)
Tested Specification
AMPLITUDE: Spurious Responses: Third-Order Intermodulation Distortion
Equipment
Level generator
General source
50 MHz low-pass lter
Directional bridge
Equipment Setup
Connect the common port of the directional bridge to the RF INPUT of the DUT. Connect
the 50 output of the level generator through a 50 MHz low-pass lter to one of the unused
directional-bridge connectors. Connect the RF OUTPUT of the general source to another
unused directional-bridge connector.
Description
The third-order intermodulation (TOI) of the DUT is measured at approximately 45 MHz
using the 3 kHz resolution bandwidth (100 kHz in the HP 70903A). It is tested at several
signal separations.
First, the amplitude of the general-source output is measured to establish the TOI reference
amplitude level. Then the amplitude of the level-generator output is measured to establish the
signal level. The upper third-order-product signal level is then measured, and the equivalent
TOI is calculated as follows:
(TOI reference ampl:) 0 (third0order ampl:) [(signal level) 0 (DUT input atten: setting)] +
2
This procedure is repeated for the lower TOI product. The smaller value of the equivalent
TOI is retained.
Uncertainties
The following characteristics contribute to uncertainties:
Level generator relative amplitude accuracy
DUT absolute frequency response referenced to 300 MHz
DUT marker amplitude resolution
DUT calibrator amplitude accuracy
DUT resolution bandwidth amplitude switching
DUT log delity
8-6
HP 11990A Option 210 System Software Package
Third Order IMD
Test Mode
This test is not run in Limited Cal mode.
In Case of Failure
If this test fails, the following modules may need repair or adjustment:
IF section
RF section
HP 11990A Option 210 System Software Package
8-7
Gain Compression
(using HP 70902A or HP 70903A)
Tested Specification
AMPLITUDE: Gain Compression
Equipment
Level generator
Measurement receiver
Sensor module
Equipment Setup
The level generator is connected to the RF INPUT of the spectrum analyzer (DUT). The
sensor-module output is connected to the measurement receiver. The sensor-module input is
connected to the front-panel IF OUTPUT on the HP 70902A or HP 70903A.
Description
The level generator is set to produce a signal within the range of the DUT. The DUT is tuned
to this signal, and the input attenuator is set to 10 dB. The DUT is set to zero span and the
level generator is tuned to the center of the DUT passband.
The amplitude of the level generator is adjusted until a signal of 030 dBm or less is at the
DUT input mixer. The measurement receiver then measures signal path gain; this value is
used as the reference for no gain compression.
The level-generator amplitude is increased to produce a signal of 010 dBm at the DUT input
mixer. The measurement receiver again measures signal path gain. The dierence between the
two gain measurements is the gain compression.
Uncertainties
The following characteristics contribute to uncertainties:
Level generator relative amplitude accuracy
Measurement receiver relative accuracy
Test Mode
This test is run in Limited Cal mode.
In Case of Failure
If this test fails, the following modules may need repair or adjustment:
IF section
RF section
8-8
HP 11990A Option 210 System Software Package
Calibrator Amplitude Accuracy
Calibrator Amplitude Accuracy
(HP 70900A or HP 70900B)
Tested Specification
AMPLITUDE ACCURACY: Calibrator Uncertainty
Equipment
Power meter
RF power sensor or microwave power sensor
Equipment Setup
Connect the power sensor to the spectrum analyzer (DUT) CALIBRATOR output connector.
Description
After zeroing and calibrating the power meter, the power sensor is connected to the DUT
CALIBRATOR output. The calibrator amplitude is measured and corrected using the
calibration factor of the power sensor.
Uncertainties
The following characteristics contribute to uncertainties:
Power meter accuracy
Mismatch between power sensor and CALIBRATOR output connector
Test Mode
This test is run in Limited Cal mode.
In Case of Failure
If this test fails, the following modules may need repair or adjustment:
Local oscillator
HP 11990A Option 210 System Software Package
8-9
Frequency Response (HP 70908A)
Tested Specification
AMPLITUDE ACCURACY: Frequency Response
Equipment
Microwave source
Level generator (not needed for Limited Cal)
Power meter
Microwave power sensor
Power splitter
Equipment Setup
A low-loss cable such as HP part number 8120-3124 must be used to connect
the microwave source to the spectrum analyzer (DUT).
Note
Connect the RF OUTPUT of the microwave source to the input port of the power splitter.
Connect one output of the power splitter to the RF INPUT of the DUT. With the power
splitter connected to the power meter, connect the other output of the power splitter to the
power sensor.
For frequencies less than 50 MHz, connect the OUTPUT of the level generator to the RF
INPUT of the DUT.
Description
The power meter is calibrated. The input attenuator of the DUT is set to 10 dB. The
microwave source output level is adjusted for a power-meter reading of 010 dBm at 300 MHz.
The DUT marker amplitude is read to establish a reference. A minimum of 30 measurements
are made in each frequency band above 50 MHz.
For frequencies less than 50 MHz, frequency response is measured with the level generator.
The level-generator output level is adjusted to produce the same DUT marker amplitude as
that using the previous setup.
The frequency response data is available in graph mode.
8-10
HP 11990A Option 210 System Software Package
Frequency Response (HP 70908A)
Uncertainties
The following characteristics contribute to uncertainties:
All Frequencies
DUT marker amplitude resolution
Frequencies >50 MHz
Power splitter tracking
Power meter accuracy
Mismatch between DUT and power splitter
Mismatch between power sensor and power splitter
Frequencies <50 MHz
Level generator atness
Mismatch between DUT and level generator
Test Mode
This test is run in Limited Cal mode for frequencies greater than 50 MHz.
In Case of Failure
If this test fails, the following modules may need repair or adjustment:
RF section
HP 11990A Option 210 System Software Package
8-11
Frequency Readout Accuracy
Tested Specification
FREQUENCY: Frequency Readout Accuracy
Equipment
Synthesized source
Equipment Setup
Connect the RF OUTPUT of the synthesized source to the spectrum analyzer (DUT) RF
INPUT.
Description
Frequency readout accuracy is tested at a maximum of eight frequencies and four spans. For
each span and source frequency, the frequency readout of the DUT is compared to that of
a synthesized source. The source is set to the selected center frequency of the DUT. The
signal is marker-peaked. The deviation between the marker frequency readout and the center
frequency is the frequency error. This test is performed with the DUT referenced to the
internal frequency reference.
If the signal amplitude is close to the noise level due to a cable that has a large amount of
signal loss, the measurement is not recorded.
If the HP 70700A digitizer is in the system, the entire test is repeated with the external
digitizer selected. In addition, extra frequencies are selected to check the area of band
crossings in microwave systems.
Uncertainties
The following characteristics contribute to uncertainties:
Synthesized source time-base accuracy
DUT marker frequency accuracy
Test Mode
This test is not run in the Limited Cal mode.
In Case of Failure
If this test fails, the following modules may need repair or adjustment:
Local oscillator
Digitizer
8-12
HP 11990A Option 210 System Software Package
Frequency Span Accuracy
Frequency Span Accuracy
Tested Specification
FREQUENCY: Frequency Span: Accuracy
Equipment
Synthesized source
Equipment Setup
Connect the RF OUTPUT of the synthesized source to the spectrum analyzer (DUT) RF
INPUT.
Description
The DUT center frequency is set to 1.5 GHz, and spans of 10 kHz, 100 kHz, 1 MHz, 10 MHz,
10.01 MHz, 101 MHz, and 1.01 GHz are tested. The synthesizer frequency is adjusted until
a signal appears near the left edge of the display. The frequency of this point and several
other points in the span are noted by using marker peak. The deviation between the marker
frequency and the synthesizer frequency is the absolute error. The maximum frequency span
error is calculated by taking the dierence between the maximum and minimum absolute
errors.
This test is performed with the DUT referenced to the internal frequency reference.
If the HP 70700A digitizer is in the system, the test is repeated with the external digitizer
selected.
Uncertainties
The following characteristics contribute to uncertainties:
Synthesized source time-base accuracy
DUT marker frequency accuracy
Test Mode
A limited version of this test runs in the Limited Cal mode, and should be run after doing a
repair.
In Case of Failure
If this test fails, the following modules may need repair or adjustment:
Local oscillator
Digitizer
HP 11990A Option 210 System Software Package
8-13
Image Responses
(using HP 70902A)
Tested Specification
AMPLITUDE: Spurious Responses: Image Responses
(in the low and preselected bands)
Equipment
Microwave source
Equipment Setup
A low-loss cable such as HP part number 8120-3124 must be used to connect
the microwave source to the spectrum analyzer (DUT).
Note
Setup A: Connect the HP 70900 local oscillator CALIBRATOR output to the HP 70908A RF
INPUT, to calibrate the preselected front end.
Setup B: Connect the source output to the RF INPUT of the HP 70908A RF section.
Description
This test measures image responses for osets of twice the IF frequency from the center
frequency on the spectrum analyzer under test. These osets are 6 MHz, 42.8 MHz, and
642.8 MHz. All four tuning bands (1H0, 1L0, 2L0, 4L0) are tested.
An output from the source is applied to the HP 70908A RF INPUT and a reference amplitude
is obtained. The source frequency is then changed to an oset of twice the IF frequency, and
the peak amplitude is read. The dierence between the reference amplitude and the peak
amplitude equals the image amplitude in dBc. If the test frequency fails specications, it
will be retested in a narrower resolution bandwidth and video bandwidth to reduce noise
contributions.
Uncertainties
The following characteristics contribute to uncertainties:
Microwave source atness
DUT marker amplitude resolution
DUT step gain error
DUT log delity
8-14
HP 11990A Option 210 System Software Package
Image Responses
Test Mode
This test is run in Limited Cal mode.
In Case of Failure
If this test fails, the following modules may need repair or adjustment:
RF section
HP 11990A Option 210 System Software Package
8-15
Multiple Responses
(using HP 70902A)
Tested Specification
AMPLITUDE: Spurious Responses: Multiple Responses
(in the low and preselected bands)
Equipment
Microwave source
Equipment Setup
A low-loss cable such as HP part number 8120-3124 must be used to connect
the microwave source to the spectrum analyzer (DUT).
Note
Setup A: Connect the HP 70900 local oscillator CALIBRATOR output to the HP 70908A RF
INPUT to calibrate the preselected front end.
Setup B: Connect the source to the RF INPUT of the HP 70908A RF section.
Description
This test measures multiple responses of an HP 71210 spectrum analyzer. All four tuning
bands (1H0, 1L0, 2L0, 4L0) are tested.
A list of source frequencies is generated that should produce a multiple response
corresponding to a given center frequency. The source frequency is set to the center frequency
and a reference amplitude is obtained. Next, the source frequency is set to frequencies on the
list where a response level is obtained for each of the frequencies. The dierence between the
amplitudes of the reference frequency and the level of each listed frequency is the multiple
response amplitude in dBc. If the test results plus the maximum amplitude error due to the
IF response time are close to specication, the multiple response is measured again at a slower
sweep rate to reduce the IF response-time error.
In single mode, the center frequency is stepped up in 500 MHz increments. In all other test
modes, it is stepped up in 1 GHz increments (27 measurements).
8-16
HP 11990A Option 210 System Software Package
Multiple Responses
Uncertainties
The following characteristics contribute to uncertainties:
Microwave source atness
DUT marker amplitude resolution
DUT step gain error
DUT log delity
The RSS total of these uncertainties is calculated for each measurement.
Test Mode
This test is run in Limited Cal mode.
In Case of Failure
If this test fails, the following modules may need repair or adjustment:
IF section
RF section
HP 11990A Option 210 System Software Package
8-17
Displayed Average Noise
(using HP 70902A or HP 70903A)
Tested Specification
AMPLITUDE: Displayed Average Noise Level
Equipment
50 termination
Equipment Setup
Connect the 50 termination to the spectrum analyzer (DUT) RF INPUT.
Description
The average displayed noise level is measured at the frequency of the displayed peak in each
band, except below 10 MHz where 10 data points are taken.
When the DUT system has an HP 70902A, a resolution bandwidth of 10 Hz and a video
bandwidth of 3 Hz are used. When the DUT system has an HP 70903A, a resolution
bandwidth of 100 kHz and a video bandwidth of 300 Hz are used. A sweep is taken and trace
information is averaged.
Uncertainties
The following characteristics contribute to uncertainties:
DUT marker amplitude resolution
DUT step gain accuracy
DUT log delity
DUT resolution bandwidth amplitude switching accuracy
DUT calibrator amplitude accuracy
DUT RF attenuator switching accuracy
Test Mode
This test is run in Limited Cal mode.
In Case of Failure
If this test fails, the following modules may need repair or adjustment:
Local oscillator
IF section
RF section
8-18
HP 11990A Option 210 System Software Package
Residual Responses
Residual Responses
(using HP 70902A)
Tested Specification
AMPLITUDE: Spurious Responses: Residual Responses
Equipment
50 termination
Equipment Setup
Connect the 50 termination to the RF INPUT of the spectrum analyzer (DUT).
Description
The input attenuator of the DUT is set to 0 dB. The frequencies at which residual responses
may occur are calculated and the DUT is tuned to these frequencies. The residual product
level is measured.
Uncertainties
The following characteristics contribute to uncertainties:
DUT marker amplitude resolution
DUT step gain accuracy
DUT log delity
DUT resolution bandwidth amplitude switching accuracy
DUT calibrator amplitude accuracy
DUT RF attenuator switching accuracy
Test Mode
This test is run in Limited Cal mode.
In Case of Failure
If this test fails, the following modules may need repair or adjustment:
IF section
RF section
HP 11990A Option 210 System Software Package
8-19
Noise Sidebands
(using HP 70902A)
Tested Specification
FREQUENCY: Spectral Purity: Noise Sidebands (dBc/Hz)
Equipment
Clean source
Equipment Setup
Connect the RF OUTPUT of the clean source to the RF INPUT of the spectrum analyzer
(DUT).
Description
HP 70900A: The noise sidebands are measured at 40 oset frequencies from 100 Hz to 1 MHz.
HP 70900B: The noise sidebands are measured at an oset frequency of 10 kHz.
The DUT is set for 0 dB attenuation and a span of 0 Hz. The signal amplitude is adjusted
to the reference level, which is the carrier level. The source carrier frequency is increased by
the amount of oset frequency. The resolution bandwidth of the DUT is set to 3% of the
oset frequency, and the reference level is reduced by 20 dB. A sweep is taken and the data
is averaged. The data is normalized to a 1 Hz bandwidth and corrected for log detection and
noise bandwidth.
Uncertainties
The following characteristics contribute to uncertainties:
DUT marker amplitude resolution
DUT log delity
DUT resolution bandwidth amplitude correction
DUT resolution bandwidth 3 dB accuracy
DUT noise oor error
Clean source phase-noise level
Test Mode
This test is run in Limited Cal mode at 796.12 MHz only.
In Case of Failure
If this test fails, the following modules may need repair or adjustment:
Local oscillator
RF section
8-20
HP 11990A Option 210 System Software Package
Line and System Related Sidebands
Line and System Related Sidebands
(using HP 70902A)
Tested Specification
FREQUENCY: Spectral Purity: Line- and system-related sidebands (dBc)
Equipment
Clean source
Equipment Setup
Connect the RF OUTPUT of the clean source to the RF INPUT of the spectrum analyzer
(DUT).
Description
The source is set for an amplitude of 010 dBm. Line- and system-related sidebands are tested
at frequencies of 15, 1200, and 2500 MHz. The signal is peaked on the DUT and set to the
reference level.
The source is then oset by known sideband frequencies, and the sideband level is measured.
Uncertainties
The following characteristics contribute to uncertainties:
DUT marker amplitude resolution
DUT log delity
Test Mode
This test is run in Limited Cal mode at 15 MHz only.
In Case of Failure
If this test fails, the following modules may need repair or adjustment:
Local oscillator
HP 11990A Option 210 System Software Package
8-21
Synthesis Related Sidebands
(using HP 70902A)
Tested Specification
FREQUENCY: Spectral Purity: Synthesis-related sidebands (dBc)
Equipment
Clean source
Equipment Setup
The RF OUTPUT of the clean source is connected to the RF INPUT of the spectrum
analyzer (DUT).
Description
Based on the center frequency tuning equations, the DUT is tuned to frequencies where
synthesis-related sidebands may exist. The source carrier level is measured. Then the source
frequency is increased to place the sideband on-screen, and the sideband level is measured.
Uncertainties
The following characteristics contribute to uncertainties:
DUT marker amplitude resolution
DUT log delity
Test Mode
This test is not run in Limited Cal mode.
In Case of Failure
If this test fails, the following modules may need repair or adjustment:
Local oscillator
8-22
HP 11990A Option 210 System Software Package
Step Gain Accuracy
Step Gain Accuracy
(for HP 70902A or HP 70903A)
Tested Specification
AMPLITUDE ACCURACY: IF Gain Uncertainty
Equipment
Level generator
Voltmeter
Equipment Setup
Connect the 50 output of the level generator to the RF INPUT of the spectrum analyzer
(DUT). Connect the voltmeter to the DUT front-panel VIDEO output.
Description
The spectrum analyzer is set for a reference level and RF attenuator setting that corresponds
to 0 dB IF Gain. The level generator is set to +12 dBm and the voltmeter is read to establish
a reference voltage.
The reference level is then decreased 10 dB. The level-generator output is adjusted, if
necessary, until the reference voltage is reached. The dierence between voltage readings is the
IF gain error. Repeat this for each IF gain step.
Uncertainties
The following characteristics contribute to uncertainties:
Level generator relative amplitude accuracy
Voltmeter ac measurement accuracy
DUT marker amplitude resolution
DUT log scale delity incremental accuracy (corrected).
Test Mode
This test is run in the Limited Cal mode.
In Case of Failure
If this test fails, the following modules may need repair or adjustment:
IF Section
HP 11990A Option 210 System Software Package
8-23
Log Fidelity
(for HP 70902A or HP 70903A)
Tested Specification
AMPLITUDE ACCURACY: Scale Fidelity: Log
Equipment
Level generator
Equipment Setup
Connect the 50 output of the level generator to the RF INPUT of the spectrum analyzer
(DUT).
Description
This test measures the relative on-screen log scale delity (that is, the display CRT's upper
eight divisions for the HP 70903A, or upper nine divisions for the HP 70902A).
The DUT is set for a reference level of +10 dBm, span of 0 Hz, and a resolution bandwidth of
100 kHz (HP 70903A) or 100 Hz (HP 70902A). The level-generator frequency is adjusted to
peak the detected signal, and the amplitude is adjusted to set the signal at the reference level.
The dierence between the level generator and marker amplitudes establishes a reference error
at this point.
The level generator is stepped down in 1 dB increments (2 dB in Limited Cal and All Tests
modes) until the signal is 75 to 90 dB below top-screen. The actual level depends on the IF
and RF being tested. In the last 20 dB of the log range, the sweep time is increased to lessen
the eects of the reduced signal-to-noise ratio. The amplitude dierence between the level
generator and the displayed trace average is measured. Once all measurements have been
made, the data is normalized to 010 dB of top-screen.
If the HP 70700A digitizer is in the system, the test is repeated with the digitizer selected.
Uncertainties
The following characteristics contribute to uncertainties:
Level generator relative amplitude accuracy
DUT marker amplitude resolution
Test Mode
This test is run in Limited Cal mode, and should be run after doing a repair.
In Case of Failure
If this test fails, the following modules may need repair or adjustment:
IF Section
8-24
HP 11990A Option 210 System Software Package
Resolution Bandwidth Test
Resolution Bandwidth Test
(for HP 70902A or HP 70903A)
Tested Specifications
AMPLITUDE ACCURACY: Resolution Bandwidth Switching Uncertainty
FREQUENCY: Resolution Bandwidths (03 dB), Accuracy
FREQUENCY: Resolution Bandwidths (03 dB), Selectivity
Equipment
Level generator
Equipment Setup
Connect the RF OUTPUT of the level generator to the RF INPUT of the spectrum analyzer
(DUT).
Description
Bandwidth switching variation is tested by setting a reference value at the widest resolution
bandwidth. The DUT resolution bandwidth is then stepped down in a 1, 3, 10 sequence and
the amplitude variation from the widest bandwidth is recorded. The data is then normalized
to the reference bandwidth (100 Hz, HP 70902A; 300 kHz, HP 70903A).
The 3 dB (or 60 dB) points of the resolution bandwidth response are tested as follows.
The DUT is set to the 0 Hz span and the level-generator frequency is adjusted to peak the
response. The level-generator amplitude is then stepped down 3 dB to establish a reference
value. The level- generator amplitude is then returned to the original value and the frequency
is decreased until the 3 dB reference amplitude is reached. This establishes the lower 3 dB
frequency point. The level-generator frequency is then increased until the upper 3 dB point
is found. The dierence in level-generator frequencies is the 3 dB bandwidth. This procedure
may be repeated to determine the 60 dB points of the resolution bandwidth response.
Uncertainties
The following characteristics contribute to uncertainties:
Level generator relative amplitude accuracy
Level generator frequency accuracy
DUT marker amplitude resolution
HP 11990A Option 210 System Software Package
8-25
Resolution Bandwidth Test
Test Mode
This test is run in Limited Cal mode for some bandwidths.
In Case of Failure
If this test fails, the following modules may need repair or adjustment:
IF Section
8-26
HP 11990A Option 210 System Software Package
Linear Fidelity
Linear Fidelity
(for HP 70902A or HP 70903A)
Tested Specification
AMPLITUDE ACCURACY: Scale Fidelity: Linear
Equipment
Level generator
Equipment Setup
The 50 output of the level generator is connected to the RF INPUT of the spectrum
analyzer (DUT).
Description
The HP 70902A test sets the resolution bandwidth to 30 kHz; the HP 70903A test sets the
resolution bandwidth to 1 MHz. The LIN display mode is selected. The level generator is set
to provide a signal near the reference level.
The spectrum analyzer marker is peaked. The reference level is set at the peaked value to
establish a reference at the top of the display.
The level generator is stepped down in 2 dB increments (4 dB for All Tests mode). The
variation between the level-generator amplitude and DUT marker amplitude is measured.
Uncertainties
The following characteristics contribute to uncertainties:
Level generator relative amplitude accuracy
DUT marker amplitude resolution
Test Mode
This test is not run in Limited Cal mode.
In Case of Failure
If this test fails, the following modules may need repair or adjustment:
IF section
HP 11990A Option 210 System Software Package
8-27
9
HP 11990A Option 300 System Software Package
Introduction
The HP 11990A Option 300 System Software package provides all test software required to
verify that an HP 71300A millimeter spectrum analyzer meets all of its major specications.
This software package can also be used when an HP 70907A is a secondary input of an
HP 71100C, HP 71200C, or HP 71210C spectrum analyzer. This software package consists of
this manual and one test disk (Test Disk 1). A System Add-On package may be needed to
test modules that are not part of a predened system.
Execution of the tests in this system software package is dependent on the HP 11990A Option
001 User Interface program, which automates the test process. Refer to Chapter 2, \Start-Up
Procedures," for instructions to run the test software.
Option 300 Tests
Sweep Time Accuracy : : : : : : : : : : : : : : : : : : : : : : : : : : : : : : : : : : : : : : : : : : : : : : : : : : : : : : : : : 9-3
Calibrator Frequency Accuracy : : : : : : : : : : : : : : : : : : : : : : : : : : : : : : : : : : : : : : : : : : : : : : : : 9-4
Mixer Bias Output Accuracy : : : : : : : : : : : : : : : : : : : : : : : : : : : : : : : : : : : : : : : : : : : : : : : : : : 9-5
Calibrator Amplitude Accuracy : : : : : : : : : : : : : : : : : : : : : : : : : : : : : : : : : : : : : : : : : : : : : : : : 9-6
LO Output Amplitude : : : : : : : : : : : : : : : : : : : : : : : : : : : : : : : : : : : : : : : : : : : : : : : : : : : : : : : : : 9-8
Frequency Response : : : : : : : : : : : : : : : : : : : : : : : : : : : : : : : : : : : : : : : : : : : : : : : : : : : : : : : : : : : 9-9
Frequency Readout Accuracy : : : : : : : : : : : : : : : : : : : : : : : : : : : : : : : : : : : : : : : : : : : : : : : : : 9-11
Frequency Span Accuracy : : : : : : : : : : : : : : : : : : : : : : : : : : : : : : : : : : : : : : : : : : : : : : : : : : : : 9-14
Gain Calibration Accuracy : : : : : : : : : : : : : : : : : : : : : : : : : : : : : : : : : : : : : : : : : : : : : : : : : : : 9-17
Displayed Average Noise Level : : : : : : : : : : : : : : : : : : : : : : : : : : : : : : : : : : : : : : : : : : : : : : : : 9-19
Residual Responses : : : : : : : : : : : : : : : : : : : : : : : : : : : : : : : : : : : : : : : : : : : : : : : : : : : : : : : : : : : 9-21
Log Fidelity : : : : : : : : : : : : : : : : : : : : : : : : : : : : : : : : : : : : : : : : : : : : : : : : : : : : : : : : : : : : : : : : : : 9-23
Resolution Bandwidth : : : : : : : : : : : : : : : : : : : : : : : : : : : : : : : : : : : : : : : : : : : : : : : : : : : : : : : : 9-25
IF Gain Accuracy : : : : : : : : : : : : : : : : : : : : : : : : : : : : : : : : : : : : : : : : : : : : : : : : : : : : : : : : : : : : 9-27
Image Response : : : : : : : : : : : : : : : : : : : : : : : : : : : : : : : : : : : : : : : : : : : : : : : : : : : : : : : : : : : : : : 9-29
Test Descriptions
This manual lists and describes all of the tests in this system software package. Pressing the
softkey ALL TESTS invokes execution of the tests in an ecient sequence determined by the
software authors.
The following list explains the information found in this manual under the test names:
\Tested Specication" is the name of the system specication as found in the
\Specications" chapter of the HP 70900 Local Oscillator Installation and Verication
Manual .
\Equipment" lists all external test equipment required by the particular test. Accessories
are not listed. The test will not run if required test equipment is missing.
NNNNNNNNNNNNNNNNNNNNNNNNNNNNN
HP 11990A Option 300 System Software Package
9-1
\Equipment Setup" describes equipment interconnections. A setup screen on the computer
display will also provide instruction. This screen does not appear if the current setup is
complete and correct. The screen presents ABORT and PROCEED softkeys. Pressing ABORT
will display the Test Menu. If the setup is wrong, pressing PROCEED three times will abort
the test and then display the Test Menu.
\Description" provides a brief description of the test.
\Uncertainties" tells what characteristics contribute to measurement uncertainties.
\Test Mode" tells whether the particular test runs in Limited Cal mode and what, if any,
parameter is modied. Mode selection is a Test Menu function. There are six major modes:
Single, Repeat, Multiple, Repeat Multiple, All Tests, and Limited Cal. In any mode other
than Limited Cal, the tests run in their entirety. The following section lists the tests
included in Limited Cal.
\In Case of Failure" tells which modules may need repair or adjustment if the test fails.
NNNNNNNNNNNNNNNNN
NNNNNNNNNNNNNNNNNNNNNNN
NNNNNNNNNNNNNNNNN
NNNNNNNNNNNNNNNNNNNNNNN
Limited Cal Tests
When you press LIMITED CAL in the Test Menu or QUICK TEST in the Main Menu, the
Limited Cal tests are executed in a sequence dened by the software authors. The Limited
Cal tests are listed below in the order that they appear in this manual, not in the order of
execution.
Sweep Time Accuracy
Calibrator Frequency Accuracy
Calibrator Amplitude Accuracy
LO Output Amplitude
Frequency Span Accuracy
Displayed Average Noise
Residual Responses
Log Fidelity
Resolution Bandwidth
Image Response
NNNNNNNNNNNNNNNNNNNNNNNNNNNNNNNNNNN
9-2
NNNNNNNNNNNNNNNNNNNNNNNNNNNNNNNN
HP 11990A Option 300 System Software Package
Sweep Time Accuracy
Sweep Time Accuracy
(HP 70900A or HP 70900B)
Tested Specification
SWEEP: Sweep Time: Accuracy
Equipment
Universal counter
Equipment Setup
The H SWP output on the rear panel of the HP 70900 local oscillator is connected to the
input of the universal counter. If an HP 70700A digitizer is in the system, the H SWP line
from the HP 70900 must also be connected to the digitizer rear-panel HI SWP connector.
Description
Several dierent spectrum-analyzer sweep times are selected to exercise the hardware fully.
For each selected sweep time, the DUT is set for a span of 0 Hz and a sweep is triggered. The
sweep time is then measured with the universal counter. Sweep times are selected to turn on
each of the 12 bits of the sweep DAC. Only one bit is on at a time except when the lower six
bits are tested; then bit 6 is also on.
If the HP 70700A digitizer is in the system, then its hardware must also be tested. Several
more sweep times are chosen to test: fast sweep times at multiples of the digitizer's clock rate,
worst-case resolution errors, and long sample rates.
Uncertainties
The following characteristics contribute to uncertainties:
Universal counter resolution
Universal counter accuracy
Test Mode
This test runs in the Limited Cal mode, and should be run after doing a repair.
In Case of Failure
If this test fails, the following modules may need repair or adjustment:
Local oscillator
Digitizer
HP 11990A Option 300 System Software Package
9-3
Calibrator Frequency Accuracy
(HP 70900A or HP 70900B)
Tested Specification
FREQUENCY: Frequency Reference Accuracy: Aging
Equipment
Frequency counter
Equipment Setup
The CALIBRATOR output of the HP 70900 is connected to the input of the frequency
counter.
Description
With the spectrum analyzer (DUT) set to its internal frequency reference, the frequency
counter is used to measure the 300 MHz CALIBRATOR frequency.
Uncertainties
The following characteristics contribute to uncertainties:
Frequency counter time-base stability
Test Mode
This test is run in Limited Cal mode.
In Case of Failure
If this test fails, the following modules may need repair or adjustment:
Local oscillator
9-4
HP 11990A Option 300 System Software Package
Mixer Bias Output Accuracy
Mixer Bias Output Accuracy
Tested Specification
INPUTS AND OUTPUTS: HP 70907A external mixer interface: Mixer Bias Output
Equipment
Voltmeter
50 termination
Equipment Setup
Connect the 50 termination via a tee adapter to the MIXER BIAS OUT of the HP 70907A
external mixer interface module (EMIM) and to the voltmeter.
If the 50 termination does not measure 51.1 , return to the \Equipment Menu Edit
Screen" and enter the actual resistance in the SERIAL OR ID NO. column.
Description
This test measures the accuracy of the EMIM's external bias output current, which is
available for externally biasing a microwave mixer. The mixer bias current is measured over
its full range by comparing the programmed bias current to the voltage developed across a 50
termination by this current.
Current is stepped in 10 A increments over the 010 to +10 mA range while the actual
current is measured by reading the voltage developed across the 50 termination with a
voltmeter.
Due to the small currents used, the resistance of the termination must be
measured using the four-wire ohm technique.
Note
Uncertainties
The following characteristics contribute to uncertainties:
Voltmeter four-wire accuracy
Voltmeter voltage accuracy
The RSS total of these uncertainties is calculated for each measurement.
Test Mode
This test is not run in Limited Cal mode.
In Case of Failure
If this test fails, the following modules may need repair or adjustment:
External mixer interface module
HP 11990A Option 300 System Software Package
9-5
Calibrator Amplitude Accuracy
Tested Specification
AMPLITUDE ACCURACY: Calibrator Uncertainty
Equipment
General source
Measuring receiver
Sensor module
Equipment Setup
Setup A: Connect the general source through an appropriate cable to the sensor module of the
measuring receiver.
Setup B: Connect the general source output to the IF INPUT of the HP 70907A external
mixer interface module (EMIM). Connect the sensor module to the 321.4 MHz OUT of the
EMIM.
Description
This test measures the amplitude variation of the internal calibration source over its tuning
range referenced to a 035 dBm signal applied to the IF INPUT of the EMIM.
The general source is set to a frequency of 321.4 MHz and an amplitude of 035 dBm. The
amplitude of the general source output is measured by the measuring receiver. The cables
that are needed to connect the source to the EMIM must be included so that any losses may
be accounted for and calibrated out.
The amplitude of the EMIM output is measured to establish its gain. The internal calibration
source of the EMIM is then stepped over its frequency range in 5 kHz increments. At
each frequency increment, the actual frequency is measured by the measuring receiver; the
frequency of the internal calibration source cannot be set directly.
The internal calibration source is tuned over its range while the measuring receiver measures
the amplitude of the EMIM 321.4 MHz OUT. This data is then normalized to the 035 dBm
level previously set.
Note that the internal calibration source is actually changing frequency. The tuning is not
symmetrical about the 321.4 MHz nominal center and requires tuning 630 kHz of this center.
Uncertainties
The following characteristics contribute to uncertainties:
Mismatch between sensor module and EMIM output connector
Measuring receiver tuned RF (absolute) accuracy
9-6
HP 11990A Option 300 System Software Package
Calibrator Amplitude Accuracy
Test Mode
This test is run in Limited Cal mode.
In Case of Failure
If this test fails, the following modules may need repair or adjustment:
External mixer interface module
HP 11990A Option 300 System Software Package
9-7
LO Output Amplitude
Tested Specification
INPUTS AND OUTPUTS: HP 70907A external mixer interface: LO Output
Equipment
Power meter
Microwave power sensor
Equipment Setup
Setup A: Connect the power sensor to the power meter POWER REF OUTPUT.
Setup B: Connect the power sensor to the LO OUTPUT of the HP 70907A external mixer
interface module (EMIM).
Description
If the power meter needs calibration, connect the equipment using setup A.
Connect the equipment using setup B. This test measures the EMIM LO OUTPUT power
over the full tuning range of the HP 70900 local oscillator (3.0 to 6.6 GHz). The EMIM is set
to zero span.
Uncertainties
The following characteristics contribute to uncertainties:
DUT mismatch error
Power meter error
Test Mode
This test is run in Limited Cal mode.
In Case of Failure
If this test fails, the following modules may need repair or adjustment:
External mixer interface module
9-8
HP 11990A Option 300 System Software Package
Frequency Response
Frequency Response
Tested Specification
AMPLITUDE ACCURACY: Frequency Response
Equipment
Microwave source
Power meter
Microwave power sensor
Directional coupler
External mixer (HP 11970K)
Equipment Setup
Connect the source to the input of the directional-coupler main guide. Connect the
microwave power sensor to the power meter, then connect the sensor to the output
of the directional-coupler main guide. Connect the HP 11970K external mixer to the
directional-coupler coupled port. Connect the HP 11970K external mixer to the EMIM IF
INPUT and LO OUTPUT through appropriate cables. See Figure 1-1.
Figure 9-1. Frequency Response Test Setup
HP 11990A Option 300 System Software Package
9-9
Frequency Response
Description
This test measures amplitude variation of the HP 71300A millimeter spectrum analyzer from
18 to 26 GHz. The microwave power sensor is selected and the system is interrogated for
an IF section. This step allows an optimum resolution bandwidth to be used to minimize
measurement errors due to log delity. The signal is centered on the display using a span that
is ve times greater than the resolution bandwidth. Marker amplitude is measured at 100
MHz increments and compared with the power meter measurement, which has been corrected
for directional-coupler coupling factor. The system conversion loss is set to 0 dB so that the
conversion loss being measured is that of the external mixer when used with the HP 71300A
system. The frequency response is then one-half of the dierence between the maximum and
minimum values measured.
Uncertainties
The following characteristics contribute to uncertainties:
DUT marker amplitude resolution
DUT log delity
Power meter accuracy
Mismatch error
Directional coupler accuracy
The RSS total of these uncertainties is calculated for each measurement.
Test Mode
This test is not run in Limited Cal mode.
In Case of Failure
If this test fails, the following modules may need repair or adjustment:
Local oscillator
External mixer interface module
9-10
HP 11990A Option 300 System Software Package
Frequency Readout Accuracy
Frequency Readout Accuracy
Tested Specification
FREQUENCY: Frequency Readout Accuracy
(using the internal frequency reference)
Equipment
Microwave source
External mixer (HP 11970K only)
Equipment Setup
Setup A: The HP 70907A external mixer interface module (EMIM) LO OUTPUT and RF
INPUT are connected to the HP 11970K external mixer through appropriate cables. Then the
HP 11970K external mixer input is connected to the microwave source output. See Figure 1-2.
Setup B (alternate): This is the same setup that is used in the Frequency Response test:
Connect the microwave source to the input of the directional-coupler main guide. Connect
the microwave power sensor to the power meter, then connect the sensor to the output
of the directional-coupler main guide. Connect the HP 11970K external mixer to the
directional-coupler coupled port. Connect the HP 11970K external mixer to the EMIM IF
INPUT and LO OUTPUT through appropriate cables. See Figure 1-3.
Figure 9-2. Frequency Readout Accuracy Test Setup A
HP 11990A Option 300 System Software Package
9-11
Frequency Readout Accuracy
Figure 9-3. Frequency Readout Accuracy Test Setup B (alternate)
Description
Frequency readout accuracy is measured by comparing the marker frequency of the system
to the frequency input to the system by the microwave source. A 100:1 span/resolution
bandwidth ratio is needed to reduce the errors associated with the marker resolution. The
modular system is interrogated for an IF section. If only the HP 70903A IF section is present,
the minimum span that can be used is 10 MHz. If an external 100 MHz reference is connected
to the HP 70900 local oscillator, the external reference must be disconnected to allow the
accuracy of the test to be based only on the accuracy of the internal reference.
The number of frequencies and spans to be used in testing is determined by the test mode. At
least one fractional N span and one lock-and-roll span are tested.
If the HP 70700A digitizer is in the system, the entire test is repeated with the digitizer
selected.
Uncertainties
The following characteristics contribute to uncertainties:
Source frequency error
DUT marker frequency resolution
9-12
HP 11990A Option 300 System Software Package
Frequency Readout Accuracy
Test Mode
This test is not run in the Limited Cal mode.
In Case of Failure
If this test fails, the following modules may need repair or adjustment:
Local oscillator
HP 11990A Option 300 System Software Package
9-13
Frequency Span Accuracy
Tested Specification
FREQUENCY: Frequency Span: Accuracy
(using the internal frequency reference)
Equipment
Microwave source
External mixer (HP 11970K only)
Equipment Setup
Setup A: The HP 70907A external mixer interface module (EMIM) LO OUTPUT and RF
INPUT are connected to the HP 11970K external mixer through appropriate cables. Then the
HP 11970K external mixer input is connected to the microwave source output. See Figure 1-4.
Setup B (alternate): This is the same setup that is used in the Frequency Response test:
Connect the microwave source to the input of the directional-coupler main guide. Connect
the microwave power sensor to the power meter, then connect the sensor to the output
of the directional-coupler main guide. Connect the HP 11970K external mixer to the
directional-coupler coupled port. Connect the HP 11970K external mixer to the EMIM IF
INPUT and LO OUTPUT through appropriate cables. See Figure 1-5.
Figure 9-4. Frequency Span Accuracy Test Setup A
9-14
HP 11990A Option 300 System Software Package
Frequency Span Accuracy
Figure 9-5. Frequency Span Accuracy Test Setup B (alternate)
Description
Frequency span accuracy is measured by comparing the marker frequency of the system
at several points on the display to the frequency of the microwave source. The deviation
between marker frequency and microwave source frequency is the absolute error. The
maximum frequency span error is calculated by taking the dierence between the maximum
and minimum absolute errors. A 100:1 span/resolution-bandwidth ratio is needed to reduce
the errors associated with the marker resolution. The modular system is interrogated for an
IF section. If only the HP 70903A IF section is present, the minimum span that can be used
is 10 MHz. If an external 100 MHz reference is connected to the HP 70900 local oscillator, the
external reference must be disconnected to allow the accuracy of the test to be based only on
the accuracy of the internal reference.
If the HP 70700A digitizer is in the system, the entire test is run again with the digitizer
selected.
Uncertainties
The following characteristics contribute to uncertainties:
Microwave source accuracy
DUT marker resolution
HP 11990A Option 300 System Software Package
9-15
Frequency Span Accuracy
Test Mode
A limited version of this test runs in Limited Cal mode and should be run after doing a repair.
In Case of Failure
If this test fails, the following modules may need repair or adjustment:
Local oscillator
External mixer interface module
9-16
HP 11990A Option 300 System Software Package
Gain Calibration Accuracy
Gain Calibration Accuracy
(using HP 70903A)
Tested Specification
AMPLITUDE ACCURACY: Resolution Bandwidth Switching Uncertainty
(reference bandwidth = 300 kHz)
Equipment
Microwave source
External mixer (HP 11970K only)
Equipment Setup
Setup A: The HP 70907A external mixer Interface module (EMIM) LO OUTPUT and RF
INPUT are connected to the HP 11970K external mixer through appropriate cables. Then the
HP 11970K external mixer input is connected to the microwave source output. See Figure 1-6.
Setup B (alternate): This is the same setup that is used in the Frequency Response test:
Connect the microwave source to the input of the directional-coupler main guide. Connect
the microwave power sensor to the power meter, then connect the sensor to the output
of the directional-coupler main guide. Connect the HP 11970K external mixer to the
directional-coupler coupled port. Connect the HP 11970K external mixer to the EMIM IF
INPUT and LO OUTPUT through appropriate cables. See Figure 1-7.
Figure 9-6. Gain Calibration Accuracy Test Setup A
HP 11990A Option 300 System Software Package
9-17
Gain Calibration Accuracy
Figure 9-7. Gain Calibration Accuracy Test Setup B (alternate)
Description
To nd System Gain Accuracy, the test rst sets 300 kHz resolution bandwidth (in
HP 70903A), then the test compares the DUT marker amplitude in corrected mode with
marker amplitude in uncorrected mode. An error occurs if the tuning range of the internal
calibration source cannot tune to the center frequency of the resolution bandwidth lter.
Uncertainties
The following characteristics contribute to uncertainties:
DUT marker amplitude resolution
DUT uncorrected incremental log delity
The RSS total of these uncertainties is calculated for each measurement.
In Case of Failure
If this test fails, the following modules may need repair or adjustment:
Local oscillator
9-18
HP 11990A Option 300 System Software Package
Displayed Average Noise Level
Displayed Average Noise Level
(for HP 70902A or HP 70903A)
Tested Specification
AMPLITUDE: Displayed Average Noise Level
Equipment
External mixer (HP 11970K only)
50 termination
Equipment Setup
Setup A: Connect the HP 11970K external mixer to the LO OUTPUT and IF INPUT of the
HP 70907A external mixer interface module (EMIM). Connect a 50 termination to the HP
11970K external mixer INPUT.
Setup B (alternate): This is the same setup that is used in the Frequency Response
test: Connect the source to the input of the directional-coupler main guide. Connect
the microwave power sensor to the power meter, then connect the sensor to the output
of the directional-coupler main guide. Connect the HP 11970K external mixer to the
directional-coupler coupled port. Connect the HP 11970K external mixer to the EMIM IF
INPUT and LO OUTPUT through appropriate cables. See Figure 1-8.
Figure 9-8. Displayed Average Noise Level Test Setup B (alternate)
HP 11990A Option 300 System Software Package
9-19
Displayed Average Noise Level
Description
This test measures the displayed average noise level of the spectrum-analyzer/external-mixer
system. The displayed average noise level is closely related to sensitivity, which determines the
lowest level signal that may be measured by the IF section.
This measurement is made by sweeping the full 18 GHz to 26 GHz frequency band to
determine the frequency with the highest displayed average noise. The spectrum analyzer is
set to zero span at this frequency, the resolution bandwidth is set to 1 kHz (100 kHz with
HP 70903A IF section), and the sample detector is enabled. Sweep time is determined by
auto-correlation, and sweeps are taken until the displayed average noise level is known to
be accurate to 0.5 dB. If setup B is used, the source frequency is set to 15 GHz and the
amplitude to 0120 dBm.
Uncertainties
The following characteristics contribute to uncertainties:
DUT calibrator error
DUT marker amplitude resolution
DUT step gain error
DUT resolution bandwidth switching
DUT log delity
The RSS total of these uncertainties is calculated for each measurement.
Test Mode
This test is run in Limited Cal mode.
In Case of Failure
If this test fails, the following modules may need repair or adjustment:
IF section
9-20
HP 11990A Option 300 System Software Package
Residual Responses
Residual Responses
Tested Specification
AMPLITUDE: Residual Responses
Equipment
External mixer (HP 11970K only)
50 termination
Equipment Setup
Setup A: Connect a 50 termination to the input port of the HP 11970K external mixer.
Connect the HP 11970K external mixer LO OUTPUT and IF INPUT ports to the HP 70907A
external mixer interface module (EMIM) LO OUTPUT and IF INPUT ports.
Setup B (alternate): This is the same setup that is used in the Frequency Response
test: Connect the source to the input of the directional-coupler main guide. Connect
the microwave power sensor to the power meter, then connect the sensor to the output
of the directional-coupler main guide. Connect the HP 11970K external mixer to the
directional-coupler coupled port. Connect the HP 11970K external mixer to the EMIM IF
INPUT and LO OUTPUT through appropriate cables. See Figure 1-9.
Figure 9-9. Residual Response Test Setup B (alternate)
HP 11990A Option 300 System Software Package
9-21
Residual Responses
Description
This test measures residual responses that are on the display when there is no input signal. A
residual response results when mixing of at least two of the DUT's internal signals produces a
product at one of the DUT's intermediate frequencies.
The DUT is calibrated, if necessary. If setup B is used, the test terminates the external mixer
by setting the source to 15 GHz, 0120 dBm.
Maximum DUT sensitivity results with the internal attenuator at 0 dB and an IF gain of
50 dB. The test then measures responses at possible residual frequencies. The test frequencies
are in-band results of calculations involving up to 50 harmonics of the DUT's xed LO
frequencies (300 MHz and 18.4 MHz) and the intermediate frequencies (321.4 MHz, 21.4 MHz,
and 3.0 MHz).
Uncertainties
The following characteristics contribute to uncertainties:
DUT calibrator error
DUT marker amplitude resolution
DUT step gain error
DUT resolution bandwidth switching
DUT attenuator switching errors
DUT log delity
The RSS total of these uncertainties is calculated for each measurement.
Test Mode
This test is run in Limited Cal mode.
In Case of Failure
If this test fails, the following modules may need repair or adjustment:
IF section
External mixer interface module
9-22
HP 11990A Option 300 System Software Package
Log Fidelity
Log Fidelity
(for HP 70902A and HP 70903A)
Tested Specification
AMPLITUDE ACCURACY: Scale Fidelity: Log
Equipment
General source
Measuring receiver
Sensor module
Power splitter (or hybrid combiner)
Equipment Setup
Connect the general source to the input of the power splitter. Connect one output of the
power splitter to the IF INPUT of the HP 70907A external mixer interface module (EMIM).
To the remaining output of the power splitter, connect the sensor module from the measuring
receiver.
Description
This test measures the relative on-screen log scale delity (that is, the display CRT's upper
eight divisions for the HP 70903A, or upper nine divisions for the HP 70902A).
The IF section is set to 100 kHz (HP 70903A) or 1 kHz (HP 70902A) resolution bandwidth,
300 Hz video bandwidth, and sample detection. The HP 71300A millimeter spectrum analyzer
acts as a xed-tuned 321.4 MHz receiver, so the span is set to 0 Hz. The reference is set
to provide maximum on-screen dynamic range. The general source frequency is adjusted
to center the signal in the IF passband, and the general source amplitude is adjusted to
set the signal at the reference level. The measuring receiver measures the general source
amplitude. The dierence between the measuring receiver reading and marker amplitude
readout establishes a top-screen reference.
The general source amplitude is decreased in 1 dB increments (2 dB in Limited Cal and All
Tests modes) until the signal is 75 to 90 dB below
top-screen. The actual level depends on the IF being tested and the test mode. In the
last 20 dB of the log range, the sweep time is increased to lessen the eects of the reduced
signal-to-noise ratio. Once all measurements have been made, the data is normalized to 010
dB of top-screen to account for the small amount of gain compression in the upper 10 dB of
display range.
If the HP 70700A digitizer is in the system, the test is run again with the digitizer selected.
HP 11990A Option 300 System Software Package
9-23
Log Fidelity
Uncertainties
The following characteristics contribute to uncertainties:
Measuring receiver tuned RF amplitude (relative) accuracy
DUT marker amplitude resolution
Test Mode
This test is run in Limited Cal mode, and should be run after doing a repair.
In Case of Failure
If this test fails, the following modules may need repair or adjustment:
IF section
9-24
HP 11990A Option 300 System Software Package
Resolution Bandwidth
Resolution Bandwidth
(HP 70902A or HP 70903A)
Tested Specifications
AMPLITUDE ACCURACY: Resolution Bandwidth Switching Uncertainty
FREQUENCY: Resolution Bandwidths: 03 dB: Selectivity (060/03 dB)
Equipment
General source
Measuring receiver
Sensor module
Power splitter (or hybrid cCombiner)
Equipment Setup
Connect the general source to the input of the power splitter. Connect one output connector
of the power splitter to the IF INPUT of the HP 70907A external mixer interface module
(EMIM). To the remaining output connector of the power splitter, connect the sensor module
from the measuring receiver.
Description
This test measures the resolution bandwidth switching variation by taking a reference
amplitude reading in 1 kHz (HP 70902A) or 300 kHz (HP 70903A) resolution bandwidth, then
comparing the IF section resolution-bandwidth amplitude (from 300 Hz to 300 kHz) to this
reference. During this measurement, the video bandwidth is set at 300 Hz (used during the
calibration of the IF section) to eliminate any amplitude shift caused by video bandwidth
switching.
The 3 dB and 60 dB bandwidths are determined by the following algorithm: The resolution
bandwidths are stepped in a 1, 3, 10 sequence from 300 Hz to 300 kHz (HP 70902A) or
100 kHz to 3 MHz (HP 70903A), the general source frequency is adjusted to peak the signal
in each bandwidth, and the marker amplitude is read by taking the mean of the trace points.
The mean is used as a reference amplitude.
The general source amplitude is stepped down 3 dB (or 60 dB) to establish a reference marker
amplitude on the display. The general source amplitude is then returned to the original level
and the frequency is adjusted until the lower 3 dB (or 60 dB) point is found. This procedure
is repeated for the upper 3 dB (or 60 dB) point. The 3 dB (or 60 dB) bandwidth is the
dierence between the upper and lower frequencies. The selectivity (shape factor) is the ratio
of the 60 dB bandwidth divided by the 3 dB bandwidth.
HP 11990A Option 300 System Software Package
9-25
Resolution Bandwidth
Uncertainties
The following characteristics contribute to uncertainties:
DUT marker amplitude resolution
DUT incremental log delity
Measuring receiver tuned RF (relative) accuracy
General source frequency
Test Mode
In Limited Cal mode, only the corrected switching specication, and the 3 dB bandwidth and
shape factor of the 300 kHz, 10 kHz, 3 kHz and 1 kHz bandwidths (HP 70902A) or 300 kHz
and 3 MHz (HP 70903A), are tested.
In Case of Failure
Note
The switching specication is primarily determined by the preceding
Calibrator Amplitude Accuracy test specication. Should the Resolution
Bandwidth test fail, perform the Calibrator Amplitude Accuracy test to verify
that it passes before assuming that the resolution bandwidths are out of
specication.
If this test fails, the following modules may need repair or adjustment:
IF section
9-26
HP 11990A Option 300 System Software Package
IF Gain Accuracy
IF Gain Accuracy
(for HP 70902A or 70903A)
Tested Specification
AMPLITUDE ACCURACY: IF Gain Uncertainty
Equipment
General source
Measuring receiver
Sensor module
Power splitter (or hybrid combiner)
Voltmeter
Equipment Setup
Connect the general source to the input of the power splitter. Connect one output connector
of the power splitter to the IF INPUT of the HP 70907A external mixer interface module
(EMIM). To the remaining output connector of the power splitter, connect the sensor module
from the measuring receiver. Connect the voltmeter to the IF section VIDEO OUTPUT.
Description
This test measures the internal IF step gain of the IF section. The IF step gain is controlled
by the reference level, attenuator setting, and calibration amplitude corrections. The IF
section is set to zero span and the EMIM attenuator is set to 0 dB. The reference level is
adjusted for the highest level that produces an IF gain of 0 dB with an EMIM attenuator
setting of 0 dB. The general source frequency is adjusted to center the signal in the IF
passband. Reference readings are taken using the measuring receiver and the voltmeter. The
reference level and general source amplitude are then decreased in 10 dB increments until
50 dB of IF gain is achieved. The dierences between the measuring receiver readings and the
voltmeter readings is the IF gain variation.
Uncertainties
The following characteristics contribute to uncertainties:
Measuring receiver tuned RF (relative) accuracy
Voltmeter accuracy
DUT incremental log delity
The RSS total of these uncertainties is calculated for each measurement.
HP 11990A Option 300 System Software Package
9-27
IF Gain Accuracy
Test Mode
This test is not run in Limited Cal mode.
In Case of Failure
If this test fails, the following modules may need repair or adjustment:
IF section
9-28
HP 11990A Option 300 System Software Package
Image Response
Image Response
Tested Specification
AMPLITUDE: Spurious Responses: Image Responses
Equipment
General source
Equipment Setup
Connect the general source output to the IF INPUT of the HP 70907A external mixer
interface module (EMIM).
Description
This test measures image responses at osets of two times the 3 MHz and 21.4 MHz IFs.
The DUT is calibrated, if necessary, and a check is made for proper
test-equipment connections. Because measurements are performed in zero span, the sweep
time is set to a minimum value as determined by the autocorrelation theorem. Maximum
on-screen dynamic range is found by adjusting the reference level. Adjustment of the general
source frequency peaks the signal in the selected resolution bandwidth. Adjustment of the
general source amplitude places the signal at the top-line reference level. After the IF has
settled, the test measures the image response amplitude.
Uncertainties
The following characteristics contribute to uncertainties:
DUT resolution bandwidth switching
DUT log delity
The RSS total of these uncertainties is calculated for each measurement.
Test Mode
This test is run in Limited Cal mode.
In Case of Failure
If this test fails, the following modules may need repair or adjustment:
IF section
External mixer interface module
HP 11990A Option 300 System Software Package
9-29
A
Measurement Uncertainty
Introduction
The program combines individual measurement uncertainties to arrive at total uncertainty,
and that establishes a range of ambiguous results and a boundary beyond which results are
denitely unacceptable. Total uncertainty multiplied by a measurement uncertainty coecient
combines with specication limits to determine the test limits, which determine acceptable
system performance. The HP performance tests are shipped with the coecient set to zero
in every test, thus setting test limits at the specication range limits. Figure A-1 illustrates
acceptable performance with a zero coecient. The last section of this appendix tells how to
change the measurement uncertainty coecient on a test-by-test basis.
Figure A-1.
Acceptable Measurement Range
with Measurement Uncertainty
Coefficient Set to Zero
Measurement Uncertainty
A-1
Combining Individual Uncertainties
Individual measurement uncertainties vary with test equipment and measurement techniques.
Either of two methods of combining uncertainties produces a total uncertainties gure:
Worst-Case Sum, or Root Sum of the Squares (RSS).
Worst-Case Sum denes boundaries of total uncertainty without providing a specic estimate.
RSS is an accurate and statistically signicant estimate. Where appropriate, the tests use
RSS.
Worst Case analysis sums absolute magnitudes of individual measurement uncertainties to
produce the largest possible value.
jU1 j + jU2j + jU3 j + ::: + jUn j
RSS uncertainty utilizes the fact that individual uncertainties are independent of each other
and can therefore be combined as random variables.
s U 2
U1 2
U2 2
U3 2
+
+
+ ::: + n
M1
where
A-2
M2
M3
Mn
Ui = uncertainties in the particular measurement (linear)
Mi = expected value of the measurement (in linear)
Measurement Uncertainty
Combining Uncertainty and Specification
Using the instructions in this section, a qualied person can change the measurement
uncertainty coecient on a test-by-test basis.
On Test Disk 1 there is an ASCII le named TEST LIST, which contains a section for every
test applicable to the particular system software package. (Use GET and SAVE to retrieve
and store ASCII les.) Each section has a line labeled FLAGS; in other words, there is a
FLAGS line for every test. The number after the second comma in the FLAGS line is the
measurement uncertainty coecient. To change the coecient, modify this number. A
negative coecient tightens the test limit. The absolute coecient times total measurement
uncertainty tightens or loosens test limits. For example, a coecient of 00.5 tightens the test
limit by the uncertainty times 0.5.
Note
When the System Performance Test program is verifying warranted
performance, the uncertainty coecient must be zero for all tests.
Measurement Uncertainty
A-3
B
Error and Status Messages
Introduction
User interface messages used with HP 70000 Series software products are alphabetized in this
section. The messages are designed to provide information about test results, operator errors,
system conditions, and so on. Refer to your HP BASIC Language Reference for system error
information.
<<<<
The indicated result of the test is outside the test limit.
<**>
The indicated result of the test far exceeds the expected result. Suspect a failure of test
equipment, accessories, or spectrum analyzer.
3478A MULTIMETER requires calibration.
Your HP 3478A is functioning improperly. Either connect a dierent HP 3478A or display
the Equipment Menu and assign a dierent model number.
Aborted
You aborted the test indicated.
Adjust Inst
The system under test needs adjustment or repair to pass the indicated test's specication.
CAUTION: Some Model #'s are not supported. (See Edit Screen).
You have model numbers in the Equipment Menu that are not supported by the software.
Ignore this caution if you are sure that the model numbers listed are correct and that
program memory contains a driver for these models. Otherwise, press EDIT to return
to the edit screen, and correct the model number. A driver that is required but missing
causes the error message ERROR MESSAGE: is a undefined subprogram to appear
on-screen. You can return to the Test Menu by pressing ABORT .
NNNNNNNNNNNNNN
NNNNNNNNNNNNNNNNN
Current zero expired.
The power meter requires rezeroing. Perform the procedure provided on the computer
display.
Disk file is full, no longer duplicating output.
You attempted to store too much data on a disk.
Error and Status Messages
B-1
Equipment list is not acceptable.
You attempted to enter the Test Menu, but the program could not locate all the
instruments for which you have specied HP-IB addresses. Verify that the indicated
equipment is turned on, then return to the Equipment Menu edit screen to verify accuracy
of addresses that are ashing in the Address column.
Equipment list shows no analyzer to test.
The DUT has no assigned HP-IB address. Return to the Equipment Menu and edit the
Address column.
ERROR: Address matches system disk drive.
You entered an HP-IB address matching that of the computer's external disk drive. HP-IB
protocol allows only one instrument per address.
Error: Address not in acceptable range.
You entered an HP-IB address outside the range 700 to 730, inclusive.
ERROR: Non-responding HP-IB address.
You attempted to exit the Equipment Menu after assigning an HP-IB address to an
instrument that is not responding on HP-IB.
ERROR: Search for volume label unsuccessful.
The program tried to nd the disk identied but could not. Either assign a drive to the
disk or insert the required disk into its appropriate drive. Then press REPEAT .
NNNNNNNNNNNNNNNNNNNN
ERROR: Some devices listed as "Available" require serial numbers.
You pressed DONE to go to the Equipment Menu command screen, but some devices have
not been assigned their required serial numbers. Display the Equipment Menu edit screen
and assign the serial numbers.
NNNNNNNNNNNNNN
ERROR: Address is HP-IB controller address.
You entered an HP-IB address matching the computer's address. HP-IB protocol allows
only one instrument per address.
ERROR MESSAGE: Attempt to close file failed.
There is a problem with the data le on the Operating Disk. Correct the problem, then do
one of the following:
Press REPEAT to try again.
Press CREATE to create a new le.
Press ABORT to return to the Main Menu.
NNNNNNNNNNNNNNNNNNNN
NNNNNNNNNNNNNNNNNNNN
NNNNNNNNNNNNNNNNN
ERROR MESSAGE: Attempt to create file failed.
There is a problem with the data le on the Operating Disk. Correct the problem, then do
one of the following:
Press REPEAT to try again.
Press CREATE to create a new le.
Press ABORT to return to the Main Menu.
NNNNNNNNNNNNNNNNNNNN
NNNNNNNNNNNNNNNNNNNN
NNNNNNNNNNNNNNNNN
B-2
Error and Status Messages
ERROR MESSAGE: Attempt to Edit Mass Storage failed.
Your edits to the Mass Storage Menu were not valid. Return to this menu and correct the
errors.
ERROR MESSAGE: Attempt to store Mass Storage failed.
You pressed ABORT after pressing STORE mass storage. The Mass Storage Menu failed.
Press ABORT to return to the Main Menu.
NNNNNNNNNNNNNNNNN
NNNNNNNNNNNNNNNNN
NNNNNNNNNNNNNNNNN
ERROR MESSAGE: Bad instrument address in equipment list. Address matches
controller.
You entered an HP-IB address matching that of the controller. HP-IB protocol allows only
one instrument per address and only one controller per HP-IB system. (The factory preset
controller address is 21.)
ERROR MESSAGE: Calibration data frequency exceed acceptable limits.
Return to the Cal Data edit screen in the Equipment Menu and correct the data entries
that are ashing.
ERROR MESSAGE: Calibration data frequency is less than minimum range of .
The frequency entered next to the device in the Cal Data edit screen is out of the device's
operating range. The return to this screen is automatic. Enter valid frequencies for the
values that are ashing.
ERROR MESSAGE: Calibration data frequency is greater than maximum range of .
The frequency entered next to the device in the Cal Data edit screen is out of the device's
operating range. The return to this screen is automatic. Enter valid frequencies for the
values that are ashing.
ERROR MESSAGE: Calibration data for is blank for some frequencies listed.
Return to the Cal Data edit screen in the Equipment Menu and enter the calibration data
for frequencies indicated with ashing markers.
ERROR MESSAGE: Calibration data for is less than minimum range of .
The factor entered next to the device in the Cal Data edit screen is out of the device's
operating range. The return to this screen is automatic. Enter valid values for the ones
that are ashing.
ERROR MESSAGE: Calibration data for is greater than maximum range of .
The factor entered next to the device in the Cal Data edit screen is out of the device's
operating range. The return to this screen is automatic. Enter valid values for the ones
that are ashing.
ERROR MESSAGE: Calibration data for with serial number is not found on the current
Operating disk.
The data le cannot be found or there is a problem with the data le on the Operating
Disk. If you have stored calibration data on another HP 70000 Software Product
Operating Disk, replace your current Operating Disk with that one and access the data.
Be sure to return the Operating Disk belonging with your system under test to the default
drive. After correcting the problem, either press REPEAT to try again or press PROCEED .
NNNNNNNNNNNNNNNNNNNN
NNNNNNNNNNNNNNNNNNNNNNN
Error and Status Messages
B-3
ERROR MESSAGE: DUT does not have an address.
You attempted to leave the Equipment Menu, but the program cannot verify the DUT at
the specied HP-IB address. First check the address. If the address is correct, cycle the
main power of the system under test.
ERROR MESSAGE: DUT was not at address in the equipment list. DUT was expected at
address .
The DUT is not at the specied address, or HP-IB is at fault, or main power on the DUT
is o. Press ABORT , then return to the Equipment Menu to verify the address.
NNNNNNNNNNNNNNNNN
ERROR MESSAGE: DUT was not found at address in equipment list.
The address specied for the DUT is not valid. Press
Equipment Menu to verify the address.
ABORT ,
NNNNNNNNNNNNNNNNN
then return to the
ERROR MESSAGE: Equipment address matches external disk drive.
You entered an equipment address matching that of the external disk drive. HP-IB
protocol allows only one instrument per address.
ERROR MESSAGE: Equipment Menu data not found on .
The program could not nd the Equipment Menu data le on the Operating Disk.
instructions appear with the on-screen error message. If the data le is
available in a location other than the one currently specied in the Mass Storage Menu,
return to that menu and change the msus and/or the directory path of the Operating
Disk. It may also be that the Operating Disk accessed by the program is not the one
containing the Equipment Menu le. Insert the correct Operating Disk, then press REPEAT
or PROCEED .
Possible Fix
NNNNNNNNNNNNNNNNNNNN
NNNNNNNNNNNNNNNNNNNNNNN
ERROR MESSAGE: Equipment does not have an address.
There is no address assigned to the DUT. Return to the Equipment Menu edit screen and
verify or enter an address in the Address column.
ERROR MESSAGE: ERROR XXX in XXXXX .
An unanticipated occurrence in the program caused a program failure. For clarication,
call your Hewlett-Packard Sales and Service Oce.
ERROR MESSAGE: File not found while assigning I/O path.
You attempted to STORE a list (equipment, mass storage, or parameter) for the rst time
on the current Operating Disk. Possible Fix instructions appear with the on-screen error
message. Follow the on-screen instructions or return to the Mass Storage Menu to change
the location of the Operating Disk.
NNNNNNNNNNNNNNNNN
ERROR MESSAGE: Incorrect disk found. required.
The wrong disk is in the required storage medium. Either correct the fault and press
REPEAT to retry, or select mass storage to return to the Mass Storage Menu. From here
you can indicate a dierent mass storage drive.
NNNNNNNNNNNNNNNNNNNN
B-4
NNNNNNNNNNNNNNNNNNNNNNNNNNNNNNNNNNNNNN
Error and Status Messages
ERROR MESSAGE: is a undefined subprogram.
The program has tried to use a model number that is not supported by the current
software. If an incorrect model number was entered, return to the Equipment Menu and
correct the model number. If the model number is correct, you must load the appropriate
instrument driver before you can continue testing. Press ABORT to return to the Test
Menu command screen.
NNNNNNNNNNNNNNNNN
ERROR MESSAGE: Parameter Menu data not found on .
The program could not nd Parameter Menu data le on the Operating Disk. Possible
Fix instructions appear with the on-screen error message. If the data le is available
in a location other than the one currently specied in the Mass Storage Menu, return
to that menu and change the msus and/or the directory path of the Operating Disk. It
may also be that the Operating Disk accessed by the program is not the one containing
the Parameter Menu data le. Insert the correct Operating Disk, then press REPEAT or
PROCEED .
NNNNNNNNNNNNNNNNNNNN
NNNNNNNNNNNNNNNNNNNNNNN
ERROR MESSAGE: Read data from file failed.
There is a problem with the data le on the Operating Disk. Correct the problem, then
either press REPEAT to try again or ABORT to return to Main Menu.
NNNNNNNNNNNNNNNNNNNN
NNNNNNNNNNNNNNNNN
ERROR MESSAGE: Selected system under test is ; but the software supports the
system.
The RF section module entered in the HP-MSIB map is not currently supported by
software. Either load the correct software or select a dierent RF section module in the
HP-MSIB Map Menu.
ERROR MESSAGE: Sensor model # not supported.
Software does not support the sensor model number entered for the Signal Sensor in
the Equipment Menu. Return to the Equipment Menu and select a sensor with a model
number that is supported. (For a list of supported equipment, refer to Appendix A in the
appropriate system software package.)
ERROR MESSAGE: Parameter Menu data file not found on .
The program could not nd parameter-list data le on the Operating Disk. Possible
Fix instructions appear with the on-screen error message. If the data le is available in
a location other than the one currently specied in the Mass Storage Menu, return to
that menu and change the msus and/or the directory path of the Operating Disk. It may
also be that the Operating Disk being accessed by the program is not the one containing
the parameter-list data le. Insert the correct Operating Disk, then press REPEAT or
PROCEED .
NNNNNNNNNNNNNNNNNNNN
NNNNNNNNNNNNNNNNNNNNNNN
ERROR MESSAGE: The correct Power Sensor has not been detected. Connect the or Abort
the test
The power sensor currently connected to the Measuring Receiver is not the power sensor
required for the current test. Connect the required sensor and press PROCEED , or press
ABORT to return to the Test Menu command screen.
NNNNNNNNNNNNNNNNNNNNNNN
NNNNNNNNNNNNNNNNN
Error and Status Messages
B-5
ERROR MESSAGE: The Operating Disk is write protected.
Make a working copy of the Operating Disk and store the original in a safe place, or
remove the write-protect.
ERROR MESSAGE: Too many Cal Data frequencies were eliminated. There must be at least
two frequencies.
Only one Cal Frequency remains in the Cal Data edit screen. Return to that screen and
enter more frequencies in the Frequency column.
ERROR MESSAGE: was not located.
The program cannot access the listed Volume. If the Volume is correct, press REPEAT
to retry. If the Volume is incorrect, press mass storage to return to the Mass Storage
Menu. From here you can indicate a dierent mass storage medium for the Volume in
question.
NNNNNNNNNNNNNNNNNNNN
NNNNNNNNNNNNNNNNNNNNNNNNNNNNNNNNNNNNNN
ERROR MESSAGE: Write data to file failed.
There is a problem with the data le on the Operating Disk. Correct the problem, then do
one of the following:
Press REPEAT to try again.
Press CREATE to create a new le.
Press ABORT to return to the Main Menu.
NNNNNNNNNNNNNNNNNNNN
NNNNNNNNNNNNNNNNNNNN
NNNNNNNNNNNNNNNNN
ERROR MESSAGE: Wrong device at specified address. DUT was expected at address .
The address specied for the DUT is actually that of a test instrument. Possible
Fix instructions appear with the on-screen error message. If necessary, return to the
Equipment Menu.
Failed
The module under test needs adjustment or repair to pass the test number indicated.
FORMAT ERROR: Observe date format and character position.
You entered the date and time in an unacceptable format. Enter date and time in the
format dd mmm yyyy and hh:mm, then press 4
5.
ENTER
Hdw Broken
Actual test results far exceed the expected results. This is often an indication of a
hardware failure (hardware broken) or incorrect connections.
Initializing the HP-IB system per the Equipment Menu.
The program is attempting to determine if the HP-IB addresses provided in the
Equipment Menu can be found. This message only appears if Verify equipment on
HP-IB: has been selected in the Parameter Menu.
KEYBOARD SYSTEM CRASH WITH KEYBOARD: .
The software program does not support the current keyboard. Install a keyboard having
one of the part numbers listed in the \Computer Hardware Compatibility" section, then
restart the program.
B-6
Error and Status Messages
Logging errors to ERRORLOG failed. Operating Disk is write protected.
The program tried to store error data onto the Operating Disk and could not because of
the write-protect. Make a working copy of the Operating Disk and store the original in a
safe place, or remove the write-protect.
Media not initialized.
You attempted to access a blank disk. Correct the fault, then press 4
.
CONTINUE5
NO CASE FOR THE SENSOR IN THE 8902A DRIVER!
Software does not support the sensor indicated as Signal Sensor in the Equipment Menu.
Return to the Equipment Menu and select a supported sensor.
No disk copy of output found.
You pressed REPRINT in the Main Menu, but the program cannot nd a data le in the
current DATA Volume. If you saved the data, return to the Mass Storage Menu and edit the
location of the DATA Volume.
NNNNNNNNNNNNNNNNNNNNNNN
Passed
The spectrum analyzer meets the tested specications.
PAUSED. PRESS CONTINUE.
You pressed 4
execution.
PAUSE5
on the computer keyboard. Press 4
CONTINUE5
to resume program
PRGM ERROR
The program detected an error within itself. For clarication contact Hewlett-Packard
Signal Analysis Division.
Reading errors from ERRORLOG failed. Check disk at _.
The program tried to read error data from the Operating Disk. Check that the Operating
Disk is installed in the drive specied in the error message.
Return to Equipment Menu to enter serial number for _.
You must return to the Equipment Menu edit screen and enter a SERIAL or ID NO. for the
passive device selected before you can edit the device's calibration data.
Setup Error
The program aborted the test after attempting to verify the test setup. Make sure that all
required test equipment is present, and has been turned on and connected.
Short Pass
The spectrum analyzer meets an abbreviated version of the tested specications. Some
external test equipment, or the spectrum analyzer, has insucient range for a complete
test. (For example, Line-Related Sidebands typically passes with a Short Pass.)
Test can not be done.
Required ETE is missing. Return to the Equipment Menu and enter all ETE listed as
required for the current test.
Error and Status Messages
B-7
Testing dd_mmm_yyyy.
The particular test was last modied on the displayed date.
TEST_LIST is not compatible.
A bad test list exists. Contact Hewlett-Packard Signal Analysis Division for assistance.
The controller does not have sufficient memory. This software cannot load. See
the computer hardware system documentation for information on adding additional
memory.
Either refer to the appropriate manual to extend the memory capability of your system, or
o-load some data to make room for the program.
The at address was not found on HP-IB.
When Yes is selected for Verify equipment on HP-IB: in the Parameter Menu, this error
message displays the ETE with the address that is either missing or not set to ON.
The 436A is in lowest range, waiting 10 seconds.
The current power measurement requires the lowest power-meter range. Program
execution will resume in 10 seconds.
The 8902A needs repair (Error 6).
There is a problem related to the HP 8902A. Correct the fault or return to the Equipment
Menu where you can enter a dierent model number.
The DUT must have an HP-IB address.
You attempted to leave the Equipment Menu, but the program cannot nd the
HP 70000 system at the assigned HP-IB address.
THIS COLUMN CAN NOT BE EDITED.
You pressed SELECT with the cursor positioned in the rst column of the Mass Storage
edit screen or the Equipment Menu edit screen. This column cannot be edited.
NNNNNNNNNNNNNNNNNNNN
This test can not be selected because of missing ETE.
You were in either Multiple Tests or Repeat Multiple, then tried to select a test that has
missing ETE. This is not allowed. Check the Status column of the Test Menu to verify a
Missing ETE tag next to the test name you attempted to select.
Timed Out
The program aborted the test.
WARNING: Duplicate Address
You attempted to exit the Equipment Menu after assigning the same HP-IB address to two
dierent model numbers. HP-IB protocol allows only one instrument per address. It is
acceptable to assign the same address to identical model numbers, implying multiple use of
the same instrument. You may have to scroll through the menu to nd the duplication.
B-8
Error and Status Messages
WARNING: Duplication may exclude specific tests.
You assigned two generic device functions to one ETE. (For example, the TOI test will
not be run if you assign a single HP 3335A as both the required level generator and the
required general source.)
WARNING: String is too long. It has been truncated.
You entered too many characters in a user's line of the Parameter Menu edit screen. Select
the line and enter 30 or fewer characters.
Write protected.
You attempted to store data on a write-protected disk. After correcting the fault, press
4
5.
CONTINUE
Error and Status Messages
B-9
C
Standard Test Equipment
Table C-1 lists adapters and cables. These accessories allow you to interconnect the HP 70000
Modular Measurement System spectrum analyzer and the external test equipment. An
asterisk marks the preferred item in each category.
Table C-2 lists external test equipment supported by HP 11990A Performance Test software.
You will need an instrument from each category to perform the complete set of performance
tests. This list is duplicated in the equipment menu.
Table C-1. Required Accessories
Accessory
Adapters
Type N (f) to BNC (m)
Type N (m) to BNC (f)
APC 3.5 (f) to Type N (m)
BNC (f) to dual banana plug
APC 3.5 (f) to APC 3.5 (f)
Cables
BNC (m) to SMB (m), 122 cm (4 ft)
BNC (m) to BNC (m), 122 cm (4 ft)
Low Loss, SMA (m) to SMA (m), 61 cm (2 ft)
APC 3.5 (m) to APC 3.5 (m), 99 cm (3.25 ft)
* Indicates the recommended accessory.
HP Part Number
or Model Number
1250-0077
1250-0780*
1250-1744
1251-2277
1250-1749, 5061-5311*
85680-60093*
HP 10503A
8120-3124
8120-4921
Standard Test Equipment
C-1
Table C-2. Required External Test Equipment
Category
12 MHz Low-Pass Filter
50 MHz Low-Pass Filter
50 Ohm Terminations
Type N (m)
APC 3.5 (m)
BNC (m)
SMA (m)
Clean Sourcez
Directional Bridge
Directional Coupler#
External Mixer#
Frequency Counter
General Source
Hybrid Combinery,#
Level Generator
MW Power Sensor
MW Spectrum Analyzery,z
HP Part Number or Model Number
See Figure E-1.
See Figure E-2.
HP 908A*
HP 909Dy
HP 11593A
1810-0118
HP 8662A, HP 8663A*
HP 8721A
HP K752C
HP 11970K
HP 5343A*, HP 5342A
HP 8662A, HP 8663A*
Mini-Lab Circuits P/N ZFSC-2-5
HP 3335A
HP 8481A, HP 8485A*, HP 11792A
HP 71210A/C*, HP 8566B, HP 71201A, HP 71201A Option 001,
HP 71200C Option 002, HP 71200C Option 003
HP 8902A
HP 8340A*, HP 8340B, HP 8341A, HP 8341B
HP 436A*, HP 70100A, HP 437A, HP 438A, HP 8902A
Measurement Receiver
Microwave Source
Power Meter
Power Splitter
Type N (f) connectors
HP 11667A
APC 3.5 (f) connectors
HP 11667B*
Printer (Any HP-IB Printer) Graphics/Non-Graphics
RF Power Sensor
HP 8482A*, HP 11722A
#
Sensor Module
HP 11722A
Signal Sensor
HP 11722A
z
Synthesized Source
HP 8340A*, HP 8340B, HP 8341A, HP 8341B, HP 8662A, HP 8663A
Technical Computer
See \Note," below.
Universal Counter
HP 5316A*, HP 5316B
Voltmeter
HP 3445A, HP 3456A*, HP 3478A
* Indicates the recommended model of test equipment.
y Needed only when the system under test contains a tracking generator module, HP 70601A or
HP 70906A.
Note: Refer to the \Software/Hardware Compatibility" section in the HP 11990A Option 001
User Interface Manual .
z Not used when the system under test is a HP 71300A (HP 70907A/B).
# Used for testing the HP 70907A/B only.
C-2
Standard Test Equipment
D
Critical Test Equipment Specifications
Table D-1 lists names and critical specications for external test equipment which the user
may want to substitute.
Table D-1. External Test Equipment Critical Specifications (1 of 3)
Instrument
Critical Specication
Level Generator
Frequency
Range: 200 Hz to 50 MHz
Stability: 61 2 1007 /month
Resolution: 0.01 Hz
Amplitude
Range: +12 to 085 dBm
Resolution: 0.01 dB
Flatness: 200 Hz to 50 MHz, 60.2 dB
Step Attenuator Accuracy
+12 to 026 dBm: 60.025 dB
026 to 046 dBm: 60.03 dB
046 to 085 dBm: 60.09 dB
Harmonics: <040 dBc
Synthesized Source
Frequency
Range*: 10 MHz to 500 MHz
Resolution: 5 Hz at maximum frequency
Stability: 1 2 1009 /day, 2.5 2
0
10 7 /year Amplitude
Range: +10 to 090 dBm
Resolution: 0.1 dB
Spurious Signals: <020 dBc
General Source
Frequency
Range: 500 kHz to 500 MHz
Resolution: 0.1 Hz
Amplitude
Range: +10 to 090 dBm
Resolution: 0.1 dB
Harmonics: <030 dBc
*For complete testing, the source should tune to the maximum upper frequency of the modular
spectrum analyzer under test. To identify the upper frequency limit of the RF section in the system
under test, refer to \Specications" in the system master's Installation and Verication manual.
Critical Test Equipment Specifications
D-1
Table D-1. External Test Equipment Critical Specifications (2 of 3)
Instrument
Critical Specication
Microwave Source
Frequency
Range*: 50 MHz to 26.5 GHz
Resolution: 5 Hz
Amplitude
Range: +10 to 090 dBm
Resolution: 0.1 dB
Spurious Signals: <020 dBc
Clean Source
Frequency
Range*: 10 MHz to 1.2 GHz (2.55 GHz preferred)
Resolution: 1 Hz
Stability: 2.5 2 1007 /year
Amplitude
Range: +10 to 090 dBm
Resolution: 0.1 dB
Spectral Purity
Power Mains Line-Related Sidebands: <083 dBc
Non-Harmonically Related: <083 dBc
Harmonics: <030 dBc
SSB Phase Noise in 1 Hz Bandwidth
Oset from
Carrier
100 Hz
1000 Hz
10 kHz
100 kHz
Phase Noise
<075 dBc
<091 dBc
<096 dBc
<0114 dBc
MW Spectrum Analyzer
Frequency
Range: 10 MHz to 22 GHz
Resolution: 10 Hz
Amplitude
Range: +5 to 0100 dBm
Resolution: 0.1 dB
12 MHz Low-Pass Filter
fc=12 MHz
Nine-element Tchebychev, 0.1 dB ripple
Rejection at 18 MHz: >45 dB
50 MHz Low-Pass Filter
fc=52 MHz
Nine-element Tchebychev, 0.1 dB ripple
Rejection at 80 MHz: >55 dB
* For complete testing, the source should tune to the maximum upper frequency of the modular
spectrum analyzer under test. To identify the upper frequency limit of the RF section in the system
under test, refer to \Specications" in the system master's Installation and Verication Manual.
D-2
Critical Test Equipment Specifications
Table D-1. External Test Equipment Critical Specifications (3 of 3)
Instrument
Critical Specication
Directional Bridge
Frequency Range: 100 kHz to 100 MHz
Directivity: >40 dB from 1 to 100 MHz
Coupling: 6 dB
Transmission: 6 dB
Power Splitter
Frequency Range: 50 MHz to 26.5 GHz
(or front-end highest frequency)
Output Tracking: 0.25 dB
Equivalent Output VSWR: 1.35
RF Power Sensor
VSWR: <1.3
Frequency Range:
100 kHz to 2.9 GHz
MW Power Sensor
VSWR: <1.3
Frequency Range:
50 MHz to 26.5 GHz
Critical Test Equipment Specifications
D-3
E
Specialized Test Equipment
This appendix provides the schematics and part descriptions for two lters required in some
performance test setups.
Reference
Designator
C1
C2
C3
C4
C5
HP Part CD Qty
Description
Number
0160-5491 7
1 CAPACITOR-FXD 240PF CER
0160-5439 5
1 CAPACITOR-FXD 510PF CER
0160-4825 5
1 CAPACITOR-FXD 560PF CER
0160-5439 5
1 CAPACITOR-FXD 510PF CER
0160-5491 7
1 CAPACITOR-FXD 240PF CER
L1
9100-3551
L2
9140-0264
L3
9140-0264
L4
9100-3551
Note: Capacitors must
5
2 COIL-MLD 1 UH
5
2 COIL-MLD 1.2 UH
5
COIL-MLD 1.2 UH
5
COIL-MLD 1 UH
be ceramic. Small-body inductors must not be used.
Figure E-1. 12 MHz Low-Pass Filter, Schematic Diagram and Parts List
Specialized Test Equipment
E-1
Reference
Designator
C1
C2
C3
C4
C5
C6
C7
C8
C9
C10
HP Part CD
Description
Number
0160-4803 9 CAPACITOR-FXD 68PF
0160-4804 0 CAPACITOR-FXD 56PF
0160-4800 6 CAPACITOR-FXD 120PF
0160-4790 3 CAPACITOR-FXD 12PF
0160-4800 6 CAPACITOR-FXD 120PF
0160-4788
0160-4800
0160-4790
0160-4803
0160-4804
9
6
3
9
0
CAPACITOR-FXD
CAPACITOR-FXD
CAPACITOR-FXD
CAPACITOR-FXD
CAPACITOR-FXD
18PF
120PF
12PF
68PF
56PF
L1
9100-3911 1 COIL-MLD 220NH
L2
9140-0450 1 COIL-MLD 270NH
L3
9140-0450 1 COIL-MLD 270NH
L4
9100-3911 1 COIL-MLD 220NH
Note: Capacitors must be ceramic. Small-body inductors must not be used.
Parallel capacitors are used to achieve the correct capacitance.
Figure E-2. 50 MHz Low-Pass Filter, Schematic and Parts List
E-2
Specialized Test Equipment